DOI:10.32604/iasc.2021.014911
| Intelligent Automation & Soft Computing DOI:10.32604/iasc.2021.014911 | |
| Article |
Realization of IoT Integration System of LED Based on Particle Swarm Optimization
1Department of Information Technology, Takming University of Science and Technology, Taipei, 11451, Taiwan
2Department of Electrical Engineering, National Chin-Yi University of Technology, Taichung, 41170, Taiwan
*Corresponding Author: Wen-Tsai Sung. Email: songchen@ncut.edu.tw
Received: 26 October 2020; Accepted: 19 December 2020
Abstract: The purpose of this research is to design an intelligent LED lighting control system with wireless remote control. Since the designed system is mainly based on Android applications, it controls wireless lighting modules through a sever by means of a smartphone, tablet computer, or another handheld mobile device, and the values displayed on the handheld device are used to monitor the establishment and design of the electricity state and multiple-LED light control scenarios in real time. The server is connected with a touch human-machine interface, digital meter, wireless lighting controller, infrared learning module, and other devices through RS-232 and RS-485 serial communication ports, and the controller and receiver of the wireless lighting module use ZigBee as a communication protocol. The touch human-machine interface can read the measured value from the server and receive user input commands to control the wireless light control module and infrared learning module. Through the Wi-Fi, the user can operate the proposed system by using a handheld mobile device. This paper also analyzes the measured data using the particle swarm optimization (PSO) algorithm, analyzing the electricity consumption based on the concepts of PSO speed and location updating and judging how to save electricity when using a light source in order to establish an intelligent LED lighting control system, facilitate mastering of electricity consumption, and realize control of other related electronic equipment during the operation process. The proposed intelligent LED lighting control system can be used in integrating applications of digital life and green energy saving.
Keywords: Particle Swarm Optimization; LED; infrared; internet of things; sensor; ZigBee
Due to the rapid development of the digital household appliance industry in recent years, information operators have been continuously launching new products and focusing on how to connect all types of household appliances to form a digital environment in order to further improve the convenience of life and provide people with a more comfortable living environment.
Slow and complex life patterns cannot meet the current needs of contemporary high-tech society, so problems must be solved quickly and smoothly to ensure that a typical citizen can pursue a simplified and convenient life. In order to address this challenge, this paper starts from the most basic aspect of home life, i.e., the use and control of household appliances. Namely, when users can conveniently control and monitor household appliances, they can save time, realize remote operations, and know their electricity consumption at any time, which makes their lives more convenient and easier. Thus far, the digital home concept has been applied to the central control systems, security monitoring, health care, home environments, information household appliances, and environmental protection and energy saving, and it is expected that future household appliance control systems will be generated in a way that facilitates daily life further [1].
At present, the proposed system structure mainly consists of a small industrial computer, which is used as a server, and system control is realized through the server. The server program is developed using Microsoft Visual C# 2015 to perform receiving, output, reading, and other actions, and the controlled equipment complies with its respective communication modes, such as ZigBee, infrared, and other designed functions. It should be noted that intelligent mobile devices must be in the same domain as the server; namely, they should use the same Wi-Fi service in order to act through the server. In this paper, particle swarm optimization (PSO) is used to analyze the measured data, and the concept of PSO speed updating and position updating is adopted. Based on the concept of a digital home, this research conducts control of household appliances and masters the situation of electricity utilization.
Liu proposed the optimization analysis of the wireless sensor network (WSN) location process based on a hybrid PSO algorithm [2]. Elhabyan and Yagoub proposed using the PSO algorithm to calculate the energy efficiency of the WSN [3]. In 2018, Parwekar et al. [4] conducted the analysis of PSO and SGO using the wireless sensor network architecture. Cong proposed a WSN coverage algorithm based on an improved PSO in 2015 [5,6]. In 2018, Jiang [7] proposed using an ant colony algorithm (AC) and PSO to optimize the LEACH protocol, which is most commonly used in WSN routing protocols to reduce the energy consumption of WSN data transmission and optimize data transmission routing. Praveena et al. [8] compared the PSO and genetic algorithms in the WSN in 2017. Kong et al. [9] proposed a wireless sensor network coverage improvement method based on the enhanced PSO algorithm in 2019. Han et al. [10] achieved a numerical improvement in bicycle mechanical performance using the intelligent PSO-ABC algorithm and WSN technology in 2018.
2.1 Discussion of Research on LED
LED is a type of light-emitting diode with the same unidirectional conductive characteristic as the general diode, which can emit light in a forward direction, conducting and converting electric energy to a visible field using a solid semiconductor, and it has been widely used in photoelectric systems. LED has many advantages, such as energy saving, long service life, low energy consumption, less heat generation, high brightness, easy light adjustments, and easy maintenance. In its early years, LED was applied to indicator lights, display screens of calculators, and digital watches, while in more modern times, it has been applied to in the field of brightness. LED performs light emission in two or more layers simultaneously to emit and mix white light. In recent years, with the constant progress in science and technology, the luminous efficiency of white LED has gradually evolved to the efficiency of the fluorescent lamp [11].
The production of the three primary colors (RGB) by LED improves the performances of both white and colorful LED displays. Red, green, and blue (RGB) LEDs produce different colors of light by packaging red, green, and blue chips together. The mixed light emitted from an RGB LED was unstable in the past, but research has shown that a high-power LED driver can solve this problem. With the continuous progress in the manufacturing technology of LED, as well as the development and application of new elements, the performance of white LED has steadily been improving and extending into the highly efficient light source market. In terms of lighting with all colors and luster, people need more white light sources in daily life. White LED has replaced the current high-consumption incandescent lamps and has been conquering the lighting market step by step, thus saving a large amount of electricity. White LED is one of the most promising LED products, and the development of white LED in the lighting market is highly anticipated. Compared with incandescent and fluorescent lamps, white LED has many advantages, such as small volume, a variety of combinations, low heating, over 10,000 hours of service life, shock resistance, impact resistance, difficulty of breakage, recyclability, being pollution-free, and many other environmentally friendly characteristics, as well as low voltage and low-current starting, which helps them achieve low power consumption, so they can be developed into lightweight products. Moreover, as LED does not have the shortcomings of either high-power consumption or fragility, like incandescent lamps, or the shortcoming of waste containing mercury, like fluorescent lamps, white LED has become the preferable product in the industry, and it can be expected that LED will replace traditional lighting appliances in the future. A comparison of white LEDs and the current lighting equipment is shown in Tab. 1.
Table 1: Comparison of white light LED and the current lighting devices

However, LED is still in the development stage and requires further improvements in service life. The application scope of white LEDs is further extended with every increase in its brightness and power. Thus far, white LED has been widely used in landscape lighting, interior lighting of vehicles, and LCD backlights, but future applications of white LED will be much broader, including flashlights, decorative lighting, and projection lighting; thus, white LED will gradually spread to all types of lighting fixtures for general use. Building decoration lighting and home lighting requires LED drivers that can convert alternating current directly into the constant direct current source, so a single integrated circuit cannot be provided at present, and mostly module circuits are used. LED drivers can be divided according to the driving mode into constant-current LED drivers and voltage-stabilization LED drivers. The constant-current LED drivers can be divided into two types, one with DC input and DC output (DC/DC) and another with AC input and DC output (AC/DC). A performance comparison of the two types of LED constant current drivers is presented in Tab. 2.
Table 2: Performance comparison of two types of LED constant current drivers

The constant-current driver is applicable to the solar energy LED lights, automobile LED lights, and electric bicycle LED lights. The constant-current driver shall have the following characteristics:
a. The output current of a constant-current drive circuit is constant, whereas the voltage of the direct current output varies within a certain range according to the load. The smaller the load value, the lower the output voltage will be, and vice versa.
b. The load shortage is not a problem for a constant-current driver, and the load is forbidden to present the open-circuit state.
c. The maximum load current and voltage values of a constant-current driver are limited by the number of used LEDs.
d. Since the LED driver of a constant-current drive circuit is stability, its price is relatively high.
LED drivers can be roughly classified into step-down mode with resistance capacitance, resistance step-down mode, step-down mode with conventional transformer, step-down mode with electronic transformer, and pulse width modulation (PWM) control mode, which are determined according to the circuit structure. The PWM circuit mainly consists of four parts: the input rectification filter part, output rectification filter part, PW voltage stability control part, and energy conversion of the switch. The PWM is a technology that uses the digital signal output of a microprocessor to control the simulation circuit. The basic principle of PWM switch voltage stabilization is to realize dead loop feedback using a difference value between the controlled and reference signals according to changes in the input voltage, internal parameters, and external load in order to control the circuit, adjust the switch of the main circuit, and conduct pulse width, which allows the output voltage or the current switch power to achieve a steady state. The efficiency of this power supply is extremely high and generally can reach 80%–90%, and the output voltage and current are very stable. Generally, this type of circuit has perfect protection measures and thus belongs to a power supply with high reliability [12]. Since LED is a non-linear device, small changes in the forward voltage will cause a large change in the forward current; thus, LED needs a constant current drive. The non-linear characteristic of LED is presented in Fig. 1.

Figure 1: Non-linear characteristic of LED
The LED light source consists of an LED with a small power or a serial connection of LEDs with large power, and the structure is selected according to the design requirements of the lights. First, high AC voltage shall be converted to low AC voltage for the LED light driver, and then low AC voltage shall be converted to low DC voltage through rectification (AC/DC conversion), which is then converted to a constant current source through the step-down of DC-to-DC voltage stabilizer, and finally, a constant current is output to drive the LED light source [2]. The driving principle of LED lights is shown in Fig. 2.

Figure 2: The driving principle of LED lights
In recent years, the driver power supply has become the main concern of manufacturers due to the rapid development of LEDs. Although the service life of LED covers 100,000 hours in theory, LEDs are easily damaged during usage due to the improper design of driver power and driving mode. As an LED driver can connect multiple LEDs in serial connection, parallel connections or mixed serial and parallel connections can be required according to the design.
2.2 ZigBee Communication Technology
ZigBee is a type of wireless communication technology created by IEEE 802.15.4 and ZigBee Alliance. The IEEE 802.15.4 standard [3] is based on a low transmission rate, and the physical layer (PHY) and media access control layer (MAC) are located in the bottom layer of the ZigBee open structure standard. The formulation of the specifications of the two layers is conducted according to the IEEE 802.15.4 standard, and the ZigBee standard is applied to the layers higher than the PHY and MAC, including the network layer, security layer, and application layer [4]. Due to the low transfer rate and short-distance transmission, ZigBee can provide the data transmission rate lower than 1 Mbps, and the typical wireless transmission distance of ZigBee is about 10 m to 100 m. The advantages of ZigBee compared to the other wireless technologies are low price and low power consumption [5,6]. The ZigBee network can be divided into three parts, ZigBee coordinator, ZigBee Router, and ZigBee terminal equipment, and all parts provide different functions and role positioning. The topological structure types of a ZigBee network are displayed in Fig. 3.

Figure 3: Topological structure types of a ZigBee network
In Fig. 3, the khaki ZC nodes represent the ZigBee coordinators, the green ZR nodes represent ZigBee routers, and the blue nodes represent end devices. In Fig. 3a, there are one ZC node, three ZR nodes, and six end-device nodes. The topology presented in Fig. 3b contains one ZC node and five end-device nodes. Lastly, the topology in Fig. 3c contains one ZC node, four ZR nodes, and five end-device nodes. A ZigBee network can have only one coordinator node and many router and end-device nodes.
2.3 Particle Swarm Optimization
The PSO was proposed by Eberhart and Kennedy in 1995 [13,14], and it represents a random search algorithm developed by the simulation of the foraging behavior of a flock of birds. The PSO algorithm regards a particle swarm as a flock of birds in flight, where each particle represents a bird, and each particle gains its adaptive values through the target fitness function. The best solution is searched according to the flight velocity and flight direction of each bird, while the initial velocity and initial position of the bird flock are established by the random initialization method, whereas the best individual adaptive value is gained according to its own velocity and direction. Each particle has a memory, and the flight velocity and direction are continuously updated and revised through their own experience, and the best solution denoted as Pbest is obtained. The experience of each peer in the bird flock is compared, and the best evaluated Pbest is regarded as the best solution of the domain and is denoted as Gbest; Gbest represents the best PSO solution [15]. The solving process can be divided into six steps. Step 1 initializes the particle swarm size, defines the number of particle swarms and parameter conditions, and sets the velocity and position of each particle in the swarm in a random manner. Step 2 brings the particle swarm into the fitness function to be solved, which evaluates the adaptive value of each particle and calculates the adaptive values. Step 3 generates the new adaptive value and compares it with Pbest; if the new adaptive value is better than Pbest, the original Pbest is replaced with the new adaptive value and Pbest is updated. Step 4 assesses Gbest and Pbest; if Pbest is better, the original Gbest is replaced with Pbest, and Gbest is updated. Step 5 updates the velocity and position of a particle using Eqs. (1) and (2), respectively. Step 6 determines whether the final conditions are met; if the final conditions are not met, repeat Steps 2–5 until the final conditions are satisfied.


In Eqs. (1) and (2), the number of particles in the swarm is n, so i = 1, 2, 3 …, n;  denotes the number of iterations of particles;
  denotes the velocity in the
  th iteration of the ith particle;
  denotes the updating velocity in the
  + 1 iteration of the ith particle;
  denotes the inertia weight value added to the velocity updating formula;
  and
and  denote the learning constants in the velocity updating formula, and they are between 0 and 4;
  denotes a random number in the range from 0 to 1;
  represents the best solution Pbest of the individual of particle swarm;
  represents the best solution Gbest of the full domain of the particle swarm;
  represents the current position in the
  th iteration of the ith particle; lastly,
  represents the updated position in the
  + 1th iteration of the ith particle [16,17]. The flowchart of the PSO optimization process is presented in Fig. 4.
The PSO has a distributed search function, which is suitable to search for data in a continuous space [16]. The PSO algorithm can be used to analyze and calculate enormous sensory data and quickly obtain the solution to the optimization problem, so this paper uses the PSO algorithm to analyze and calculate the measured data.
The proposed system uses XP-8000 as a server to perform receiving, output, reading, and other actions. The XP-8000 is connected to the human-machine interface, digital meter, infrared learning module, light control wireless transmitter, and other devices via RS-232 and RS-485 serial communication, which is used as the connection mode to realize digital home system. The infrared module is connected to XP-8000 through RS-232, the digital meter is connected to XP-8000 through RS-485, and XP-8000 can read the numerical values of measured voltage and current obtained by the meter. The lamp control wireless transmitter is connected to XP-8000 through RS-232, which can control the lamp control module after receiving the output instructions from XP-8000. The Wi-Fi base station is connected to XP-8000 through the network cable, and a mobile phone can send commands to the XP-8000 through Wi-Fi to control infrared and light controls as well as read electric meter values. The proposed system structure is shown in Fig. 5.

Figure 4: The flowchart of the PSO optimization process

Figure 5: The proposed system structure diagram
The control of the touch human-machine interface is the opposite; namely, it sends control commands by directly connecting to the server in order to control the controlled equipment, and then, the number status of the controlled equipment in the shared memory is changed. As a digital meter can only send back measured data to the server, a mobile phone, tablet, or touch human-machine interface can receive the data of the electric meter through the shared memory. The software architecture diagram of the proposed system is displayed in Fig. 6, and the control interface of touch pad is shown in Fig. 7.

Figure 6: Software structure diagram
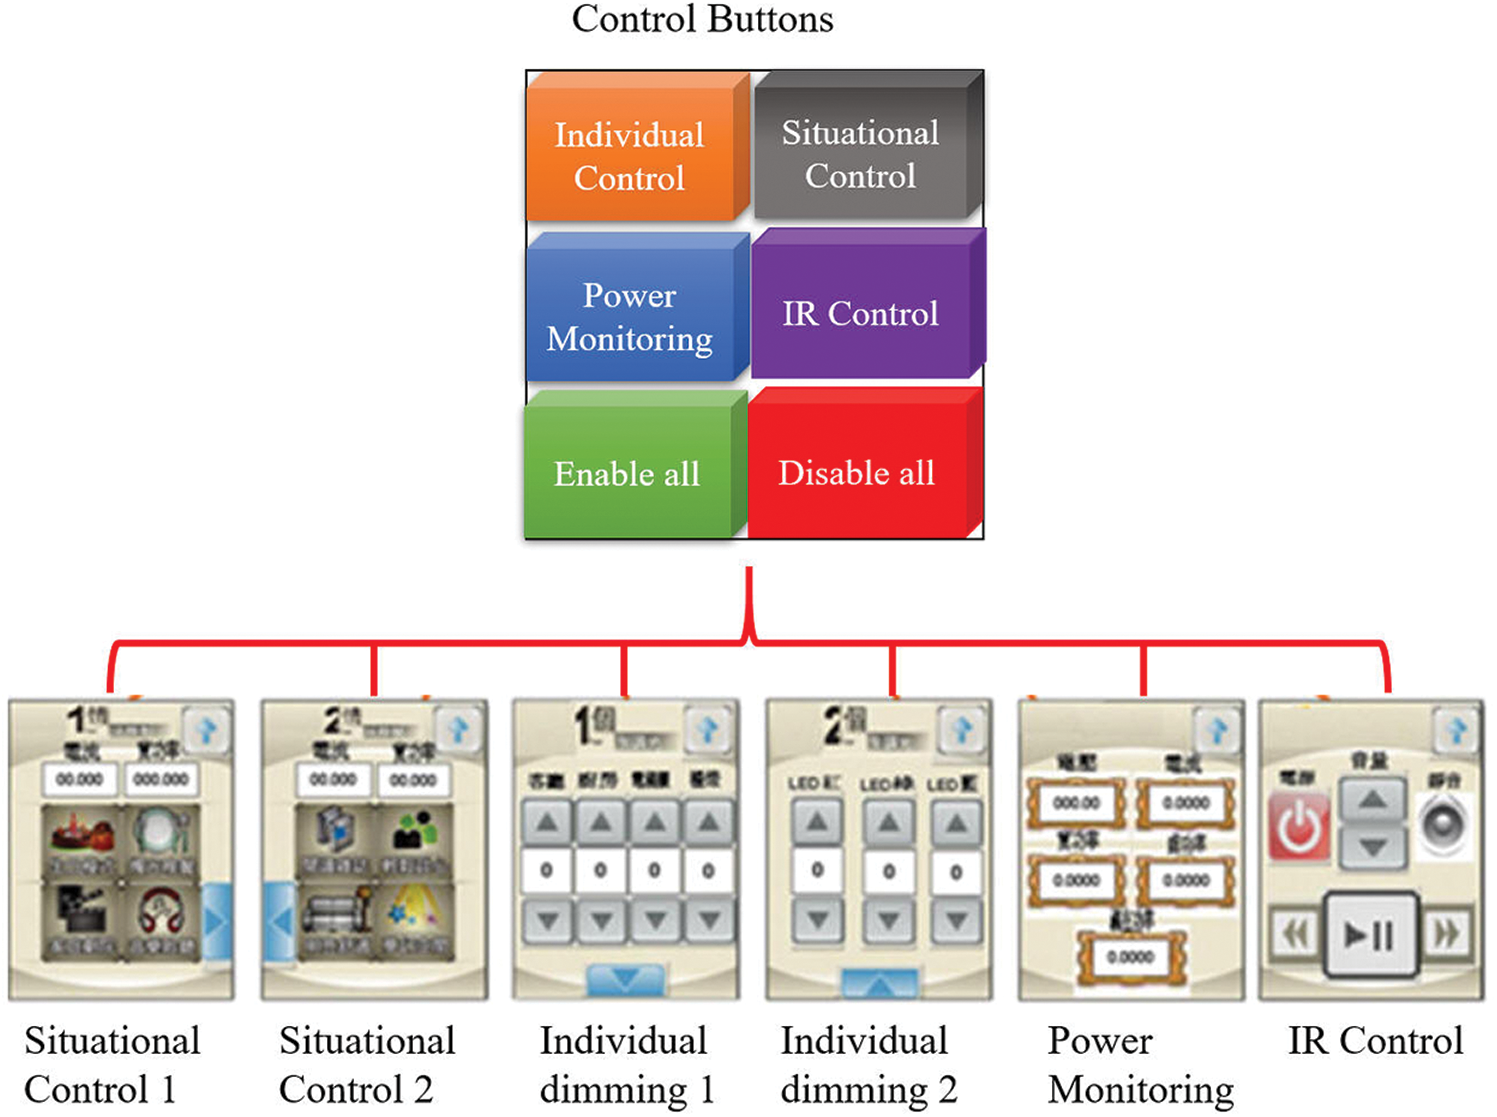
Figure 7: Control interface of a touch pad
3.1 Touch Pad Software Development
The touch pad uses HMIWorks as development software, which provides two methods for the development of programs, the standard C language and a ladder diagram. The touch pad control interface of the proposed system is presented in Fig. 7.
3.2 eLogger Data Acquisition Software
The eLogger is data acquisition software that can be used to plan the human-machine interface of Windows CE.NET 5.0 based on PACs (WinPAC, ViewPAC) as well as Windows CE.NET 6.0 based on PACs (XP-8000 Series) in order to quickly and simply set up the I/O monitoring and control system. Meanwhile, it also has the function of supporting logic control, and ISaGRAF or VS.Net can be selected to collaborate with eLogger to develop the logic control program through the functions of shared memory. The edited program can be used to control the I/O module and other temporary data through shared memory.
The eLogger can compile the memory addresses of various functions within the device to facilitate users’ reading and transmission, and in collocation with the program, it can be used for system design through shared memory, which is very convenient for the compilation of programs. The eLogger network read function is presented in Fig. 8.
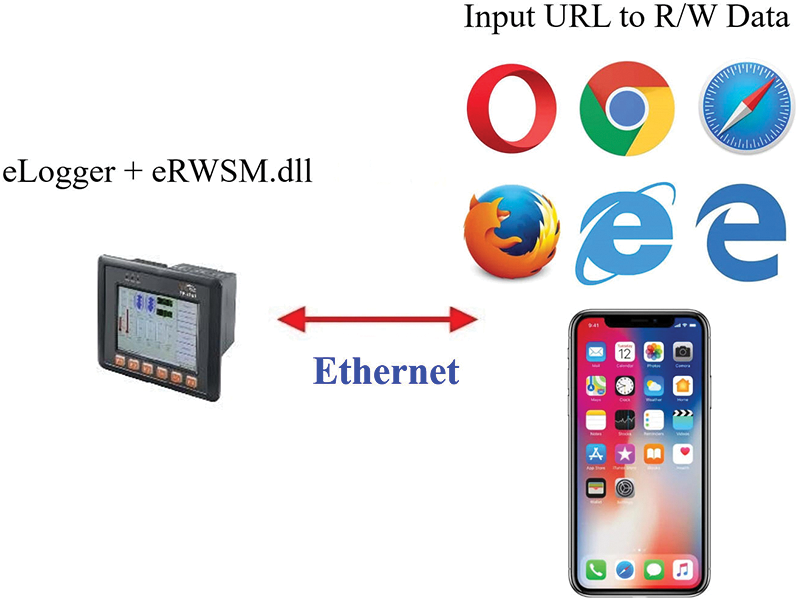
Figure 8: Network reading function of eLogger
The input format of the URL is “http://IP address/eRWSM.dll?.” The definition of the parameter is shown in Fig. 9, where the system network read function command is displayed.

Figure 9: Reading function command of the network
The eRWSM.dll provides six parameter methods to read and write values from the shared memory. The address format of reading and writing shall include five digits (if you want to read and write the 10th address, it is needed to fill in 00010; the others are completed in a similar manner), and the erasable address range is 00000–99999; the erasable value is an integer (–3276–32767), and it shall be noted that there are restrictions of case sensitivity for parameters as follows:
(a) readAI = xxxxx read the data from the input register xxxxx address.
(b) readAO = xxxxx read the data from the holding register xxxxx address.
(c) readDI = xxxxx read the data from the input status xxxxx address.
(d) readDO = xxxxx read the data from the coil status xxxxx address.
(e) writeAO = xxxxx&data = value write value on the xxxxx address in the holding register.
(f) writeDO = xxxxx&data = value write value on the xxxxx address in the coil status.
For instance, read the value of the zero address of eLogger shared memory-AI. An example of the system network read function is shown in Fig. 10.

Figure 10: Example of the network reading function
The interface display of an electric meter on a smartphone is presented in Fig. 11, where the external opening type CT of the electric meter is hooked up to the wiring of household appliances to measure the voltage, current, average power, reactive power, and apparent power of household appliances.

Figure 11: Interface of an electric meter on a smartphone
Smartphones can be used to read the measured information of an electric meter directly through Wi-Fi, and the electricity consumption situation can be monitored at home through the human-computer interface connected to the server, as shown in Fig. 12. The touch human-machine interface can be placed on a porch, on a wall, in the room, or any place convenient for user operations, in order to realize the concept of a convenient smart home.

Figure 12: Touch human-machine interface display of an electric meter
In addition, the information on the current electricity consumption can be obtained through the interface on the external screen beside the server, as shown in Fig. 13. The maximum values of power, voltage, and electric current, measured by the electric meter, can also be set. Namely, when the maximum value, namely the safety range, is exceeded, that can cause unsafe use of electricity and break the circuit, so the lights will be turned off, thus achieving the benefits of electrical safety and energy saving and creating an intelligent light control system for both crisis prevention and energy saving. As for the daily electricity consumption, the proposed system uses a database to store information about electricity consumption to help users search for daily electricity consumption information for a certain period.

Figure 13: Monitoring interface of a server
Situation control is switching and controlling lighting lamps in each area through a dimming module, control panel, and other equipment. Situation setting in intelligent lighting is preset according to the usage requirements and other factors, meaning lighting equipment can be controlled separately or in a group, where each device can be set with a different degree of brightness and stored as a scene situation, which can be seen as one lighting display of a room or area. Once the situation design is completed, it can be started easily through the control panel or a remote controller on a wall or started automatically through a timer, light sensor, or according to the sensor of the active area. Although the situation control can provide a variety of lighting effects and create visual aesthetic feelings, its deficiency is that editing is required for modification of situations [18]. The usage diagram of the touch human-machine interface to control the lighting situation is presented in Fig. 14. The electric quantity and power of each situation measured by a digital meter are presented in Fig. 15. After analysis of the experimental data, the situation where more light tubes and stronger brightness were used consumed relatively more power. Through the collocation of the lighting control system and digital meter, the electricity information on each situation can be known, which is very convenient for monitoring electricity consumption [19].

Figure 14: Situation display of the touch human-machine interface

Figure 15: Situation experiment data
In order to demonstrate the possibility and advantage of using a smartphone to control home lighting situation, the control system for lighting situation was set in a show house with two floors, where the change in lighting situations of the first floor was different from that of the second floor, which could be realized through the situation selection interface on the smartphone, as shown in Fig. 16. In order to present the sense of reality when using a light situation control system in actual rooms, it should be noted that if the proposed light control system was installed in an actual home, situation changes would not be restricted to the environments of the first and second floors. Namely, the proposed system can operate anywhere the lighting control module is placed, such as the living room, kitchen, or bedroom. Also, the convenience of home lighting can be controlled with a mobile phone [20]. The internal structure of a smart house 1 is presented in Fig. 17.

Figure 16: The image of a smart house

Figure 17: The internal structure of a smart house
In order to make intelligent lighting situation control meet the daily needs of people, this work carried out timely individual control of lights and situation control and automatically changed the desired situations according to the specified times. For instance, preset situations can be presented in accordance with daily time periods, where the use of lamplight is reduced as the sun moves sideways inside the room in the morning, while the brightness of lights is adjusted to be brighter at night. Moreover, light changes can be implemented in each room; for instance, the brightness needed in a living room, kitchen, and bedroom is different during different time periods. In addition to light changes with the time of the day, the proposed control system can comply with weekly or special holidays, such as birthdays and Christmas, and intelligent lighting control situations may be used on a specific day to present beautiful effects that comply with the current atmosphere [21–23].
4.3 Individual Dimming of RGB LED
Based on the experimental data of the adjustable fluorescent tube, the RGB adjustable LED lights were made to display a single color, namely, red, green, and blue mixtures. Since the power comparison results under the same brightness were quite close, the following part presents the situation of simultaneously turning on red and green lights, as well as the situation of turning on red, green, and blue lights, as the similarities in the power of only displaying red and green, and red and blue, and green and blue were quite close. The RGB individual dimming of the proposed system is presented in Fig. 18, and the LED red light experimental data [24–26] are presented in Tab. 3.
Table 3: The LED red light experimental data


Figure 18: RGB individual dimming
4.4 Infrared Control of Household Appliances
The Fig. 19 shows the control interface on a smartphone for home television, where a smartphone, which is owned by nearly everyone, can be used to control all the infrared household appliances, thus mitigating the inconvenience of searching for a particular remote control for each kind of infrared household appliance [27,28]. The actual control diagram of controlling the television is presented in Fig. 20.
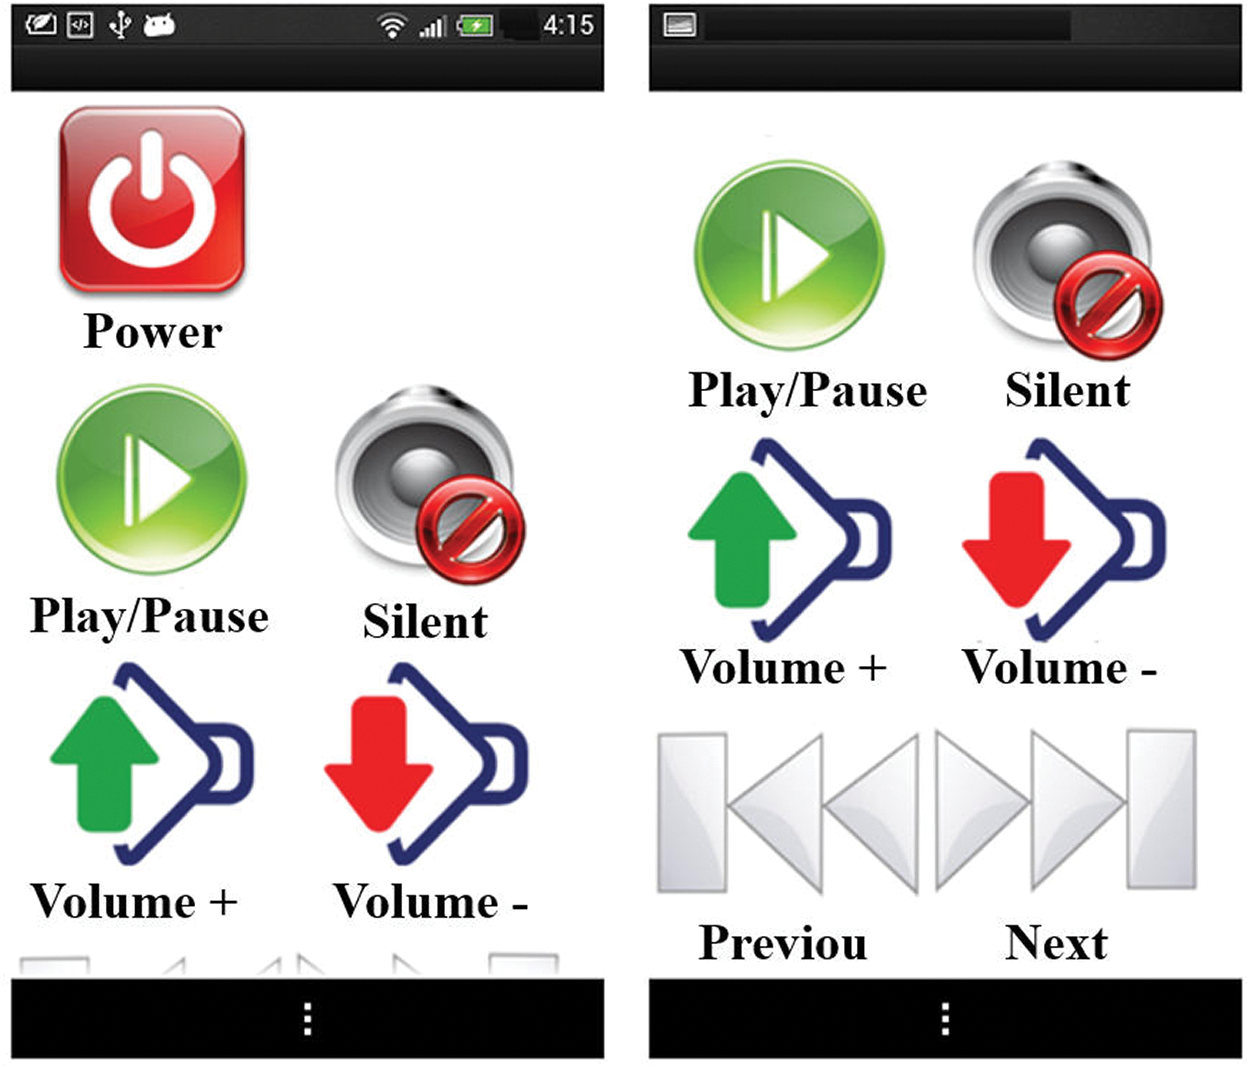
Figure 19: Infrared interface of a smartphone

Figure 20: Actual control diagram of television
This research analyzes the measured electric data and distinguishes the impact of electricity consumption situations on electricity price, where the measured electricity data in one day are recorded every 10 s, so 8640 data samples were collected in one day, of which 300 were extracted for analysis after average calculation. The PSO and MATLAB were used for calculation in order to simulate general household power consumption. The proposed LED control system adjusted lights individually, which was conducive to different light changes every 30 minutes. The experiment divided electricity consumption into four levels for judgment, 13.2 units, 28.8 units, 43.2 units, and 72 units, which represented the units of electricity used within one month, where the unit of used electricity was expressed as (Consumed electric power [W] × hours of use [h])/1000; thus, the electricity unit was different in different periods depending on many factors, including summer months, non-summer months, usage time, business use, non-business use, and other factors. First, electricity consumption in one month was calculated by MATLAB using 300 records power data samples in sequence, which were obtained from the measured data, and then the classification was carried out based on the previously set electricity consumption levels. The 300 records calculated values of electricity consumption (calculated by MATLAB) were regarded as particles; 300 records samples were obtained to conform to the preset target using the method of electricity consumption level, and then each data sample was compared with the electricity consumption by the PSO formula to obtain the best individual solution and the best domain solution [29,30]. Next, the PSO simulation was performed using MATLAB, where the best solution was determined based on the preset target, and the closest electricity consumption was regarded as the best domain solution. A target search was carried out, and 300 records samples were obtained from the average calculations of every 50 records. In this study, the PSO algorithm was used to search for monitoring time sections. It was found that the data that conformed best to Situation 1 was the 175th record after simulation calculation; the data that conformed best to Situation 2 was the 129th record; the data that conformed best to Situation 3 was the 23rd record; the data that conformed best to Situation 4 was the 201st record. The results closest to each situation were analyzed, which limited the error to ±3 degrees, and then 300 time points (300 records) of various situations were used after analysis, as shown in Figs. 21 and 22. The results shown in Figs. 21 and 22 represent the electricity consumptions closest to the preset targets, which were obtained in one-month control of lighting situations with a wide variety of illuminations. Based on the obtained results, if lighting situations with such illumination are often used, the desired electricity consumption will be obtained after one month. For instance, if the lighting situations with weak illumination in Fig. 21 are often used, the electricity consumption in the lighting situations will be controlled in the range of (13.2 ± 3) units after one month, which allows further control of electric charges [31]. The error result of middle illumination degree is presented in Fig. 22.

Figure 21: Error result of weak illumination degree

Figure 22: Error result of middle illumination degree
This paper presents a LED lighting control system. The proposed system is verified by experimental analysis, and the results show that it can be applied to many situations besides its use at home, meaning it can be used in a building with a variety of artistic effects, thus, making it more vivid. For instance, an exhibition hall can show different lighting situations in coordination with a variety of artworks, and the infrared learning module can control a projector, curtains, and other infrared equipment in the venue. Moreover, it can help create appropriate lighting situations for karaoke to according to the songs. It can also be used in industrial applications, such as warning lights in a factory, to present different colors according to different situations to represent danger or equipment failure. The corresponding settings can be adopted according to different times and usages to enrich artistic effects, improve work environments, and enhance work efficiency. An intelligent lighting control system can effectively solve the stroboscopic phenomenon, which can make a person giddy and cause fatigue for the eyes. The proposed intelligent lighting control system has a good energy-saving effect, as it can use a preset control mode to accurately set illumination at different times and under different environments and also conduct reasonable energy management to achieve energy saving. Lights can be lit to the required illumination when necessary in order to ensure the appropriate amount of illumination with the lowest possible amount of energy. In addition, this system can extend the service life of a light source, as it can successfully suppress the voltage and set voltage limits, and conduct filtering and other functions, thus avoiding the damage to the light source caused by overvoltage or undervoltage. Regardless of the light source type, a thermal radiation light source or a gas discharge light source, voltage fluctuation is the main cause of damage to lamps. Therefore, since the proposed system can effectively suppress voltage fluctuations, it can extend the service life of a light source to a certain extent.
Acknowledgement: This research was supported by the Department of Electrical Engineering at National Chin-Yi University of Technology. The authors would like to thank the National Chin-Yi University of Technology, Takming University of Science and Technology, Taiwan, for supporting this research. We thank LetPub (www.letpub.com) for its linguistic assistance during the preparation of this manuscript.
Funding Statement: The author(s) received no specific funding for this study.
Conflicts of Interest: The authors declare that they have no conflicts of interest to report regarding the present study.
1. W. Ding and W. Fang. (2018). “Target tracking by sequential random draft particle swarm optimization algorithm,” in 2018 IEEE Int. Smart Cities Conf. (ISC2Kansas City, MO, USA. [Google Scholar]
2. S. Liu. (2017). “Optimization analysis of WSN location process based on hybrid PSO algorithm,” in 2017 IEEE Int. Conf. on Unmanned Systems (ICUSBeijing, China. [Google Scholar]
3. R. S. Elhabyan and M. C. E. Yagoub. (2014). “Energy efficient clustering protocol for WSN using PSO,” in 2014 Global Information Infrastructure and Networking Symposium (GIISMontreal, QC, Canada. [Google Scholar]
4. P. Parwekar and V. Nagireddy. (2018). “Comparative analysis of SGO and PSO for clustering in WSN,” in 2018 Int. Conf. on Computing and Network Communications (CoCoNetAstana, Kazakhstan. [Google Scholar]
5. C. Cong. (2015). “A coverage algorithm for WSN based on the improved PSO,” in 2015 Int. Conf. on Intelligent Transportation, Halong Bay, Vietnam: Big Data and Smart City. [Google Scholar]
6. I. Daanoune, A. Baghdad and A. Balllouk. (2019). “A comparative study between ACO-based protocols and PSO-based protocols in WSN,” in 2019 7th Mediterranean Congress of Telecommunications (CMTFès, Morocco. [Google Scholar]
7. S. Jiang. (2018). “LEACH protocol analysis and optimization of wireless sensor networks based on PSO and AC,” in 2018 10th Int. Conf. on Intelligent Human-Machine Systems and Cybernetics (IHMSCHangzhou, China. [Google Scholar]
8. K. S. Praveena, K. Bhargavi and K. R. Yogeshwari. (2017). “Comparision of PSO algorithm and genetic algorithm in WSN using NS-2,” in 2017 Int. Conf. on Current Trends in Computer, Electrical, Electronics and Communication (CTCEECMysore, India. [Google Scholar]
9. H. Kong and B. Yu. (2019). “An improved method of WSN coverage based on enhanced PSO algorithm,” in 2019 IEEE 8th Joint Int. Information Technology and Artificial Intelligence Conf. (ITAICChongqing, China. [Google Scholar]
10. Z. Han, Y. Li and J. Liang. (2018). “Numerical improvement for the mechanical performance of bikes based on an intelligent PSO-ABC algorithm and WSN Technology,” IEEE Access, vol. 6, pp. 32890–32898. [Google Scholar]
11. P. Saini and R. Kumar. (2019). “Design of PID controller for paper machine headbox using particle swarm optimisation (PSO),” in 2019 4th Int. Conf. on Internet of Things: Smart Innovation and Usages (IoT-SIUGhaziabad, India. [Google Scholar]
12. W. Ren, Y. Sun, H. Luo and M. Guizani. (2019). “A novel control plane optimization strategy for important nodes in SDN-IoT networks,” IEEE Internet of Things Journal, vol. 6, no. 2, pp. 3558–3571. [Google Scholar]
13. X. Wang, H. Zhang, S. Fan and H. Gu. (2018). “Coverage control of sensor networks in IoT based on RPSO,” IEEE Internet of Things Journal, vol. 5, no. 5, pp. 3521–3532. [Google Scholar]
14. L. Song, K. K. Chai, Y. Chen, J. Loo and J. Schormans. (2018). “Cooperative coalition selection for quality of service optimization in cluster-based capillary networks,” IEEE Systems Journal, vol. 12, no. 2, pp. 1700–1708. [Google Scholar]
15. M. S. Manshahia. (2018). “Swarm intelligence-based energy-efficient data delivery in WSAN to virtualise IoT in smart cities,” IET Wireless Sensor Systems, vol. 8, no. 6, pp. 256–259. [Google Scholar]
16. T. Kumrai, K. Ota, M. Dong, J. Kishigami and D. K. Sung. (2017). “Multiobjective optimization in cloud brokering systems for connected internet of things,” IEEE Internet of Things Journal, vol. 4, no. 2, pp. 404–413. [Google Scholar]
17. X. Du and K. Yang. (2017). “A map-assisted WiFi AP placement algorithm enabling mobile device’s indoor positioning,” IEEE Systems Journal, vol. 11, no. 3, pp. 1467–1475. [Google Scholar]
18. M. Z. Hasan and F. Al-Turjman. (2017). “Optimizing multipath routing with guaranteed fault tolerance in internet of things,” IEEE Sensors Journal, vol. 17, no. 19, pp. 6463–6473. [Google Scholar]
19. H. M. Ali, W. Ejaz, D. C. Lee and I. M. Khater. (2019). “Optimising the power using firework-based evolutionary algorithms for emerging IoT applications,” IET Networks, vol. 8, no. 1, pp. 15–31. [Google Scholar]
20. M. A. Abdullah, T. Al-Hadhrami, C. W. Tan and A. H. Yatim. (2018). “Towards green energy for smart cities: particle swarm optimization based MPPT approach,” IEEE Access, vol. 6, pp. 58427–58438. [Google Scholar]
21. N. Kumar and D. P. Vidyarthi. (2018). “A green routing algorithm for IoT-enabled software defined wireless sensor network,” IEEE Sensors Journal, vol. 18, no. 22, pp. 9449–9460. [Google Scholar]
22. S. Wang, L. Zhang, Y. Zhang and N. Cao. (2018). “Spark load balancing strategy optimization based on internet of things,” in 2018 Int. Conf. on Cyber-Enabled Distributed Computing and Knowledge Discovery (CyberCZhengzhou, China. [Google Scholar]
23. L. Peng, K. Liu and G. Liu. (2010). “Research on wireless sensor networks fault-tolerant coverage algorithm base on particle swarm optimization,” in IET Int. Conf. on Wireless Sensor Network 2010 (IET-WSN 2010Beijing, China. [Google Scholar]
24. Y. Hoshino. (2017). “Hardware/software co-design SoC-system for a neural network trained by particle swarm optimization,” in 2017 IEEE 10th International Workshop on Computational Intelligence and Applications (IWCIAHiroshima, Japan. [Google Scholar]
25. T. Djemai, P. Stolf, T. Monteil and J. Pierson. (2019). “A discrete particle swarm optimization approach for energy-efficient IoT services placement over fog infrastructures,” in 2019 18th Int. Sym. on Parallel and Distributed Computing (ISPDCAmsterdam, Netherlands. [Google Scholar]
26. Y. Yuan, J. Sun and D. Zhou. (2016). “Multi-objective random drift particle swarm optimization algorithm with adaptive grids,” in 2016 IEEE Congress on Evolutionary Computation (CECVancouver, BC, Canada. [Google Scholar]
27. A. Kohlbacher, J. Eliasson, K. Acres, H. Chung and J. C. Barca. (2018). “A low cost omnidirectional relative localization sensor for swarm applications,” in 2018 IEEE 4th World Forum on Internet of Things (WF-IoTSingapore. [Google Scholar]
28. J. Chen, M. N. Omidvar, M. Azad and X. Yao. (2017). “Knowledge-based particle swarm optimization for PID controller tuning,” in 2017 IEEE Congress on Evolutionary Computation (CECSan Sebastian, Spain. [Google Scholar]
29. S. Phoemphon, C. So-In and N. Leelathakul. (2018). “Optimized hop angle relativity for DV-Hop Localization in wireless sensor networks,” IEEE Access, vol. 6, pp. 78149–78172. [Google Scholar]
30. T. A. Al-Janabi and H. S. Al-Raweshidy. (2018). “A centralized routing protocol with a scheduled mobile sink-based AI for large scale I-IoT,” IEEE Sensors Journal, vol. 18, no. 24, pp. 10248–10261. [Google Scholar]
31. F. Aftab, A. Khan and Z. Zhang. (2019). “Hybrid self-organized clustering scheme for drone based cognitive internet of things,” IEEE Access, vol. 7, pp. 56217–56227. [Google Scholar]
 | This work is licensed under a Creative Commons Attribution 4.0 International License, which permits unrestricted use, distribution, and reproduction in any medium, provided the original work is properly cited. |