DOI:10.32604/iasc.2021.012077
| Intelligent Automation & Soft Computing DOI:10.32604/iasc.2021.012077 | |
| Article |
Mammographic Image Classification Using Deep Neural Network for Computer-Aided Diagnosis
1Department of Electronics and Communication Engineering, Government College of Engineering, Bargur, Tamil Nadu, India
2Department of Computer Science and Engineering, SRM Institute of Science and Technology, Kattankulathur, 603203, Tamil Nadu, India
3Data Scientist at ConverSight.ai, Indiana, USA
4Department of Computer Science and Engineering, Kalaignar Karunanidhi Institute of Technology, Coimbatore, Tamil Nadu, India
*Corresponding Author: Charles Arputham. Email: maryarputhamcharles1@gmail.com
Received: 30 August 2020; Accepted: 15 November 2020
Abstract: Breast cancer detection is a crucial topic in the healthcare sector. Breast cancer is a major reason for the increased mortality rate in recent years among women, specifically in developed and underdeveloped countries around the world. The incidence rate is less in India than in developed countries, but awareness must be increased. This paper focuses on an efficient deep learning-based diagnosis and classification technique to detect breast cancer from mammograms. The model includes preprocessing, segmentation, feature extraction, and classification. At the initial level, Laplacian filtering is applied to identify the portions of edges in mammogram images that are highly sensitive to noise. Subsequently, segmentation is done using modified adaptively regularized kernel-based fuzzy C means (ARKFCM). Feature extraction is accomplished using the morphological, texture, and moment invariants. The corresponding feature values are provided as inputs to a deep neural network (DNN) model that classifies the normal and abnormal portions in the mammogram images. The performance of the proposed model is validated with the Mammographic Image Analysis Society (MIAS) database. The efficiency of the proposed classifier is experimentally proved by comparing the various classifiers with respect to their statistical performances. On an applied database, the proposed model offered a maximum classification with the highest accuracy level of 99.13%.
Keywords: Breast cancer; classification; feature extraction; Laplacian filter
Breast cancer is a widespread disease among women, with a significant increase in its mortality rate. A survey in 2012 found that around 25.2% of women globally were directly affected by breast cancer. An earlier study by the American Cancer Society stated that around 246,660 females and 2,600 males would be identified with persistent breast cancer in 2016 [1]. The study was proved correct, and the number of patients has been increasing rapidly. Therefore, to increase human lifespans, the disease must be predicted at an earlier stage, which would increase the survival rate by up to 90% [2]. Regular monitoring and primary detection are necessary to avoid further adverse developments in breast cancer. There are various methods to detect cancer, including mammography, ultrasound, X-ray, and positron emission tomography (PET). X-ray mammography utilizes lower amounts of X-ray energy to create the pixels of the disease. These images are helpful in early diagnosis. Many reviews have underscored the threat of exposure to radiation [3,4]. Mostly, women at the age of 40 years are observed to face more difficulty during ordinary mammography screening procedures than elderly women. A study on mammogram results stated that 1,212 of 10,000 women showed false positives for breast cancer at the age of 40 years. The injurious impacts of mammography include overtreatment, unwanted and persistent follow-up testing, and stress related to false-positive test results. Moreover, X-ray mammography necessitates the encoding of the breast as it lies flat during the examination process, which causes pain. Distinguishing tumors from mammogram images is a complex process [1–4] because of the similar appearances of the cancer and the massive cell growths that appear white in color in the mammogram pixels and the fatty cells that are black in color. In Fig. 1, tiny cancer cells are noticeable in the fatty breast; At the same time, the formed breast tissue in the heterogeneous large breasts has a possible 4 cm tumor.
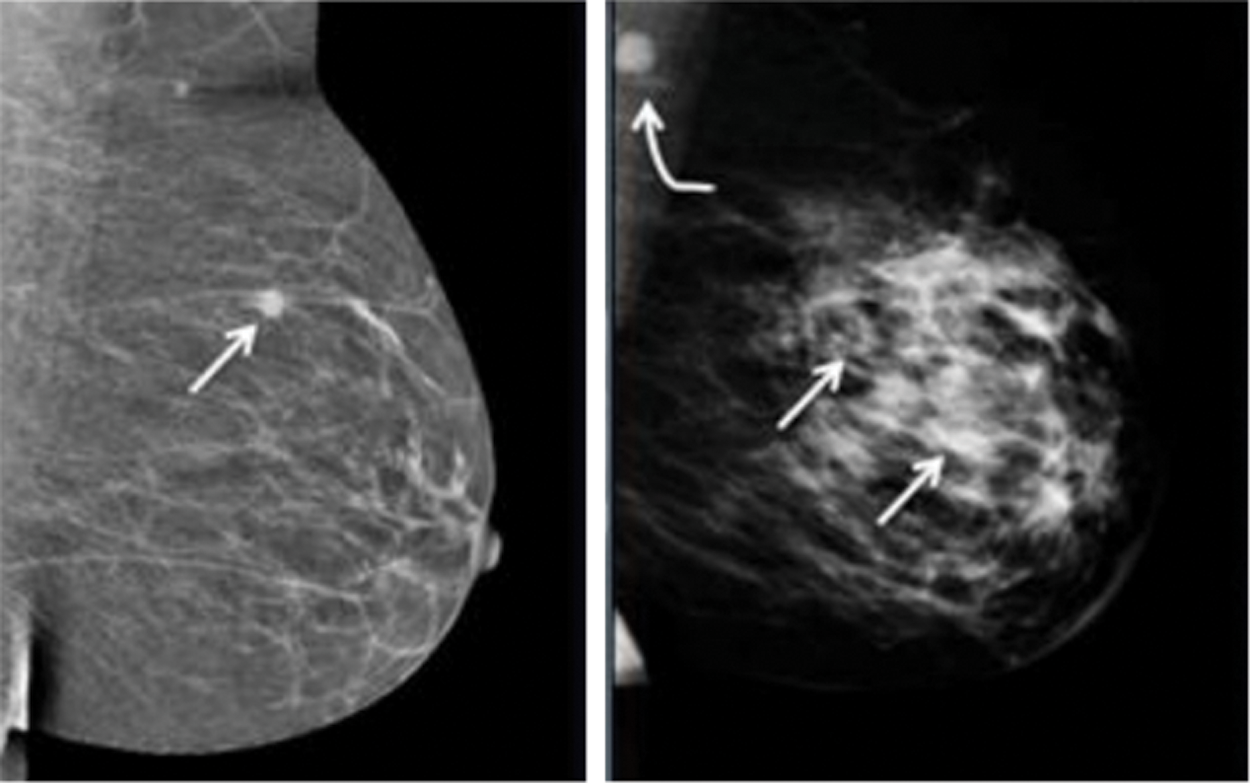
Figure 1: Sample breast cancer image
Ultrasound employs sound waves to view the internal structure of the body. It has a frequency greater than 20 kHz. A transducer is fixed on the skin; this transmits ultrasound pulses inside the body to detect echoes so as to create ultrasound images. It protects the body from harmful effects of radiation and can differentiate cancerous from non-cancerous tumors. However, ultrasound is used only as an alternative when the results of a mammogram are unclear. The magnetic resonance image (MRI) employs radio waves and robust magnetic fields to produce images of the internal body. This method uses various levels of absorption energy for different kinds of cells. When applied to delicate tissues such as the breast, the contrast liquid is used to generate clear images. The MRI is conventionally used in detection to provide additional estimations of the reasonable findings. It is used prior to surgical procedures, such as breast consuming lumpectomy or mastectomy. Therefore, MRI is effective and adaptable technique for primary tumor detection. PET uses injected combinations of radioactive materials and glucose, which undergoes synthetization inside the human body. This study develops an efficient deep learning-based diagnosis and categorization of breast cancer in mammograms.
The proposed model has four levels: Preprocessing, segmentation, feature extraction, and classification. Laplacian filtering is applied in the initial level to identify portions of the edges in the mammogram images. Segmentation takes place with the help of modified adaptively regularized kernel-based Fuzzy-C-means (ARKFCM), an effective machine learning (ML) process that localizes objects in a complicated template. The corresponding feature values are provided as inputs to a classification model, a deep neural network (DNN) that classifies normal and abnormal regions in mammogram images. The MIAS database is employed to evaluate the effectiveness of the proposed machine diagnostic system.
Techniques for the auto-prediction of clusters of mammary calcifications have been discussed in the literature. In classification, the spatial features of these lesions were considered. Taking into account the appearance of breast microcalcification (MC) as a local high-intensity variable, this study developed a method focused on the application of an effective mammogram threshold function, which was subsequently used for the regular extraction of lesions. Netsch et al. [5] proposed an alternate scheme for detecting the MC pipeline with multiple resolutions, and an alternate machine learning technique was deployed for predicting the micro-calcifications on the basis of the Laplacian scale-space. The application of SVM to design a detection algorithm was also investigated [6]. In a few scenarios, these models were found to attain the best sensitivity levels. For example, a method achieved sensitivity of up to 94%, although some methods suffered from problems of false-positives [7]. It is a disadvantage of the direct impact of greater heterogeneity in breast cells that should be considered in order to minimize the lack of true positive in multiple mammograms.
A deeper local search algorithm for parameterized and approximation-based algorithms was developed [8]. A method using a convolutional neural network (CNN) and an extreme learning machine (ELM) model was presented for ECG analysis [9]. Two efficient lightweight networks were presented to attain the maximum traffic sign detection rates with the minimum number of trainable model parameters [10]. A new model to concatenate transfer edges was presented [11]. The character interval allowed for the representation of successive characters to minimize transfer edge counts. A model-based grammatical evolution (MGE) [12] was based on the terms and conditions of previous grammar models (a finite state transition system). The features and issues of finite state automata were investigated to enhance non-deterministic finite automata by minimizing a conversion edge to reduce memory utilization [13]. Two Dense-MobileNet models, Dense1-MobileNet and Dense2-MobileNet, were developed to eliminate the parameter count and limit computational complexity [14]. Real-time images searched for and obtained online were segmented, where feature extraction was accomplished by the DenseNet architecture [15]. A continuous object tracking scheme based on the spatial and conventional features of a CNN was investigated [16].
Minimization of tracking effects due to changes in the scale ratio was discussed [17]. The HPCA algorithm was used to extract features and reduce dimensionality-based issues. Zhao et al. [18] investigated the methods of enhancing packet classification accuracy in software, specifically in the OpenFlow protocol in software-defined networking (SDN). The packet classification algorithm used in this research exhibits a more effective performance than the other approaches. A face image method combining a Gabor filter, local binary pattern, and local phase quantization was proposed [19]. As a result of the inherent drawbacks in classical approaches, recent research has stressed nonlinear approaches based on the CNN. These tools have been found useful in the elimination of handcrafted characteristics, generation of autofeature extractions, and evaluation. CNN architecture has achieved state-of-the-art performance using individual studies employing deep learning [20]. Later, Wang et al. [21] designed the mammogram analysis as a bipartite pattern describing a methodology for detecting the MC that contains 2sub networks. The first network performs on the local image windows, and the second network connects the image background. These networks filtered the features from the mammograms simultaneously and provided the requirements collectively in a completely distributed and linked layer for classifying the instance window with or without the MC.
Fig. 2 shows a block diagram of the presented model, whose procedures are explained below.
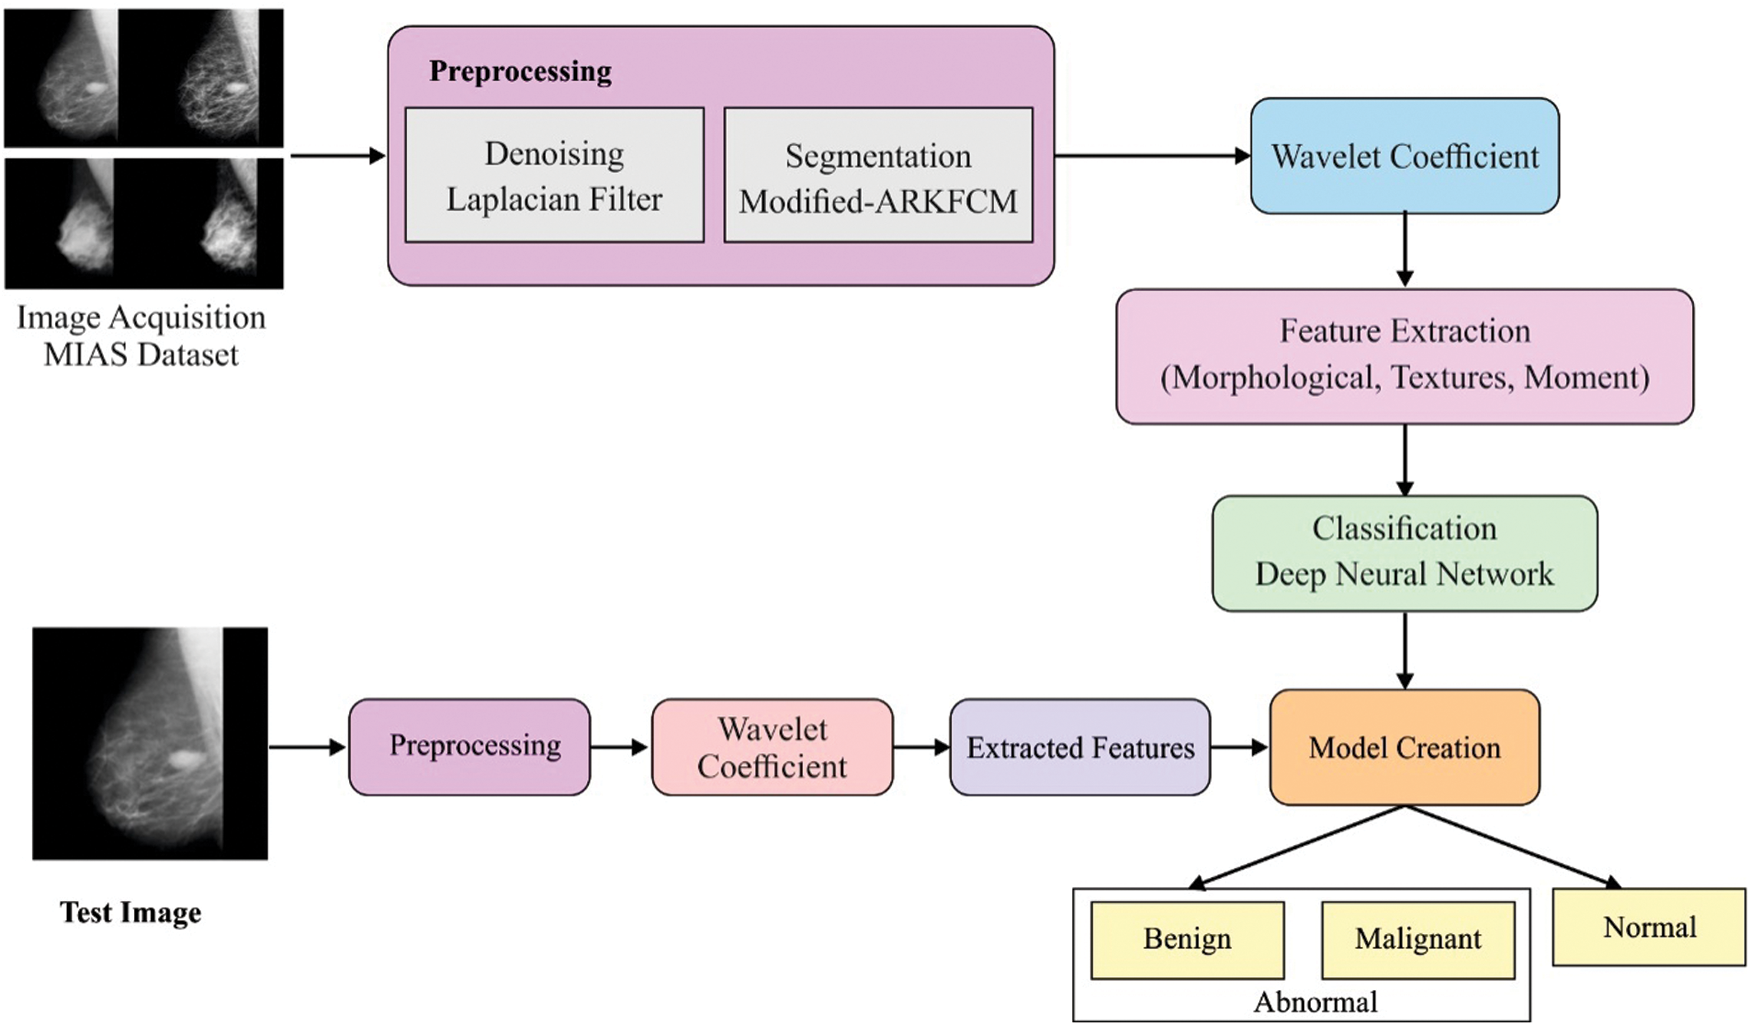
Figure 2: Overall process of proposed model
The MIAS database is employed to evaluate the effectiveness of a machine diagnostic system. This benchmark database is easily accessed for all types of studies. Once the mammogram images are acquired, the Laplacian filter can be utilized for preprocessing due to its simplicity and ability to eliminate noise. This is a smoothing operator that can transform noisy images to noiseless images; hence, there is a chance to directly obtain objects from raw mammogram images. It plays a significant role in detecting the boundaries of obtained images. The Laplacian formula is

where i denotes the horizontal axis, j indicates the vertical axis, and σ is the standard deviation.
Segmentation is performed on preprocessed images obtained from mammograms. An efficient model based on ARKFCM is used to portion cancerous and non-cancerous parts of mammogram breast images. ARKFCM is stronger in collecting the parameters used to decrease operational charges; hence, it provides extended decisions for the overlapping database. An altered ARKFCM scheme deploys and employs differences in the grayscales with respect to neighborhood factors to estimate the local contextual data. These modified models comprise Euclidean distances appropriately replaced by the correlating operation. The common template for the modified ARKFCM technique is represented as

where Gxy represents the changed fuzzy factor,  is the fuzzy factor of i, C is the correlation function, m is a weight exponent of the regularization corresponding to the degree of fuzziness, uxy is the membership value for each pixel x in the yth cluster, and 1-C(ix-vy) is the correlation metric function.
3.3 Determination of Wavelet Coefficients Using DWT
Segmented mammogram images are used in calculations concerning wavelet coefficients with the help of DWT. By applying a square-shaped function will assist in the creation of a family of wavelets. It utilizes a fuzzy denoising rule that offers shifting sub-bands, extended directional sensitivities, and lower redundancies. The multiresolution procedure estimates the original texture of the mammogram using the zoom in and zoom out patterns. The first step is to decompose the image into sub-images, so as to preserve both the lower- and higher-frequency levels. This property helps DWT to extract texture-based data. The square integrable function f(i), the corresponding wavelet transform that is organized as an inner product f and a real-valued function ψ(i), is

where represents the wavelet family, and s ε t, τ, and k ε {h,v,d}, respectively, represent the scale, orientation parameters, and translation. Orientation parameters
  v, d, and h denote the vertical, diagonal, and horizontal directions, respectively. Dyadic wavelet decomposition can be reached when
  and τ = 2x, n, y, n. The subsequent wavelet decomposition applies dyadic wavelets executed by the employment of an accurate reconstruction filter bank. Based on the wavelet function ψ(i) and scaling function (i), the wavelet and scaling family can be formed as


Orthonormal-based subspaces are relevant to the resolution 2y. Wavelet atoms are organized by scaling and three parental atoms: ψh, ψv, and ψd. These mother atoms are validated as a tensor product of the 1D ψ(i) and (i):


Digital filter banks consist of low-pass (h) and high-pass (g) filters. The organization of the wavelet comprises of a number of filter, categorized based on the resolution. In case of 2-dimensional images, DWT is processed with the help of independent wavelet functions. The vertical and horizontal mammogram images are single in nature, they are operated in a dimensional wavelet transform for establishing a two-dimensional wavelet coefficient. The actual mammogram image A2y+1, with resolution of 2y+1, is decompressed as a four-sub-band image in the frequency domain. Between these sub-bands, only three images,  , represent the mammogram images at a resolution of 2y in the horizontal, vertical, and diagonal directions, respectively. Followed by an approximation image, A2yf is identified in the coarse resolution; hence, the entire mammogram image A2y+1 is represented as

The decomposed mammogram sub-image is observed as a 2D orthogonal wavelet presentation. Simulation of the decomposing wavelets in a mammogram image results in four orthogonal sub-bands, low-high (LH), low-low (LL), high-high (HH), and high-low (HL), corresponding to the sub-images  , and A2yf, respectively.
It offers an effective outcome in Computer Aided Diagnosis (CAD) quality. Feature extraction determines the parameters that are to be separated among the ROI features [22].
Morphological features are noticeable by humans, and straight features can be described only by radiologists. These are meant to handle various types of shapes. Since the MCC morphology with respect to the physical shape determines the existence of ROI, it is important for the presented diagnostic model to identify morphological organizations that can remain invisible.
Moment variants have been used as features for processing images, which is done by calculating the seven invariant moments based on the rotation of the images. Moment invariants ϕx, 1≤ X≤ 7, are helpful in performing tasks such as image scaling and rotating mechanisms. It is validated across the structure of the boundary and the inner region. The main objective of feature selection is to reduce the number of features by deleting the predicted information. In this research, the Fisher score is used to decrease the characteristics and increase accurate detections. Consequently, classification is the final stage in the CAD system and is used to select the important features, which are used to classify abnormal lesions into cancerous and non-cancerous types. The classification models utilized to recognize the classes of images are KNN, ANN, and SVM. In this work, automatic and conventional schemes of ANN are projected. A different model of SVM is developed to classify results with the help of quadratic, linear, and radial basis function (RBF) kernels.
Once the feature extraction is completed, classification commences on the feature vectors. The classification process is described as a boundary among the various classes with respect to the measured characteristics. In such a case, the DNN classification process will have undergone classification of usual and unusual mammogram images, such as benign and malignant types [23]. In the absence of sharing data, DNN must be considered for classification procedures. Data flow from the input layer to the output layer can be witnessed during the absence of the looping function. The DNN classification model assists in the execution of the dividing operation whenever the probability of a missing value is lower. The DNN model permits the implementation of a single layer at an unsupervised pretraining level. It allocates a classification score f(i) at the time of prediction. All input data samples i = [i1, ……..iN] are observed as a forward pass. Normally, f is the function, which includes a sequence of layers for computing (Txy):

where the input of the layer is represented is defined as ix, the output layer is iy, wxy represents the model parameters, and g(Ty) realizes the matching function. Layer-wise propagation decomposes the classification process output f(i) by means of the relevance’s rx attribute for all the input element ix that involves in the classification decision is defined as

where ry > 0 denotes positive evidence that supports the classifying solution, and rx < 0 is negative evidence; otherwise, it is termed neutral evidence, although the relevant attribute rx is validated as

The general structure of the DNN is portrayed in Fig. 3. The DNN has the capability of investigating the unknown characteristics of the coherent inputs. It offers a hierarchical feature training model. A maximum level of features is retrieved from the lower-level features using greedy layer-wise unsupervised pretraining information. The main objective of the DNN is to manage the difficult operations that can be represented in a higher-level abstraction.
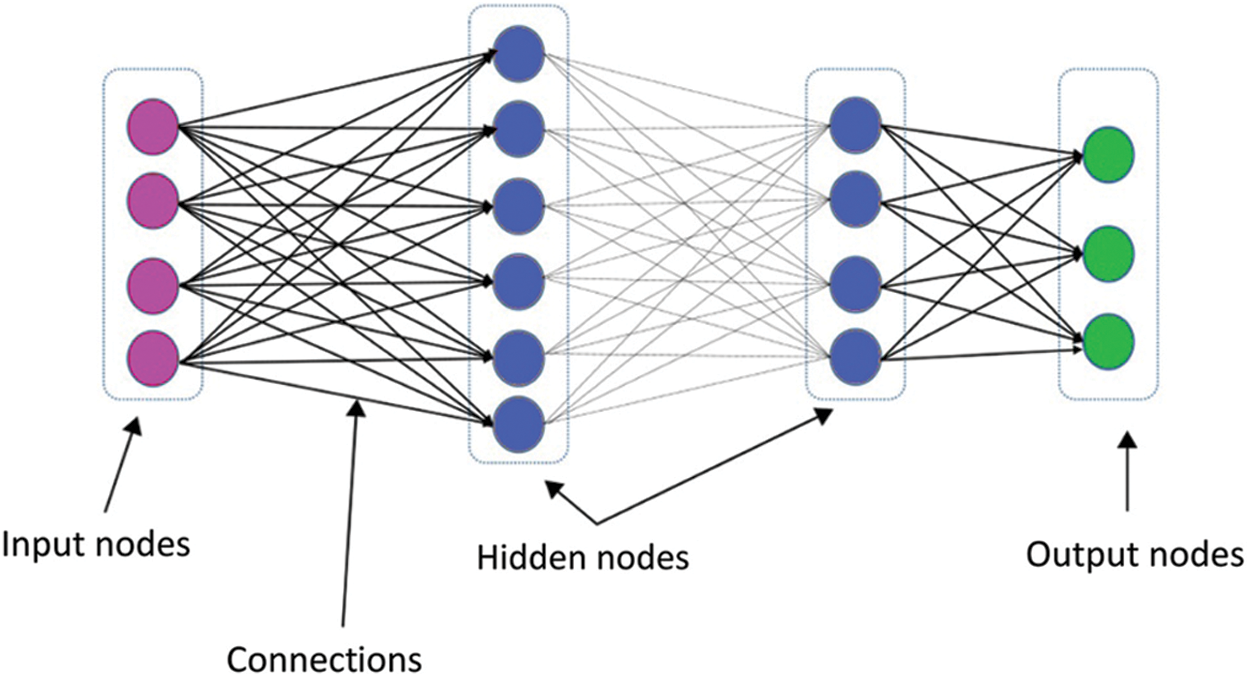
Figure 3: DNN architecture
Experiments were conducted using the freely available MIAS dataset (http://www.mammoimage.org/databases/). Experimental results were analyzed using a set of performance measures consisting of sensitivity, specificity, accuracy, and F-score. Fig. 4 shows the sample original mammogram images and the preprocessed images. The figure clearly shows that the images were properly preprocessed for discarding unwanted details.
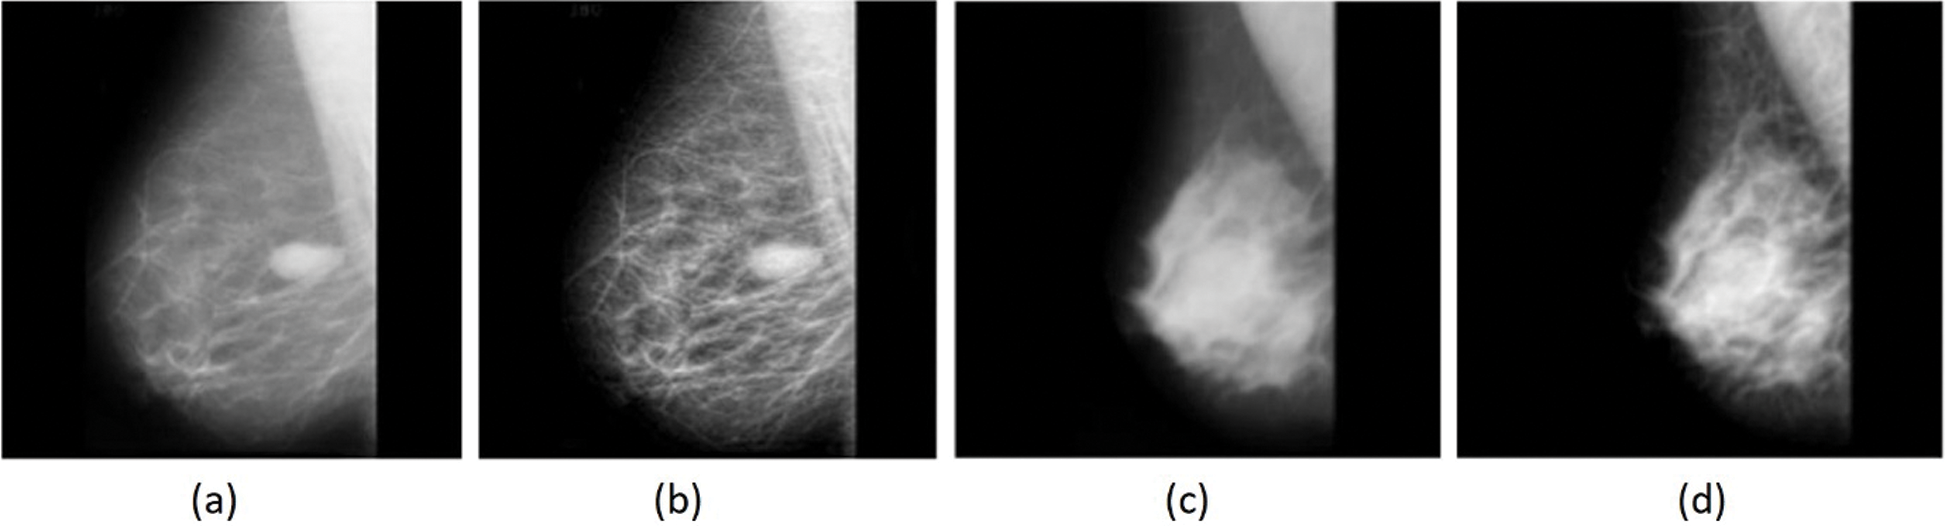
Figure 4: (a) (c) Original, (b) (d) Pre-processed images
Fig. 5 shows the sample preprocessed mammogram images along with the segmented images. From the figure, it is clear that the images were properly segmented.
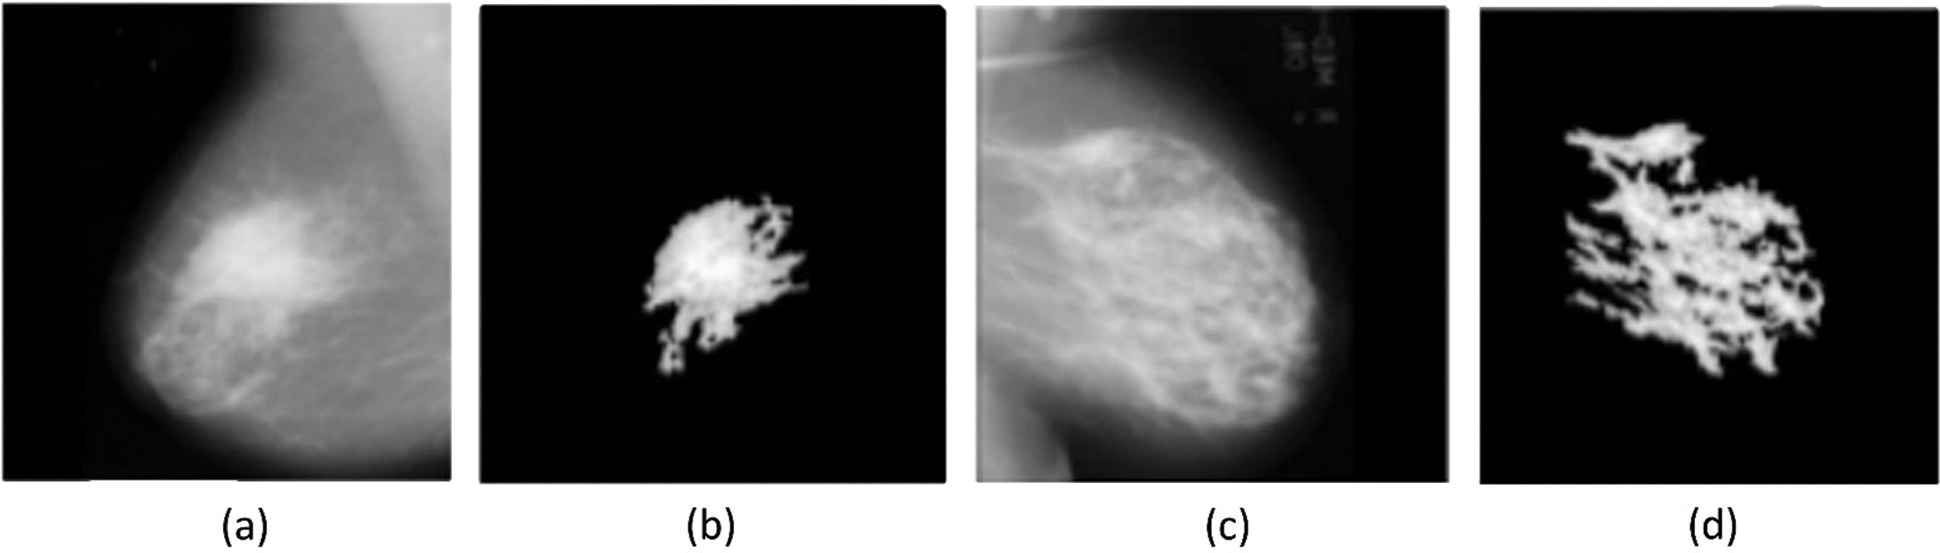
Figure 5: (a) (c) Pre-processed mammogram image, (b) (d) Segmented image
4.1 Results Analysis on Normal and Abnormality Classification
Tab. 1 shows the classifier results under various features with respect to the performance measures. Fig. 6 shows the accuracy analysis of the various models. In the presence of the energy features, the NN classifier offers poor classification of concerned features and attains the lowest accuracy level of 58.80% and F-score of 50.69%. The NB model achieves an accuracy level of 92.20% and F-score of 92.16%. The SVM model exhibits moderate classification, with an accuracy level of 92.40% and F-score of 93.06%. The DNN model provides effective classification, attaining the best accuracy level of 93.80% and F-score of 93.50%. In the presence of the homogeneity feature, the NN classifier offers poor classification, attaining the lowest accuracy level of 58.80% and an F-score of 37.12%. The SVM model exhibits better results, with an accuracy level of 94.40% and F-score of 94.91%. The NB model shows moderate classification, with an accuracy level of 97.40% and F-score of 97.42%. The DNN model shows effective classification, with the best accuracy level of 97.80% and F-score of 97.85%.
Table 1: Comparison of the diverse models under the Normal & the Abnormal Classifications
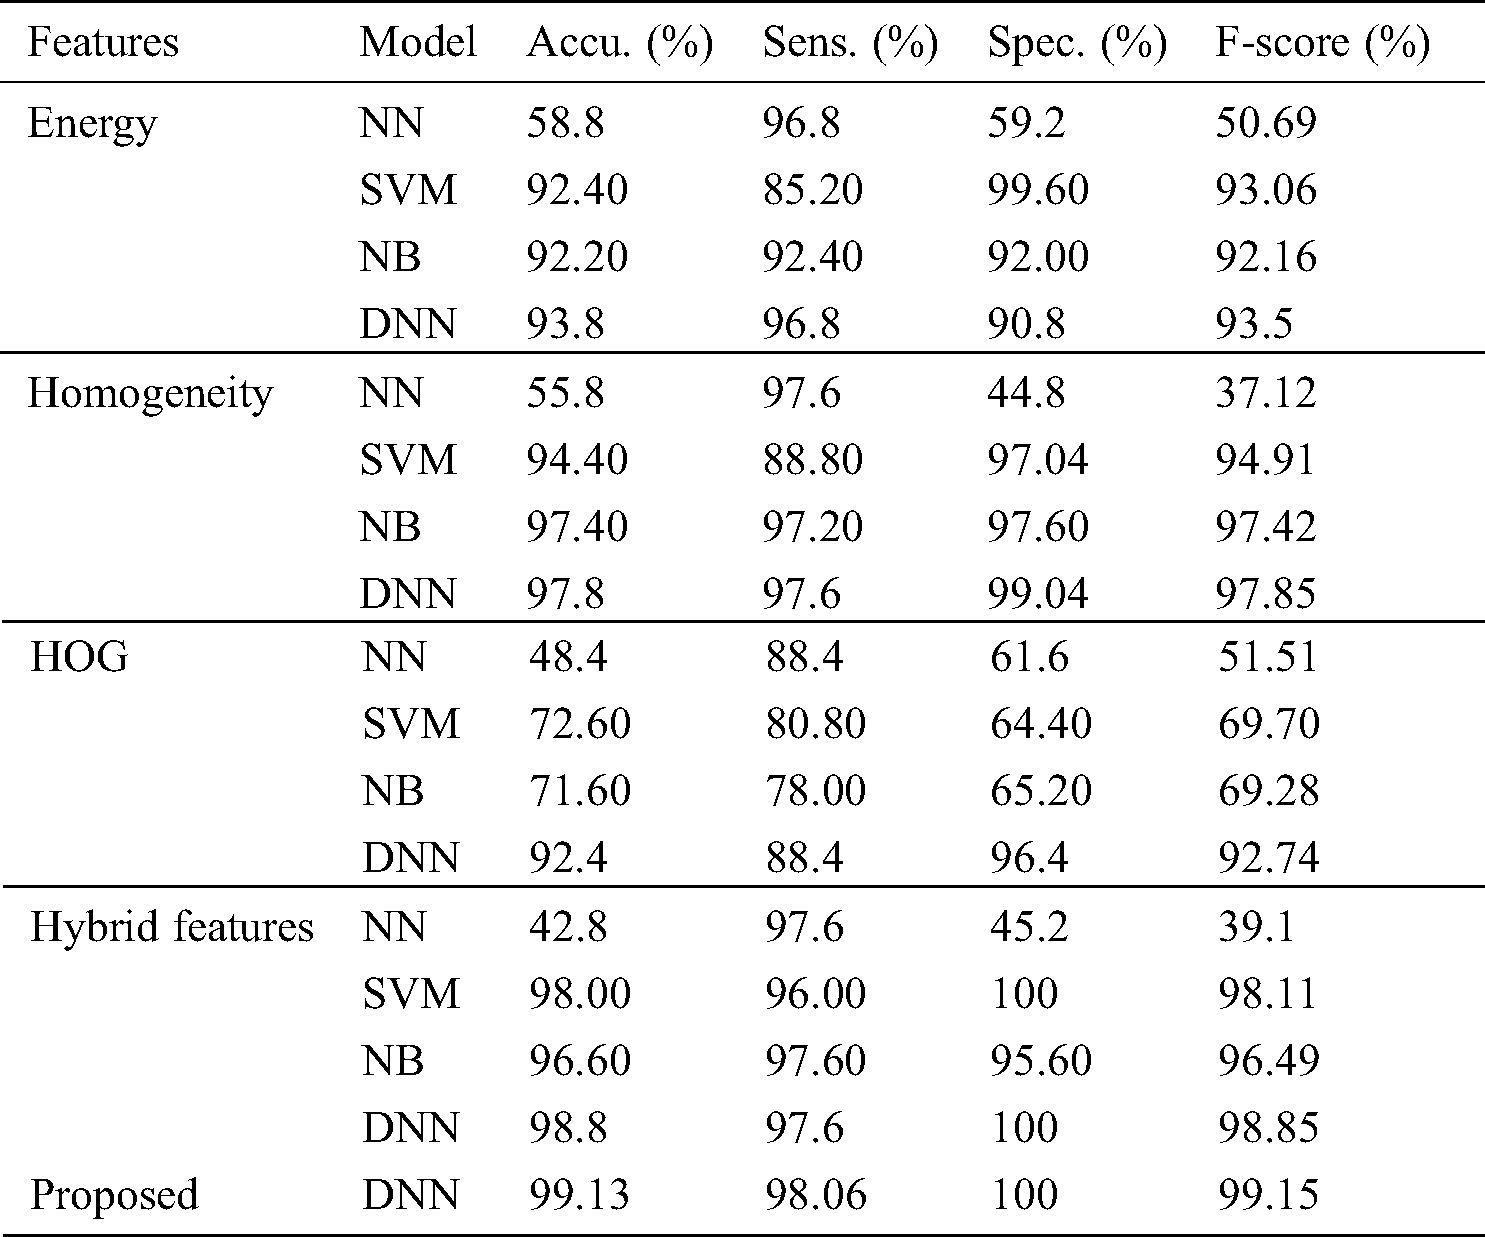
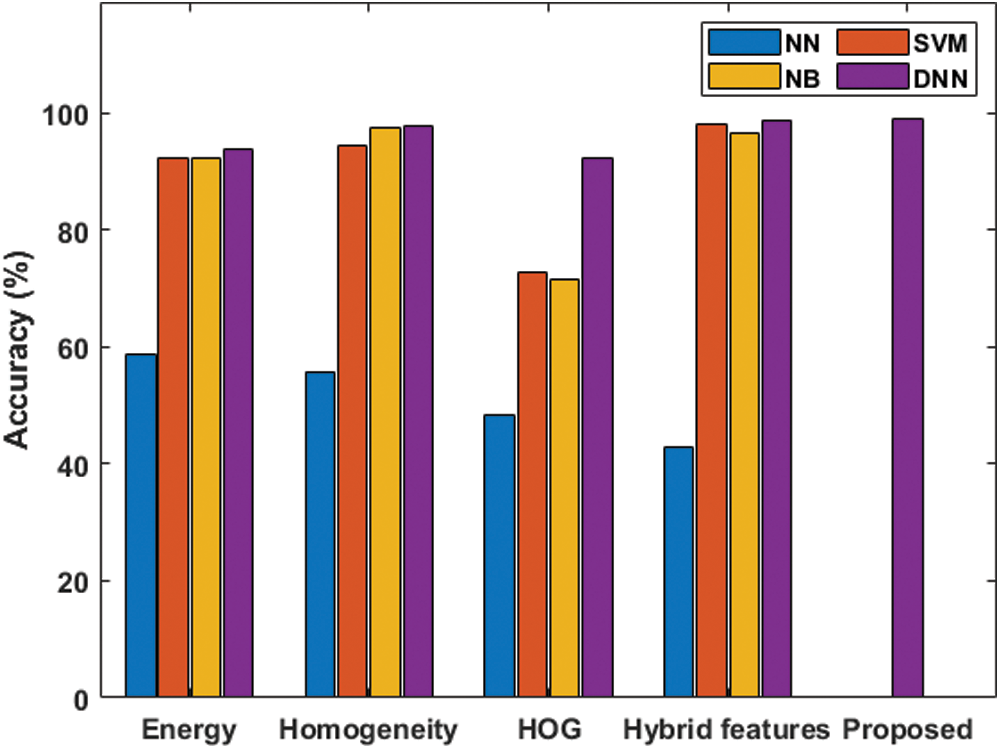
Figure 6: Accuracy analysis under various features of the normal and the abnormal classifications
With the HOG feature, the NN classifier offers poor classification, with the lowest accuracy level of 48.40% and F-score of 51.51%. The NB model achieves somewhat better results, with accuracy of 71.60% and an F-score of 69.28%. The SVM model shows moderate classification, with accuracy of 72.60% and an F-score of 69.70%. The DNN model provides effective classification, with the best accuracy level, 92.40%, and an F-score of 92.74%. With hybrid features, the NN classifier offers poor classification, with an accuracy level of 42.80% and F-score of 39.10%. Next is the NB model with an accuracy level of 96.60% and F-score of 96.49%. The SVM model shows moderate classification, with accuracy of 98.00% and F-score of 98.11%. The DNN model provides effective classification, with the best accuracy level, 98.80%, and an F-score of 98.85%. With the proposed features, the DNN classification model achieves the best accuracy level, 99.13%, and an F-score of 99.15%.
4.2 Result Analysis on Malignant and Benign Classification
Tab. 2 shows the classifier results with respect to the malignant and benign classifications under various measures. Fig. 7 shows the accuracy analysis of the various models. Under the presence of an energy feature, the NB classifier offers poor classification, with the lowest accuracy level, 50.20%, and an F-score of 55.81%. The NN model achieves somewhat better results, with an accuracy level of 51.40% and F-score of 42.60%. The SVM model shows moderate classification, with an accuracy level of 54.20% and F-score of 44.95%. DNN provides effective classification, with the best accuracy level, 58.80%, and F-score of 59.25%.
Table 2: Comparative analysis of the diverse models under the Benign and the Malignant Classifications
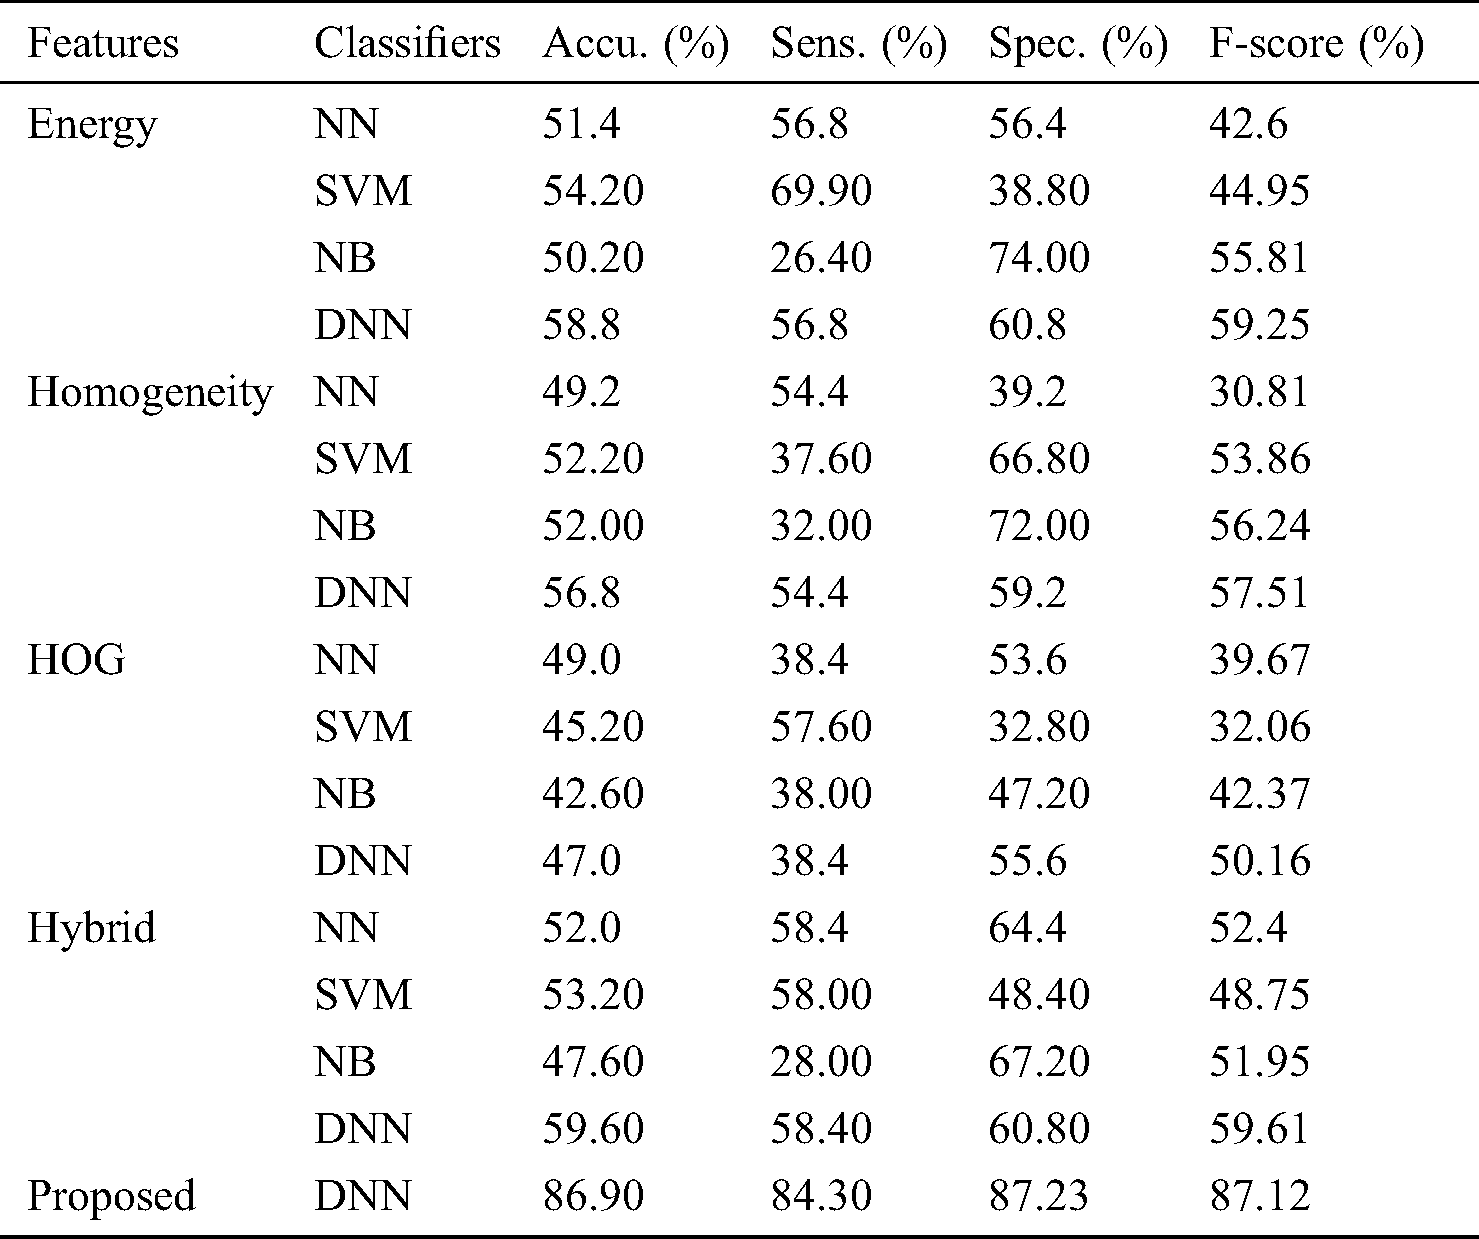
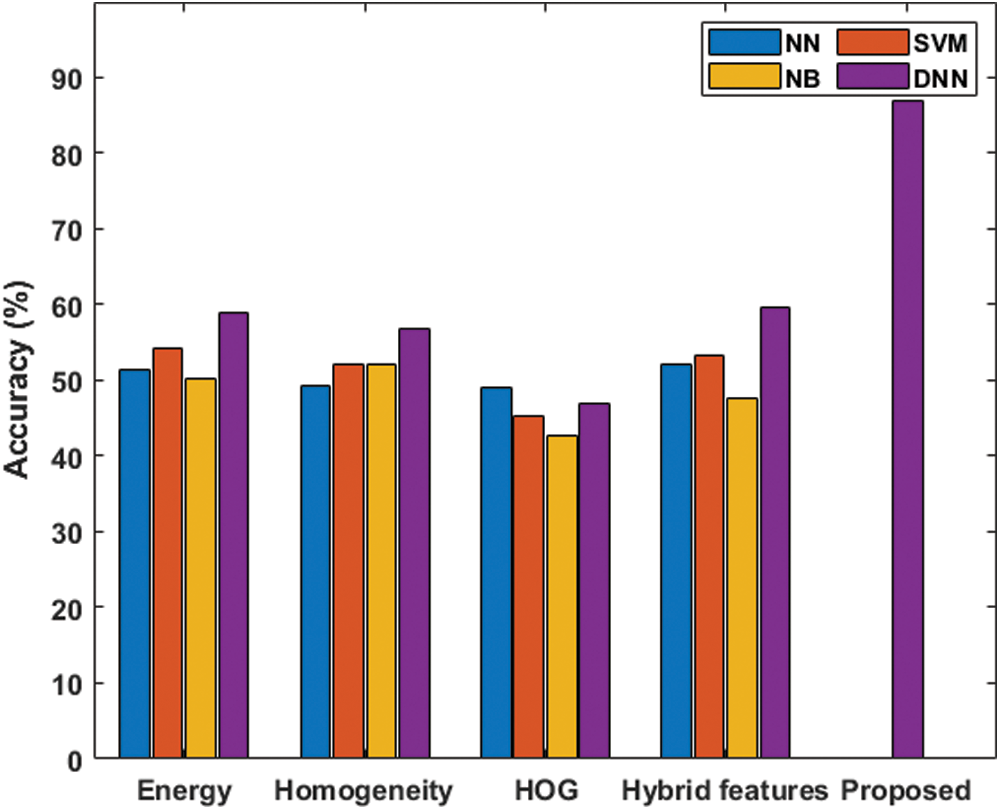
Figure 7: Accuracy analysis under various features of the benign and the malignant classifications
In the presence of a homogeneity feature, the NN classifier offers poor classification, with 49.20% accuracy, and an F-score of 30.81%. The NB model is somewhat better, with an accuracy level of 52.00% and F-score of 56.24%. The SVM model exhibits moderate classification at an accuracy level of 52.20%, with an F-score of 53.86%. The DNN model provides effective classification with the best accuracy level, 56.80%, and an F-score of 57.51%.
In the presence of the HOG feature, the NB classifier offers poor classification, with an accuracy level of 42.60%, and an F-score of 42.37%. The SVM model is somewhat better, with an accuracy level of 45.20% and F-score of 32.06%. The DNN model shows moderate classification, with an accuracy of 47.00% and F-score of 50.16%. The NN model demonstrates effective classification, with the best accuracy, 49.00%, and an F-score of 39.67%.
In the presence of the hybrid features, the NB classifier offers poor classification, with the lowest accuracy level, 47.60%, and an F-score of 51.95%. The NN model achieves better results, with an accuracy level of 52.00% and an F-score of 52.40%. The SVM model exhibits moderate classification, with an accuracy level of 53.20% and F-score of 48.75%. The proposed DNN model provides a maximum accuracy of 86.90% and anF score of 87.12%.
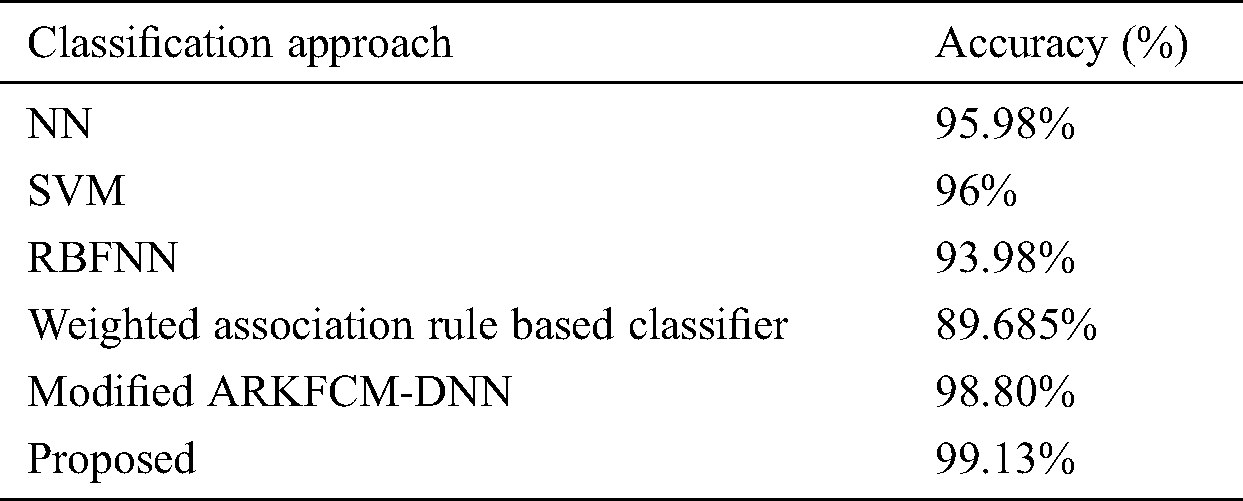
4.3 Comparison with Recently Proposed Methods
To further assess the performance of the proposed model, a comparative analysis with recently presented techniques was performed, with results as shown in Tab. 3 and Fig. 8. From the table, it is seen that the poorest results were realized by the weighted association rule-based classifier, with accuracy of 89.68%. NN achieved better results, with an accuracy level of 95.98%. The SVM model had manageable results, with an accuracy level of 96%. The modified ARKFCM-DNN performed competitively, with an accuracy level of 98.80%.
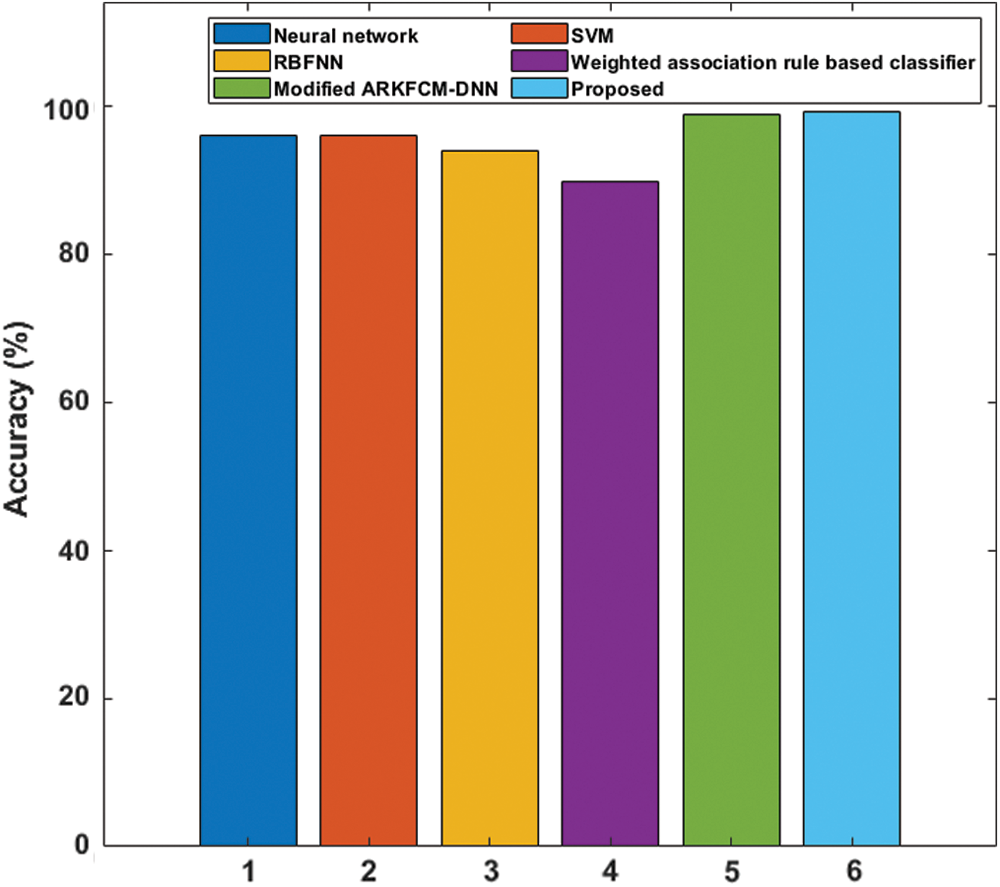
Figure 8: Accuracy analysis with recently proposed methods
Table 3: Comparison of presented model with state of art methods
We developed an efficient DL-based diagnosis and categorization technique to identify breast cancer in mammograms. The model has the four levels of preprocessing, segmentation, feature extraction, and classification. At the initial level, Laplacian filtering is applied to identify portions of the edges in mammogram images that are highly sensitive to noise factors. Subsequently, segmentation takes place with the help of the modified ARKFCM. Corresponding feature values are provided as inputs to a DNN classification model, which perfectly classifies normal and abnormal regions in mammogram images. The MIAS database was employed to evaluate the effectiveness of the proposed machine diagnostic system. On the applied database, the presented model offered the best classification of the concerned features, with an accuracy level of 99.13%. The model can be implemented in real-time scenarios.
Acknowledgement: We thank LetPub (www.letpub.com) for its linguistic assistance during the preparation of this manuscript.
Funding Statement: The author(s) declares that no specific funding received for this research work.
Conflicts of Interest: The authors declare that they have no known competing financial interests or personal relationships that could have appeared to influence the work reported in this paper.
1. A. C. Society. (2016). “Cancer facts & figures”, The Society. New York, NY, USA, . [Online]. Available: https://commed.vcu.edu/Chronic_Disease/Cancers/2017/CASocF&F2016.pdf. [Google Scholar]
2. K. B. C. Society. (2014). Breast Cancer Facts & Figures 2014. Korean Breast Cancer Society, Seoul, South Korea. [Google Scholar]
3. L. L. Humphrey, M. Helfand, B. K. S. Chan and S. H. Woolf. (2002). “Breast cancer screening: A summary of the evidence for the U.S. Preventive Services Task Force,” Annals of Internal Medicine, vol. 137, no. 5, pp. 347–360. [Google Scholar]
4. A. L. Siu. (2016). “Screening for breast cancer: U.S. Preventive services task force recommendation statement,” Annals of Internal Medicine, vol. 164, no. 4, pp. 279–296. [Google Scholar]
5. T. Netsch and H. O. Peitgen. (1999). “Scale-space signatures for the detection of clustered microcalcifications in digital mammograms,” IEEE Transactions on Medical Imaging, vol. 18, no. 9, pp. 774–786. [Google Scholar]
6. I. El-Naqa, Y. Yongyi, M. N. Wernick, N. P. Galatsanos and R. M. Nishikawa. (2002). “A support vector machine approach for detection of microcalcifications,” IEEE Transactions on Medical Imaging, vol. 21, no. 12, pp. 1552–1563. [Google Scholar]
7. J. J. Mordang, T. Janssen, A. Bria, T. Kooi, A. Gubern-Mérida et al. (2016). , “Automatic microcalcification detection in multi-vendor mammography using convolutional neural networks,” in Proc. of the Int. Workshop on Digital Mammography, Malmö, Sweden, Springer, pp. 35–42. [Google Scholar]
8. J. Li, Y. X. Cao, J. Chen and J. X. Wang. (2017). “Deeper local search for parameterized and approximation algorithms for maximum internal spanning tree,” Information and Computation, vol. 252, pp. 187–200. [Google Scholar]
9. R. Zhou and B. Tan. (2020). “Electrocardiogram soft computing using hybrid deep learning CNN-ELM,” Applied Soft Computing, vol. 86, 105778. [Google Scholar]
10. M. Zhang, W. Wang, C. Q. Lu, J. Wang and A. K. Sangaiah. (2019). “Lightweight deep network for traffic sign classification,” Annals of Telecommunications, vol. 75, no. 7–8, pp. 369–379. [Google Scholar]
11. R. Sun, L. Shi, C. Yin and J. Wang. (2019). “An improved method in deep packet inspection based on regular expression,” Journal of Supercomputing, vol. 75, no. 6, pp. 3317–3333. [Google Scholar]
12. P. He, Z. Deng, C. Gao, X. Wang and J. Li. (2017). “Model approach to grammatical evolution: Deep-structured analyzing of model and representation,” Soft Computing, vol. 21, no. 18, pp. 5413–5423. [Google Scholar]
13. Y. Yin, H. Y. Wang, X. Yin, R. X. Sun and J. Wang. (2019). “Improved deep packet inspection in data stream detection,” Journal of Supercomputing, vol. 75, no. 8, pp. 4295–4308. [Google Scholar]
14. W. Wang, Y. T. Li, T. Zou, X. Wang, J. Y. You et al. (2020). , “A novel image classification approach via Dense-MobileNet models,” Mobile Information Systems, vol. 2020, no.7602384, pp. 1–8. [Google Scholar]
15. Y. Luo, J. Qin, X. Xiang, Y. Tan, Q. Liu et al. (2020). , “Coverless real-time image information hiding based on image block matching and dense convolutional network,” Journal of Real-Time Image Processing, vol. 17, no. 1, pp. 125–135. [Google Scholar]
16. J. Zhang, X. K. Jin, J. Sun, J. Wang and A. K. Sangaiah. (2020). “Spatial and semantic convolutional features for robust visual object tracking,” Multimedia Tools and Applications, vol. 79, no. 21–22, pp. 15095–15115. [Google Scholar]
17. Y. Chen, J. Wang, S. Liu, X. Chen, J. Xiong et al. (2019). , “Multiscale fast correlation filtering tracking algorithm based on a feature fusion model,” Concurrency and Computation: Practice and Experience, vol. 47, no. 5, e5533. [Google Scholar]
18. Y. Zhao, Z. G. Hu, B. Xiong and K. Q. Li. (2018). “Accelerating packet classification with counting bloom filters for virtual OpenFlow switching,” China Communications, vol. 15, no. 10, pp. 117–128. [Google Scholar]
19. R. Zhou, J. P. Yin and J. M. Zhang. (2013). “Local binary pattern (LBP) and local phase quantization (LBQ) based on Gabor filter for face representation,” Neurocomputing, vol. 116, pp. 260–264. [Google Scholar]
20. K. Simonyan and A. Zisserman. (2015). “Very deep convolutional networks for large-scale image recognition,” in Proc. of Int. Conf. on Learning Representations 2015, CA, USA, pp. 1–14. [Google Scholar]
21. J. Wang and Y. Yang. (2018). “A context-sensitive deep learning approach for microcalcification detection in mammograms,” Pattern Recognition, vol. 78, pp. 12–22. [Google Scholar]
22. M. S. Mabrouk, H. M. Afify and S. Y. Marzouk. (2019). “Fully automated computer-aided diagnosis system for micro calcifications cancer based on improved mammographic image techniques,” Ain Shams Engineering Journal, vol. 10, no. 3, pp. 517–527. [Google Scholar]
23. R. Suresh, A. N. Rao and B. E. Reddy. (2019). “Detection and classification of normal and abnormal patterns in mammograms using deep neural network,” Concurrency and Computation: Practice and Experience, vol. 31, no. 14, 5293. [Google Scholar]
 | This work is licensed under a Creative Commons Attribution 4.0 International License, which permits unrestricted use, distribution, and reproduction in any medium, provided the original work is properly cited. |