DOI:10.32604/iasc.2021.014216
| Intelligent Automation & Soft Computing DOI:10.32604/iasc.2021.014216 | |
| Article |
A Big Data Approach to Black Friday Sales
1Department of Software Engineering, University of Management and Technology, Lahore, Pakistan
2School of Computing, Faculty of Engineering, University Teknologi Malaysia, Johor, Malaysia
3Collage of Business, Abu Dhabi University, Abu Dhabi, United Arab Emirates
4Oxford Center for Islamic Studies, the University of Oxford, Marston Road, Oxford, UK
5The University of Liverpool Management School, the University of Liverpool, Liverpool, UK
6Department of Computer Engineering, National University of Technology, Islamabad, Pakistan
7AlNahrain Nanorenewable Energy Research Centre, Al-Nahrain University, Baghdad, Iraq
*Corresponding Author: Mazhar Javed Awan. Email: mazhar.awan@umt.edu.pk
Received: 07 September 2020; Accepted: 22 December 2020
Abstract: Retail companies recognize the need to analyze and predict their sales and customer behavior against their products and product categories. Our study aims to help retail companies create personalized deals and promotions for their customers, even during the COVID-19 pandemic, through a big data framework that allows them to handle massive sales volumes with more efficient models. In this paper, we used Black Friday sales data taken from a dataset on the Kaggle website, which contains nearly 550,000 observations analyzed with 10 features: qualitative and quantitative. The class label is purchases and sales (in U.S. dollars). Because the predictor label is continuous, regression models are suited in this case. Using the Apache Spark big data framework, which uses the MLlib machine learning library, we trained two machine learning models: linear regression and random forest. These machine learning algorithms were used to predict future pricing and sales. We first implemented a linear regression model and a random forest model without using the Spark framework and achieved accuracies of 68% and 74%, respectively. Then, we trained these models on the Spark machine learning big data framework where we achieved an accuracy of 72% for the linear regression model and 81% for the random forest model.
Keywords: Big data; correlation and regression analysis; machine learning; numerical algorithms; performance; prediction; Black Friday sales; cloud
The term big data is used to describe the large and growing volumes of data that can inundate a business [1]. Big data has been said to have five characteristics, called the five V’s: volume, velocity, variety, veracity, and valence. Now an overlapping sixth V has been added to the big data formula: value [2], as shown in Fig. 1.
Big data is a relatively new research area in applications such as network instruction and deduction, spam filtering, recommendation systems, health analytics, and sales analytics. Another challenge is to obtain accurate predictions through a machine-learning algorithm in business intelligence and data science [1,3]. Many frameworks handle large volumes of structured and unstructured data, but perhaps the two most popular are Apache Hadoop and Apache Spark. Spark is 10x faster than Hadoop because it stores data in-memory rather than by using disk storage [4]. Budgetary unpredictability models examine accurate information. Sales data can be analyzed and applied to money-related markets for better expectations. Currently, data analysis utilizes data science with machine learning (ML), which trains the computer according to models and provides better accuracy than business intelligence [5].
The intersection of big data and data mining, where knowledge is extracted from raw data, finds a relationship between the entities and then applies machine learning models to the process of making predictions and gaining knowledge for better decision-making in business intelligence and other applications.
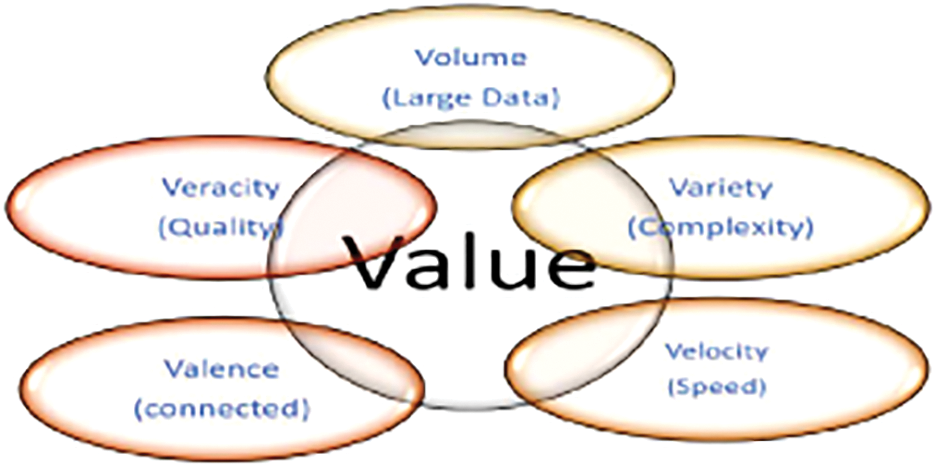
Figure 1: Characteristics of the 6 V’s of big data
Many small retailers know who their customers are and can contact them through various means to notify them of product promotions, but when sales volumes are massive, companies need to find other ways to reach customers. Large retailers like Apple, Amazon, and Walmart are now using big data analytics, data science, and business intelligence to analyze their sales and customer behavior to deliver personalized communications. In the U.S., Black Friday is the day after Thanksgiving. It is the biggest sales day of the year in the U.S. Brick-and-mortar and online retailers run special offers, deals, and discounts on countless products. One theory is that the day is called Black Friday because it is the day when many retailers come into the black for the year. Fig. 2 shows four of the main factors affecting customer purchases: customer level, store level, city level, and product level.
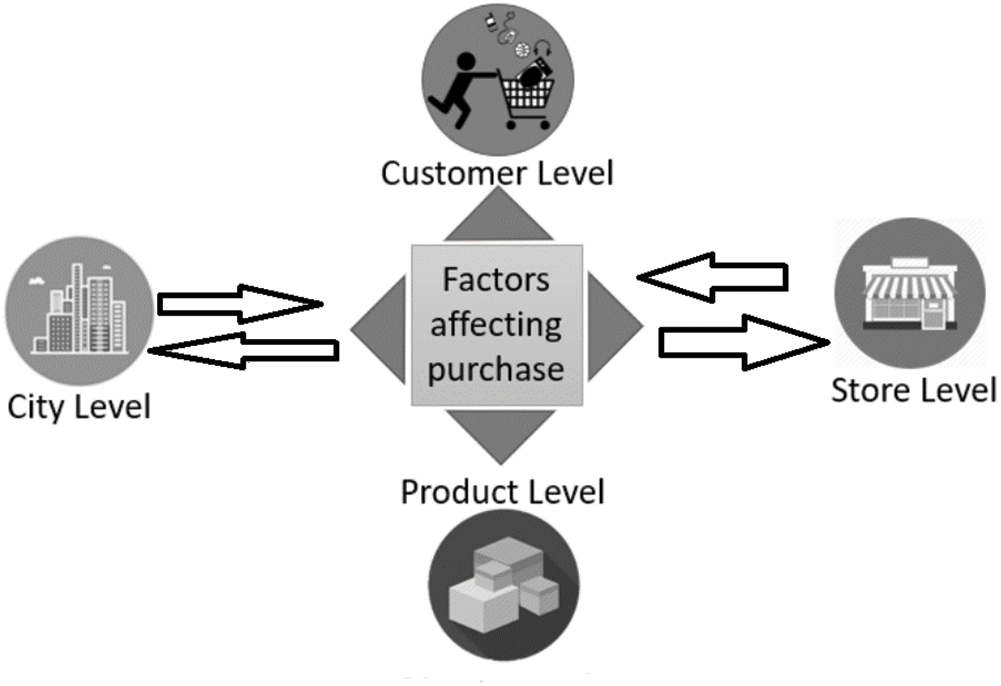
Figure 2: Factors affecting purchases on Black Friday
Machine learning is a branch of artificial intelligence that learns data from computer-based models to discover hidden insights. There are two major types of machine learning: supervised learning and unsupervised learning.
a) Supervised learning: Class labels or predictor values can be determined based on features. If the labels are continuous, then these models are said to belong to regression; if the labels are categorical, then the models are said to belong to classification.
b) Unsupervised learning: Class labels or prediction values are unknown [6].
There are many big data frameworks for handling a large volume and variety of data, and for performing real-time analysis. The Apache Spark clustered computing framework is much faster and more reliable than Apache Hadoop because of its in-memory storage and distributed computation of large datasets. Apache Spark is a framework with machine learning, real-time streaming, GraphX, and Spark SQL libraries [7], and support of programming languages such as Python, R, Java, Scala, and other third-party languages. The framework of Spark [8] is shown in detail in Fig. 3.
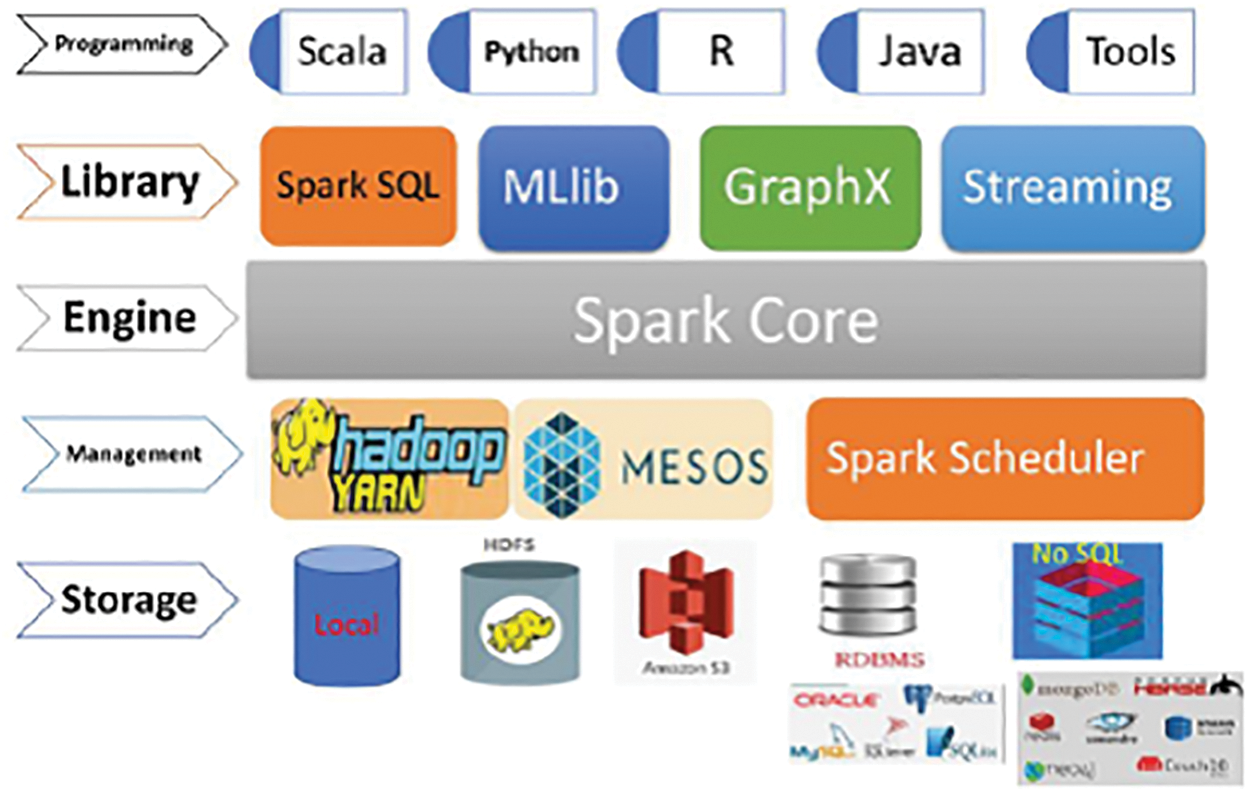
Figure 3: Spark framework
Spark is built around resilient distributed datasets (RDDs), which can be transformed, created, analyzed, and stored in any Spark program with the help of the textFile method and parallelization through SparkContext objects. The benefits of RDDs are shown in Fig. 4.
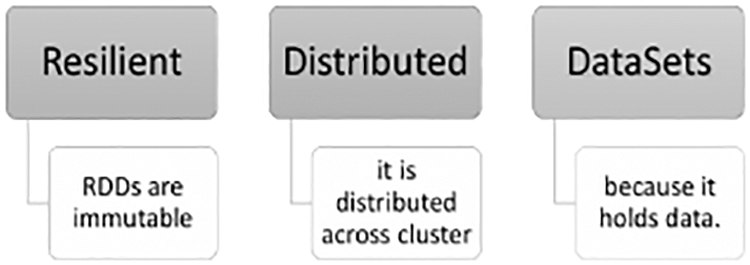
Figure 4: Benefits of RDDs
Spark has its own library, MLlib, which supports many languages and APIs. Usually, Spark has two packages of machine learning [9]: Spark MLlib, the original API build on RDDs; and Spark.ml, a new build on data frames (Spark SQL) and pipelines.
Spark machine learning has two data types: local vectors, which are in the form of sparse and dense vectors; and labeled points, which contain a class label (predictor) and a list of features [10].
Spark machine learning includes all classification, regression, and clustering models in regular machine learning [11]. Apache Spark MLlib 2.0 is an open-source, distributed, scalable, and platform-independent machine learning library [12]. MLlib runs in parallel on clusters. Moreover, it can access all machine learning models and all programming languages [13].
The rest of the paper is organized as follows. Section 2 offers a literature review. Section 3 presents a methodology with subsections on data acquisition, data exploration, data engineering, and predictive modeling. Section 4 describes the experimental results and evaluation. Section 5 contains our conclusions.
There has been relatively little research on sales prediction and forecasting. The first machine learning model was based on the forecasting tool of Support Vector Regressor (SVR) and measured the sales of computer servers through k-means clustering, where minimax similarity provides better results than other models of clustering [14]. Another paper [15] forecasts Amazon sales predictions through a statistical method for time series decomposition called ARIMA, which predicts quarterly sales. The data were collected for the period from 2000 to 2013. Errors were measured by the root-mean-squared error (RMSE) method. However, these methods carry previous data for forecasting, which is a problem. The product sales forecasting predicts browning to purchases (B2P) in e-commerce sites. However, this model browses the sites and predicts online sales based on customer browsing history, which is time consuming [16]. In this paper support vector machine (SVM) method [17] is suggested to improve a customer’s purchasing behavior based on the time spent on a specific area in a single store instead of the entire mall. The data are taken from RFID, and the accuracy of linear SVM is 81%.
There are many applications for making sales predictions in e-commerce, including recommendation systems of products, time series prediction, and online promotion of products. The work related to items [18] explored multi task-based dynamic features through a deep item network, focusing on the online advertisement of global shopping festivals presented by Alibaba. The work of online shopping [19] analyzed Chinese festivals through collaborative filtering recommendations based on the user’s online browsing behavior and purchasing behaviors to improve sales. One recent study [20] published in 2020 used behavioral analytics through big data in customer invoice payments through logistic regression and achieved an accuracy of 97%, which was useful in creating a decision support system to determine a customer’s financial stability and how much credit should be extended to them.
The related work to predicting sales through machine learning algorithms has enormous benefits for retail companies. The first work [21] used the machine learning regression model, through the use of the Boosted Decision Tree Regression module in Microsoft Azure Machine Learning Studio, to achieve 97% better performance in predicting Walmart sales when compared to time series analysis.
Over the past two decades, Black Friday has been the biggest shopping day of the year. Retail stores are overrun by crowds, and many products are deeply discounted. Patterns have emerged over time for this big shopping day. The related work [22] provided a model for predicting sales and targeting customers’ behavior through machine learning regression and neural networks. However, the paper suggested that the model still faced challenges in accuracy. In article [23], the Apriori association rule learning and set mining algorithm was used to analyze customer online buying patterns in order to design marketing strategies for future Black Fridays. In the last related work [24], market segmentation based on customer zones was performed with k means clustering using R language. The segmentation was based on age and purchases on Black Friday and helped determine buyer needs. However, in this work, data cleaning and data enrichment were not used.
Resource management is a challenging task when using the HDFS and YARN components in Hadoop 2.0 in a scalable fashion. In this paper [25], the Apache Spark big data framework showed that running distributed data analysis in the Spark MLlib could manage CPU resources and memory resources economically. Moreover, the iterative ML tasks were performed approximately 10 times faster than Hadoop for iterative schemes.
There have been a few papers on Spark machine learning. Paper [26] compared two classification algorithms, Naive Bayes and SVM, to determine the behavior of bank customers. The dataset consisted of 14 million observations. The Naive Bayes algorithm provided much better precision and recalls than SVM. Another work [27] on unstructured data sentiment analysis of online customers’ reviews used the Spark ML library on three models: Naive Bayes, SVM, and logistic regression. Here, the accuracy of SVM was 86% higher than Naive Bayes and logistic regression, but the study did not use an n-gram sentiment analysis model and did not handle structured data.
Another paper [28] was related to our algorithm, but its focus was on a shared bicycle rental system where data was collected from riding information on three Spark ML models using linear regression, which had a better RMSE than the decision tree and random forest methods. The work on song year prediction used three Spark ML models (linear regression, random forest, and gradient boosted trees) and obtained better results as compared to one node [29].
This paper focuses on real-time streaming with Spark MLlib linear regression and the open source Massive Online Analysis (MOA) software environment for data streaming. The linear regression model showed better execution per minute than MOA [30].
Another paper used Spark ML and Spark MLlib to predict breast cancer [31]. In a comparative study of predicting churn of potential banking customers, Spark ML achieved better results than Spark MLlib [32]. The work, which combined the machine learning approach and the deep learning model’s long short-term memory (LSTM) achieved better accuracy (94%) in binary and multiclass problems. The proposed big data framework using Spark machine learning [33] was able to better process computation and complexity. In the latest paper [34] published in 2020, the author applied various machine learning models but not through a big data framework. The rule-based decision tree obtained an RMSE of 2291 far better than the linear model.
However, the results of the above studies suggest that there is a need to calculate customers’ purchases and the number of customers against various products and product preferences based on different variables. Moreover, there is a need to analyze customer behavior to create a personalized offer to customers for purchasing specific products during Black Friday sales, particularly during the COVID-19 pandemic, using the big data framework using the Spark ML package.
Our research goal was to build a system that recommends to customers what they usually buy based on historical data. Moreover, it will help decision makers, data analysts, and data scientists to see the popularity of product categories through other categories such as the customers’ city/states, age groups, and gender types. In this way, they can plan future sales, promotions, and extended product lines.
We first used the process of data acquisition, then applied exploratory data analysis (EDA). The next step was to perform data engineering, in the forms of data preprocessing and data cleaning, to handle missing values in the datasets. Finally, we built the machine learning models, both with and without the big data Spark ML package.
After understanding of business and its objectives, the extracted data is the stage of data acquisition.
3.2 Exploratory Data Analysis (EDA)
One of the critical stages of business intelligence and data science is data exploration or data visualization. Through these processes, we can see actually what the datasets show and whether specific kinds of features are essential. The features that helped us in model building are listed below.
a) First, we see the correlation of the number of purchases by different categories or the affinity between other variables. Here we are interested in purchases with other variables. Accordingly, values are correlated if they were closest to 1 or −1. Fig. 5. displays the covariance through a heatmap.
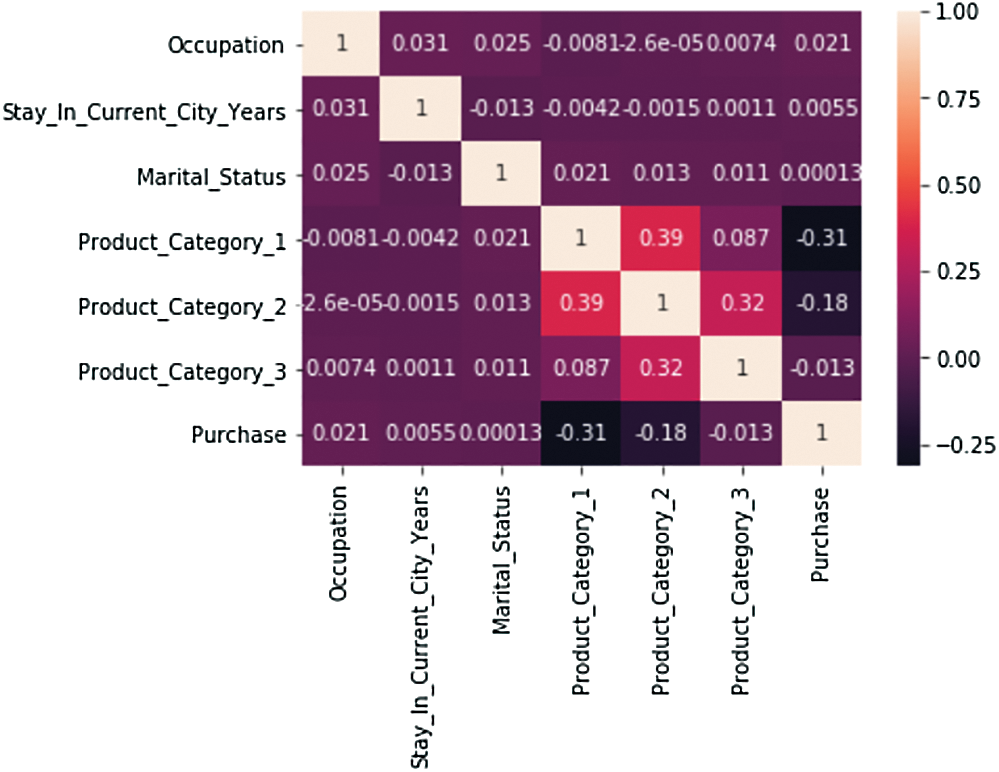
Figure 5: Covariance of various features through heatmap
b) Fig. 6 below is a graph that shows the various purchase distributions with a maximum of 15 buyers.
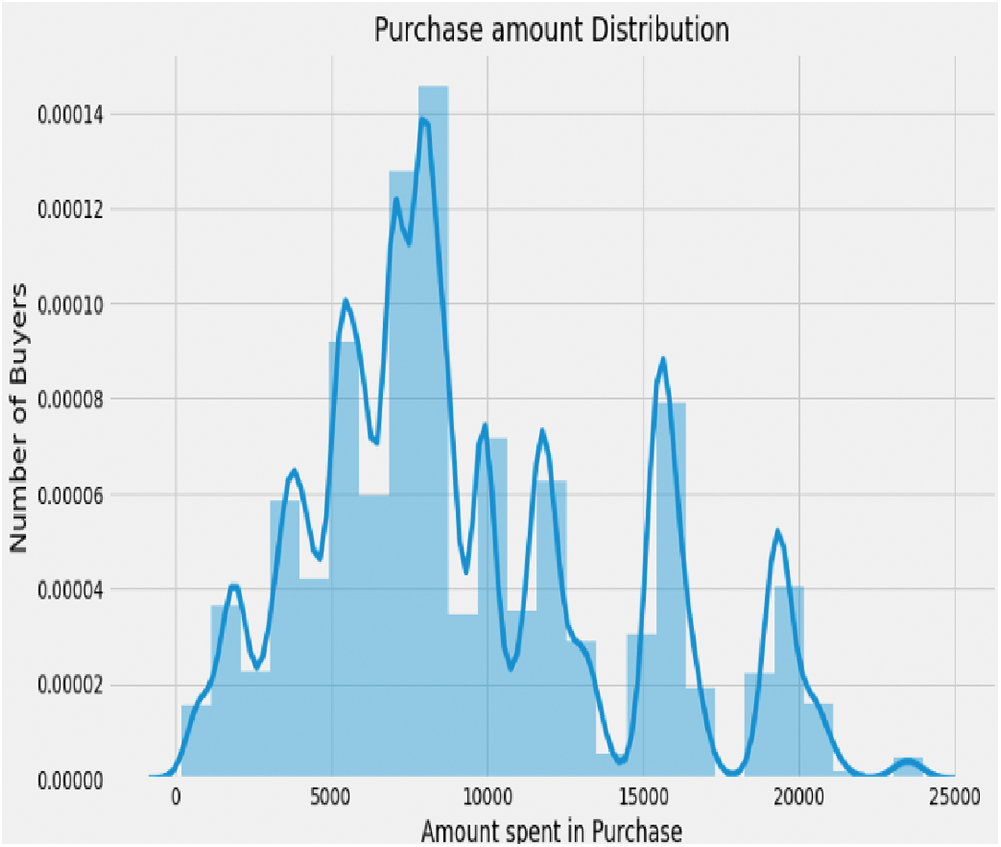
Figure 6: Purchase distribution graph: X-axis represents the amount spent on purchases; Y-axis represents the number of buyers
c) Fig. 7 below shows that far fewer females took part in Black Friday sales, or we can say that payments were made by males instead of females.
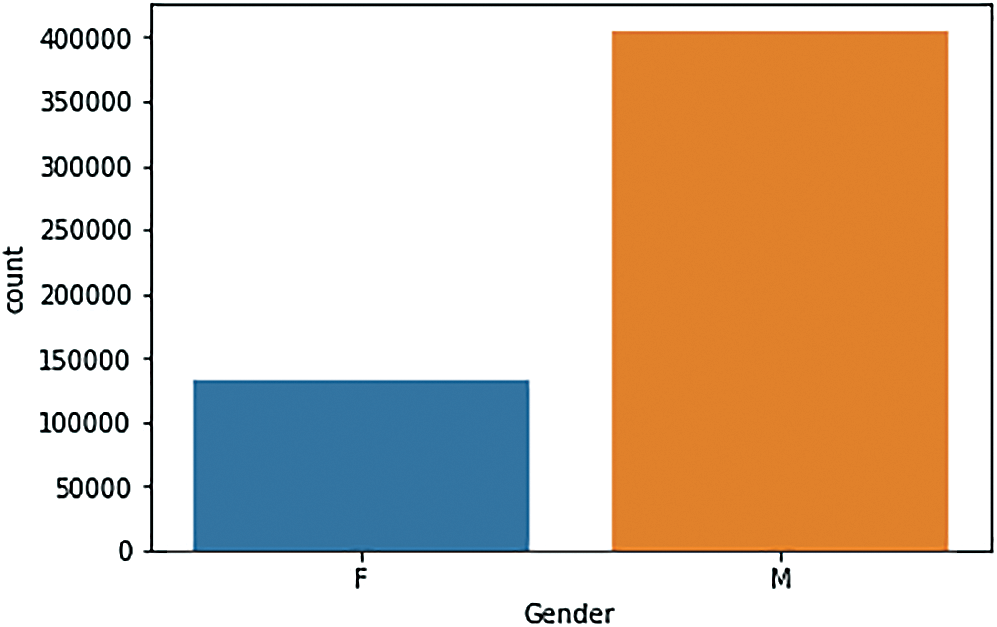
Figure 7: Sales by gender
d) Fig. 8 shows that the age group between 26 and 35 were the most interested in purchases.
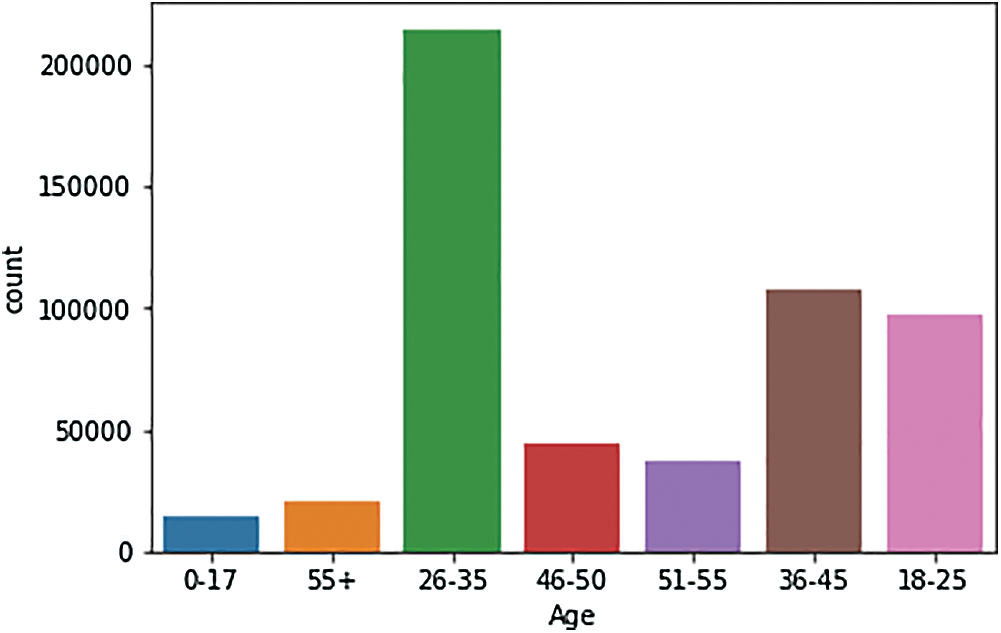
Figure 8: Analysis of sales, by age
e) Fig. 9 shows that when gender is combined with marital status, sales were still dominated by males, although that was less true for the age group of 46–55.
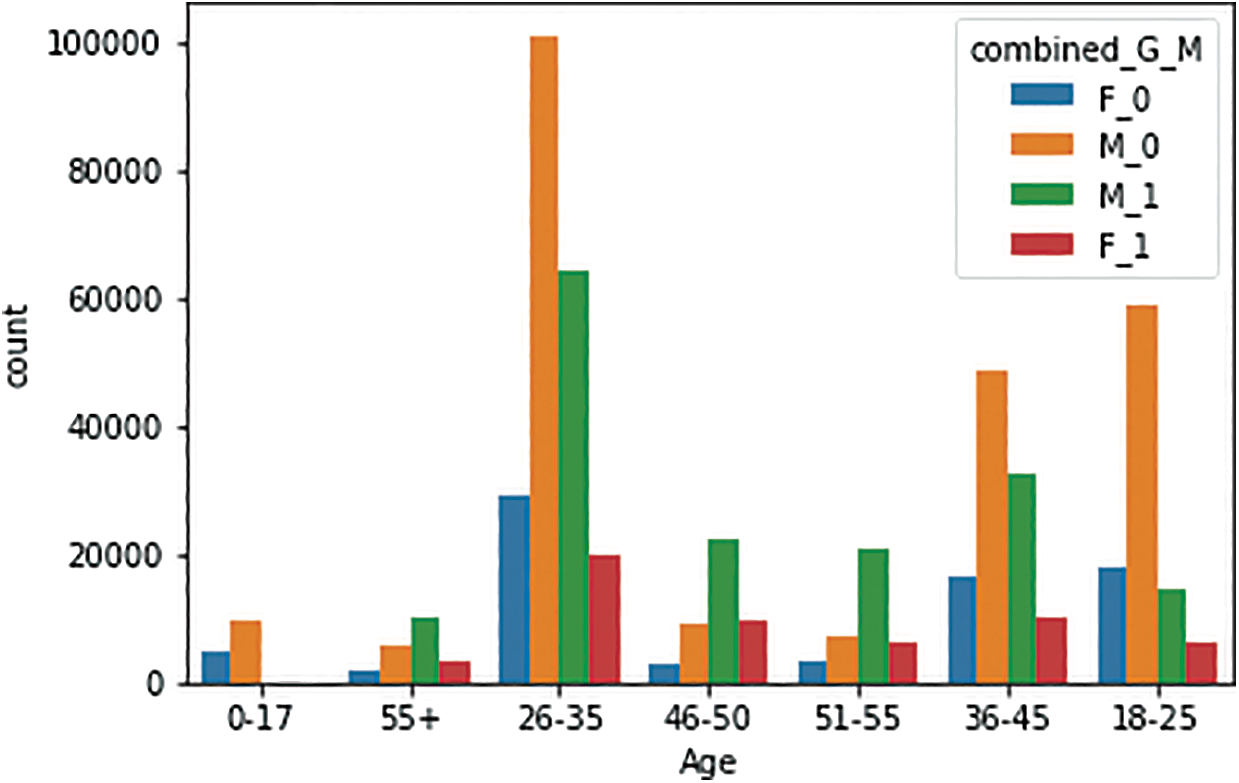
Figure 9: Histogram of the distributions of various age groups of males and females
f) Fig. 10 shows product category 1 purchases with a maximum sale price of nearly $20,000.
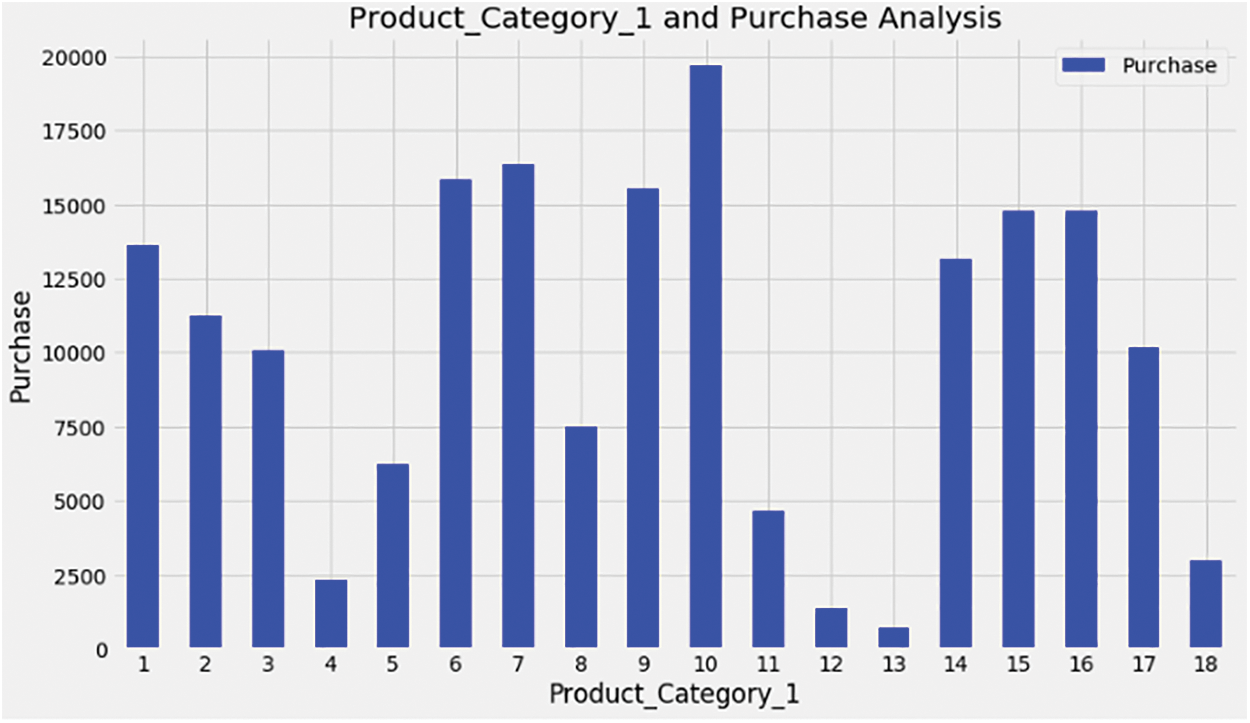
Figure 10: Product_Cateogory 1 sales
g) Fig. 11 shows the breakdown of purchases by males and females regarding product category 2
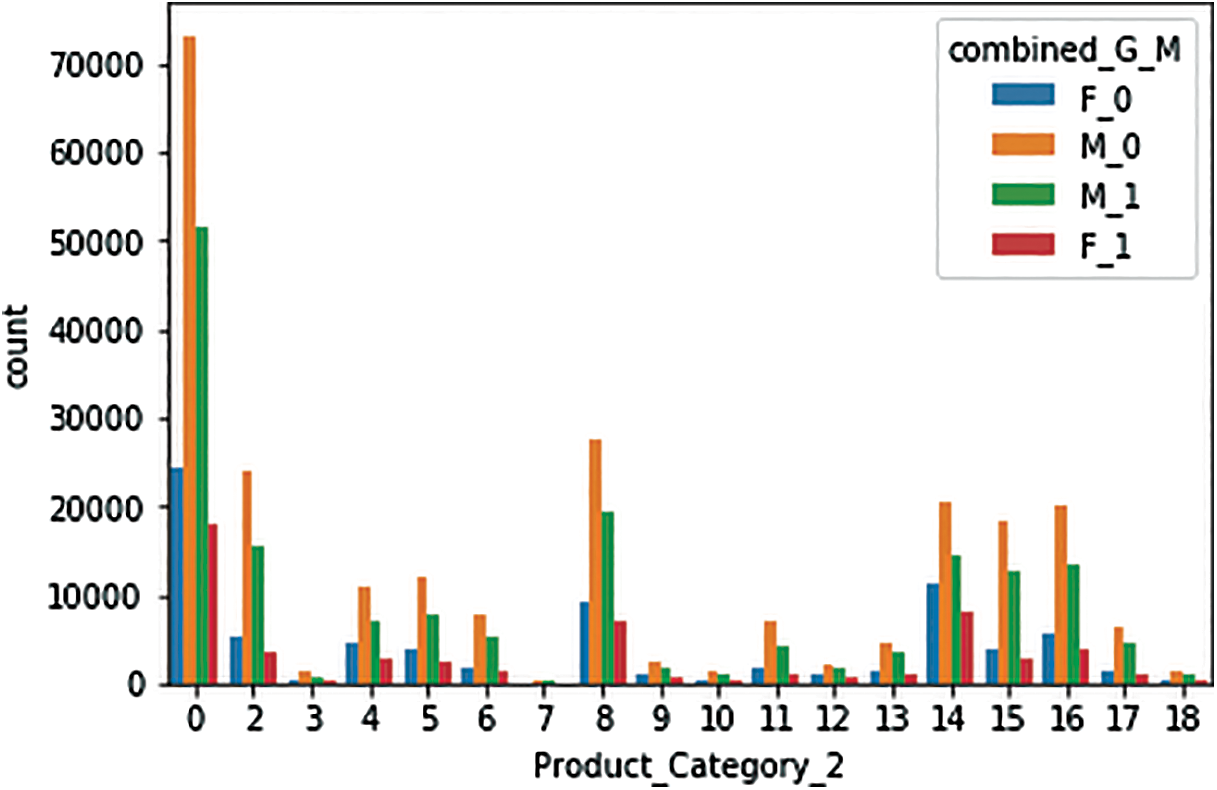
Figure 11: Product Category 2 sales, by gender
h) Fig. 12 shows the purchases, by gender, regarding product category 3
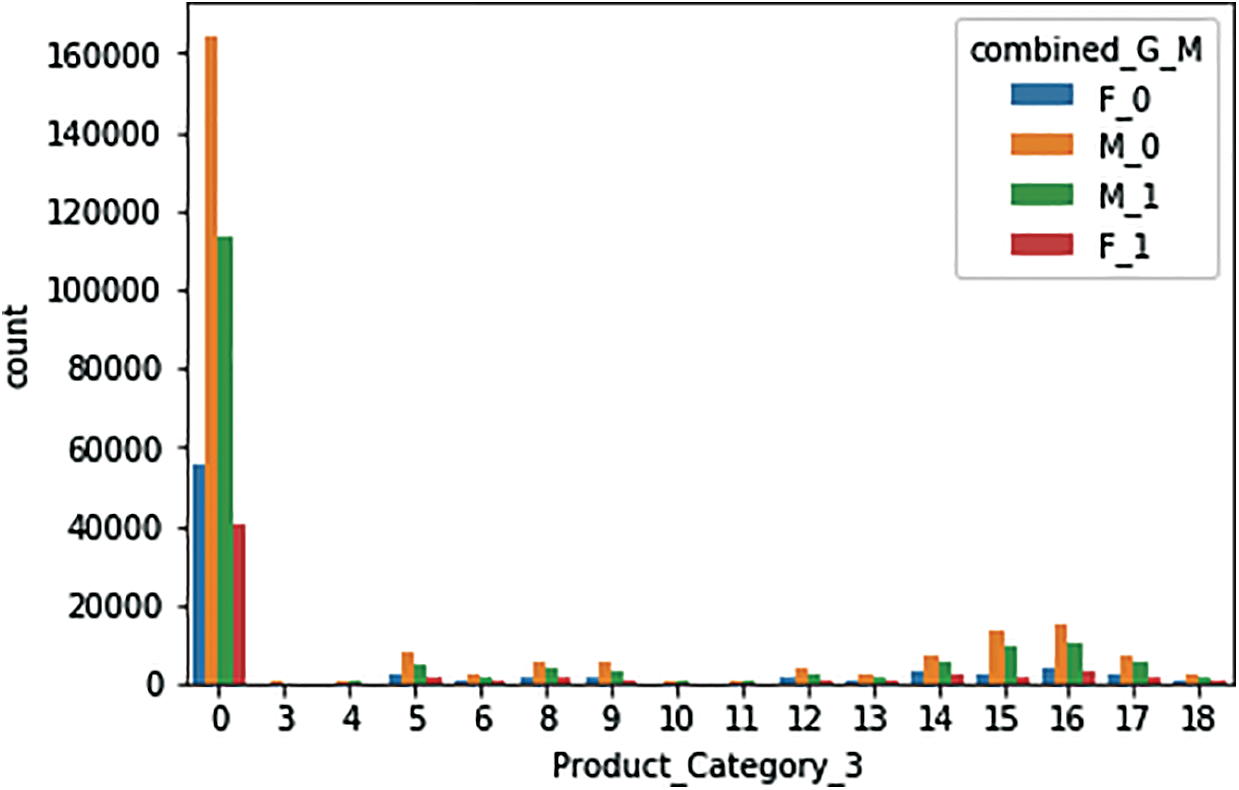
Figure 12: Product Category 3 sales, by gender
i) Fig. 13 shows that city region B has the most sales for the 18–50 age group.
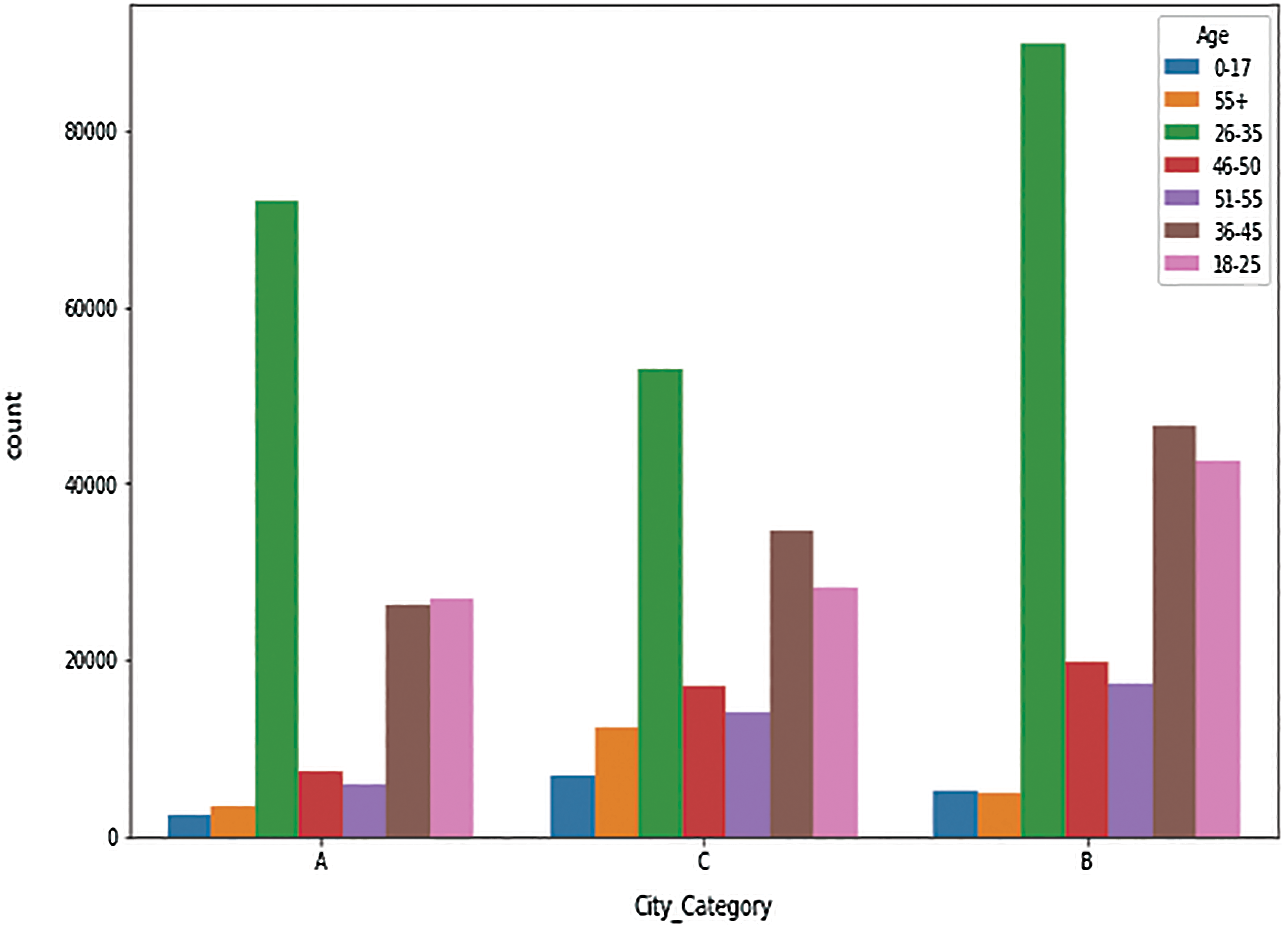
Figure 13: Sales by city category
Data engineering is an essential step in all fields related to data. We applied data cleaning based on missing values and used various transformation methods.
There are four steps performed during data engineering:
1. Data preprocessing is an essential step for business intelligence and data science applications. Product category 2 and product category 3 have missing values. There are many imputation methods to calculate the missing values. Here, we fill the missing values with the mean of product category two and product category 3
2. Then, we apply the transform-to-numeric function to gender, marital status, and city category, which have non-numeric values, and convert into afloat.
3. The Spark ML has features of the dense local vector, where we passed the variable of the class and others feature and then map to the RDD.
4. Before going into machine learning models, we first need a data frame, which is built on Spark SQL. The objective of Spark SQL is to convert the dataset into a data frame. Accordingly, there is a need for another transformation into a labeled point function. Here we applied feature engineering based on the correlation among variables.
The five steps of our model are shown in Fig. 14.
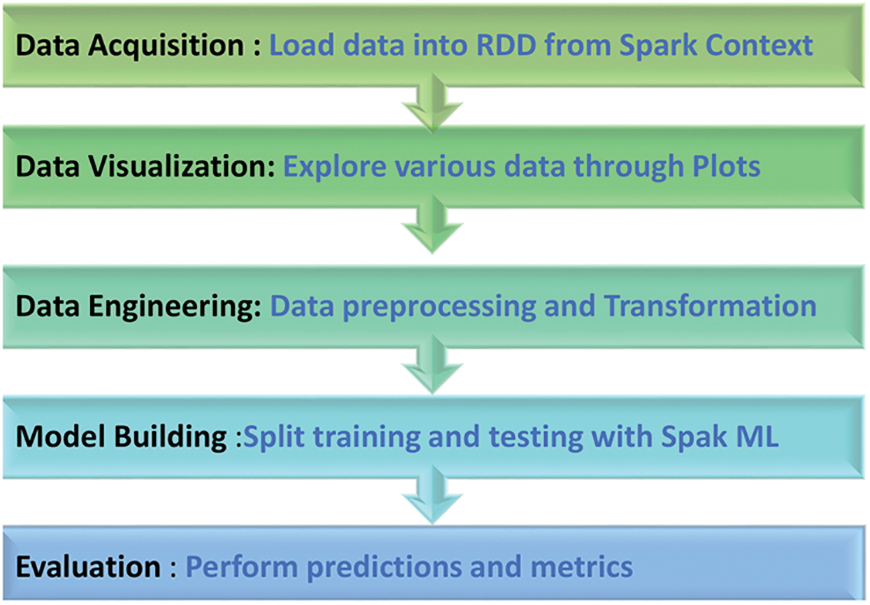
Figure 14: Process of big data analytics for sales predictions
Next, we randomly split the data into two portions, with 80% for the training sets and 20% for the test set. We applied the linear regression model from the Scikit-learn library and then from the PySpark ml API, where the maximum number of iterations is 10. Next, we built the model on the random forest in Scikit-learn and then PySpark. The overall process is shown in Fig. 15.
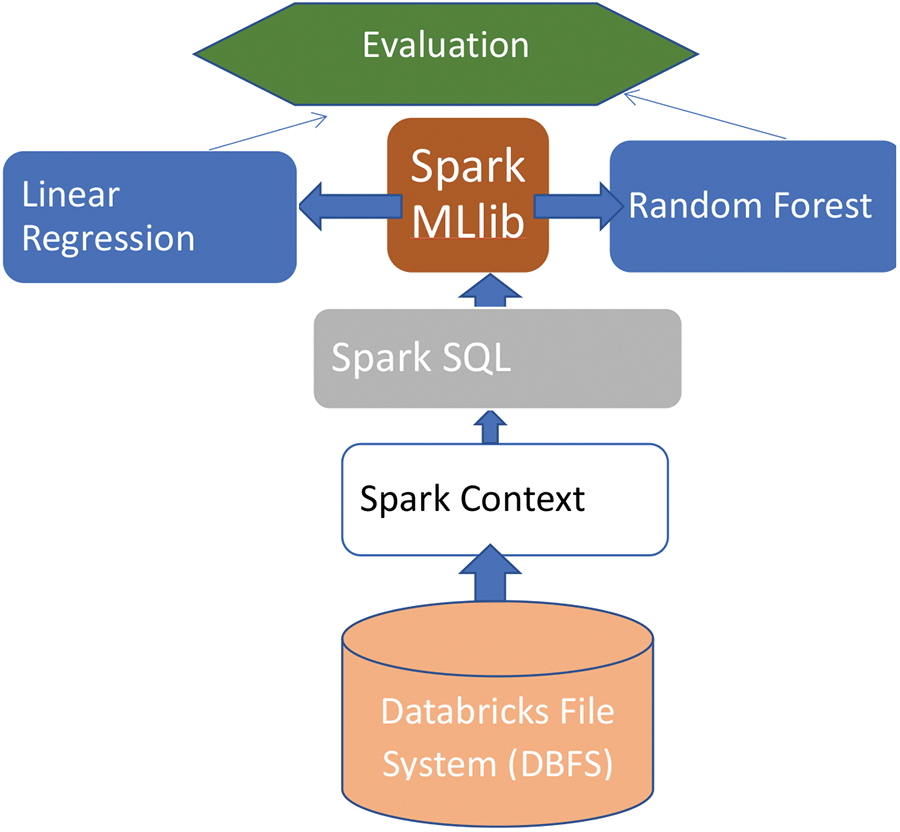
Figure 15: Architecture of our proposed model with Spark ML random forest and linear regression
There are many evaluation measurements for accuracy and computation time, including precision, recall, F measure, and confusion matrix. Because the data are continuous, we are importing a regression evaluator from Spark ML, including sum of squares error (SSE), RMSE, and R-squared (R2). Here, we measured linear regression with R2, and measured random forest through precision. The accuracy of our model is shown in the bar graph in Fig. 16.
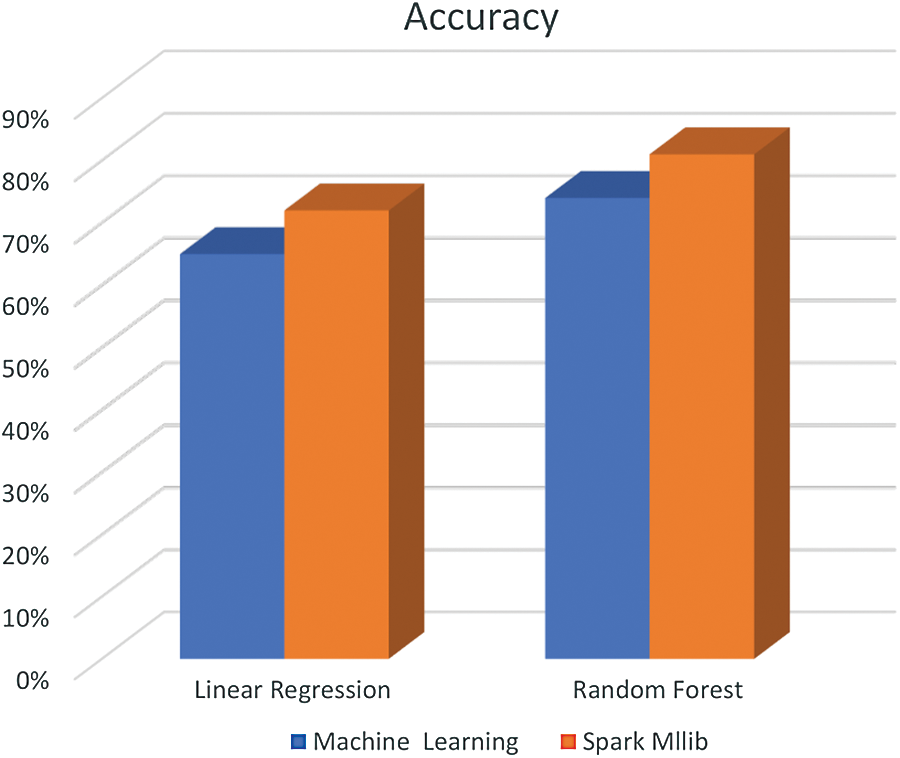
Figure 16: Bar chart of accuracies of machine learning without Spark and with Spark MLlib in the linear regression and random forest models
We applied two Spark MLlib models on data bricks. The linear regression model offered 72% accuracy, as compared to Scikit machine learning, which offered 68% accuracy. The random forest model provided 81% accuracy on Spark, while single node machine learning offered only 74% accuracy. The results are shown in Tab. 1.
Table 1: Evaluation results of machine learning vs. Spark MLlib for linear regression and random forest

In this paper, we have presented two machine learning models, linear regression and random forest, which are regarding regression of Black Friday sales data. The dataset has 0.55 million observations, 10 features, and one predictor of purchases and sales. In our proposed work, we used the big data framework Apache Spark due to the large volume of data. Spark has two packages of machine learning, Spark MLlib and Spark ML. After applying linear regression and random forest, our accuracy increased as compared to a single node computer of machine learning on the same datasets. The aim of the research is to help the decision-makers in retail stores and online shopping websites plan for promotions for their customers and attract new customers. In the future, we will use a deep learning model with long short-term memory (LSTM) and real-time Spark streaming to predict sales.
Funding Statement: This research did not receive any specific grant from funding agencies in the public, commercial, or not-for-profit sectors.
Conflicts of Interest: The authors declare that they have no conflicts of interest to report regarding the present study.
1. M. H. Rehman, C. S. Liew, A. Abbas, P. P. Jayaraman, T. Y. Wah et al. (2016). , “Big data reduction methods: A survey,” Data Science and Engineering, vol. 1, no. 4, pp. 265–284. [Google Scholar]
2. A. Gani, A. Siddiqa., S. Shamshirband and F. Hanum. (2016). “A survey on indexing techniques for big data: Taxonomy and performance evaluation,” Knowledge and Information Systems, vol. 46, no. 2, pp. 241–284. [Google Scholar]
3. C. Amato, L. Candela, D. Castelli, A. Esuli, F. Falchi et al. (2018). , “How data mining and machine learning evolved from relational data base to data science,” in S. Flesca et al. (eds.A Comprehensive Guide Through the Italian Database Research Over the Last 25 Years, New York City, Springer International Publishing, pp. 287–306. [Google Scholar]
4. Z. Han and Y. Zhang. (2015). “Spark: A big data processing platform based on memory computing,” in Parallel Architectures, Algorithms and, Programming (PAAPSeventh International Symposium, Nanjing, pp. 172–176. [Google Scholar]
5. H. Chen, R. H. Chiang and V. C. Storey. (2012). “Business intelligence and analytics: From big data to big impact,” MIS Quarterly, vol. 36, no. 4, pp. 1165–1188. [Google Scholar]
6. M. I. Jordan and T. M. Mitchell. (2015). “Machine learning: Trends, perspectives, and prospects,” Science, vol. 349, no. 6245, pp. 255–260. [Google Scholar]
7. S. Salloum, R. Dautov, X. Chen, P. X. Peng and J. Z. Huang. (2016). “Big data analytics on apache spark,” International Journal of Data Science and Analytics, vol. 1, no. 3–4, pp. 145–164. [Google Scholar]
8. Y. M. B. Senousy, N. E. K. Mohamed and A. E. D. M. Riad. (2018). “Recent trends in big data analytics towards more enhanced insurance business models,” International Journal of Computer Science and Information Security, vol. 30111817, pp. 39–45. [Google Scholar]
9. J. K. Bradley. (2015). “Practical machine learning pipelines with mllib,” Spark Summit East, vol. 1, pp. 15–22. [Google Scholar]
10. D. Siegal, J. Guo and G. Agrawal. (2016). “Smart-MLlib: A high-performance machine-learning library,” in Cluster Computing (CLUSTER2016 IEEE International Conference, IEEE, Taipei, pp. 33345. [Google Scholar]
11. X. Meng, J. Bradley, B. Yavuz, E. Sparks, S. Venkataraman et al. (2016). , “Mllib: Machine learning in apache spark,” Journal of Machine Learning Research, vol. 17, no. 1, pp. 1235–1241. [Google Scholar]
12. M. Assefi, E. Behravesh, G. Liu and A. P. Tafti. (2017). “Big data machine learning using apache spark mllib,” in Big Data IEEE International Conference, Boston, pp. 3492–3498. [Google Scholar]
13. H. K. Omar and A. K. Jumaa. (2019). “Big data analysis using apache spark mllib and hadoop HDFS with scala and java,” Kurdistan Journal of Applied Research, vol. 4, no. 1, pp. 7–14. [Google Scholar]
14. W. Dai, Y. Y. Chuang and C. J. Lu. (2015). “A clustering-based sales forecasting scheme using support vector regression for computer server,” Procedia Manufacturing, vol. 2, pp. 82–86. [Google Scholar]
15. J. H. Yu and X. J. Le. (2016). “Sales forecast for amazon sales based on different statistics methodologies,” in DEStech Transactions on Economics, Business and Management, Joint International Conference on Economics and Management Engineering (ICEME 2016) and International Conference on Economics and Business Management (EBM 2016Wuhan. [Google Scholar]
16. J. Yeo, S. Kim, E. Koh, S. W. Hwang and N. Lipka. (2016). “Browsing2purchase: Online customer model for sales forecasting in an e-commerce site,” in Proceedings of the 25th International Conference Companion on World Wide Web, Canada, pp. 133–134. [Google Scholar]
17. Y. Zuo, K. Yada and A. S. Ali. (2016). “Prediction of consumer purchasing in a grocery store using machine learning techniques,” in Computer Science and Engineering (APWC on CSE) 3rd Asia-Pacific World Congress, Nadi, pp. 18–25. [Google Scholar]
18. S. Xin, M. Ester, J. Bu, C. Yao, Z. Li et al. (2019). , “Multi-task-based sales predictions for online promotions,” in Proceedings of the 28th ACM International Conference on Information and Knowledge Management, Beijing, pp. 2823–2831. [Google Scholar]
19. M. Zeng, H. Cao, M. Chen and Y. Li. (2019). “User behaviour modeling, recommendations, and purchase prediction during shopping festivals,” Electronic Markets, vol. 29, no. 2, pp. 263–274. [Google Scholar]
20. M. Bahrami, B. Bozkaya and S. Balcisoy. (2020). “Using behavioral analytics to predict customer invoice payment,” Big Data, vol. 8, no. 1, pp. 25–37. [Google Scholar]
21. C. Catal, K. Ece, B. Arslan and A. Akbulut. (2019). “Benchmarking of regression algorithms and time series analysis techniques for sales forecasting,” Balkan Journal of Electrical and Computer Engineering, vol. 7, no. 1, pp. 20–26. [Google Scholar]
22. C. S. M. Wu, P. Patil and S. Gunaseelan. (2018). “Comparison of different machine learning algorithms for multiple regression on black friday sales data,” in IEEE 9th International Conference on Software Engineering and Service Science (ICSESSBeijing, pp. 16–20. [Google Scholar]
23. P. D. Hung, N. D. Ngoc and T. D. Hanh. (2019). “K-means clustering using R.A. case study of market segmentation,” in Proceedings of the 5th International Conference on E-Business and Applications, Bangkok, pp. 100–104. [Google Scholar]
24. M. Maharjan. (2019). “Analysis of consumer data on black friday sales using apriori algorithm,” SCITECH Nepal, vol. 14, no. 1, pp. 1–17. [Google Scholar]
25. K. Aziz, D. Zaidouni and M. Bellafkih. (2019). “Leveraging resource management for efficient performance of Apache Spark,” Journal of Big Data, vol. 6, no. 1, pp. 1–23. [Google Scholar]
26. W. Etaiwi, M. Biltawi and G. Naymat. (2017). “Evaluation of classification algorithms for banking customer’s behavior under Apache Spark Data Processing System,” Procedia Computer Science, vol. 113, pp. 559–564. [Google Scholar]
27. S. Al-Saqqa, G. Al-Naymat and A. Awajan. (2018). “A large-scale sentiment data classification for online reviews under Apache Spark,” Procedia Computer Science, vol. 141, pp. 183–189. [Google Scholar]
28. Z. Kang, Y. Zuo, Z. Huang, F. Zhou and P. Chen. (2017). “Research on the forecast of shared bicycle rental demand based on spark machine learning framework,” in Distributed Computing and Applications to Business, Engineering and Science (DCABES16th International Symposium, Anyang, pp. 219–222. [Google Scholar]
29. P. Mishra, R. Garg, A. Kumar, A. Gupta and P. Kumar. (2016). “Song year prediction using apache spark,” in International Conference on Advances in Computing, Communications and Informatics (ICACCIJaipur, pp. 1590–1594. [Google Scholar]
30. B. Akgün and S. G. Öğüdücü. (2015). “Streaming linear regression on spark mLlib and MOA,” in International Conference on Advances in Social Networks Analysis and Mining (ASONAMIEEE/ACM, Paris, pp. 1244–1247. [Google Scholar]
31. P. D. Hung, T. D. Hanh and V. T. Diep. (2018). “Breast cancer prediction using spark mllib and ml packages,” in Proceedings of the 5th International Conference on Bioinformatics Research and Applications, Hong Kong, pp. 52–59. [Google Scholar]
32. H. Sayed, M. A. Abdel-Fattah and S. Kholief. (2018). “Predicting potential banking customer Churn using Apache Spark ML and MLlib packages: A Comparative Study,” International Journal of Advanced Computer Science and Applications, vol. 9, no. 11, pp. 674–677. [Google Scholar]
33. M. A. Khan, M. Karim and Y. Kim. (2018). “A two-stage big data analytics framework with real world applications using spark machine learning and long short-term memory network,” Symmetry, vol. 10, no. 10, pp. 485. [Google Scholar]
34. A. Armel and D. Zaidouni. (2019). “Fraud detection using apache spark,” in 5th International Conference on Optimization and Applications (ICOAKenitra, pp. 1–6. [Google Scholar]
 | This work is licensed under a Creative Commons Attribution 4.0 International License, which permits unrestricted use, distribution, and reproduction in any medium, provided the original work is properly cited. |