DOI:10.32604/iasc.2021.014765
| Intelligent Automation & Soft Computing DOI:10.32604/iasc.2021.014765 | |
| Article |
Threshold Parameters Selection for Empirical Mode Decomposition-Based EMG Signal Denoising
1Department of Biomedical Engineering and Sciences, School of Mechanical and Manufacturing Engineering, National University of Sciences and Technology (NUST), Islamabad, 44000, Pakistan
2Department of Computer Science and Information, College of Science in Zulfi, Majmaah University, Al-Majmaah, 11952, Saudi Arabia
*Corresponding Author: Asim Waris. Email: asim.waris@smme.nust.edu.pk
Received: 14 October 2020; Accepted: 03 January 2021
Abstract: Empirical Mode Decomposition (EMD) is a data-driven and fully adaptive signal decomposition technique to decompose a signal into its Intrinsic Mode Functions (IMF). EMD has attained great attention due to its capabilities to process a signal in the frequency-time domain without altering the signal into the frequency domain. EMD-based signal denoising techniques have shown great potential to denoise nonlinear and nonstationary signals without compromising the signal’s characteristics. The denoising procedure comprises three steps, i.e., signal decomposition, IMF thresholding, and signal reconstruction. Thresholding is performed to assess which IMFs contain noise. In this study, Interval Thresholding (IT), Iterative Interval Thresholding (IIT), and Clear Iterative Interval Thresholding (CIIT) techniques have been explored for denoising of electromyography (EMG) signals. The effect of different thresholding operators, i.e., SOFT, HARD, and Smoothly Clipped Absolute Deviation (SCAD), on the performance of EMD-based EMG denoising techniques is also investigated. 15 EMG signals, recorded from the upper limb of 5 healthy subjects, were used to identify the best possible combination of thresholding technique and thresholding operator for denoising EMG signals. The performance of denoising techniques is assessed by calculating the Signal to Noise (SNR) ratio of the signals. The results are further evaluated using a two-way Analysis of Variance (ANOVA) statistical test. The results demonstrated that the mean SNR values yielded by the IIT thresholding technique outperform the IT thresholding technique (P-value < 0.05), but there is no significant difference in mean SNR values of IIT and CIIT techniques (P-value = 0.9951). For thresholding operators, there is no significant difference in mean SNR values of the HARD and SOFT operator (P-value = 0.0968), whereas the HARD operator outperforms SCAD (P-value < 0.05). It has also shown that the combination of IIT thresholding with SOFT operator and threshold value equal to half of the universal threshold denoise the EMG signals while preserving the original signal’s characteristics. IIT-based EMD denoising technique with HARD thresholding operator yields the highest SNR, irrespective of the level of noise embedded in the signal. Whereas IIT with SOFT operator provides comparable SNR and successfully preserves the shape of EMG signals. The identified combination of thresholding technique and thresholding operator can eliminate various noises embedded in EMG signals.
Keywords: Electromyography; empirical mode decomposition; thresholding; wavelet transform
The electrophysiological response of motor units from a group of muscles is indicated by electromyography (EMG) recording, a collective electrical manifestation of a contracting muscle. The nervous system controls the motor units generating EMG signals. The recorded EMG, also known as a myoelectric signal, is used for rehabilitation, prosthetic, and clinical diagnostic applications [1]. Concentric needle electrodes or surface electrodes are used to acquire and record EMG signals. The former approach is invasive and employed to diagnose myopathic and neurogenic nature’s neuromuscular disorders, which implies that merely the muscle tissues are damaged, and nerves responsible for muscle activation are affected [2]. While the latter technique is non-invasive and has applications in prosthetics, rehabilitation, hand gesture recognition, rehabilitation robotics, and exoskeletons [3,4]. For an appropriate interpretation of EMG signals for investigating muscle activity, the prerequisite is to acquire a clean EMG signal. Like other physiological measurements, EMG recordings are contaminated with different types of noises, i.e., Baseline Wandering (BW) or motion artifacts, White Gaussian Noise (WGN), and Power Line Interference (PLI) [5]. Therefore, the identification of actual and real EMG signal remains a difficult and challenging task.
The efficacy of the EMG signals may be compromised due to the contamination of the noise. Various frameworks have been proposed to denoise EMG signals. For EMG noise removal, conventional digital filters are the efficient and most straightforward solution [6]. Waris et al. [7] utilized a low pass digital Butterworth filter to remove motion artifacts and BW from surface EMG signals along with a digital notch filter to get rid of PLI. In another study, Waris et al. [8] utilized a bandpass digital Butterworth filter to eliminate motion artifacts from intramuscular EMG signals. Similarly, Subathra et al. [9] used a band filter to denoise electroglottography (EGG) signals for voice pathology detection. In [10], the authors’ utilized a bandpass filter to eliminate motion artifacts from electroencephalogram (EEG) signals. Due to the spectral overlap of EMG signal and noise, digital filters attenuate the original EMG signal along with substantial noise reduction. Fourier analysis-based EMG denoising techniques are also widely used; however, the result is the same; an attenuated EMG signal with reduced noise [11]. Reduction of noise without any significant distortion of EMG signal remains the challenge. Nonlinear and adaptive filtering techniques minimally sacrifice parts of EMG signals while reducing noise substantially [12]. Due to better time-frequency representation, the wavelet analysis has also been used to minimize the effect of noise from EMG signals [13]. The problem with wavelet-based approaches is the wavelet function’s pre-selection, which does not match EMG signals’ natural frequency. More advanced techniques might reduce noise from the EMG signal without any attenuation in the original signal. Another mathematical approach, similar to the wavelet-based method, to deal with nonlinear and nonstationary signals, known as Empirical Mode Decomposition (EMD), can be utilized to analyze and denoise EMG recordings [14]. Unlike conventional and wavelet-based filtering techniques, no prior assumptions are assumed by EMD throughout the overall procedure [14]. Zhang et al. [15] conducted a comparative study for denoising of EMG signals and showed that the EMD denoising technique performs better than conventional filtering techniques. Similarly, Andrade et al. [16] showed that EMD outperforms wavelet-based denoising techniques for filtration of EMG signals.
Huang et al. [17] put forward the algorithm of EMD, which is a fully adaptive, data-driven, and time-frequency technique for analysis and decomposition of nonstationary signals. In EMD, the signal is not decomposed in terms of basic atoms like the mother wavelet. However, a sifting process is employed to decompose a signal. The sifting process in EMD is adaptive, data-driven, and makes no assumptions about the signal. Intrinsic mode functions (IMF) are yielded because of the sifting process. These IMFs are frequency and amplitude modulated time series oscillations of processed signal with zero means [17]. Due to the distinct time scale frequencies of the IMFs, some IMFs may contain the signal’s noise. The denoising of the input signal proposed by EMD takes the benefit of this property to reduce noise. EMD-based EMG denoising techniques comprise three steps, i.e., signal decomposition, IMF thresholding, and signal reconstruction [16]. The reconstructed signal is the denoised version of the original noisy signal.
The most crucial step in EMD-based signal denoising techniques is the thresholding of IMFs. After decomposing the original noisy signal into its subsequent IMFs, the task is to identify which IMFs contain noise and portions of the original signal. For the selection of IMFs with noise, the thresholding procedure is applied [18]. Various thresholding techniques, inspired by wavelet thresholding techniques, are utilized to figure out the noisy IMFs. Specifically, for EMD-based denoising techniques, Kopsinis et al. [18] introduced Interval Thresholding (IT), Iterative Interval Thresholding (IIT), and Clear Iterative Interval Thresholding (CIIT) thresholding techniques. Kopsinis et al. [19] also reported that the direct utilization of wavelet-based thresholding methods could not provide the desired results. Along with various thresholding techniques, the denoising performance of EMD is greatly affected by thresholding operators [18,19]. Three types of thresholding operators are widely used, i.e., SOFT, HARD, and Smoothly Clipped Absolute Deviation (SCAD) [20,21]. The detailed mathematical description of thresholding techniques and operators is discussed in Section 2. Xi et al. [22] used the IIT thresholding technique along with the SOFT thresholding operator to denoise EMG signals with EMD and reported that SOFT-IIT EMD-based denoising technique resulted in the elimination of a significant portion of noise while providing a high signal to noise (SNR) ratio. SNR is a widely used performance metric to assess the performance of signal denoising techniques. Naji et al. [23] eliminated ECG contamination from surface EMG signals using EMD, compared performance with digital high pass Butterworth filter and showed that EMD outperforms in eliminating noise from EMG signals. Mengying et al. [24] used EMD to denoise EMG signals for the classification of neuromuscular disorders and showed that EMD enhances the classification results by minimizing the effect of unwanted noise in the recorded EMG signals. Several other studies have investigated the efficacy and performance of EMD based denoising techniques to remove noise from EMG signals [21–27]. Due to the availability of different thresholding operators and thresholding techniques, it is unclear which combination of thresholding operator and thresholding technique and EMD yields the best denoising results.
Various studies have already explored the capabilities of EMD-based EMG signal denoising techniques; however, no study has ever investigated the effect of different thresholding methods and thresholding operators on the performance of EMD for the denoising of EMG signals. The main contributions of this study are:
1. To explore the effect of different thresholding techniques (IT, IIT, and CIIT)
2. To explore the effect of different thresholding operators (SOFT, HARD, and SCAD), and
3. To explore the effect of threshold value on the performance of EMD to denoise EMG signals.
The study’s findings will help to select the best possible combination of thresholding operator and thresholding technique for EMD-based EMG denoising technique for enhanced denoising results. Also, the statistical significance of the generated results yielded from EMD-based EMG denoising techniques is reported. In this study, the results are validated using the Analysis of Variance (ANOVA) statistical test and Tuckey’s Honest posthoc test for multiple comparisons. Finally, the best possible combination of thresholding technique and thresholding operator for the denoising of EMG signals based on EMD is proposed to reduce the noise contamination to provide higher SNR substantially.
The rest of the paper is summarized as; the prior knowledge about EMD, thresholding techniques, and the information about the adopted methodology is described in Section 2. The findings of the study are reported in Section 3. Section 4 discusses the results and their statistical significance. The concluding remarks of the study are presented in Section 5.
2.1 Empirical Mode Decomposition
An adaptive method introduced for analyzing nonstationary and nonlinear signals is Empirical Mode Decomposition (EMD). Theoretically, EMD is similar to Fast Fourier Transform (FFT). However, in FFT, the signal is changed to the frequency spectrum from the time spectrum. The difference between FFT and EMD is that in EMD signal remains in the time domain. It is not assumed to be periodic and decomposed into its Intrinsic Mode Function (IMF). The EMD can be used on different datasets, and no assumptions for the data need to be made. Whereas an IMF is a mono-component function and obeys the following criteria [17]:
• Zero crossings and extrema need to be the same or have a difference of one.
• At any given point, the local minima envelop, and the mean of the local maxima envelop are zero.
The above-stated criteria restrict an IMF from only a single oscillation per cycle, and each cycle is defined based on the number of zero crossings. Riding waves are not allowed because they can cause negative frequencies, a significant issue in instantaneous frequencies-based applications [17]. EMD works based on the instantaneous frequency, which can be defined as per application. An iterative mathematical process called sifting is used in EMD to decompose any given signal into its IMF components. The local mean is subtracted from the input signal in the process of sifting. Envelopes are used to create local means and are therefore subsequently used to find all the IMF components. The last component found has the lowest frequency and is used to represent the overall trend. Conversely, the first IMF contains the highest frequency components.
EMD is not a computationally fast method for signal decomposition and suffers from mode mixing [17]. Mode mixing occurs when an IMF has various scales or when a signal having a similar scale is captured in multiple IMFs. Two methods have been used for getting rid of the mixing of IMF modes. Ensemble Empirical Mode Decomposition (EEMD) removes mixing by adding white noise before decomposition [28]. Moreover, the other method being Complete Ensemble Mode Decomposition with Additive Noise (CEEMDAN), which also utilizes WGN to get rid of mode mixing [29]. Both EEMD and CEEMDAN variants of EMD are computationally intensive due to the increased number of realizations needed to decompose the given signal [30].
Wavelet denoising techniques mainly inspire Time-frequency domain denoising techniques. The denoising of digital physiological signals can be elaborated as
Where,  and
and  represent a denoised and noisy version of the same signal, respectively. Whereas
  is a random variable that is distributed concerning Gaussian distribution. The variance of the noise
  can be known or unknown. Based on the denoised signal’s parametric model, the signal denoising techniques are labeled as parametric and nonparametric [18].
Physiological signals can be denoised using nonparametric signal denoising techniques due to the signals’ nonstationary nature and are inspired by the wavelet denoising technique. In wavelet denoising techniques, a discrete wavelet transform (DWT) of the noisy signal is built by selecting an orthonormal based orthogonal matrix (W). The DWT of a noisy signal can be represented as 
Where,  and
and 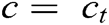 are resulting coefficients of the wavelet transform with
  As W is an orthogonal matrix, the resulting coefficients of DWT are normally distributed with variance (
 and mean (µ) equal to the wavelet coefficients values of noiseless signal (
 . The fundamental property of DWT is that it divides the total energy of
  in wavelet components of high amplitude. In DWT, the lower than the predefined threshold components, which is
  , are set equal to zero such that the reconstructed denoised signal is composed of components with high amplitudes only. Three types of thresholding operators have been used for thresholding based denoising techniques, i.e., SOFT, HARD, and Smoothly Clipped Absolute Deviation (SCAD) [20]. Mathematically each thresholding operator is described as:


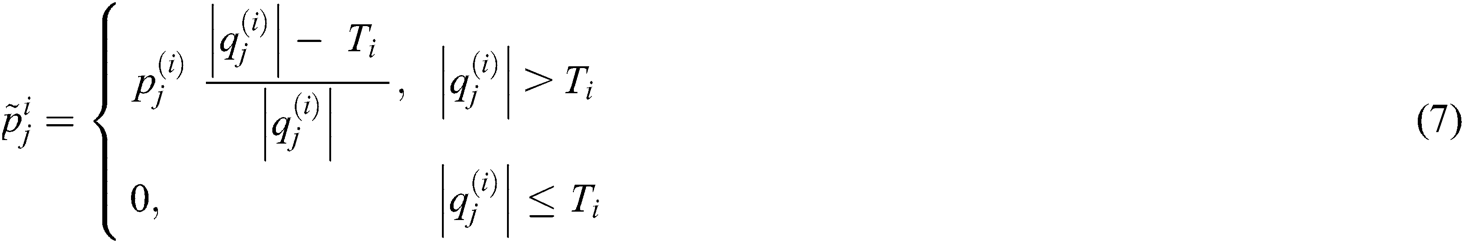
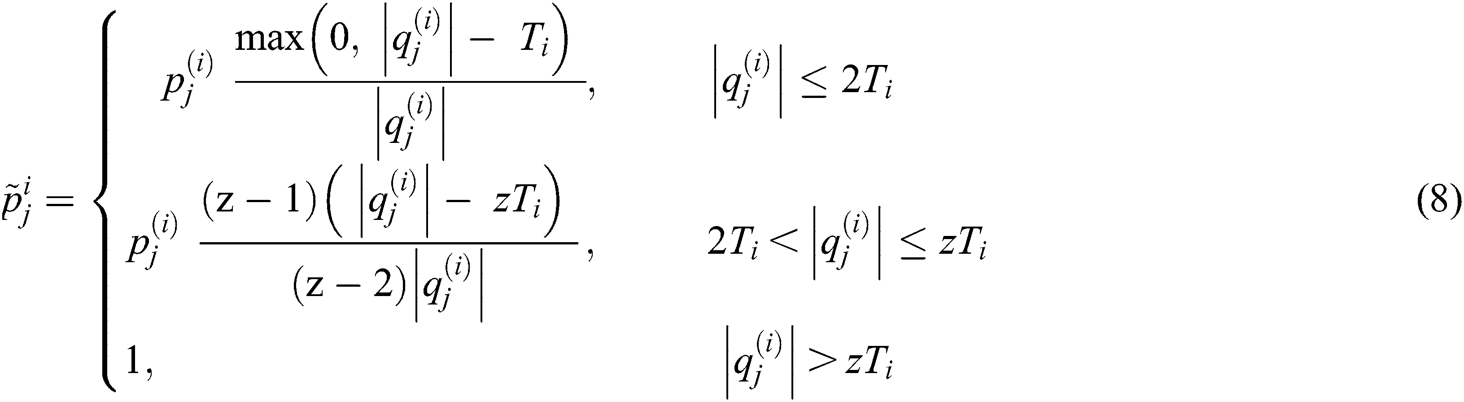
where  is recommended to set equal to 3.7 based on Bayesian argument [18,19]. The predefined threshold T plays a vital role in denoising signals, and it should be selected higher than the maximum level of noise contained by the noisy signal [31]. For a noisy signal with random WGN having variance
  , there is a high probability that the maximum amplitude of noise remains below
  . This is called a universal threshold for wavelet denoising, and it tends to increase with the increasing value of N, which seems counterintuitive. However, the reason is that the tail of the curve of the gaussian distribution produces coefficients of noise with larger amplitudes with an increasing N. Although
  does not yield perfect denoising results; however, it is an optimal selection. The drawback of using
  is that for SOFT thresholding, it generates a risk more significant than the HARD thresholding. To obtain a relative risk, it is mandatory to reduce the threshold value for the SOFT thresholding operator by two than the HARD thresholding operator. The effect of setting threshold value equal to
  for all types of thresholding operators and to set it equal to T/2 for SOFT thresholding operator has been investigated, and the results are presented in Section 3.2.
By using the SOFT thresholding operator with a threshold equal to  , the denoised signal is as smooth and regular as the original signal. This is not possible with the HARD thresholding operator because the coefficients above the predefined threshold are left unchanged. The denoised signal’s unchanged coefficients are usually more extensive than the original signal’s coefficients because of additive noise, resulting in discontinuities in the denoised signal. Whereas the SOFT thresholding operator leads to unnecessary bias in the denoised signal, it shifts the denoised signal by an amount of T even if the coefficients have energy much more considerable than noise levels. To overcome this disadvantage of SOFT thresholding, the SCAD thresholding operator can penalize the coefficients with noise coefficients. The original signal’s effect is discarded to calculate the noise’s variance because it only influences a tiny portion of coefficients with large amplitude. These large-amplitude coefficients are taken as outliers. An intuitive estimate of the variance of the noise is calculated from the median of the components such that:

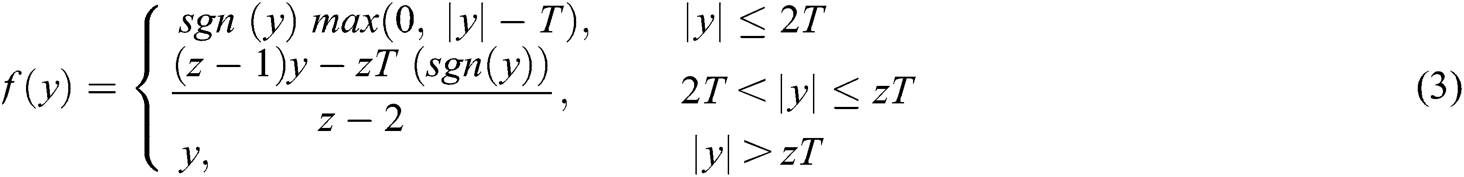
The approximated denoised signal can be modeled as:  . Where,
  ,
,  , and
, and  represent the denoised signal, transpose of matrix W, and thresholded wavelet components, respectively. Conversely, in EMD, the goal is to approximate IMFs which are only composed of noise. The energies of such IMFs can be modeled as:

 is the total energy and
  is the square of the energy of first IMF and
  and
and  depend on iterations used in the process of sifting to decompose any given signal by EMD [20].
The IMF’s resulting from EMD decomposition resembled amplitude and frequency modulated sine waves having a mean equal to zero. Due to this property of IMFs, the direct utilization of thresholding based on wavelet thresholding methods results in discontinuities in the denoised signal. The amplitude of individual IMFs cannot help to determine if the IMF contains noise or the signal. Alternatively, the extrema points can determine if any specific interval of the IMF contains noise or signal. If the IMF contains noise only or if noise is dominated in any IMF, then the extrema value would be below the predefined threshold and vice versa. Utilizing this information, wavelet-based HARD, SOFT, and SCAD thresholding techniques can be translated for EMD as well and can be described by Eqs. (6) to (8), respectively. As the thresholding is applied on zero-crossing interval  to
to  . Thus, it is called Interval Thresholding (IT).
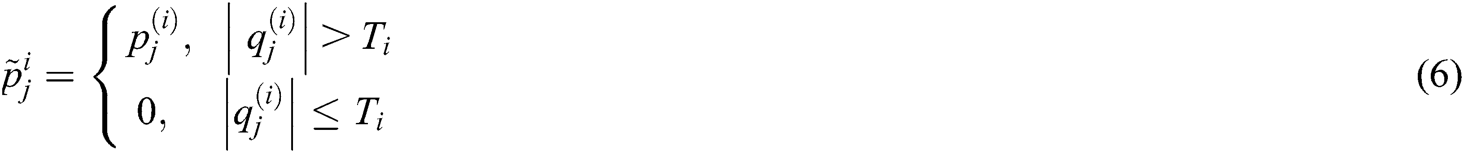
For j = 1, 2, . . . ,  where,
  ,
,  , and
, and  represents the samples of the noisy signal, thresholded samples, and extrema of the noisy signal, respectively, from instant
  to
to  of the
  IMF.
IMF.
2.2.2 Iterative Interval Thresholding
Just like IT thresholding, IIT is also inspired by the wavelet thresholding technique. In translational invariant wavelet thresholding, various versions of a denoised signal are achieved iteratively. By averaging the various versions of the denoised signals, the iterative process increases the tolerance against noise. IIT works similarly. After IT thresholding, for EMD, various versions of the input signal can be produced. In IIT, this is achieved by decomposition of various noisy forms of the signal under consideration. Various noisy versions of the input signal are achieved by changing the first IMF positions randomly and then combining the first IMF’s noisy version with the remaining IMFs. The following steps are performed in the IIT-based thresholding technique:
1. Decompose noisy input signal into its N subsequent IMFs using EMD.
2. Reconstruct the signal, using last N-1 IMFs, without first IMF.
3. Change the positions of the samples of the first IMF randomly.
4. Again, reconstruct the signal by adding updated first IMF and signal from step 2.
5. Again, decompose the newly reconstructed signal using EMD.
6. Using IT-thresholding, obtain a denoised version of the signal yielded from step 5.
7. Repeat the procedure M times to obtain M denoised versions of the original signal.
8. Average the obtained M signals to generate the final denoised version of the signal.
2.2.3 Clear Iterative Interval Thresholding
The Clear Iterative Interval Thresholding (CIIT) thresholding technique was designed for low noise and higher SNR value signals. Unlike IIT, in CIIT, the sample of the first IMF’s position is not changed because there is an excellent possibility that the first IMF contains a significant portion of the signal. The useful information is extracted from the first IMF, and any thresholding technique removes the remaining portion. The first IMF’s information is combined with the remaining IMFs to obtain a denoised version of the noisy input signal. The procedure of CIIT is similar to IIT. Only step 2 and 3 of IIT thresholding are changed with the following steps:
1. Decompose noisy input signal into its subsequent IMFs.
2. Denoise, the first IMF, using any thresholding technique.
3. Subtract the denoised version of the first IMF from the original first IMF to obtain its noise-only version.
4. Reconstruct the signal using all IMFs except the first IMF.
5. Combine both signals obtained from steps 2 and 4.
6. Change the position of the samples of the noise-only part of the first IMF.
The EMG dataset is comprised of 15 EMG recordings. Such that 3 EMG signals were recorded from 5 healthy subjects. All the EMG recordings were prerecorded and had been used in [32]. The EMG signals were recorded for different hand motions from the upper limb of the subjects. The experimental data recording protocol was designed so that the subjects performed Hand Open motion with four repetitions. Such that, the motion lasted for 5 s, followed by a REST-period of 5 s. The EMG signals were recorded with a commercially available EMG amplifier at a sampling frequency of 8000 Hz. More details about the dataset can be acquired from [32].
2.4 EMG Signal Filtration Protocol
The recorded EMG signal had a contraction period of 5 s. One second of data from the start and end of the contraction period were discarded to avoid non-stationarity. The remaining data of 3 s was further utilized for signal analysis. To evaluate the efficacy of the investigated signal processing techniques, the recorded EMG signals were first artificially contaminated by introducing synthetically generated random Gaussian noise having different SNR levels in the signals. The noisy EMG signals ( were generated by introducing noise, such that:


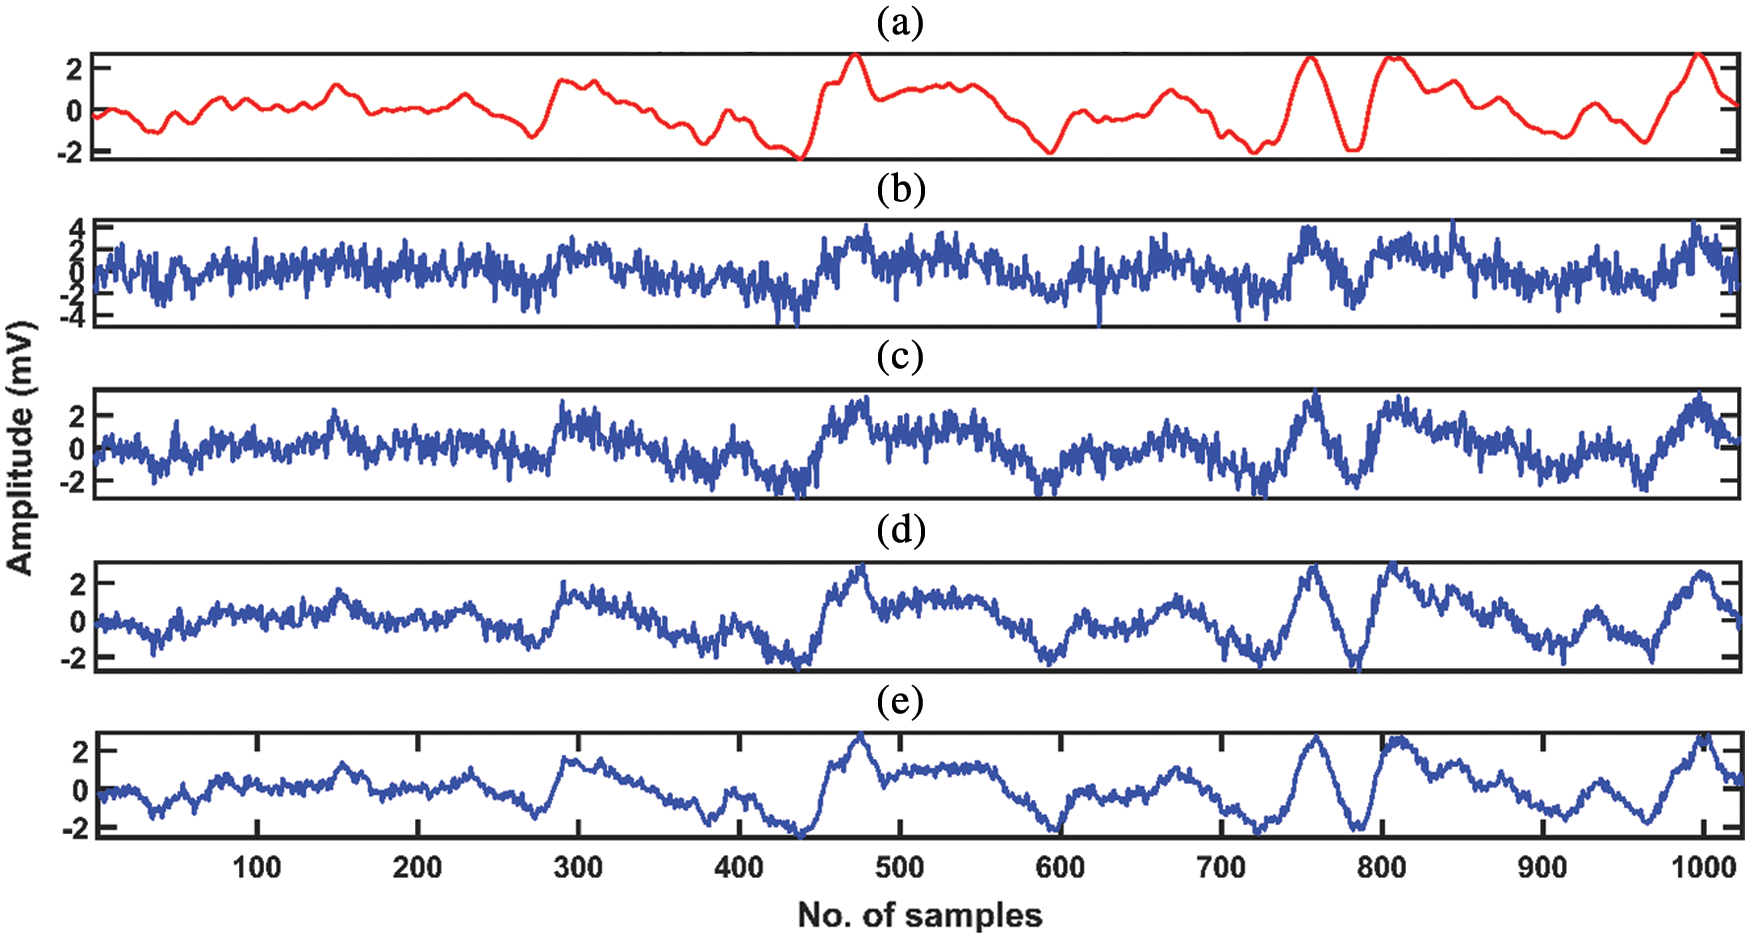
Figure 1: Original EMG signal and EMG signal contaminated with various noise levels. (a) Original experimental EMG signal. (b) Noisy EMG with noise (0 dB). (c) Noisy EMG with noise (5 dB). (d) Noisy EMG with noise (10 dB). (e) Noisy EMG with noise (15 dB)
N is a variable with random Gaussian distribution, the SNR levels investigated in this study for noise are  dB. The quality of the EMG signals was assessed before and after the contamination of artificial noise by using Eq. (11). All the EMG recordings were first decomposed to obtain corresponding IMFs. After decomposition, the IMFs were thresholded using the thresholding methods mentioned above, along with the mentioned thresholding operators. All the procedures were implemented in MATLAB 2018. Fig. 1 shows the original and noise-contaminated EMG signal at different noise levels.
The signal filtration technique’s performance is assessed based on how deliberately the technique could remove noise from the signals and how much information about the original signal is preserved. Signal to noise (SNR) is a widely used performance metric to evaluate the performance of signal filtration techniques and has been used to assess the investigated techniques’ performance. The SNR values are measured before and after the introduction of artificial noise for a fair comparison. The SNR is calculated using Eq. (11). The SNR values corresponding to all 15 EMG recordings are averaged to get mean SNR values.

where,  and
and  are original and denoised EMG signals, respectively. The results of all thresholding methods and thresholding operators are validated using the two-way Analysis of Variance (ANOVA) test and Tuckey’s Honest Post-hoc test for multiple comparisons. The null hypothesis was that all the group means of IT, IIT, and CIIT thresholding techniques and the group means of SOFT, HARD, and SCAD thresholding operators are equal against the alternative hypothesis, which states that all the group means are different. A P-value of less than 0.05 has been considered significant to reject the null hypothesis
To demonstrate and evaluate the efficacy of EMD for denoising EMG signals, IT, IIT, and CIIT thresholding techniques have been utilized to denoise EMG signals. Along with thresholding techniques, the performance of 3 widely used thresholding operators, i.e., SOFT, HARD, and SCAD, is also investigated. For the said purpose, the EMG signals were used from a prerecorded dataset. A total of 15 EMG signals were used, recorded from 5 healthy subjects. As EMG signals are nonstationary and stochastic, the denoising has been performed on EMG signals with various noise levels. The performance has been measured in terms of SNR before and after denoising of the signals.
Figure 2: Noisy EMG signal and its corresponding IMFs decomposed by EMD. The y-axis represents the amplitude in millivolts, and the x-axis represents time in seconds
The fundamental purpose of EMD is to decompose any given signal into its subsequent IMFs. Fig. 2 depicts an EMG signal and its corresponding IMFs decomposed by EMD. The IMF distribution shows that higher-order IMFs contain relatively low-frequency components, whereas lower-order IMFs contain relatively high-frequency components. The distribution of IMFs and frequency components has a resemblance with the filter bank. However, filter banks are band restricted, whereas EMD generates IMFs adaptively because of the signals’ oscillation structure. It can also be observed, from Fig. 2, that most of the noise is concentrated in the first IMF, which is a high-frequency component, and the remaining IMFs contain comparatively low noise.
The threshold value must always be chosen to be higher than the maximum level of noise in the signal. Donoho and Johnstone [33] showed that the risk of SOFT or HARD thresholding operator satisfies  for N ≥ 4. The authors also proved that
  is not the best choice for threshold, and a smaller value reduces the risk and yields better denoising results. Literature regarding EMD-based denoising techniques shows that most researchers utilized threshold equal to
  or integer multiples of
  [18,19]. The HARD thresholding technique yields better SNR values, but it leaves traces of the noise in the neighborhood of singularities. To obtain comparable SNR values, the SOFT thresholding operator’s threshold value should be chosen half of the HARD thresholding operator [31,33]. Tab. 1 shows the mean SNR values of EMG signals for SOFT and HARD thresholding operators with a threshold equal to
  and for SOFT thresholding operator with threshold T = T/2 against all subjects at 0 dB only, for demonstration of the effect of the threshold value. The SNR values of all the 3 EMG signals recorded from each subject are averaged to get the mean SNR values. From Tab. 1, it is evident that the SOFT thresholding operator yields comparable results when the value of the threshold is chosen half of the HARD threshold. The remaining of the results of this study are produced using
  threshold value. However, for the SOFT thresholding operator, the results are generated using half of the mentioned threshold value.
Table 1: Mean SNR (input SNR = 0 dB) of EMG signals before and after denoising procedures when the EMG signals were contaminated with different noise levels

Table 2: Mean SNR of EMG signals before and after denoising procedures when the EMG signals were contaminated with different noise levels

Figure 3: (a) Original experimental EMG signal. (b) Noisy EMG signal (SNR = 5.02 dB.). (c) Denoised EMG signal with SOFT-IT thresholding (SNR = 6.54 dB.). (d) Denoised EMG signal with SOFT-IIT thresholding (SNR = 6.80 dB.). (e) Denoised EMG signal with SOFT-CIIT thresholding (SNR = 6.71 dB.). (f) Denoised EMG signal with SOFT-IIT thresholding and with threshold T/2. (SNR = 10.50 dB.)
Artificial noise of different SNR levels (0 dB, 5 dB, 10 dB, and 15 dB) was first introduced in the recorded signals to find the optimum thresholding technique for noise removal from EMG signals. The noisy signals were then denoised using IT, IIT, and CIIT thresholding techniques. Results demonstrated that all 3 investigated thresholding techniques significantly remove the noise from signals, irrespective of the level of noise present in the signal. The performance of the thresholding techniques and thresholding operators is shown in Tab. 2. From Tab. 2, it can be seen that at each noise level and with each thresholding operator, the IIT thresholding technique yields higher SNR as compared to IT and CIIT thresholding methods irrespective of the type of thresholding operator.
Statistical analysis showed that at 0 dB noise level, there is no statistically significant difference in SNR values between IIT and CIIT thresholding techniques (P-value = 0.9134). However, IIT has comparatively better results in terms of mean SNR values with mean SNR of 7.75 dB, whereas IT and CIIT have mean SNR values of 4.06 dB and 7.35 dB, respectively. A similar trend has been observed at 5 dB noise level. There is no statistically significant difference in mean SNR values of IIT and CIIT thresholding techniques for all thresholding operators (P-value = 0.9610), but the mean SNR of IIT differs significantly from IT (P-value < 0.05). However, IIT has a better mean SNR value than IT and CIIT thresholding methods with mean SNR of 10.20 dB, 9.17 dB, and 10.16 dB, respectively.
Again, when the EMG recordings were contaminated with a 10 dB noise level, the IIT method’s SNR values are statistically significantly different from IT (P-value = 0.0038). However, there is no statistically significant difference in SNR values of IIT and CIIT techniques (P-value = 0.9861). Also, the IIT method secured maximum mean SNR values in comparison with IT and CIIT, with mean SNR values of 13. 8 dB, 12. 72 dB, and 13. 73 dB, respectively. Similarly, at 15 dB, the IIT method outperformed the IT thresholding technique (P-value = 0.0124), but there is no statistically significant difference in mean SNR values of IIT and CIIT methods (P-value = 0.9620). At 15 dB, the IIT method achieved a maximum mean SNR value of 16.02 dB. IT and CIIT achieved mean SNR values of 14.73 dB and 15.91 dB, respectively.

Figure 4: (a) Original experimental EMG signal. (b) Noisy EMG signal (SNR = 5.02 dB). (c) Denoised EMG signal with SOFT-IIT thresholding (SNR = 6.80 dB). (d) Denoised EMG signal with HARD-IIT thresholding (SNR = 12.58 dB). (e) Denoised EMG signal with SCAD-IIT thresholding (SNR = 8.21 dB). (f) Denoised EMG signal with SOFT-IIT thresholding with threshold T/2. (SNR = 11.30 dB)
Fig. 3 depict the original experimental, noisy (with 5 dB noise level), and denoised EMG signals for all thresholding techniques while using SOFT thresholding operator with threshold value  . From Figs. 3(c) and 3(e), it can be observed that both IT and CIIT do not retain the regularity and smoothness of the original signal. Whereas the IIT thresholding technique preserves the regularity of the original signal even at sharp edges. Fig. 4(f) depicts the denoised version of the same signal, with IIT and SOFT thresholding technique and threshold value equal to half of
  . It can be graphically visualized that the IIT with SOFT thresholding operator and threshold value equal to half of
  preserve the characteristics of the original signal successfully.
From Tabs. 1 and 2, it is evident that the HARD thresholding operator yields the best denoising results for EMG signals at all denoising levels with all thresholding methods in terms of SNR. Statistical analysis showed that the HARD thresholding operator outperforms the other investigated thresholding operators at 0 dB noise level (P-values < 0.05). The HARD operator achieved the maximum mean SNR value of 7.75 dB, whereas SOFT and SCAD operators obtained the mean SNR values of 7.35 dB and 4.04 dB, respectively. Similarly, at 5 dB, a statistically significant difference between SNR values of the HARD operator and both SOFT and SCAD operator has been observed (P-values < 0.05). The HARD operator achieved a maximum mean SNR value of 11.65 dB, whereas SOFT and SCAD operators obtained the mean SNR values of 10.39 dB and 7.49 dB, respectively.
At a 10 dB noise level, the HARD operator outperformed the other two thresholding operators, and there exists a statistically significant difference among mean SNR values of all thresholding operators (P-values < 0.05). The HARD operator achieved the maximum mean SNR value of 15.35 dB, whereas SOFT and SCAD operators obtained the mean SNR of 13. 36 dB and 11.51 dB, respectively. At 15 dB noise level, the HARD thresholding operator’s performance differs statistically from the other two operators (P-values < 0.05). However, there is no significant difference between the SOFT and SCAD operator at 15 dB noise level (P-value = 0.5045). The mean SNR value of the HARD operator is 16.99 dB. Whereas the SCAD operator achieved the minimum mean SNR value of 14.59 dB and the SOFT operator achieved the mean SNR value of 15.08 dB.
Fig. 4 depicts the original experimental, noisy (with 5 dB noise level), and denoised EMG signals for all thresholding operators while using the IIT thresholding technique with threshold value  . From Fig. 4(c), it can be observed that SOFT thresholding operator with threshold value
  fails to retain the characteristics of the original EMG signal. In Fig. 4(d), the performance of HARD thresholding operator with threshold
  is also shown. It can be observed that HARD thresholding retains the traces of noise at sharp edges and introduces discontinuities in the denoised signal. The performance of the SCAD operator is shown in Fig. 4(e), and it can be observed that the SCAD operator also fails to retain the original signal’s smoothness and characteristics. SOFT operator when used with a threshold equal to half of
  generates a denoised signal with much resemblance to the original signal.
The study aimed to evaluate the performance of EMD for denoising of EMG signals in the presence of random noise at various levels. It was also intended to evaluate the effect of various thresholding techniques and thresholding operators on the performance of EMD for denoising EMG signals. 15 EMG recordings were used, which were recorded from 5 healthy subjects. All the EMG recordings were first contaminated with noise at various noise levels, and their SNR was calculated. After introducing artificial random noise to original EMG signals, the noisy signals were decomposed using EMD. Various thresholding methods and thresholding operators were then used to denoise the noisy EMG signals. Although EMG signals’ characteristics are very complex and stochastic, the results demonstrate that EMG signals can be successfully denoised using EMD-based denoising techniques.
All three investigated thresholding techniques (IT, IIT, and CIIT) were developed and inspired by wavelet denoising techniques. In wavelet denoising techniques, the selection of threshold value also plays a vital role in denoising signals. Donoho and Johnstone [33] were the first to introduce a generic and universal threshold ( ) for wavelet-based denoising techniques. They mathematically proved that the SOFT threshold generates a risk more significant than the HARD threshold since it approximately converges to 0 the amplitudes of coefficients just below -T or above T [33,34]. In contrast, the HARD threshold leaves the amplitude of the coefficients unchanged. For a fair comparison, to yield the same risk for both thresholding operators, the SOFT operator’s threshold value must be half of the HARD threshold operator’s value. Therefore, in this study, we have investigated the effect of the threshold value for SOFT thresholding operator both with threshold value
  and it’s half. The results demonstrate that SOFT thresholding operator yields comparable SNR values when computed with threshold value equal to half of
  . The best denoising results in terms of retaining characteristics of the original EMG signal, after denoising, yields from SOFT thresholding operator when the threshold value was set to half of
  . While using the SOFT operator with a universal threshold decreases the resulting SNR of the denoised signal, it also fails to retain the original EMG signal’s regularities and smoothness.
To study the effect of different thresholding methods, IT, IIT, and CIIT thresholding techniques were investigated in this study. Results demonstrated that all the investigated thresholding techniques minimized noise in EMG signals when the signals were corrupted with various noise levels. However, the best results are yielded from the IIT thresholding technique for all the investigated EMG recordings corresponding to various noise levels. The IIT and CIIT thresholding technique’s performance is similar, and no statistically significant difference has been observed between IIT and CIIT methods. Originally CIIT was designed and introduced to eliminate noise from signals with low noise levels. However, in the case of EMG signals, it has been observed that for signals corrupted with low or high noise levels, the performance of IIT and CIIT is stable and removes noise from the signals significantly. On all investigated noise levels, two-way ANOVA revealed that the IIT thresholding method outperforms the IT thresholding technique (P-value < 0.05), however, there is no statistically significant difference in mean SNR values of IIT and CIIT (P-value = 0.9951).
To investigate the effect of thresholding operators on the performance of EMD-based denoising technique for denoising of EMG signals, three thresholding operators (SOFT, HARD, and SCAD) have been used in this study. The results demonstrated that for EMG signal denoising HARD thresholding operator provides the best performance results in terms of mean SNR. Individually, at each investigated noise level, the HARD thresholding operator resulted in maximum mean SNR value compared with SOFT and SCAD operators. Whereas combinedly on all investigated noise levels, two-way ANOVA revealed that there is no statistically significant difference in mean SNR values of SOFT and HARD thresholding operator (P-value = 0.0968). In contrast, there is a significant difference in mean SNR values of HARD and SCAD thresholding operators (P-value < 0.05). Although the HARD thresholding operator yields the best SNR values for denoising EMG signals, it fails to remove the traces of noise embedded in the noisy signal and generates discontinuities in the denoised signal. Fig. 4(d) can be graphically visualized that the denoised signal produced by the HARD operator has discontinuities at sharp edges. In comparison, the SOFT thresholding operator removes the traces of noise from noisy EMG signals and retains the signal’s original characteristics by preserving its smoothness. Since EMD is a computationally extensive process due to its detailed mathematical background, EMD-based EMG denoising methods require more time to denoise EMG signal comparatively. Also, in the future, the efficacy of EMD-based methods for the denoising of intramuscular EMG signals should be explored.
This study investigated and explored the efficacy of EMD for denoising of EMG signals at various noise levels. The performance of various thresholding techniques and thresholding operators is also investigated for EMD-based denoising of EMG signals. The results showed that EMG signals could be filtered out, and the effect of noise can be minimized using EMD-based denoising techniques. The performance of IT, IIT, and CIIT thresholding techniques and SOFT, HARD, and SCAD thresholding operator is investigated in this study. It is found that the IIT thresholding technique with HARD thresholding operator yields the best denoising results for EMG signals in terms of SNR, but it fails to preserve the shape of the original signal and produces discontinuities in the denoised EMG signal, irrespective of the noise contamination level of the signals. Whereas IIT with SOFT thresholding operator yields comparatively lower SNR values for denoising EMG signals, it successfully preserves the original signal’s smoothness and characteristics. The inferred results can be used to eliminate the effect of various noise types from EMG signals while preserving the original signal’s characteristics.
Funding Statement: The author(s) received no specific funding for this study.
Conflicts of Interest: The authors declare that they have no conflicts of interest to report regarding the present study.
1. C. Steele. (2012). “Evaluating the electromyographical signal during symmetrical load lifting,” in Applications of EMG in Clinical and Sports Medicine. Janeza, Croatia: Intech, . [Online]. Available: https://www.intechopen.com/books/applications-of-emg-in-clinical-and-sports-medicine. [Google Scholar]
2. R. Merletti and P. J. Parker. (2004). “Basic physiology and biophysics of EMG signal generation,” in Electromyography: Physiology, Engineering, and Non-invasive Applications, vol. 11. New Jersey, United States: John Wiley & Sons. [Google Scholar]
3. F. T. Al-Dhief, N. M. A. A. Latiff, N. N. N. A. Malik, N. S. Salim, M. M. Baki et al., “A survey of voice pathology surveillance systems based on internet of things and machine learning algorithms,” IEEE Access, vol. 8. pp. 64514–64533, 2020. [Google Scholar]
4. A. A. Mutlag, M.Khanapi Abd Ghani, M. A. Mohammed, M. S. Maashi, O. Mohd et al., “MAFC: Multi-agent fog computing model for healthcare critical tasks management,” Sensors, vol. 20, no. 7, pp. 1853, 2020. [Google Scholar]
5. G. Lu, J. S. Brittain, P. Holland, J. Yianni, A. L. Green et al. (2009). , “Removing ECG noise from surface EMG signals using adaptive filtering,” Neuroscience Letters, vol. 462, no. 1, pp. 14–19. [Google Scholar]
6. J. Wang, L. Tang and J. E. Bronlund. (2013). “Surface EMG signal amplification and filtering,” International Journal of Computer Applications, vol. 82, no. 1, pp. 15–22. [Google Scholar]
7. A. Waris, I. K. Niazi, M. Jamil, K. Englehart, W. Jensen et al. (2018). , “Multiday evaluation of techniques for EMG-based classification of hand motions,” IEEE Journal of Biomedical and Health Informatics, vol. 23, no. 4, pp. 1526–1534. [Google Scholar]
8. A. Waris, I. Mendez, K. Englehart, W. Jensen and E. N. Kamavuako. (2019). “On the robustness of real-time myoelectric control investigations: A multiday Fitts’ law approach,” Journal of Neural Engineering, vol. 16, no. 2, pp. 026003. [Google Scholar]
9. M. S. P. Subathra, M. A. Mohammed, M. S. Maashi, B. Garcia-Zapirain, N. J. Sairamya et al. (2020). , “Detection of focal and non-focal electroencephalogram signals using fast Walsh-Hadamard transform and artificial neural network,” Sensors, vol. 20, no. 17, pp. 4952. [Google Scholar]
10. M. A. Mohammed, K. H. Abdulkareem, S. A. Mostafa, M. K. A. Ghani, M. S. Maashi et al. (2020). , “Voice pathology detection and classification using convolutional neural network model,” Applied Sciences, vol. 10, no. 11, pp. 3723. [Google Scholar]
11. M. B. I. Reaz, M. S. Hussain and F. Mohd-Yasin. (2006). “Techniques of EMG signal analysis: Detection, processing, classification and applications,” Biological Procedures Online, vol. 8, no. 1, pp. 11–35. [Google Scholar]
12. M. Scarpiniti, D. Comminiello, R. Parisi and A. Uncini. (2013). “Nonlinear spline adaptive filtering,” Signal Processing, vol. 93, no. 4, pp. 772–783. [Google Scholar]
13. T. G. Šupuk and A. Kuzmanić. (2004). “Denoising of surface EMG signals: A comparison of wavelet and classical digital filtering procedures,” Technology and Health Care, vol. 12, pp. 130. [Google Scholar]
14. N. E. Huang, “Hilbert-Huang transform and its applications,” World Scientific, vol. 16, pp. 12–14, 2014. [Google Scholar]
15. X. Zhang and P. Zhou. (2013). “Filtering of surface EMG using ensemble empirical mode decomposition,” Medical Engineering & Physics, vol. 35, no. 4, pp. 537–542. [Google Scholar]
16. A. O. Andrade, S. Nasuto, P. Kyberd, C. M. Sweeney-Reed and F. R.Van Kanijn. (2006). “EMG signal filtering based on empirical mode decomposition,” Biomedical Signal Processing and Control, vol. 1, no. 1, pp. 44–55. [Google Scholar]
17. N. E. Huang, Z. Shen, S. R. Long, M. C. Wu, H. H. Shih et al., “The empirical mode decomposition and the hilbert spectrum for nonlinear and nonstationary time series analysis,” Proceedings of the Royal Society of London. Series A: Mathematical, Physical and Engineering Sciences, vol. 454, no. 2, pp. 903–995, 1998. [Google Scholar]
18. Y. Kopsinis and S. McLaughlin. (2009). “Development of EMD-based denoising methods inspired by wavelet thresholding,” IEEE Transactions on Signal Processing, vol. 57, no. 4, pp. 1351–1362. [Google Scholar]
19. Y. Kopsinis and S. McLaughlin. (2008). “Empirical mode decomposition based denoising techniques, ” in 1st Int. Work-Shop on Cognitive Information Processing CIP. Santorini, Greece. [Google Scholar]
20. A. Antoniadis and J. Fan. (2001). “Regularization of wavelet approximations,” Journal of the American Statistical Association, vol. 96, no. 455, pp. 939–967. [Google Scholar]
21. Y. Kim, H. Choi and H. S. Oh. (2008). “Smoothly clipped absolute deviation on high dimensions,” Journal of the American Statistical Association, vol. 103, no. 484, pp. 1665–1673. [Google Scholar]
22. X. Xi, Y. Zhang, Y. Zhao, Q. She and Z. Luo. (2019). “Denoising of surface electromyogram based on complementary ensemble empirical mode decomposition and improved interval thresholding,” Review of Scientific Instruments, vol. 90, no. 3, pp. 035003. [Google Scholar]
23. M. Naji, M. Firoozabadi and S. Kahrizi. (2011). “The application of empirical mode decomposition in elimination of ECG contamination from EMG signals,” in Iranian Conf. of Biomedical Engineering (ICBME). Tehran, Iran, pp. 77–80. [Google Scholar]
24. X. Mengying, Y. Xiaoli, X. Chenli and Y. Bin. (2019). “EMG signal processing and application based on empirical mode decomposition,” Signal, vol. 3, pp. 4. [Google Scholar]
25. R. Damaševičius, M. Vasiljevas, I. Martišius, V. Jusas, D.Birvinskas et al. (2015). , “BoostEMD: An extension of EMD method and its application for denoising of EMG signals,” Elektronika Ir Elektrotechnika, vol. 21, no. 6, pp. 57–61. [Google Scholar]
26. M. Hassan, S. Boudaoud, J. Terrien, B. Karlsson and C. Marque. (2011). “Combination of canonical correlation analysis and empirical mode decomposition applied to denoising the labor electrohysterogram,” IEEE Transactions on Biomedical Engineering, vol. 58, no. 9, pp. 2441–2447. [Google Scholar]
27. M. U. Khan, S. Aziz, M. Bilal and M. B. Aamir. (2019). “Classification of EMG signals for assessment of neuromuscular disorder using empirical mode decomposition and logistic regression,” in Int. Conf. on Applied and Engineering Mathematics (ICAEM). Davao, Philippines, pp. 237–243. [Google Scholar]
28. Z. Wu and N. E. Huang. (2009). “Ensemble empirical mode decomposition: A noise-assisted data analysis method,” Advances in Adaptive Data Analysis, vol. 1, no. 1, pp. 1–41. [Google Scholar]
29. M. E. Torres, M. A. Colominas, G. Schlotthauer and P. Flandrin. (2019). “A complete ensemble empirical mode decomposition with adaptive noise,” in IEEE Int. Conf. on Acoustics, Speech and Signal Processing (ICASSP). Brighton, UK, pp. 4144–4147. [Google Scholar]
30. J. R. Yeh, J. S. Shieh and N. E. Huang. (2010). “Complementary ensemble empirical mode decomposition: A novel noise enhanced data analysis method,” Advances in Adaptive Data Analysis, vol. 2, no. 02, pp. 135–156. [Google Scholar]
31. M. Stephane. (1999). A Wavelet Tour of Signal Processing. Amsterdam, Netherlands: Elsevier, . [Online]. Available: https://www.elsevier.com/books/a-wavelet-tour-of-signal-processing/9780123743701 [Google Scholar]
32. A. Waris, I. K. Niazi, M. Jamil, K. Englehart, W. Jensen et al. (2018). , “Multiday evaluation of techniques for EMG-based classification of hand motions,” IEEE Journal of Biomedical and Health Informatics, vol. 23, no. 4, pp. 1526–1534. [Google Scholar]
33. D. L. Donoho and J. M. Johnstone. (1994). “Ideal spatial adaptation by wavelet shrinkage,” Biometrika, vol. 81, no. 3, pp. 425–455. [Google Scholar]
34. D. Baleanu. (2012). Advances in Wavelet Theory and their Applications in Engineering, Physics and Technology. Janeza, Croatia: Intech, . [Online]. Available: https://www.intechopen.com/books/advances-in-wavelet-theory-and-their-applications-in-engineering-physics-and-technology [Google Scholar]
 | This work is licensed under a Creative Commons Attribution 4.0 International License, which permits unrestricted use, distribution, and reproduction in any medium, provided the original work is properly cited. |