DOI:10.32604/iasc.2021.014811
| Intelligent Automation & Soft Computing DOI:10.32604/iasc.2021.014811 | |
| Article |
A Multi-Agent Stacking Ensemble Hybridized with Vaguely Quantified Rough Set for Medical Diagnosis
1Department and College of Computer Science, King Khalid University, Abha, Kingdom of Saudi Arabia
2Department of Mathematical Sciences, Faculty of Science, Augustine University, Ilara-Epe, Lagos, Nigeria
*Corresponding Author: Ali M. Aseere. Email: amg@kku.edu.sa
Received: 19 October 2020; Accepted: 20 December 2020
Abstract: In the absence of fast and adequate measures to combat them, life-threatening diseases are catastrophic to human health. Computational intelligent algorithms characterized by their adaptability, robustness, diversity, and recognition abilities allow for the diagnosis of medical diseases. This enhances the decision-making process of physicians. The objective is to predict and classify diseases accurately. In this paper, we proposed a multi-agent stacked ensemble classifier based on a vaguely quantified rough set, simple logistic algorithm, sequential minimal optimization (SMO), and JRip. The vaguely quantified rough set (VQRS) is used for feature selection and eradicating noise in the data. There are two classifier layers in the stacked ensemble, with the simple logistic and SMO being the base classifiers, and JRip being the meta-classifier. The base classifiers learn using training data, and the individual classifier predictions are merged for input into the meta-classifier, which makes predictions accordingly. In experiments, the proposed method was validated by providing improved diagnoses with respect to three classification operations. The proposed method thus provides more accurate medical diagnoses to the compared algorithms.
Keywords: Classification; feature selection; medical diagnosis; predictive analysis; stacking; vaguely quantified rough set
The purpose of medical diagnosis is to examine key indicators of specific diseases. For a proper diagnosis, computer-assisted algorithms initiate an accurate decision-making process. Automatic and intelligent techniques trigger proficient diagnostic identification due to the vast amount of medical data recorded. Data mining, machine and ensemble learning algorithms fall under the umbrella of intelligent techniques, and their merits are improved accuracy in diagnosing diseases. This ultimately assists physicians in arriving at a definite and precise decision, and reduces errors in diagnoses [1,2]. Medical datasets have a vast number of features [3,4], which can hinder analytic performance. Selecting relevant feature subsets that summarize the true meaning of the dataset will boost performance. In addition, the presence of noise and insignificant features can pose a problem [5–7]. Thus, it is essential for a feature selection process to address noise in the data. The merits of feature selection include enabling graphical analysis and data interpretation, decreasing computational time, and reducing overfitting. It should be emphasized that although previous research on medical diagnosis has been promising, it is necessary to devise other intelligent methods for diagnosis. This research paper recognizes the advantages of using vaguely quantified rough sets (VQRS) in feature selection and to combat noisy data. Furthermore, three machine learning methods—a simple logistic algorithm, sequential minimal optimization (SMO), and JRip—are integrated into a multiple classifier system called ensemble learning. The strengths of individual classifier are exploited, while their weaknesses are avoided [8]. A multi-agent stacked ensemble classifier system is proposed for medical diagnoses based on VQRS, simple logistic algorithm, SMO, and JRip. Each stage produces an output that serves as input for the next stage until a final, predictive outcome is reached. Stacked ensembles employ a higher-level classifier to combine lower-level classifiers to produce superior prediction accuracy [9,10]. The main contributions of the paper are as follows.
a) We propose the prediction and classification of medical diseases through an ensemble algorithm that is deeply rooted in stacking.
b) We apply the VQRS feature selection method to provide significant insight into the recognition of subsets. Noise in the data is also handled effectively.
c) The proposed multi-agent system is capable of classifying and distinguishing diseased individuals from healthy individuals.
The rest of this paper is organized as follows. Section 2 provides a summary of the related literature, and the contribution gap. The data mining techniques and stacking ensemble used in the proposed methodology are discussed in Section 3. Section 4 introduces the vaguely quantified rough set, as well as the procedure for feature selection. The proposed multi-agent stacking ensemble algorithm is presented in Section 5. A complexity analysis of the proposed algorithm appears in Section 6. Simulations and a discussion of the results are presented in Section 7, and a conclusion is given in Section 8.
The plethora of medical datasets, and the need to eradicate life-threatening diseases through early detection, necessitates an adaptive and efficient approach to diagnosis. Data mining and ensemble learning are promising avenues in this regard. A k-medoids clustering-based attribute weighting termed kmAW was used in conjunction with a support vector machine (SVM) for medical diagnoses [11]. The kmAW determines key features of the dataset, while the SVM performs classifications for improved accuracy. Experiments indicated that the proposed combination increased accuracy for all datasets. As a way to prevent blindness resulting from glaucoma, an expert system consisting of an image processing algorithm such as a canny detector algorithm and the parameter extraction technique of a randomized Hough transform were infused with fuzzy logic to provide an adequate diagnosis [12]. The fuzzy expert system surpassed other proposed techniques in terms of performance. Furthermore, a diagnosis of breast cancer was carried out using an optimized deep convolutional neural network (CNN) by applying a larger percentage of unlabeled data [13]. This implies that a small amount of label data was used for training, which goes against the conventional way that CNN uses datasets. A high degree of accuracy and large area under the curve (AUC) were found following experiments. With regard to the diagnostics for breast cancer, taking advantage of ensemble properties, an ensemble SVM model was developed based on a weighted area under the receiver operating characteristic (ROC) curve ensemble (WAUCE) [14].
Furthermore, the parameters of the SVM were optimally enhanced using two swarm intelligent methods, particle swarm optimization (PSO) and the fruit fly optimization algorithm (FOA), while the genetic algorithm (GA) selected optimal feature subsets; the resulting methods are referred to as GAPSO-FS and GAFOA-FS [15]. An experimental comparison of these two methods with FOA-SVM, GA-FS, and PSO-FS revealed that GAPSO-FS and GAFOA-FS were superior. For liver diagnosis, the researchers in Ghoniem [16] proposed two methods that combined deep learning approaches with a bioinspired artificial bee colony (ABC) optimization. The first was a combination of the SegNet network, the UNet network, and an ABC termed SegNet-UNet-ABC; the other was a combination of LeNet-5 and ABC. The proposed methods proved to be better than other algorithms with respect to different metrics. Other researchers proposed an ensemble deep learning technique for the prediction of neuromuscular disorders [17]. This involved the feature selection procedures of a Bhattacharya coefficient and the GA, which were used either individually or as a hybrid. The selected features were then used with several classifiers, and their predictions were combined for CNN. Another study integrated a crow search optimization algorithm, chaos theory, and fuzzy c-means for medical diagnoses [18]. A predictive ensemble model of the self-organizing map (SOM), non-linear iterative partial least squares (NIPAL), and ANFIS was presented in Nilashi et al. [19] for combating hepatitis. Furthermore, the CART decision tree was used to select features. The proposed model (called NIPAL-SOM-ANFIS) was effective for diagnosing hepatitis.
Meanwhile, a deep ensemble sparse regression network (DeepESRNet) for the diagnosis of brain disease was discussed in Suk et al. [20]. Two sparse regression networks; multi-output linear regression (MOLR) and joint linear and logistic regression (JLLR); with different regularization control parameters were trained on the data, and the outputs were combined in a deep CNN. The proposed methods showed improved performance compared to MOLR, MOLR-SVM, JLLR, and JLLR-SVM. Based on fuzzy set, an upgraded Pythagorean fuzzy set based on Jensen-Shannon divergence measure was incorporated for medical diagnoses [21].
The research summarized above has proved significant in medical diagnosis. A limitation that can be recognized is the ineffectiveness of the feature selection techniques in handling noise in data. This noise increases the complexity of the model and degrades performance. This is an important factor to consider. The VQRS provides noise handling characteristics based on fuzzy quantifiers during feature selection. Furthermore, the research paper taps into alternative algorithmic approaches based on a state-of-the-art algorithm of stacking ensemble for accurate predictions. The details of VQRS and the stacking ensemble are described in latter sections.
A logistic regression (LR) [22,23] is a statistical measure used to evaluate the likelihood of a binary decision by certain reasonable factors. It helps to identify the impact of factors labeled upon dependent variable under observation. If k classes exist for n cases with m features, the computation of component B produces an  matrix. Excluding the class j, the probability is determined in Eq. (1) as follows:

The last class has probability, as shown in Eq. (2).

Therefore, the negative multinomial log-likelihood is represented in Eq. (3).

A quasi-Newton approach was utilized to explore the optimal settings of  parameters to identify B matrix as L is decreased. Prior to optimization, the matrix B was compressed to an
  sequence [24,25]. The simple logistic algorithm builds models with underlying foundations on linear logistic regression [26]. LogitBoost, a boosting algorithm, handles the building of models. Cross-validation was executed on the number of iterations using LogitBoost.
SMO aims to facilitate learning for the SVMs. This aims at resolving SVM problems associated with dealing with large-scale problems [27,28]. The principle of the SVM is defined as follows: If there is an existing collection of data points  ;
;  and p are input vectors and all training data, respectively, with
  denoting the class label. Training the SVM for classification is similar to searching for the following solutions [29]:


where  are the kernel function, the Lagrange multiplier, and the user-defined regularization constant, respectively. The most commonly used kernel function is the Gaussian function. If the problem in Eq. (4) is resolved, a unique data sequence is identified by the decision function in Eq. (6) for the class label.

Here, b is obtained from Eq. (4).
The SVM cannot solve large-scale QP issues. In order to mitigate this, the SMO breaks the huge QP task up into subtasks. The optimization of a training data sequence subset occurs in each phase, and is called a working set. The QP subtasks are mitigated by two working sets using a basic structural technique [30,31]. A set of rules is vital for specifying two  . SMO adjusts the entire data sequence quadratically.
JRip [32,33] is the implementation of a propositional rule learner called Repeated Incremental Pruning to Produce Error Reduction (RIPPER) [34]. This is a rule-induction algorithm that benefits from global optimization steps while creating rules that take both the quality and the length of rules into account. A collection of rules is created for each class value using a sequential covering strategy. Each rule is reconsidered, and different sequences of rules are produced by reduced-error pruning. When a new sequence of rules is smaller in length than the previous sequence, the rule is displaced.
It can be useful to use the ensemble paradigm, which effectively increases the speed and accuracy of prediction and detection [35,36]. A paradigm of this type of learning ensemble is referred to as stacking or super learning [37]. It takes many machine learning models into account and employs a meta-classifier to merge the base classifiers’ predictions, thus boosting the overall efficiency. The incorporation of different algorithms makes improving detection possible [38]. Two stages are typically involved: a number of baseline models are extracted from the training data during phase one, and the models are combined to create a single prediction model in phase two. Numerous predictions are thus made and combined to form a more sophisticated composite model that is superior to simple models.
4 Foundations of VQRS with Its Feature Selection Procedure
The concept of VQRS cannot be discussed without mentioning fuzzy rough sets. This is because VQRS solves the issues posed by fuzzy rough sets. The preliminaries of both fuzzy rough sets and VQRS are described in the following subsections.
Assuming a crisp set  exists, the established Pawlak’s lower and upper approximations [39–41] relating to equivalence relation
  are defined in Eqs. (7) and (8), as it concerns z in P.


as shown similarly in Eqs. (9) and (10):


As C and  translate into a set and a relation in P exhibiting fuzzy characteristics, the equations in Eqs. (9) and (10) with the fuzzy implicator and t-norm, represented as I and T, respectively, can evolve into Eqs. (11) and (12), respectively.


The operators inf and sup, equated with the operators in Eqs. (11) and (12), are associated closely with the  and
and  quantifiers in Eqs. (9) and (10) using fuzzy rough sets. Such interconnections will have a tremendous impact on the approximations if an individual object changes. This renders fuzzy rough sets vulnerable to corrupted and distorted data.
A decision was thus made to replace  and
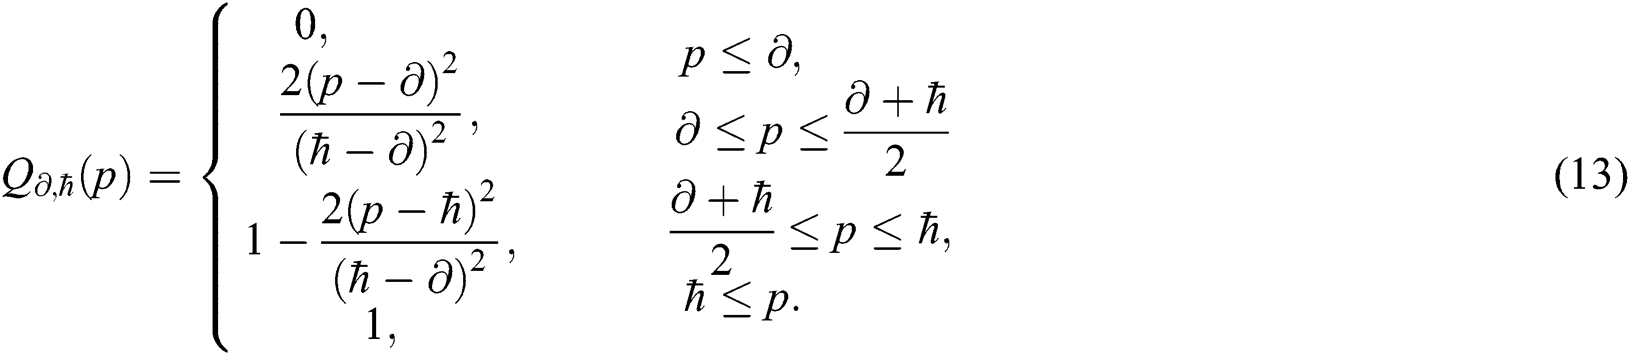
and  with abstract quantifiers, such as most and some [42,43]. Vague quantifiers were modeled mathematically using a constantly rising fuzzy quantifier [44]: an ascending [0,1] → [0,1] maps Q fulfilling the borderline requirements Q(0) = 0 and Q(1) = 1. In Eq. (13), a parameterized formula is used to build instances defining fuzzy quantifiers, for
 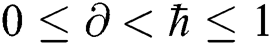 , and p in [0,1].
A pair  can be determined by describing the approximations referred to as
  and
and  of a fuzzy set C construed in Eqs. (14) and (15) by a relation
  , with all components z in P.


4.3 Feature Selection with VQRS
The fuzzy positive region as defined for the fuzzy rough feature selection in Eq. (16), which utilizes the lower approximation stated in Eq. (11), has high sensitivity to the smallest change in the data.

To overcome the deficiency in Eq. (16), the  is replaced by
  in VQRS, resulting in Eq. (17) [45].

As stated in the fuzzy rough sets, the drive toward predictions concerning d of the attributes in B is estimated by deploying the degree of the dependency of d on B, which is defined as  . This is applicable in VQRS as
  , and appears analogous to
  . Thus, the degree of dependency is
  . The order of the relationship between
  and
and  is null and void. The following conditions for VQRS must be met:
  if
if  and I satisfies
  .
.
4.4 The Benefits of Choosing VQRS Feature Selection
Datasets have mainly crisp or real-valued features, which obstruct many feature selection methods. The measure of comparability among attributes seems vague. Therefore, it is essential to have a feature selection procedure that processes crisp or real-valued features, and with knowledge of how similar the attributes can be [46]. The vaguely quantified rough set possesses inbuilt mechanisms for the reduction of discrete or real-valued features that contain noise [47]. Continuous and nominal data are handled by VQRS [48], which ensures compatibility with regression and classification datasets.
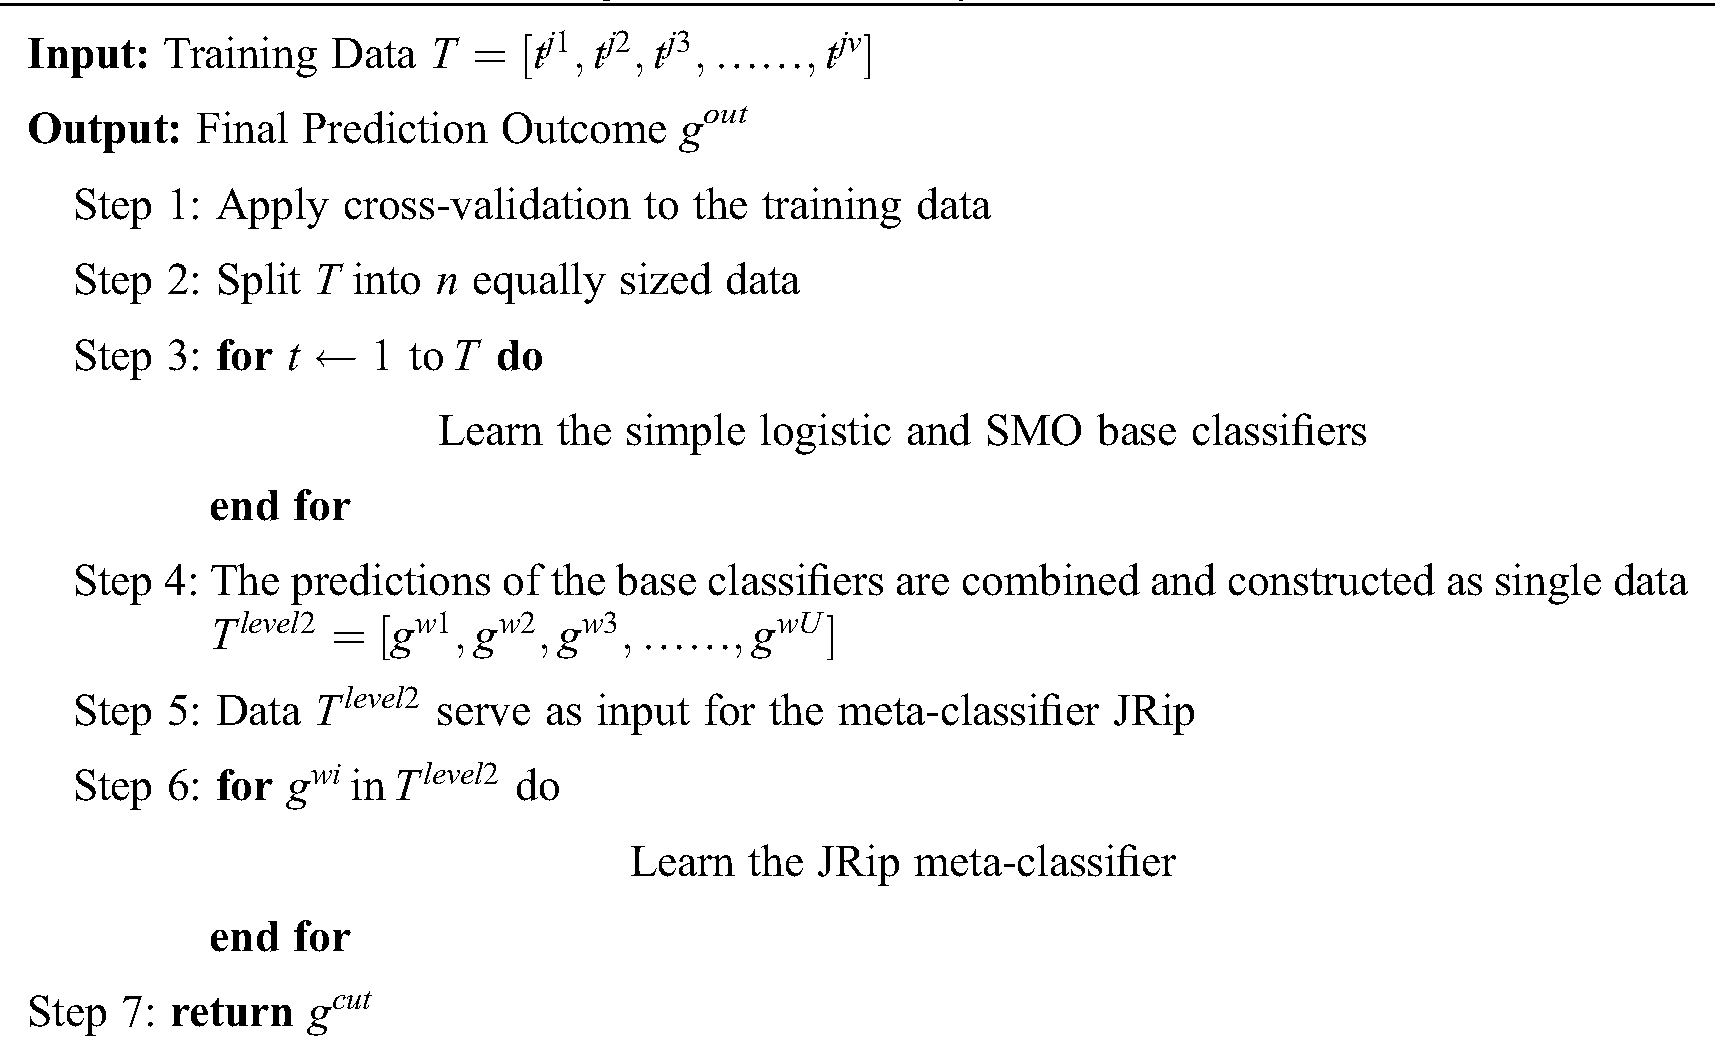
The constituents of the proposed stacking ensemble algorithms with VQRS feature selection are highlighted in this section. The VQRS-based feature selection is used to determine the features in the datasets that best represent the true meaning of the original feature set. Simple logistic, SMO, and JRip algorithms are utilized for the stacking ensemble. The simple logistic and SMO algorithms represent the base (level 0) classifiers, while the meta-classifier (level 1) is the JRip algorithm. The execution of the ensemble’s algorithmic steps commences by preparing data for input into each of the base classifiers. Each individual base classifier is trained using the data to generate predictions, which are then combined into a single prediction. The meta-classifier is responsible for accepting the combined prediction as input to be processed accordingly. The meta-classifier produces a final predictive classification outcome.
The preparation of the original data is initiated by VQRS, and executing the generation procedure depends on a search technique called greedy hill-climbing. This produces a subset of features for evaluation. The appropriateness of the subsets of features is calculated using the evaluation function  . By relying on this evaluation function, the stopping criterion is attained upon accumulating the optimal subsets. The VQRS process concludes, and the selected subsets constitute the training data for the ensemble method. The detailed strategies implemented by the proposed algorithm are outlined in Fig. 1. The pseudocode for the stacking ensemble is shown in Algorithm 1.
1. The training data T, having u instances and v attributes, and having undergone feature selection by VQRS, are prepared for the base classifiers.
2. Cross-validation is applied to the training data by splitting the data into equal sizes.
3. The base classifiers comprising a simple logistic algorithm and SMO are trained on T.
4. Predictions obtained from the simple logistic and SMO algorithms are arranged as a single data Tlevel2 (which are second-level data) with u instances and U attributes.
5. The meta-classifier (JRip) that invokes a final predictive outcome for proper classification acts on the second-level data.
The VQRS implements greedy hill-climbing as its search algorithm. This process resembles that of QuickReduct. For a dimensionality of n, the QuickReduck algorithm executes an (n2 + n)/2 evaluation of the dependency function. Taking n = 2, a complexity with order of 3 or (n2 + n)/2 is achieved. Assuming n = h, the order of the algorithm’s complexity becomes (h2 + h)/2. Generally, as a method of establishing best features, QuickReduct conducts h + 1 initial evaluations of the dependency function with respect to h + 1 features. Therefore, the total number of evaluation steps for n = h + 1 is:

The worst-case complexity of the VQRS algorithm is O((h2 + h)/2).
In measuring the complexity of the simple logistic algorithm, the dimensionality d of data is considered as well as the data points n. Then, a complexity of O(nd) is derived. Concerning sequential minimal optimization, the complexity is O(n3) since it is able to handle large problems of n data points. JRip has a complexity of O(n2) because it comprises two stages, namely, building and optimization, with processes executed multiple times.
The proposed algorithm’s complexity is the summation of all complexities of each algorithm. The total complexity is thus as follows:

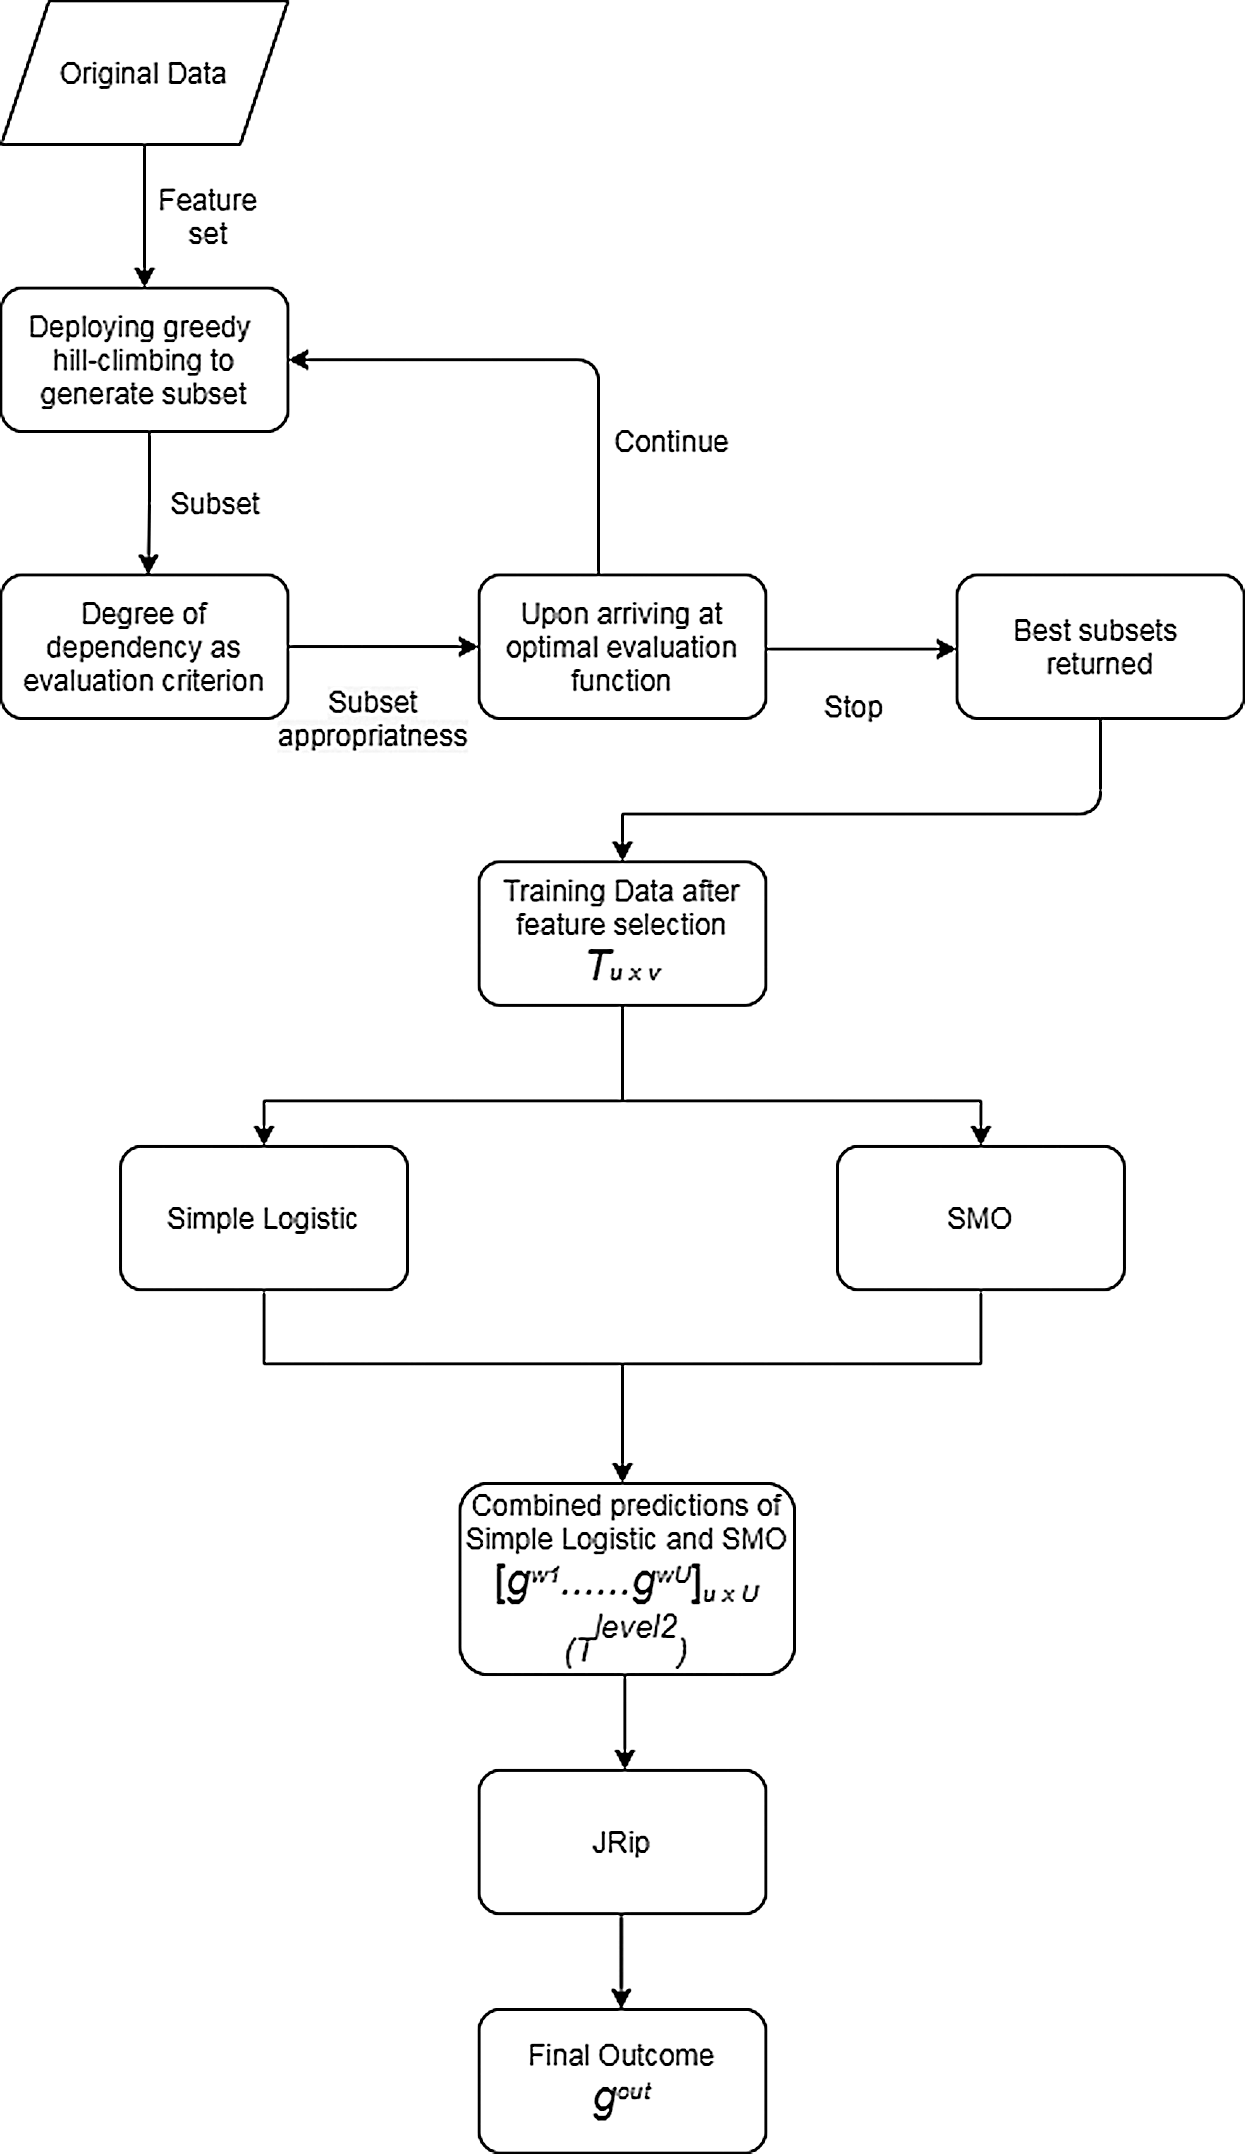
Figure 1: Proposed algorithm for multi-agent stacking ensemble
7 Experimental Setup and Results
We employed a staking ensemble mechanism in combination with VQRS feature selection to classify medical datasets. The VQRS method was used to select the best features, thus improving the performance classification after training on an ensemble model with simple logistic, SMO, and JRip algorithms. Popular algorithms within the domain of medical classification were selected for comparison, namely, IBk or the k-nearest neighbor algorithm, J48, random forest (RF), fuzzy rough k-nearest neighbor (FRNN), simple logistic algorithm, SMO, and JRip. All the experiments were run in the Waikato environment for knowledge analysis (WEKA). A 10-fold cross-validation was used for training and evaluation. The process entailed dividing the dataset into ten subsets of equal size, with nine subsets serving as the training data and one subset as the test data. The results were averaged. The parameters selected for the stacking ensemble are the simple logistic and SMO base classifiers, JRip as the meta-classifier, the number of execution slots equal to 1, the number of folds equal to 10, and the number of seeds equal to 1. The default parameters in WEKA for the simple logistic, SMO, and JRip classifiers were retained.
The metrics for validating the robustness and performance of the algorithms were sensitivity (SN), the false positive rate (FPR), specificity (SP), and the Matthews correlation coefficient (MCC). These are presented in Eqs. (20)–(23).


Here, TP and FP are the number of true positives and false positives, respectively; FN and TN are the number of false negatives and true negatives, respectively.
7.2 Description of the Datasets
The medical datasets used for experiments were retrieved from the UCI Machine Learning [49] and Arizona State University (ASU) repositories [50]. The datasets contain heart-statlog, lsvt voice rehabilitation, and leukemia data. The heart-statlog contain information about heart disease in patients and have 13 attributes with one class label, as well as 270 instances. One hundred and fifty instances were categorized as absent (negative confirmation of heart disease) and 120 instances as present (positive identification of heart disease). With regard to lsvt voice rehabilitation, the 126 instances were broken down into 42 instances of acceptable phonations and 84 instances of unacceptable phonations. The repository contains samples from 14 patients with Parkinson’s disease to evaluate whether voice rehabilitation improved phonation, with 310 input variables. The leukemia data consisted of 72 instances and 7130 attributes (including the class attribute). The repository describes the classification of patients as having either acute myeloid leukemia (AML) with 25 instances, or acute lymphoblastic leukemia (ALL) with 47 instances.
Simulations were conducted using WEKA on a 3.40 GHz Intel® Core i7 Processor with 4 GB of RAM. The results for each dataset were tabulated and graphed after a series of experiments. Information about the data is presented in Tab. 1.
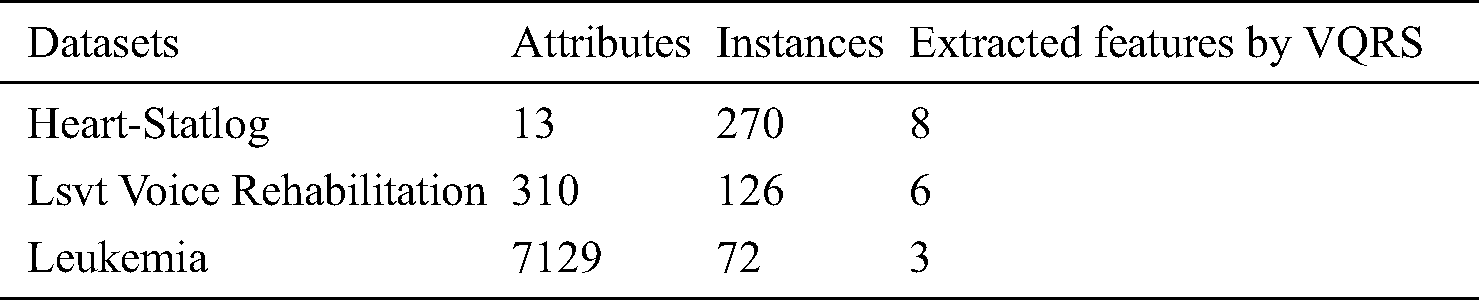
The features retrieved when incorporating VQRS were 3, 6, and 8 for leukemia, lsvt voice rehabilitation, and heart-statlog, respectively. Diverse predictive outcomes were produced. With regard to the heart-statlog dataset (Tab. 2 and Fig. 2), IBk, FRNN, and J48 had sensitivity rates of 75.20%, 75.60%, and 76.70%, respectively. These were followed by the JRip, RF, and simple logistic algorithms, the reported rates of which were 78.90%, 81.10%, and 83.30%, respectively. The proposed model showed superiority over the other algorithms, with a rate of 84.10%. This is on par with that of SMO. The FPR must be at its minimum to be considered as best performance. In line with this, the proposed algorithm produced a 17.40% false positive rate. Only the simple logistic and SMO algorithms were better, with false positive rate of 17.30% and 16.70%, respectively.

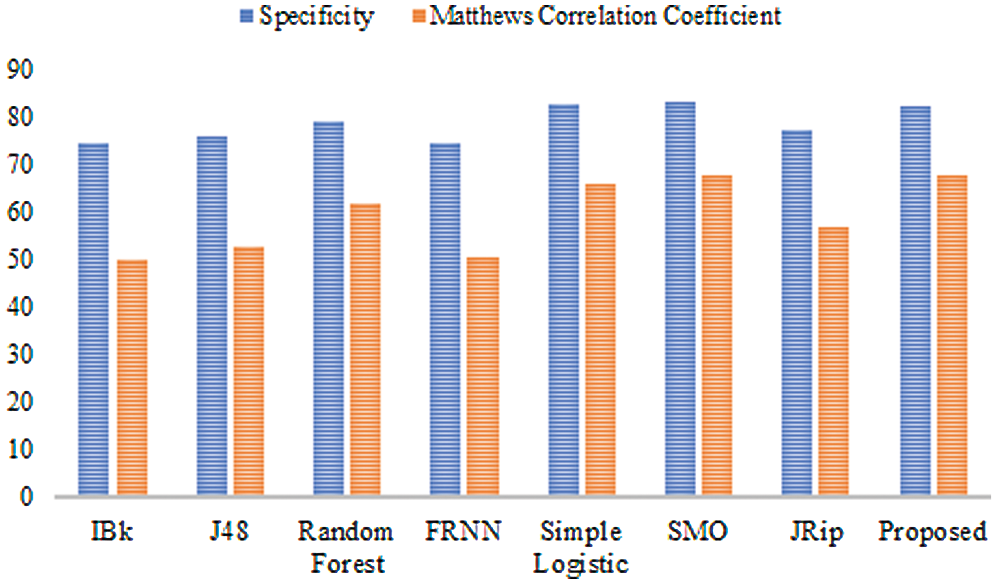
Figure 2: Results for the heart-statlog data
In terms of specificity, the proposed model surpassed some other algorithms, with a rate of 82.60%. Moreover, the proposed ensemble model proved its superiority over the comparison algorithms as far as the MCC is concerned. The proposed model attained an MCC of 67.70%. Overall, the proposed model performed extremely well in comparison to other algorithms.
With regard to the lsvt voice rehabilitation dataset (Tab. 3 and Fig. 3), FRNN had a sensitivity rate of 72.20%, with both IBk and J48 producing rates of 75.40%. The proposed model surpassed JRip with a rate of 84.10%, which was on par with that of RF. The highest sensitivity was attributed to SMO, with a rate of 85.70%. The proposed algorithm had a false positive rate of 21.00%, and was ranked third. J48 had the poorest false positive rate (33.70%), and SMO had the best (16.70%).
Table 3: Lsvt voice rehabilitation
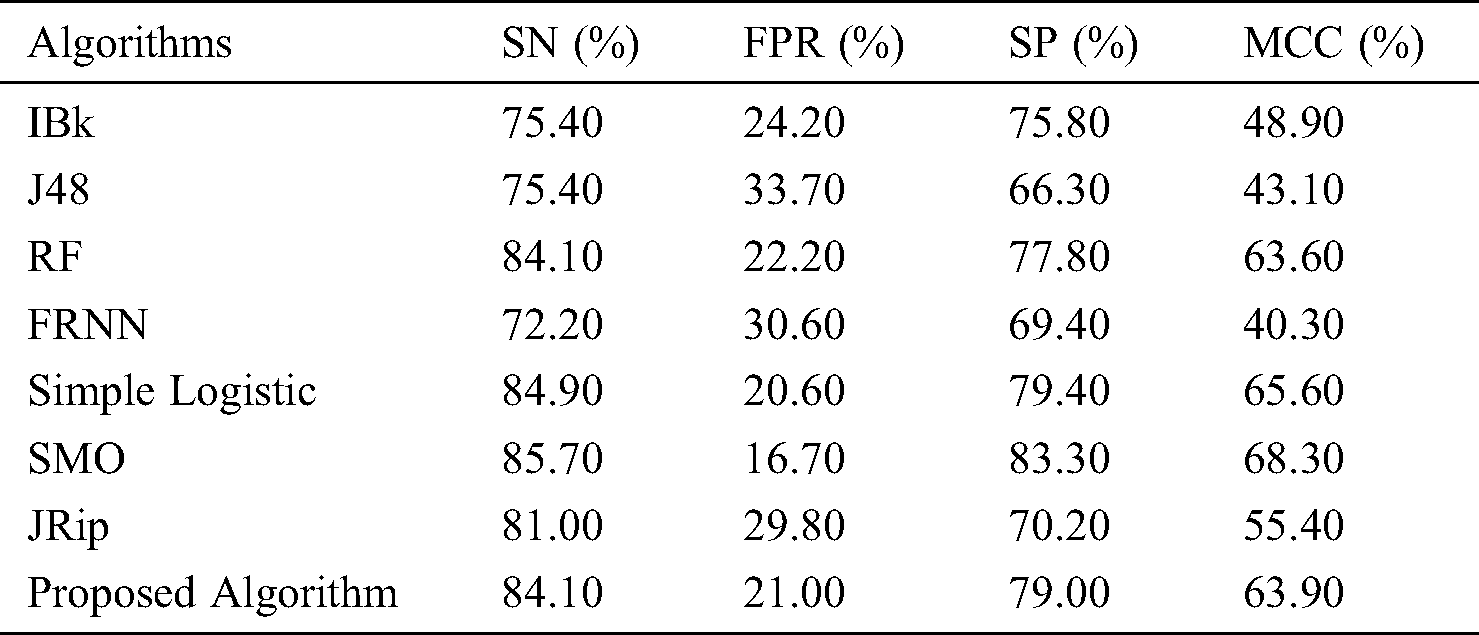
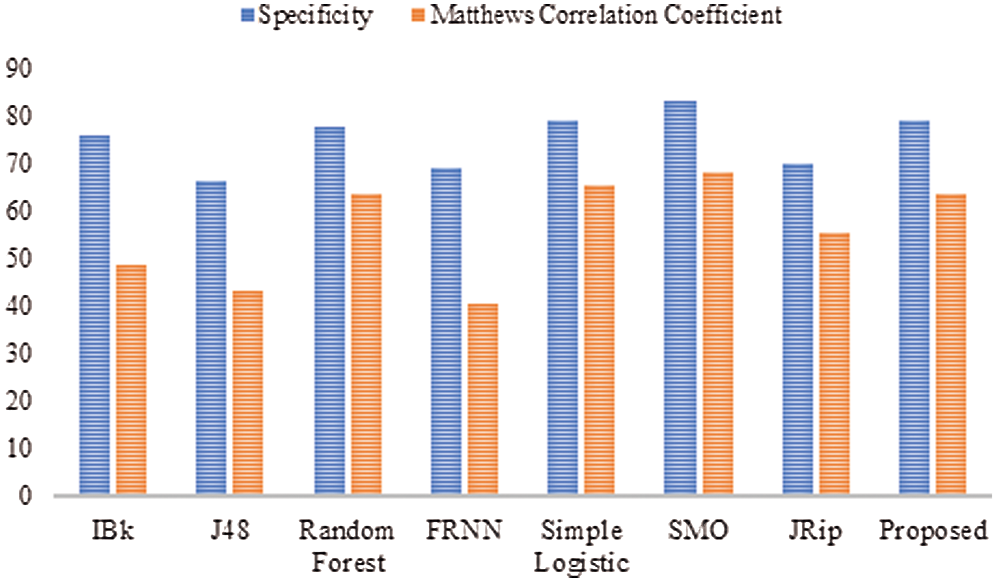
Figure 3: Outcomes for the lsvt voice rehabilitation data
In terms of specificity, the proposed model surpassed some other algorithms, with a rate of 79.00%. Similarly, the proposed model proved its superiority with its MCC of 63.90%. Ultimately, these results on the lsvt voice rehabilitation dataset revealed that the proposed model performed on par with the rest of the algorithms.
Finally, with regard to the leukemia dataset (Tab. 4 and Fig. 4), J48 and the RF produced sensitivity rates of 83.30% and 86.10%, respectively. This was followed by the algorithms IBk and JRip, with rates of 87.50% each. The proposed model showed superiority over the other algorithms, with a rate of 97.20%. The simple logistic and SMO algorithms also fell within the 94%–96% range. With regard to the false positive rate, the proposed model had the best rate (3.30%). In comparison, RF had the poorest false positive rate (24.20%).
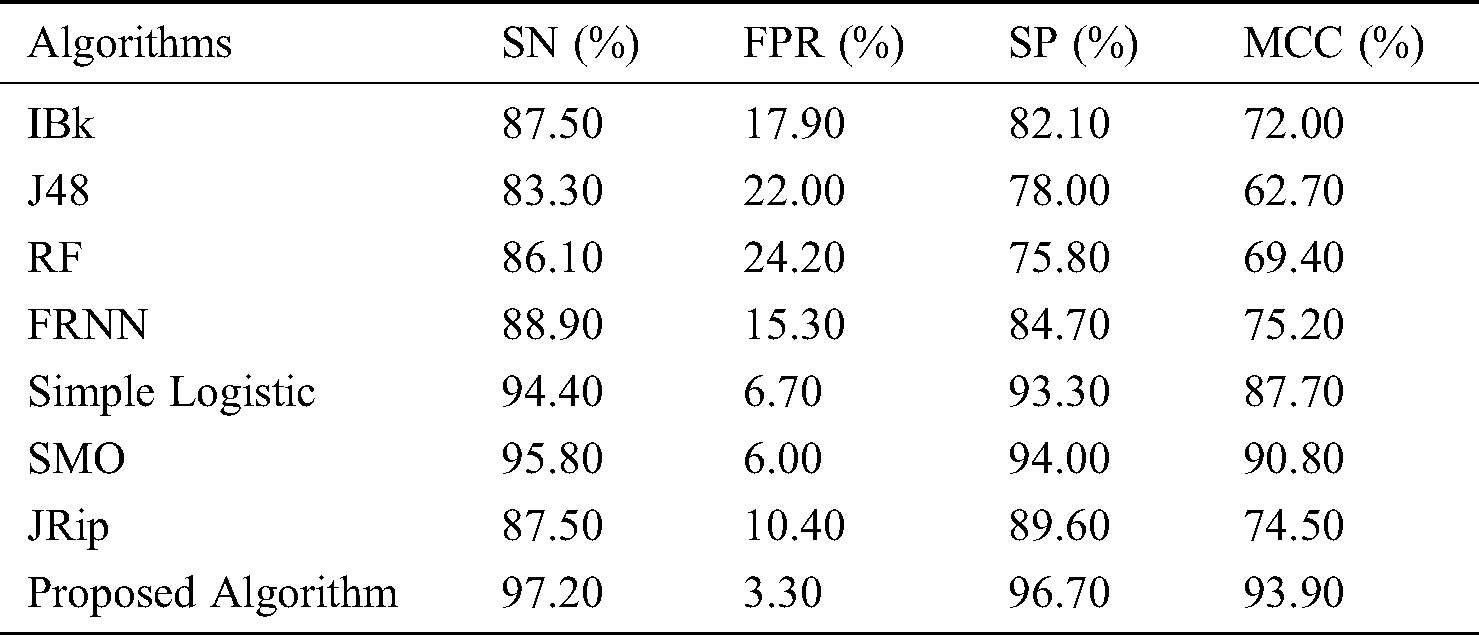
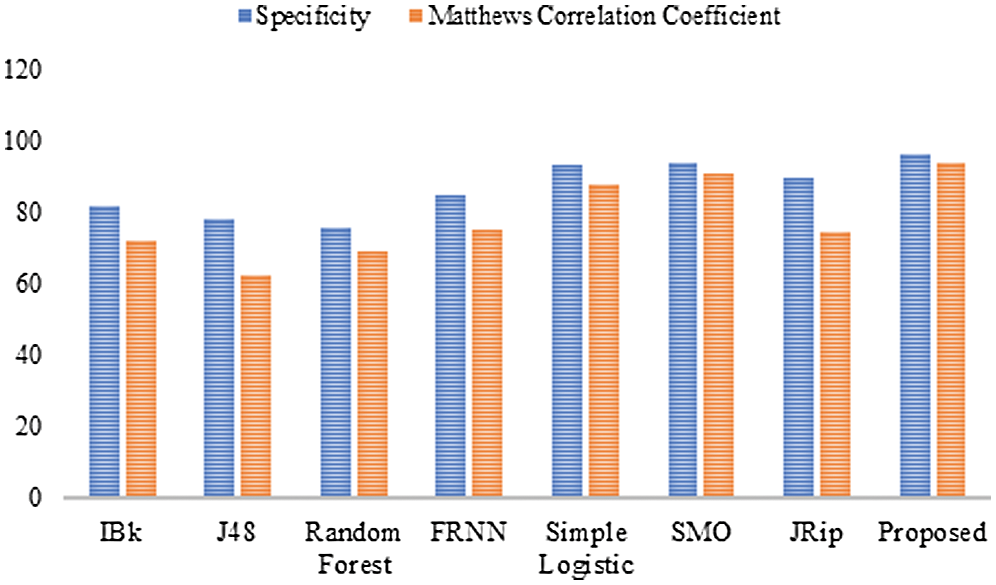
Figure 4: Results for the leukemia data
For specificity, the proposed algorithm again surpassed the other algorithms, obtaining a specificity of 96.70%. The proposed algorithm’s superiority was also reflected by its MCC of 93.90%. In summary, the proposed model performed best overall.
7.4 Receiver Operating Characteristic
The receiver operating characteristic (ROC) curves for all the algorithms obtained following experiments on all datasets are presented in Figs. 5–7. They are analogous to the corresponding receiver operating characteristic (AUC) values generated by the ROC curves presented in Tab. 5. For the heart-statlog data, the proposed model had a better AUC (0.8335) than all other algorithms except for SMO (0.8370). The simple logistic algorithm followed closely, with an AUC of 0.8300, while IBk produced the lowest AUC value (0.7500). For lsvt voice rehabilitation, the proposed model performed better than five of the algorithms. Only two algorithms, the SMO and simple logistic algorithms (with AUC values of 0.8215 and 0.8450, respectively), were superior to the proposed model (AUC of 0.8155). The result for the leukemia data confirms the superiority of the proposed algorithm, which obtained an AUC of 0.9695. None of the other algorithms fell below the 0.8000 AUC range, and the lowest AUC value was obtained by J48 (0.8065).
Table 5: AUC for all the algorithms for the datasets
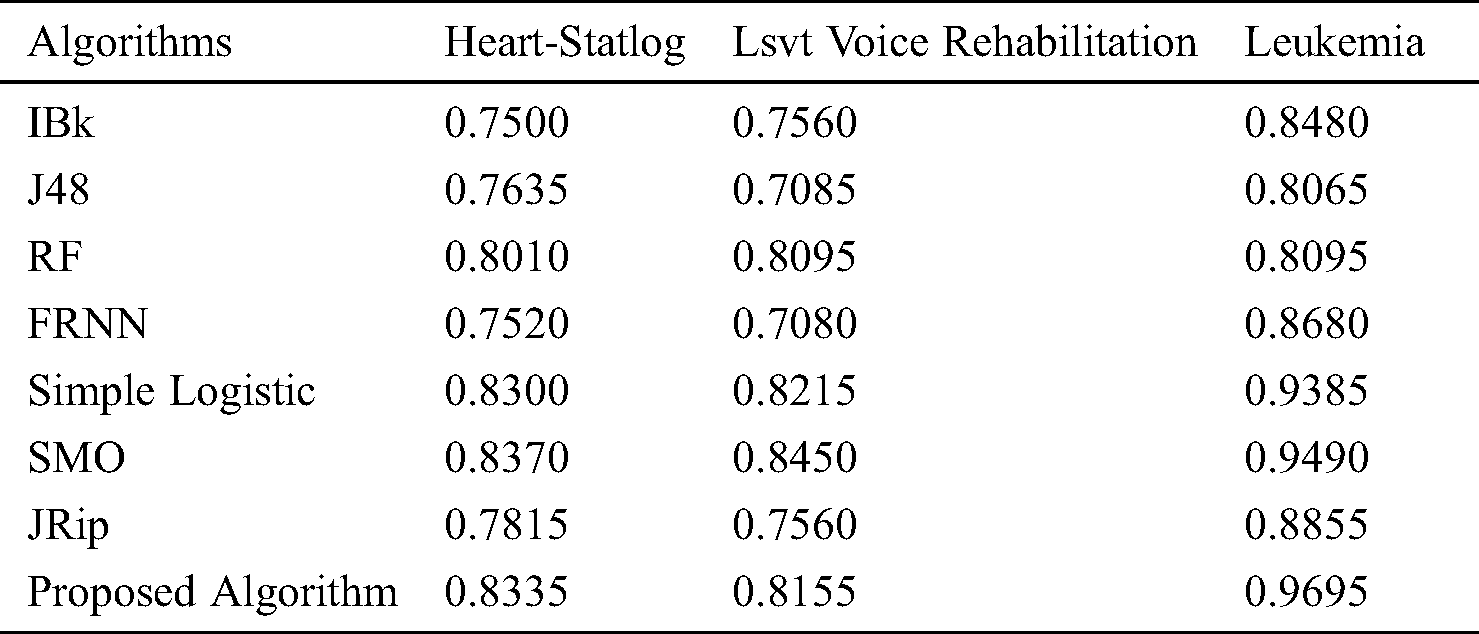
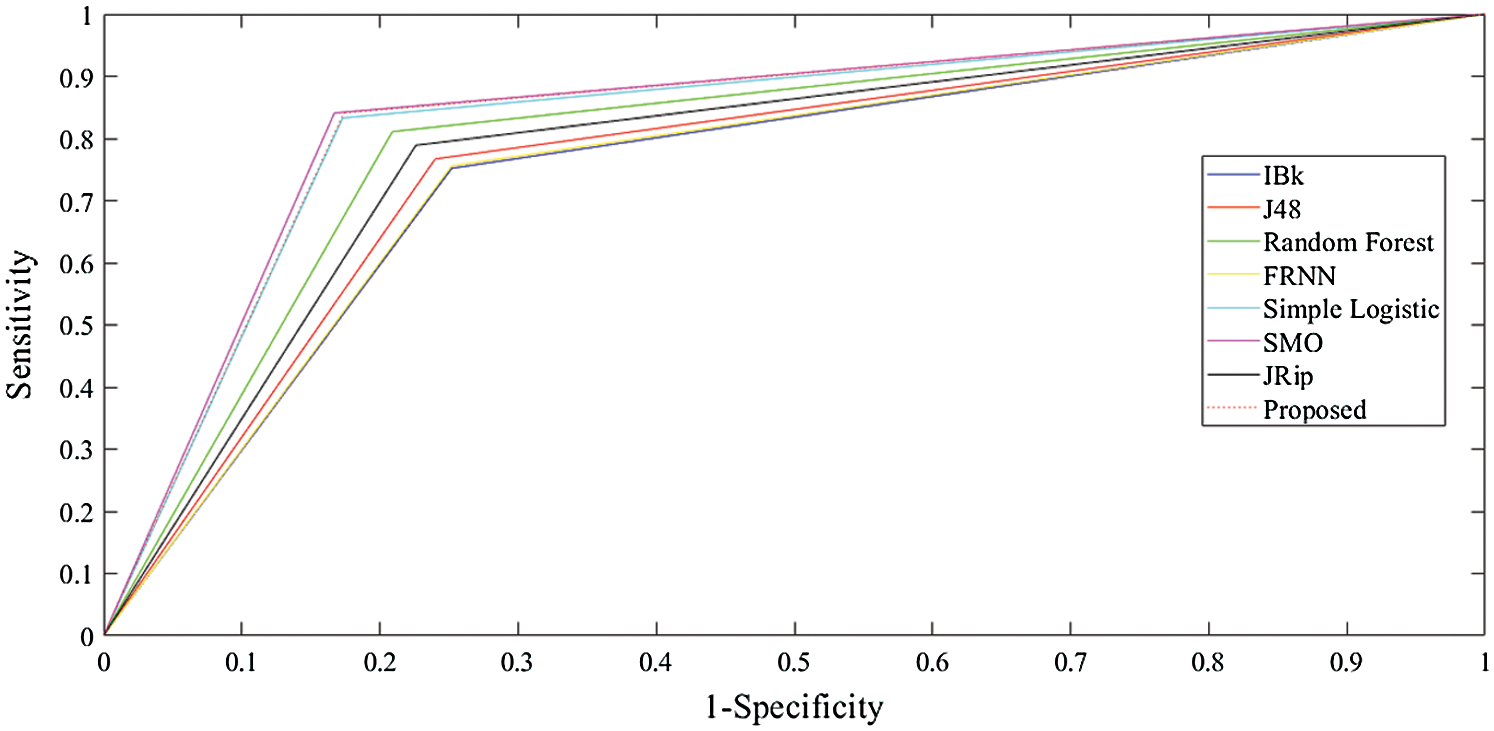
Figure 5: ROC curves for heart-statlog data
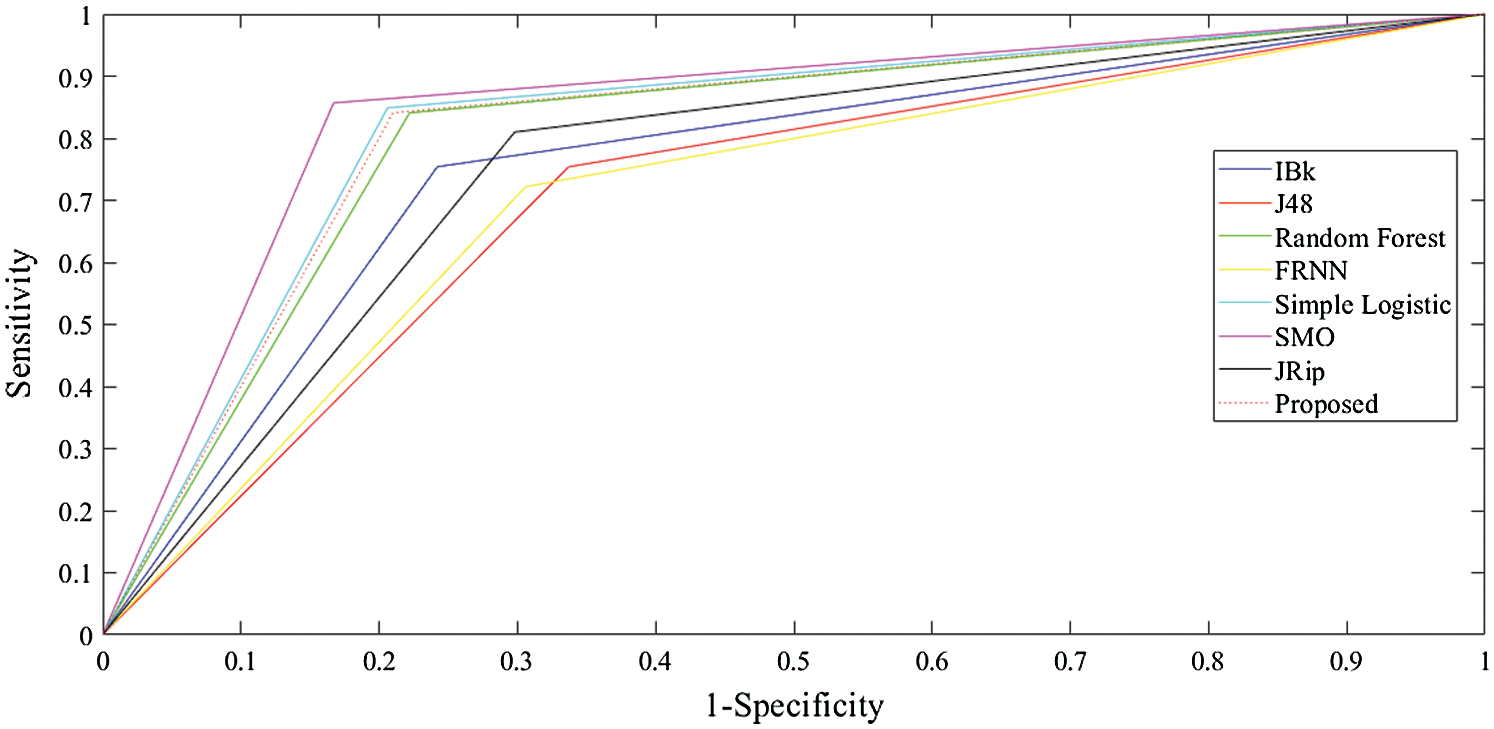
Figure 6: ROC curves for lsvt voice rehabilitation data
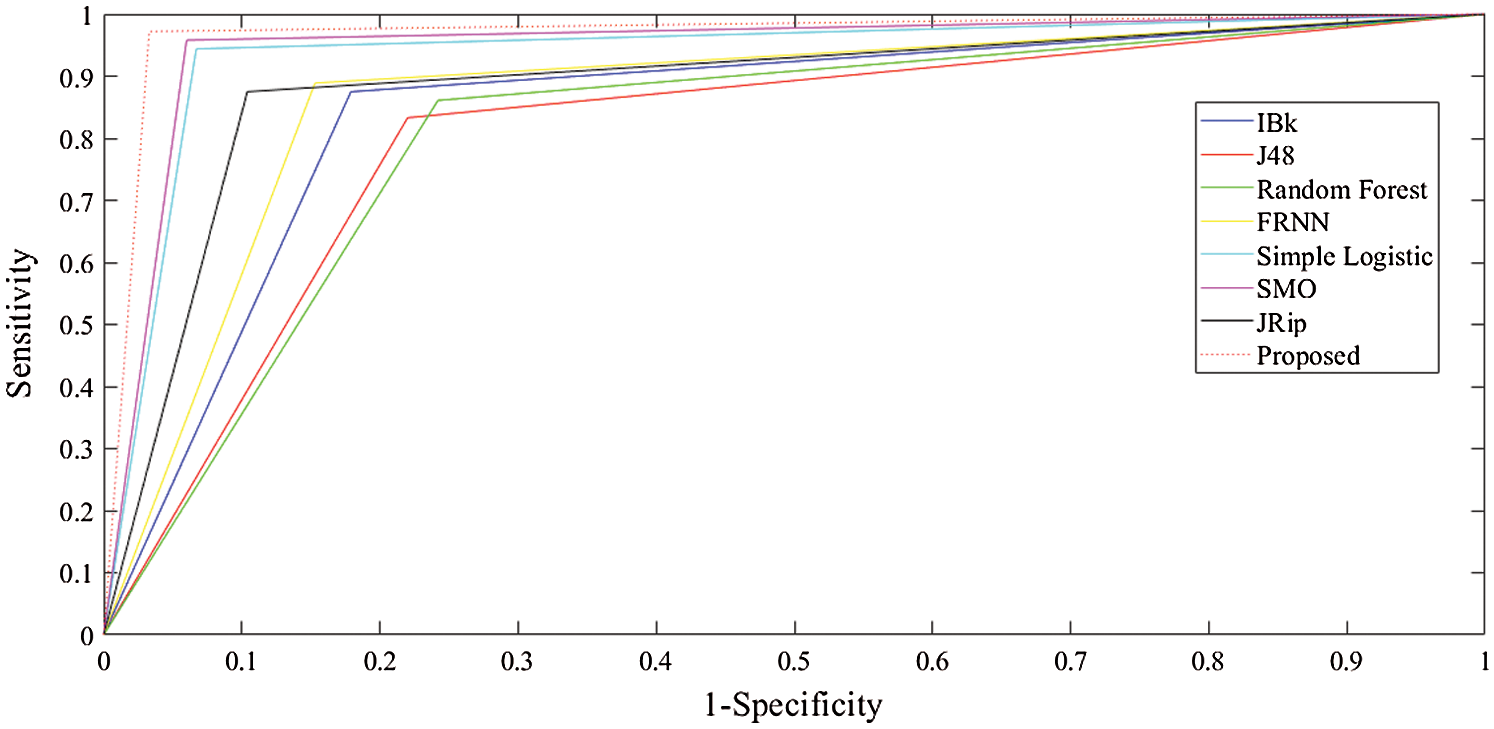
Figure 7: ROC curves for leukemia data
This paper proposed the concatenation of three diverse and unique machine learning algorithms as a multi-agent classifier system that relies on a stacked ensemble for medical diagnoses. The simple logistic, SMO, and JRip algorithms were used. VQRS proved useful for extracting subsets to reduce the large dataset features and eradication noise. Combining VQRS and an ensemble algorithm improved prediction. The base classifiers trained on the medical datasets, and the combined prediction was acted on by the meta-classifier. The selection of features improved the performance of the ensemble algorithm. For the heart-statlog and leukemia data, the best sensitivity was achieved by the proposed algorithm, with 84.10% and 97.20%, respectively. An enhanced sensitivity result for the lsvt voice rehabilitation data was also noted. Overall, the proposed multi-agent ensemble can increase the accuracy and decrease false positive rates for medical diagnoses.
Funding Statement: The authors received no specific funding for this study.
Conflicts of Interest: The authors declare that they have no conflicts of interest to report regarding the present study.
1. Q. Al-Tashi, H. Rais and S. J. Abdulkadir. (2018). “Hybrid swarm intelligence algorithms with ensemble machine learning for medical diagnosis,” in 2018 4th International Conference on Computer and Information Sciences (ICCOINSKuala Lumpur, Malaysia, pp. 1–6. [Google Scholar]
2. R. Ani, J. Jose, M. Wilson and O. S. Deepa. (2018). “Modified rotation forest ensemble classifier for medical diagnosis in decision support systems,” in Progress in Advanced Computing and Intelligent Engineering, Springer, C. V. Raman College of Engineering, Bhubaneswar, India, pp. 137–146. [Google Scholar]
3. E. Tuba, I. Strumberger, T. Bezdan, N. Bacanin and M. Tuba. (2019). “Classification and feature selection method for medical datasets by brain storm optimization algorithm and support vector machine,” Procedia Computer Science, vol. 162, pp. 307–315. [Google Scholar]
4. R. Spencer, F. Thabtah, N. Abdelhamid and M. Thompson. (2020). “Exploring feature selection and classification methods for predicting heart disease,” Digital Health, vol. 6, pp. 2055207620914777. [Google Scholar]
5. U. M. Khaire and R. Dhanalakshmi. (2019). “Stability of feature selection algorithm: A review,” Journal of King Saud University - Computer and Information Sciences, . https://www.sciencedirect.com/science/article/pii/S1319157819304379. [Google Scholar]
6. M. Rajab and D. Wang. (2020). “Practical challenges and recommendations of filter methods for feature selection,” Journal of Information & Knowledge Management, vol. 19, no. 01, pp. 2040019. [Google Scholar]
7. B. Tarle, S. Chintakindi and S. Jena. (2020). “Integrating multiple methods to enhance medical data classification,” Evolving Systems, vol. 11, no. 1, pp. 133–142. [Google Scholar]
8. G. Kumar, K. Thakur and M. R. Ayyagari. (2020). “MLEsIDSs: Machine learning based ensembles for intrusion detection systems—a review,” Journal of Supercomputing, vol. 76, no. 1, pp. 1–34. [Google Scholar]
9. M. H. D. M. Ribeiro and L. dos Santos Coelho. (2020). “Ensemble approach based on bagging, boosting and stacking for short-term prediction in agribusiness time series,” Applied Soft Computing, vol. 86, pp. 105837. [Google Scholar]
10. F. Divina, A. Gilson, F. Goméz-Vela, M. Garcia Torres and J. F. Torres. (2018). “Stacking ensemble learning for short-term electricity consumption forecasting,” Energies, vol. 11, no. 4, pp. 949. [Google Scholar]
11. M. Peker. (2016). “A decision support system to improve medical diagnosis using a combination of k-medoids clustering based attribute weighting and SVM,” Journal of Medical Systems, vol. 40, no. 5, pp. 116. [Google Scholar]
12. A. Soltani, T. Battikh, I. Jabri and N. Lakhoua. (2018). “A new expert system based on fuzzy logic and image processing algorithms for early glaucoma diagnosis,” Biomedical Signal Processing and Control, vol. 40, pp. 366–377. [Google Scholar]
13. W. Sun, T.-L. B. Tseng, J. Zhang and W. Qian. (2017). “Enhancing deep convolutional neural network scheme for breast cancer diagnosis with unlabeled data,” Computerized Medical Imaging and Graphics, vol. 57, pp. 4–9. [Google Scholar]
14. H. Wang, B. Zheng, S. W. Yoon and H. S. Ko. (2018). “A support vector machine-based ensemble algorithm for breast cancer diagnosis,” European Journal of Operational Research, vol. 267, no. 2, pp. 687–699. [Google Scholar]
15. F. Ye. (2018). “Evolving the SVM model based on a hybrid method using swarm optimization techniques in combination with a genetic algorithm for medical diagnosis,” Multimedia Tools and Applications, vol. 77, no. 3, pp. 3889–3918. [Google Scholar]
16. R. M. Ghoniem. (2020). “A novel bio-inspired deep learning approach for liver cancer diagnosis,” Information, vol. 11, no. 2, pp. 80. [Google Scholar]
17. A. Khamparia, A. Singh, D. Anand, D. Gupta, A. Khanna et al. (2020). , “A novel deep learning-based multi-model ensemble method for the prediction of neuromuscular disorders,” Neural Computing & Applications, vol. 32, pp. 11083–11095. [Google Scholar]
18. A. M. Anter and M. Ali. (2020). “Feature selection strategy based on hybrid crow search optimization algorithm integrated with chaos theory and fuzzy c-means algorithm for medical diagnosis problems,” Soft Computing, vol. 24, no. 3, pp. 1565–1584. [Google Scholar]
19. M. Nilashi, H. Ahmadi, L. Shahmoradi, O. Ibrahim and E. Akbari. (2019). “A predictive method for hepatitis disease diagnosis using ensembles of neuro-fuzzy technique,” Journal of Infection and Public Health, vol. 12, no. 1, pp. 13–20. [Google Scholar]
20. H. I. Suk, S. W. Lee and D. Shen. (2017). “Deep ensemble learning of sparse regression models for brain disease diagnosis,” Medical Image Analysis, vol. 37, pp. 101–113. [Google Scholar]
21. F. Xiao and W. Ding. (2019). “Divergence measure of Pythagorean fuzzy sets and its application in medical diagnosis,” Applied Soft Computing, vol. 79, pp. 254–267. [Google Scholar]
22. A. Borucka. (2020). “Logistic regression in modeling and assessment of transport services,” Open Engineering, vol. 10, no. 1, pp. 26–34. [Google Scholar]
23. A. F. Lukman, A. Emmanuel, O. A. Clement and K. Ayinde. (2020). “A modified ridge-type logistic estimator,” Iranian Journal of Science and Technology, Transactions A: Science, vol. 44, pp. 1–7. [Google Scholar]
24. S. Le Cessie and J. C. Van Houwelingen. (1992). “Ridge estimators in logistic regression,” Journal of the Royal Statistical Society: Series C (Applied Statistics), vol. 41, no. 1, pp. 191–201. [Google Scholar]
25. D. H. Pandya, S. H. Upadhyay and S. P. Harsha. (2014). “Fault diagnosis of rolling element bearing by using multinomial logistic regression and wavelet packet transform,” Soft Computing, vol. 18, no. 2, pp. 255–266. [Google Scholar]
26. M. Alazab. (2020). “Automated malware detection in mobile app stores based on robust feature generation,” Electronics, vol. 9, no. 3, pp. 435. [Google Scholar]
27. B. T. Pham, I. Prakash, W. Chen, H. B. Ly, L. S. Ho et al. (2019). , “A novel intelligence approach of a sequential minimal optimization-based support vector machine for landslide susceptibility mapping,” Sustainability, vol. 11, no. 22, pp. 6323. [Google Scholar]
28. J. Platt. (1998). “Sequential minimal optimization: A fast algorithm for training support vector machines.” Microsoft Research, Technical Report MSR-TR-98-14, pp. 1–21. [Google Scholar]
29. L. J. Cao, S. S. Keerthi, C. J. Ong, J. Q. Zhang, U. Periyathamby et al. (2006). , “Parallel sequential minimal optimization for the training of support vector machines,” IEEE Transactions on Neural Networks, vol. 17, no. 4, pp. 1039–1049. [Google Scholar]
30. A. Barbero and J. R. Dorronsoro. (2011). “Momentum sequential minimal optimization: An accelerated method for support vector machine training,” in The 2011 International Joint Conference on Neural Networks, San Jose, CA, USA, pp. 370–377. [Google Scholar]
31. K. Avinash, M. B. Bijoy and P. B. Jayaraj. (2020). “Early detection of breast cancer using support vector machine with sequential minimal optimization,” in Advanced Computing and Intelligent Engineering, B. Pati, C. Panigrahi, R. Buyya, K. C. Li (eds.Singapore: Springer, pp. 13–24. [Google Scholar]
32. W. W. Cohen. (1995). “Fast effective rule induction,” in Machine Learning Proceedings 1995, Elsevier, Tahoe City, California, pp. 115–123. [Google Scholar]
33. N. Fazakis, G. Kostopoulos, S. Kotsiantis and I. Mporas. (2020). “Iterative robust semi-supervised missing data imputation,” IEEE Access, vol. 8, pp. 90555–90569. [Google Scholar]
34. J. Tanha, H. Salarabadi, M. Aznab, A. Farahi and M. Zoberi. (2020). “Relationship among prognostic indices of breast cancer using classification techniques,” Informatics in Medicine Unlocked, vol. 18, pp. 100265. [Google Scholar]
35. A. A. Aburomman and M. B. I. Reaz. (2017). “A survey of intrusion detection systems based on ensemble and hybrid classifiers,” Computers & Security, vol. 65, pp. 135–152. [Google Scholar]
36. S. Rajagopal, P. P. Kundapur and K. S. Hareesha. (2020). “A stacking ensemble for network intrusion detection using heterogeneous datasets,” Security and Communication Networks, vol. 2020, no. 1, pp. 1–9. [Google Scholar]
37. H. Kwon, J. Park and Y. Lee. (2019). “Stacking ensemble technique for classifying breast cancer,” Healthcare Informatics Research, vol. 25, no. 4, pp. 283–288. [Google Scholar]
38. X. Gao, C. Shan, C. Hu, Z. Niu and Z. Liu. (2019). “An adaptive ensemble machine learning model for intrusion detection,” IEEE Access, vol. 7, pp. 82512–82521. [Google Scholar]
39. Z. Pawlak. (1982). “Rough sets,” International Journal of Computer & Information Sciences, vol. 11, no. 5, pp. 341–356. [Google Scholar]
40. Z. Pawlak. (2012). “Rough sets: Theoretical aspects of reasoning about data,” in Z. Pawlak (ed.Theory and Decision Library. Series D, System Theory, Knowledge Engineering, and Problem Solving. vol. 9, Springer Science & Business Media, Dordrecht. [Google Scholar]
41. A. Lasisi, N. Tairan, R. Ghazali, W. K. Mashwani, S. N. Qasem et al. (2019). , “Predicting crude oil price using fuzzy rough set and bio-inspired negative selection algorithm,” International Journal of Swarm Intelligence Research, vol. 10, no. 4, pp. 25–37. [Google Scholar]
42. C. Cornelis, M. De Cock and A. M. Radzikowska. (2007). “Vaguely quantified rough sets,” in International Workshop on Rough Sets, Fuzzy Sets, Data Mining, and Granular-Soft Computing, Toronto, Canada, pp. 87–94. [Google Scholar]
43. A. Ferone. (2018). “Feature selection based on composition of rough sets induced by feature granulation,” International Journal of Approximate Reasoning, vol. 101, pp. 276–292. [Google Scholar]
44. M. Amiri and R. Jensen. (2016). “Missing data imputation using fuzzy-rough methods,” Neurocomputing, vol. 205, pp. 152–164. [Google Scholar]
45. A. Lasisi, R. Ghazali, M. M. Deris, T. Herawan and F. Lasisi. (2016). “Extracting information in agricultural data using fuzzy-rough sets hybridization and clonal selection theory inspired algorithms,” International Journal of Pattern Recognition and Artificial Intelligence, vol. 30, no. 09, pp. 1660008. [Google Scholar]
46. X. Zhang, C. Mei, D. Chen and Y. Yang. (2018). “A fuzzy rough set-based feature selection method using representative instances,” Knowledge-Based Systems, vol. 151, pp. 216–229. [Google Scholar]
47. C. Wang, Y. Qi, M. Shao, Q. Hu, D. Chen et al. (2017). , “A fitting model for feature selection with fuzzy rough sets,” IEEE Transactions on Fuzzy Systems, vol. 25, no. 4, pp. 741–753. [Google Scholar]
48. S. Zhao, H. Chen, C. Li, X. Du and H. Sun. (2015). “A novel approach to building a robust fuzzy rough classifier,” IEEE Transactions on Fuzzy Systems, vol. 23, no. 4, pp. 769–786. [Google Scholar]
49. K. Bache and M. Lichman. (2013). “UCI machine learning repository,” vol. 901, . [Online]. Available: http://archive.ics.uci.edu/ml. [Google Scholar]
50. J. Li, K. Cheng, S. Wang, F. Morstatter, R. P. Trevino et al. (2018). , “Feature selection: A data perspective,” ACM Computing Surveys, vol. 50, no. 6, p. 94. [Google Scholar]
 | This work is licensed under a Creative Commons Attribution 4.0 International License, which permits unrestricted use, distribution, and reproduction in any medium, provided the original work is properly cited. |