DOI:10.32604/iasc.2021.016314
| Intelligent Automation & Soft Computing DOI:10.32604/iasc.2021.016314 | |
| Article |
Mixed Re-Sampled Class-Imbalanced Semi-Supervised Learning for Skin Lesion Classification
1Harbin Engineering University, College of Computer Science and Technology, Harbin, 150001, China
2Heilongjiang Hengxun Technology Co., Ltd., Harbin, 150001, China
3College of Engineering and Information Technology, Georgia Southern University, Statesboro, GA, 30458, USA
*Corresponding Author: Linshan Shen. Email: shenlinshan@hrbeu.edu.cn
Received: 21 December 2020; Accepted: 29 January 2021
Abstract: Skin cancer is one of the most common types of cancer in the world, melanoma is considered to be the deadliest type among other skin cancers. Quite recently, automated skin lesion classification in dermoscopy images has become a hot and challenging research topic due to its essential way to improve diagnostic performance, thus reducing melanoma deaths. Convolution Neural Networks (CNNs) are at the heart of this promising performance among a variety of supervised classification techniques. However, these successes rely heavily on large amounts of class-balanced clearly labeled samples, which are expensive to obtain for skin lesion classification in the real world. To address this issue, we propose a mixed re-sampled (MRS) class-imbalanced semi-supervised learning method for skin lesion classification, which consists of two phases, re-sampling, and multiple mixing methods. To counter class imbalance problems, a re-sampling method for semi-supervised learning is proposed, and focal loss is introduced to the semi-supervised learning to improve the classification performance. To make full use of unlabeled data to improve classification performance, Fmix and Mixup are used to mix labeled data with the pseudo-labeled unlabeled data. Experiments are conducted to demonstrate the effectiveness of the proposed method on class-imbalanced datasets, the results show the effectiveness of our method as compared with other state-of-the-art semi-supervised methods.
Keywords: Skin lesion classification; class imbalance; semi-supervised learning
Skin cancer is one of the major types of cancers with an increasing incidence over the past decades, with over 5 million newly diagnosed cases every year [1,2]. Malignant melanoma is the most lethal type and the majority of skin cancer deaths [3]. Although the mortality is significant, an early-stage melanoma can be cured through a simple excision, and the estimated 5-year survival exceeds 95% [4]. Consequently, accurate discrimination of malignant skin lesions from benign lesions such as seborrheic keratoses or benign nevi is crucial [5].
Dermoscopy [6], a recent technique of visual inspection has been established as an imaging modality that both magnifies the skin and eliminates surface reflection, is one of the essential means to improve diagnostic performance and reduce melanoma deaths of skin cancer compared to unaided visual inspection. Automatic classification of skin lesions, particularly melanoma, in dermoscopy images is a significant computer aided diagnosis task [7]. It is a very challenging task since the accuracy of skin lesion classification suffers from inter-class similarity and intra-class variation. As shown in Fig. 1, different skin lesion categories have visual similarity in shape and color, which is difficult to distinguish.
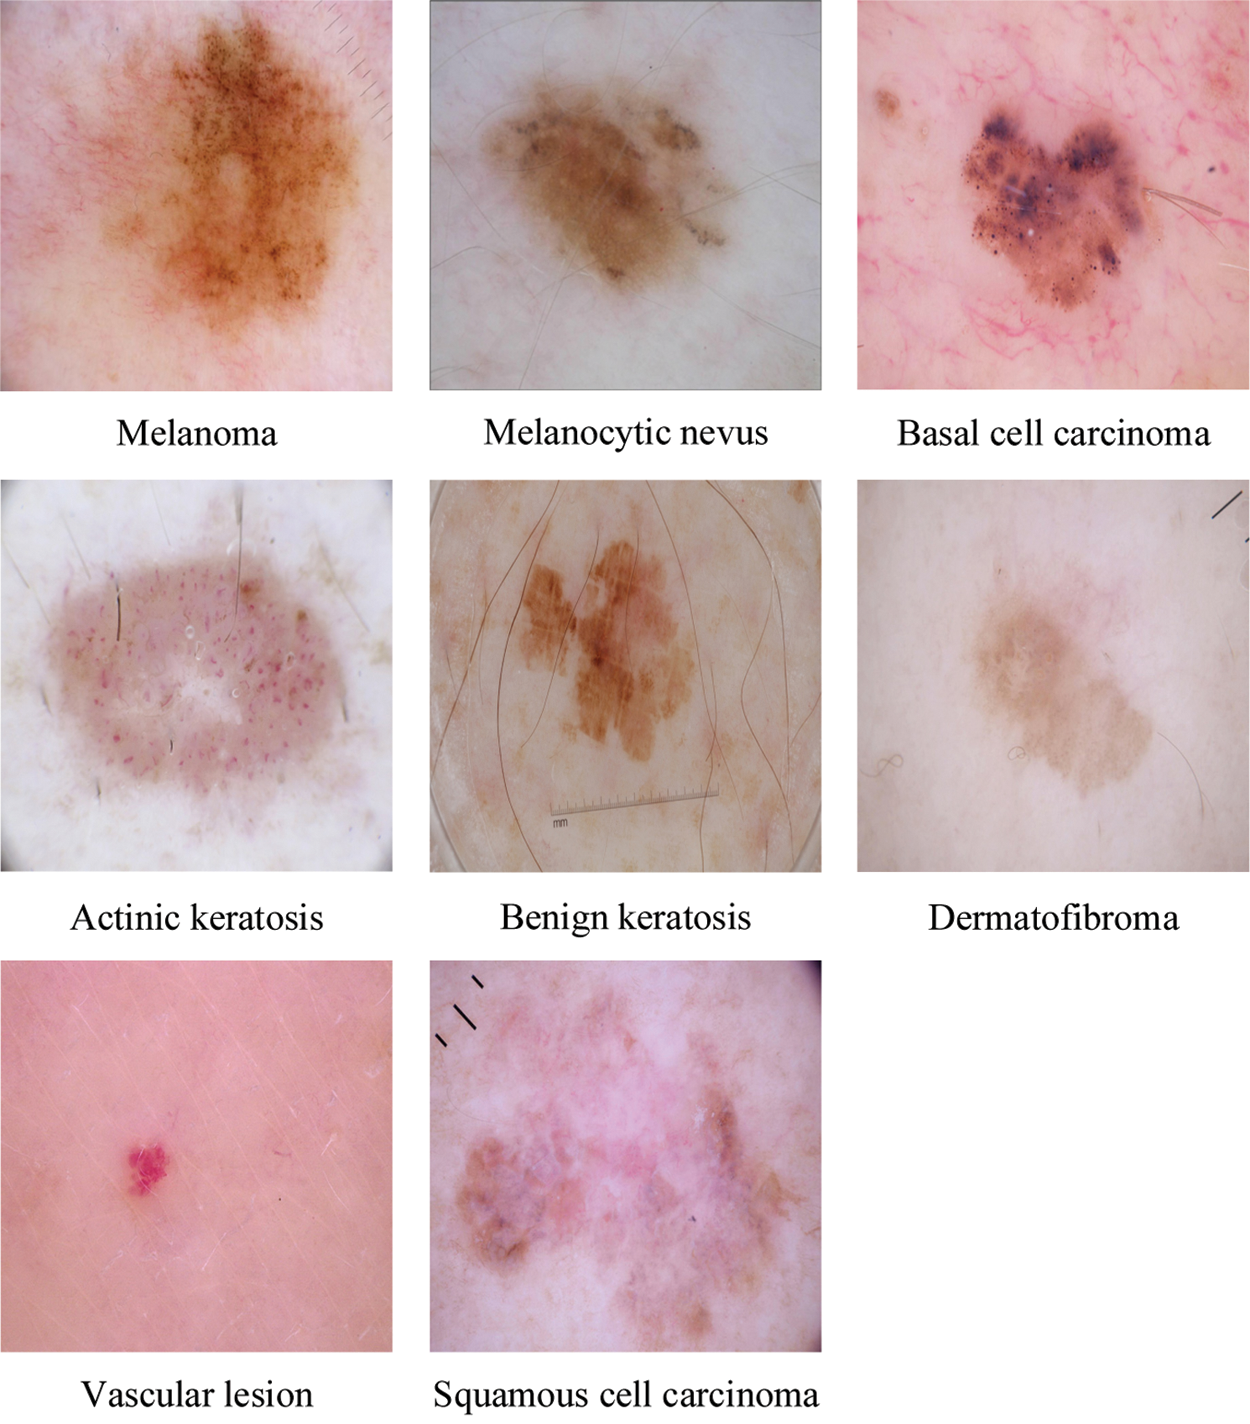
Figure 1: A sample of images for the eight classes in the ISIC skin 2019 dataset
Recently, convolutional neural networks (CNNs) which are trained end-to-end have been widely used and achieved remarkable success in a variety of visual recognition tasks [8–11]. Many researchers have advanced the skin lesion classification and have shown decent results [12,13]. Esteva et al. [14] trained the InceptionV3 architecture on 129,450 clinical images and the performance is comparable to 21 trained dermatologists. However, the success of this method is partly due to the existence of large labeled datasets. It is generally difficult to obtain a large number of well-refined annotated images in the field of skin lesion classification. Besides, the collected skin lesion original images are usually unlabeled, adding high-quality annotations to images artificially involves professional knowledge, accurately labeling unlabeled skin lesion images is difficult and time-consuming.
To alleviate this annotation burden, some semi-supervised learning algorithms have been proposed to improve the performance of models by utilizing the information contained in unlabeled data [15–17]. Most of the semi-supervised learning algorithms assume that each class of the training data has almost the number of samples, whether labeled or unlabeled. In practice, however, due to the difficulty in data acquisition and annotation, the class distribution of data in the medical field is usually unbalanced. In semi-supervised learning algorithms, using such data can cause performance degradation in the minority classes. Class imbalanced learning is a way to solve such class imbalance where it proposes various methods including re-sampling [18], re-weighting [19], and meta metric learning [20]. However, to our best knowledge, the studies on class imbalanced learning in the field of medical imaging focuses entirely on supervised learning and have not considered semi-supervised learning.
In this paper, we propose a mixed re-sample (MRS) class-imbalanced semi-supervised learning method for skin lesion classification. Mixed sample data augmentation is originally proposed to optimize the performance of classification tasks, and obtained state-of-the-art results in multiple supervised learning classification tasks. ICT [17] and Mixmatch [15] introduce Mixup [21], one of the mixed sample data augmentation methods, into semi-supervised learning, which further improves the recognition effect of the model. Inspired by this, Our MRS uses a variety of mixed sample data augmentation methods [22] to mix labeled and unlabeled samples. However, the mixed sample data augmentation can only optimize the performance of uniformly distributed samples, and the optimization effect is not obvious for samples with unevenly distributed categories. In order to solve this problem, we introduced re-sample technology. At the beginning of the training, ensure that the input label samples of the semi-supervised learning model are evenly distributed, and increase the proportion of the majority classes labeled data as the training process progresses.
Hence, in our work, a new training procedure has been introduced to improve the semi-supervised learning’s performance on a class-imbalanced dataset. First, for each batch of training phases, the labeled data is re-sampled to ensure that the model learns uniformly distributed data to learn general knowledge across the data distribution. Then, the labeled data is mixed with the pseudo-labeled unlabeled data by Mixup [21] and Fmix [22]. Finally, the model parameters are updated by using the mixed data. We evaluated the proposed MRS method on the ISIC skin 2019 dataset [23–25], which is the largest skin dermoscopy image publicly available, and achieved state-of-the-art performance compared with other semi-supervised learning methods.
The main contributions of this paper are thus summarized as follows:
1. We defined a class-imbalanced semi-supervised learning skin lesion classification task, reflecting a more realistic situation, and proposed a method to solve the task.
2. We introduce a re-sample to class-imbalanced semi-supervised learning method, which improves the classification performance of semi-supervised learning on class-imbalanced data.
3. Based on mixed sample data augmentation, we use Mixup and Fmix methods to mix the labeled data with pseudo-unlabeled data, further improve the generalization performance of the semi-supervised learning model.
4. The proposed class-imbalanced semi-supervised learning method adopts an end-to-end learning style and has achieved state-of-the-art results on the ISIC skin 2019 dataset.
The rest of the article is organized as follows: Section 2 details the proposed method. Based on the open dataset, experimental results as well as the discussion are given in Section 3. Finally, Section 4 gives the conclusion.
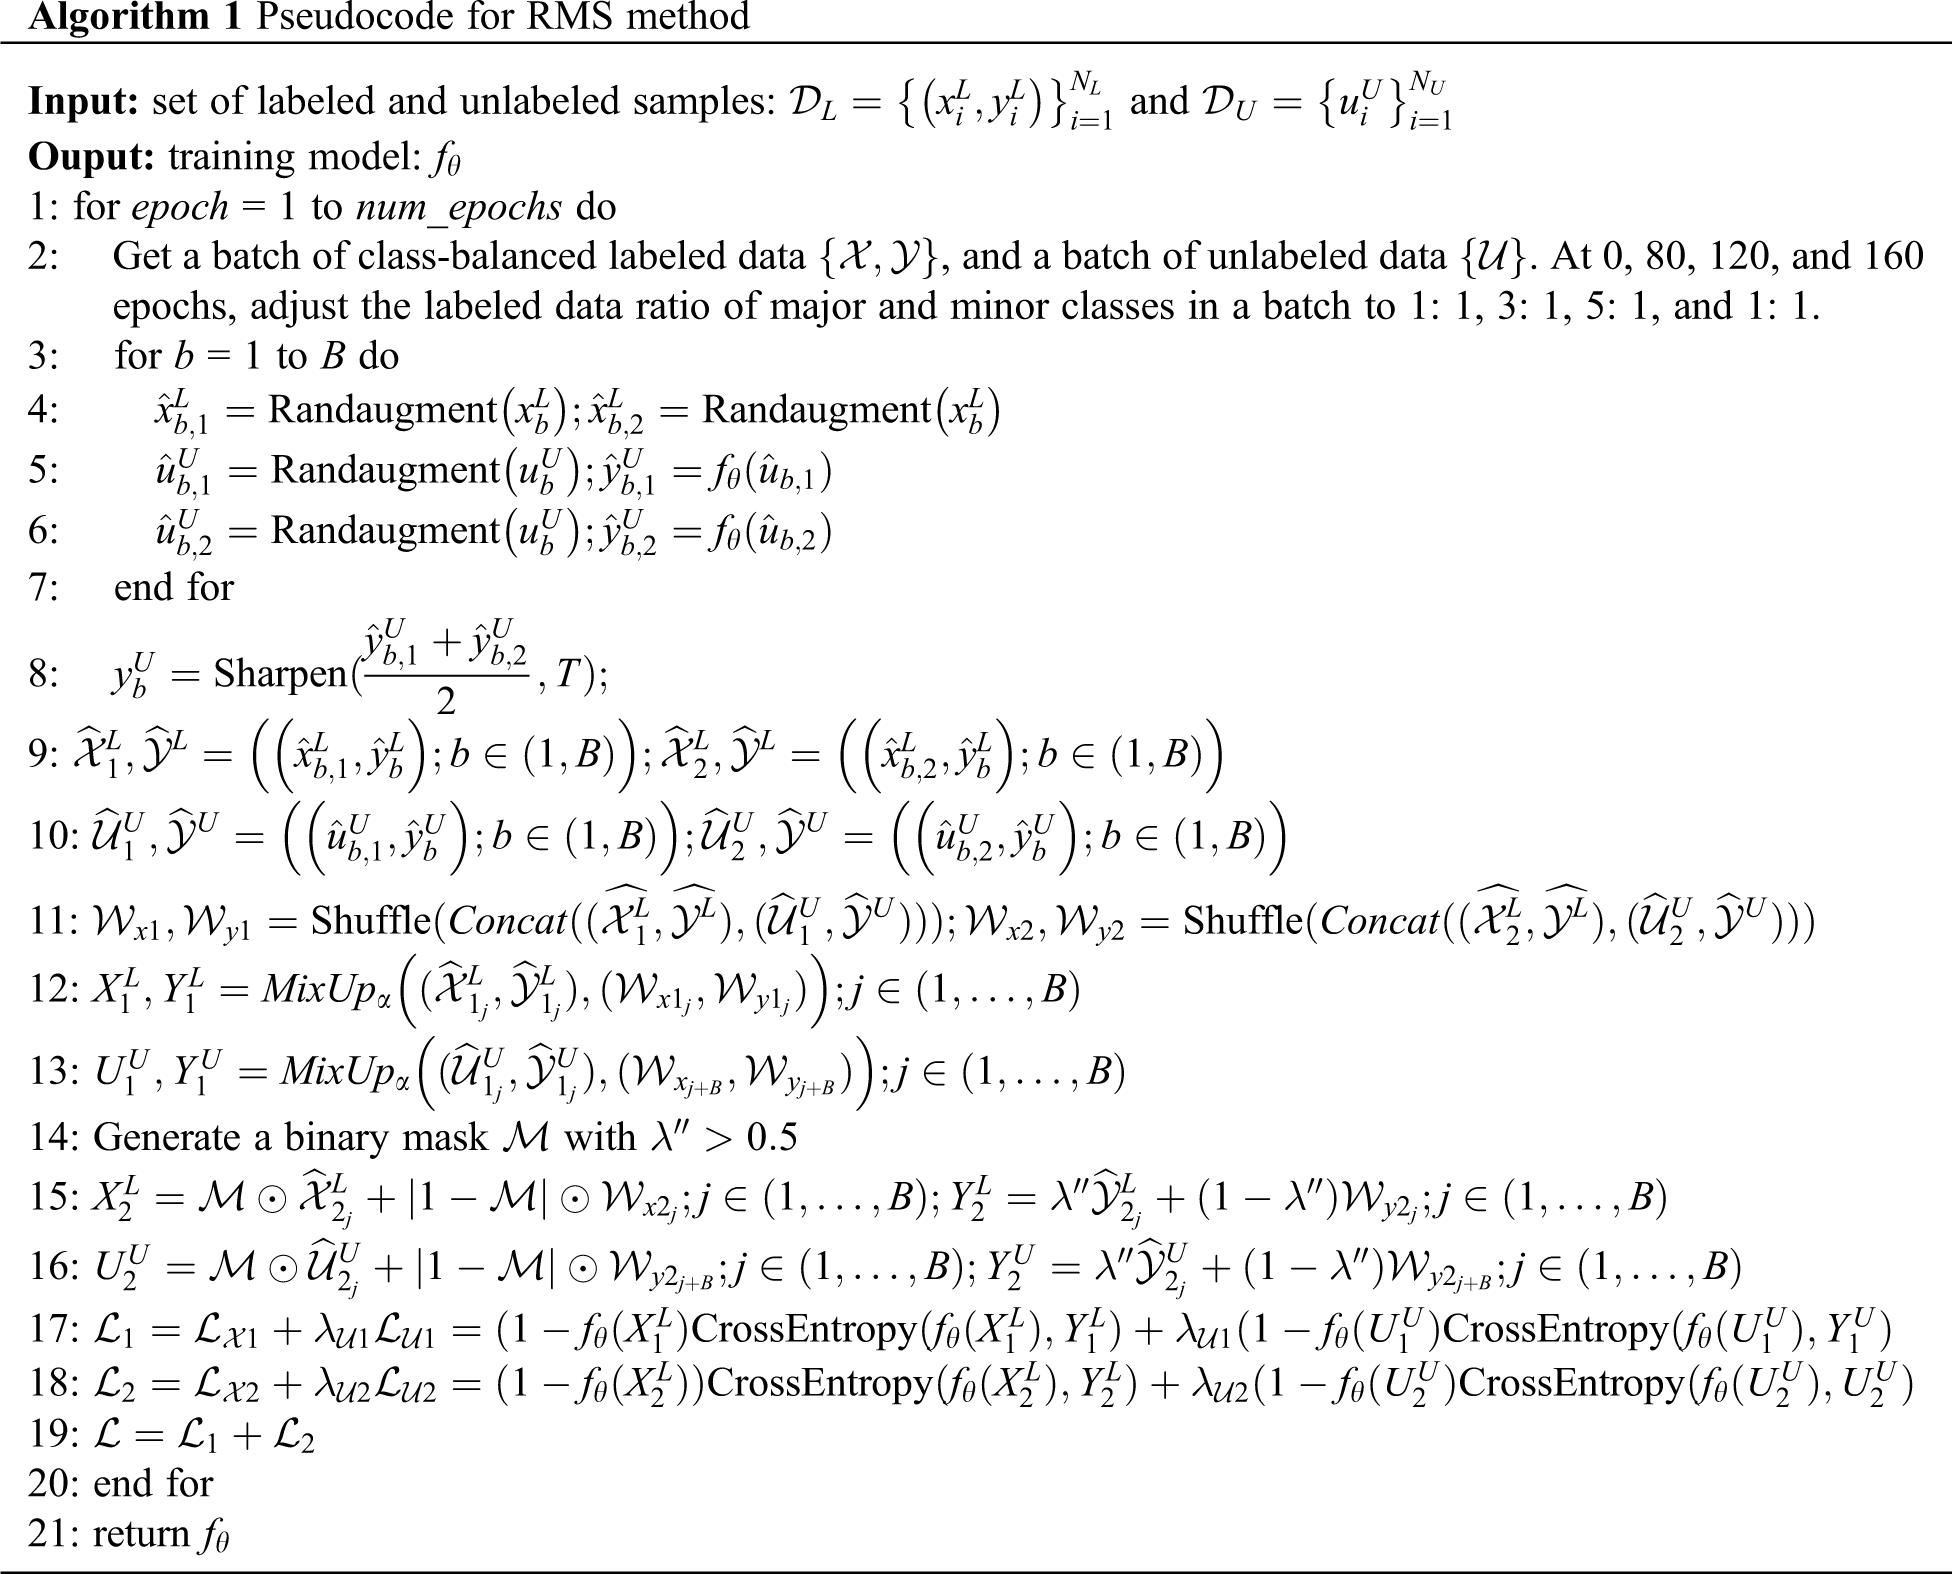
In this section, we introduce our proposed MRS method, which consists of a resampling strategy to balance the class-imbalanced data and a mix sample data augmentation strategy mixing labeled data with pseudo-unlabeled data to improve the model’s performance in skin lesion classification. An overview of Mix-RS is presented in Fig. 2 and Algorithm 1.
In general, we have a small class-imbalanced labeled data set
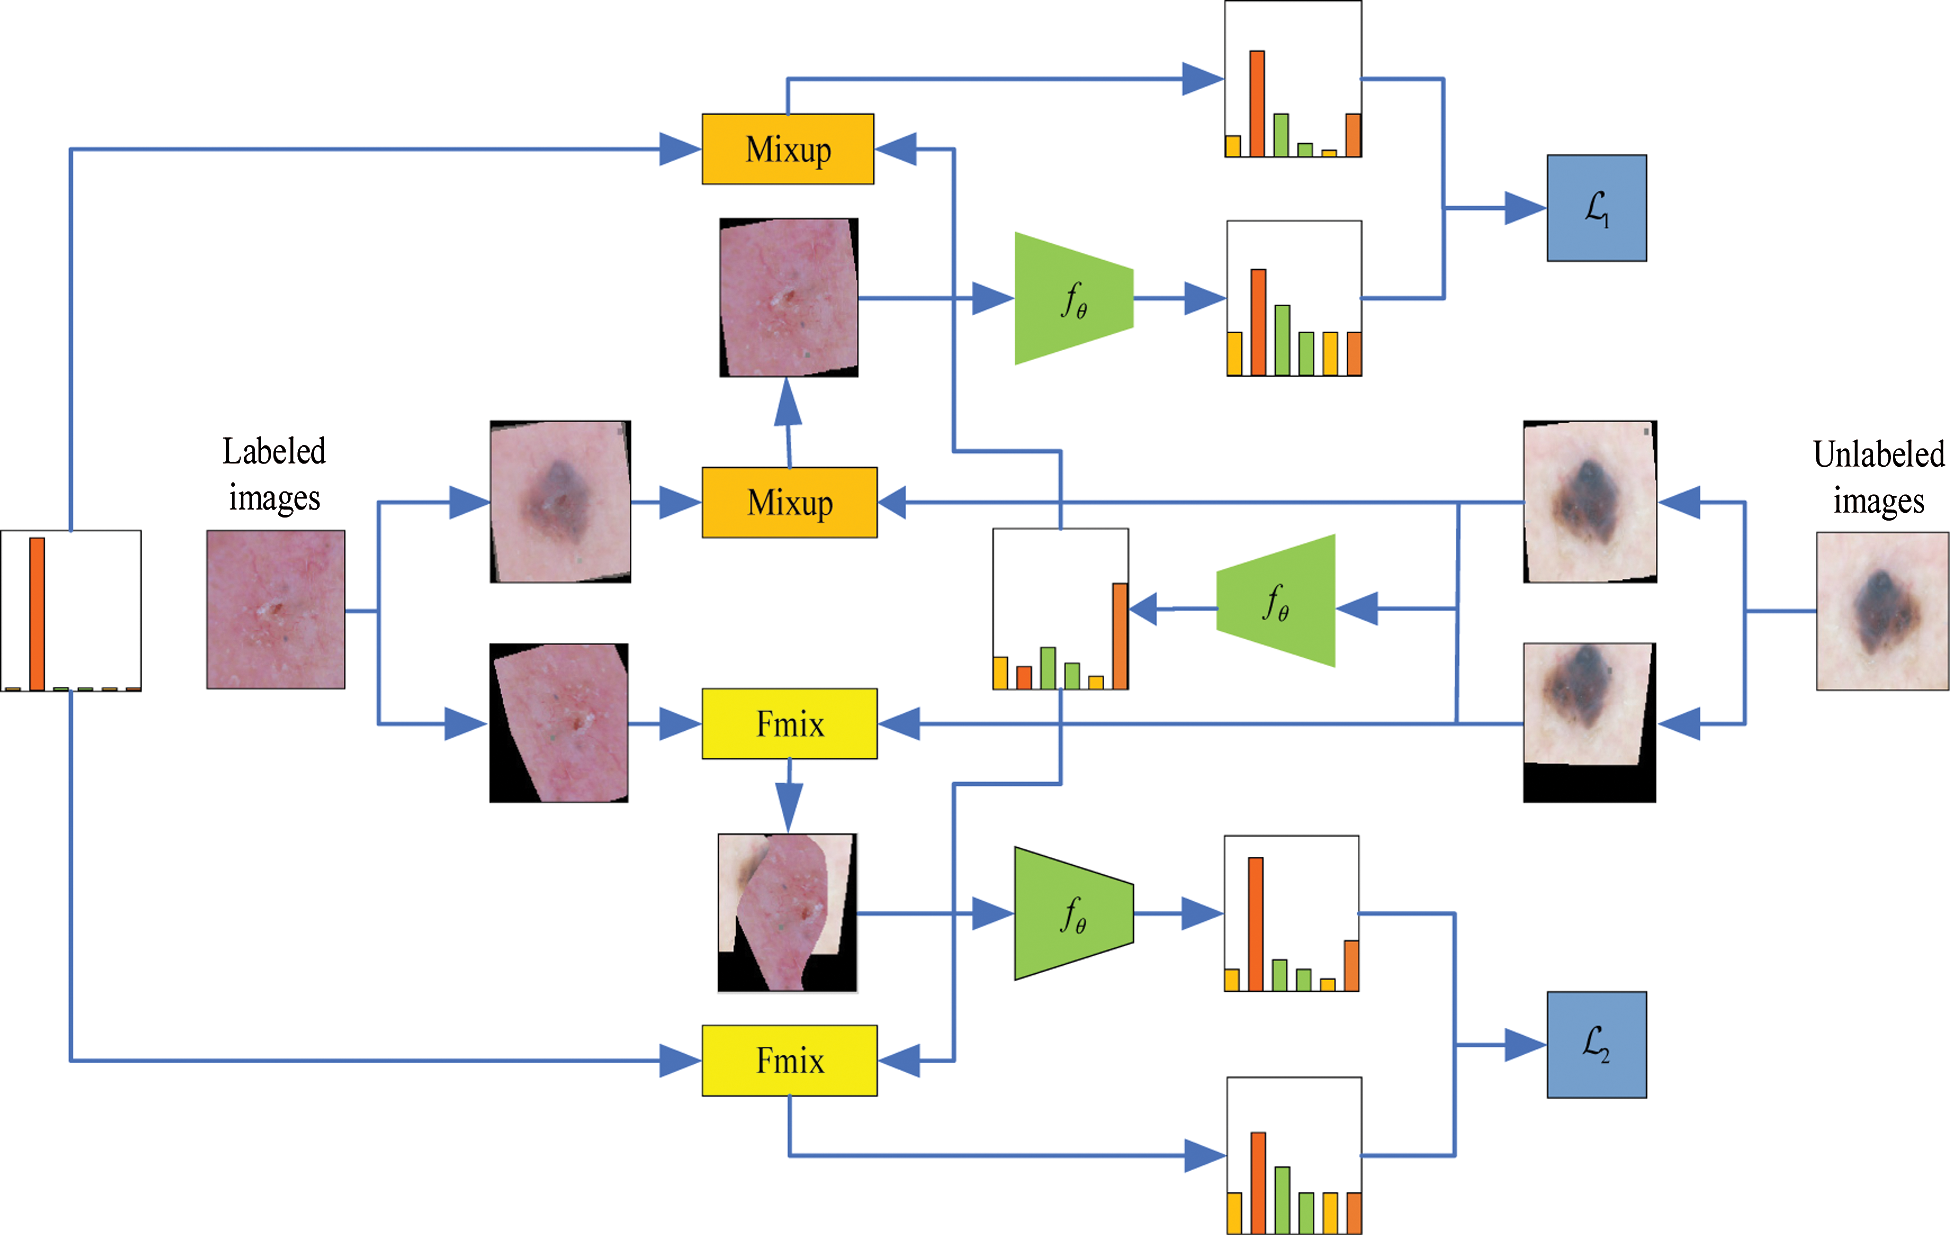
Figure 2: A sample of images for the eight classes in the ISIC skin 2019 dataset
The main steps are as follows: In the first step, the labeled samples are sampled to ensure that the labeled samples sent to the model at the beginning of the training are class-balanced. Details of the sampling labeled data will be presented in 2.2. At the same time, the same number of unlabeled samples are taken randomly. Two round stochastic data augmentation has been applied to both labeled and unlabeled samples. Assuming that
The number of samples for different categories in the labeled data set is usually different. Generally, the category with a larger number of samples is defined as the major class, and the category with a smaller number of samples is defined as the minor class. This class-imbalanced phenomenon also exists in the field of skin lesion classification. In order to solve class-imbalanced problem in semi-supervised learning for skin lesion classification, we introduce a novel re-sample data training (RDT) strategy for model training. Different with other re-sampling-based method, where the majority classes are down-sampled or the minority classes are over-sampled to ensure uniform distribution. Our RDT can solve the deficiency of under sampling methods that usually ignore many examples of most types, and can also solve the problem that oversampling methods are easy to cause overfitting.
In RDT, the model is initially trained by class-balanced label data, which is achieved by strictly requiring the number of data for each category in each batch to enter the model. In other words, the same number of samples are taken from each category to form a batch and put into the model for training. Then, as the training process progresses, gradually changes the ratio of the input data class in each batch, and thus increasing the ratio of the major class, and decreasing the ratio of the minor class. In this case, there is no need to down-sample the major class. The minor classes may face the risk of overfitting.
To reduce the overfitting of minor classes, we have taken the following three strategies: First, RandAugment, which is based on AutoAugment, is used to augment the training data. AutoAugment learns an augmentation strategy based on transformation from the Python Image Library using reinforcement learning. This requires large labeled images to learn the augmentation pipeline. However, we do not have enough data to learn this augment strategy for skin lesion classification tasks. As a result, RandAugment, a variant of AutoAugment, which does not require the augmentation strategy to be learned ahead of time with labeled data, is adapted to solve the overfitting problem of minor class in our task. Before the end of each data AutoAugment, we have also used the Cutout strategy to improve the augment effect.
Second, to further prevent the over-fitting effect of minor class, we introduced the Focal loss [26] to the semi-supervised learning loss function. Formally, the combined loss function
where
In our loss term, we introduce focal loss into the standard semi-supervised loss function, the focal semi-supervised learning loss is computed as:
where
where
The last but equally important strategy is the mixed sample data augmentation, which is described in detail in 2.3.
2.3 Mixed Sample Data Augmentation
To further improve the performance for class-imbalanced semi-supervised learning for skin lesion classification, a training strategy named mixed sample data augmentation (MSDA) for semi-supervised learning is integrated. Recently, a plethora of MSDA approaches have been proposed and obtained state-of-the-art results in supervised classification tasks. One of the most popular methods is Zhang et al. [21], which is proposed by Zhang as a regularization technique to encourage high-margin decision boundaries and was utilized in semi-supervised learning by ICT, MixMatch and RealMix. In our MSDA, we use Mixup to mix the labeled data
where
And half of all augmentations of all unlabeled samples with their pseudo-labels into
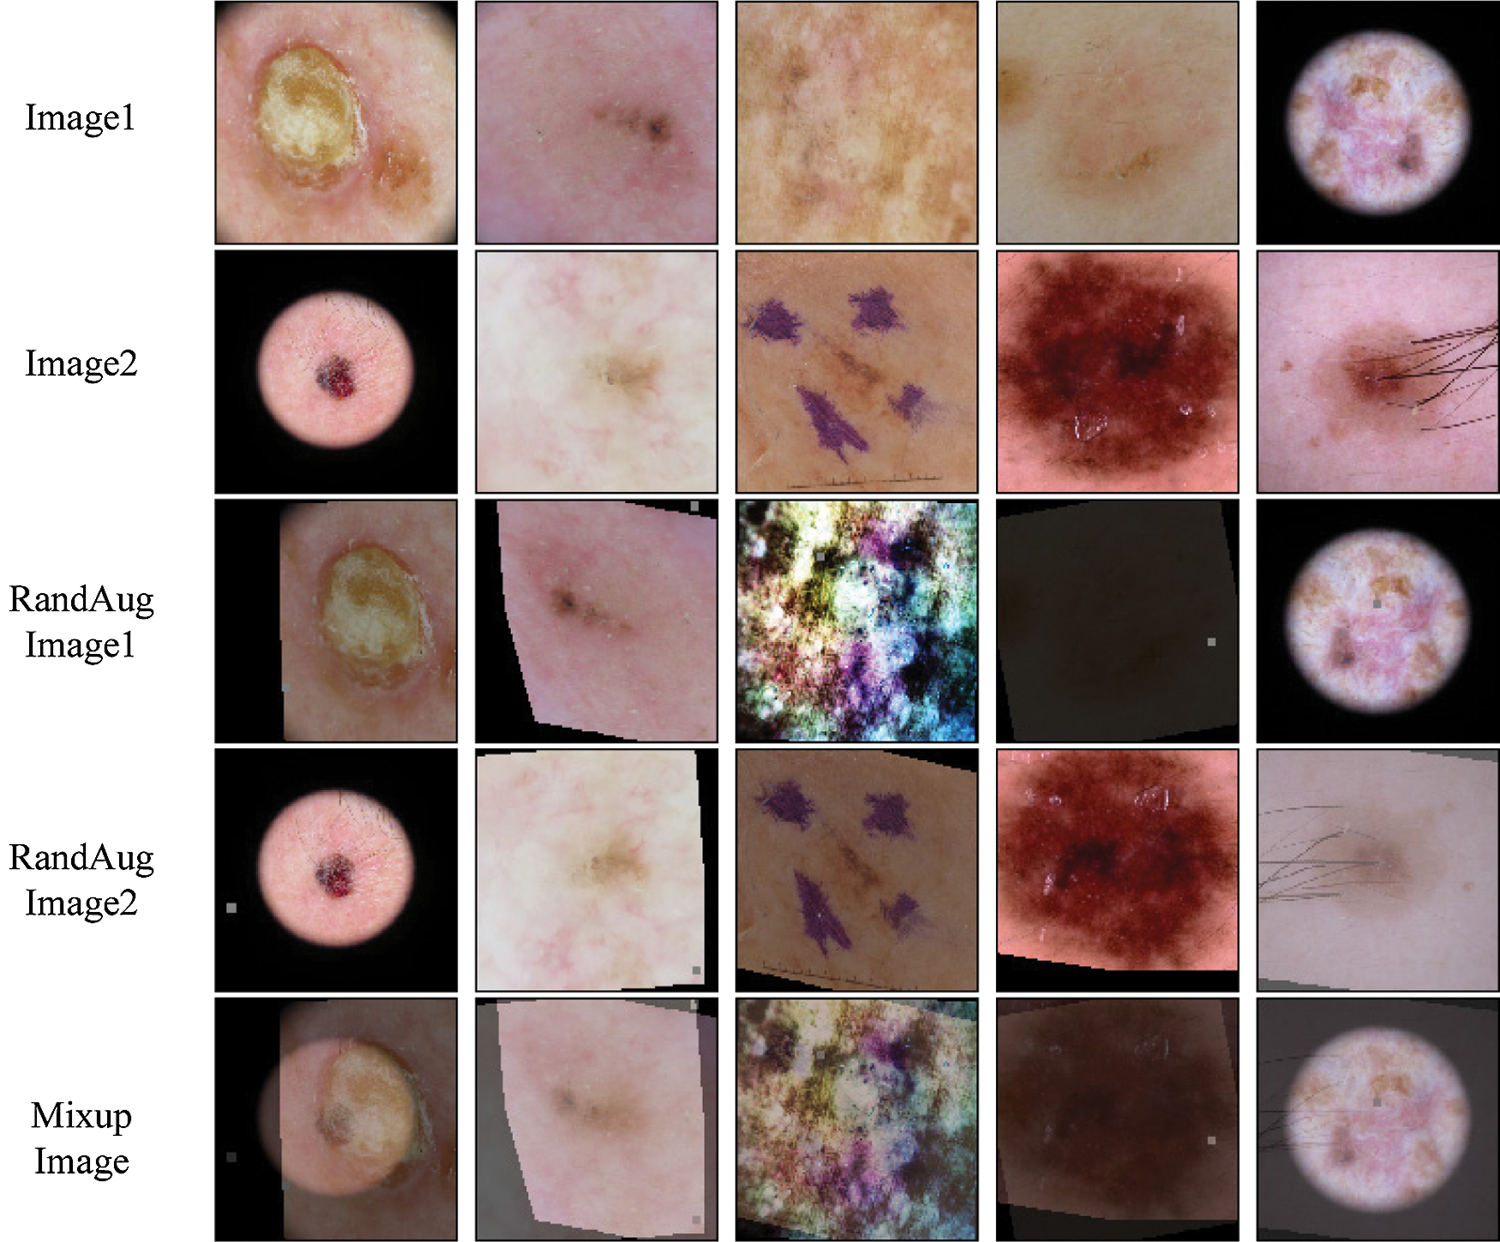
Figure 3: Example mixed images from the ISIC skin 2019 dataset for Mixup
For the other labeled data
where
and the other unlabeled samples with their pseudo-labels into
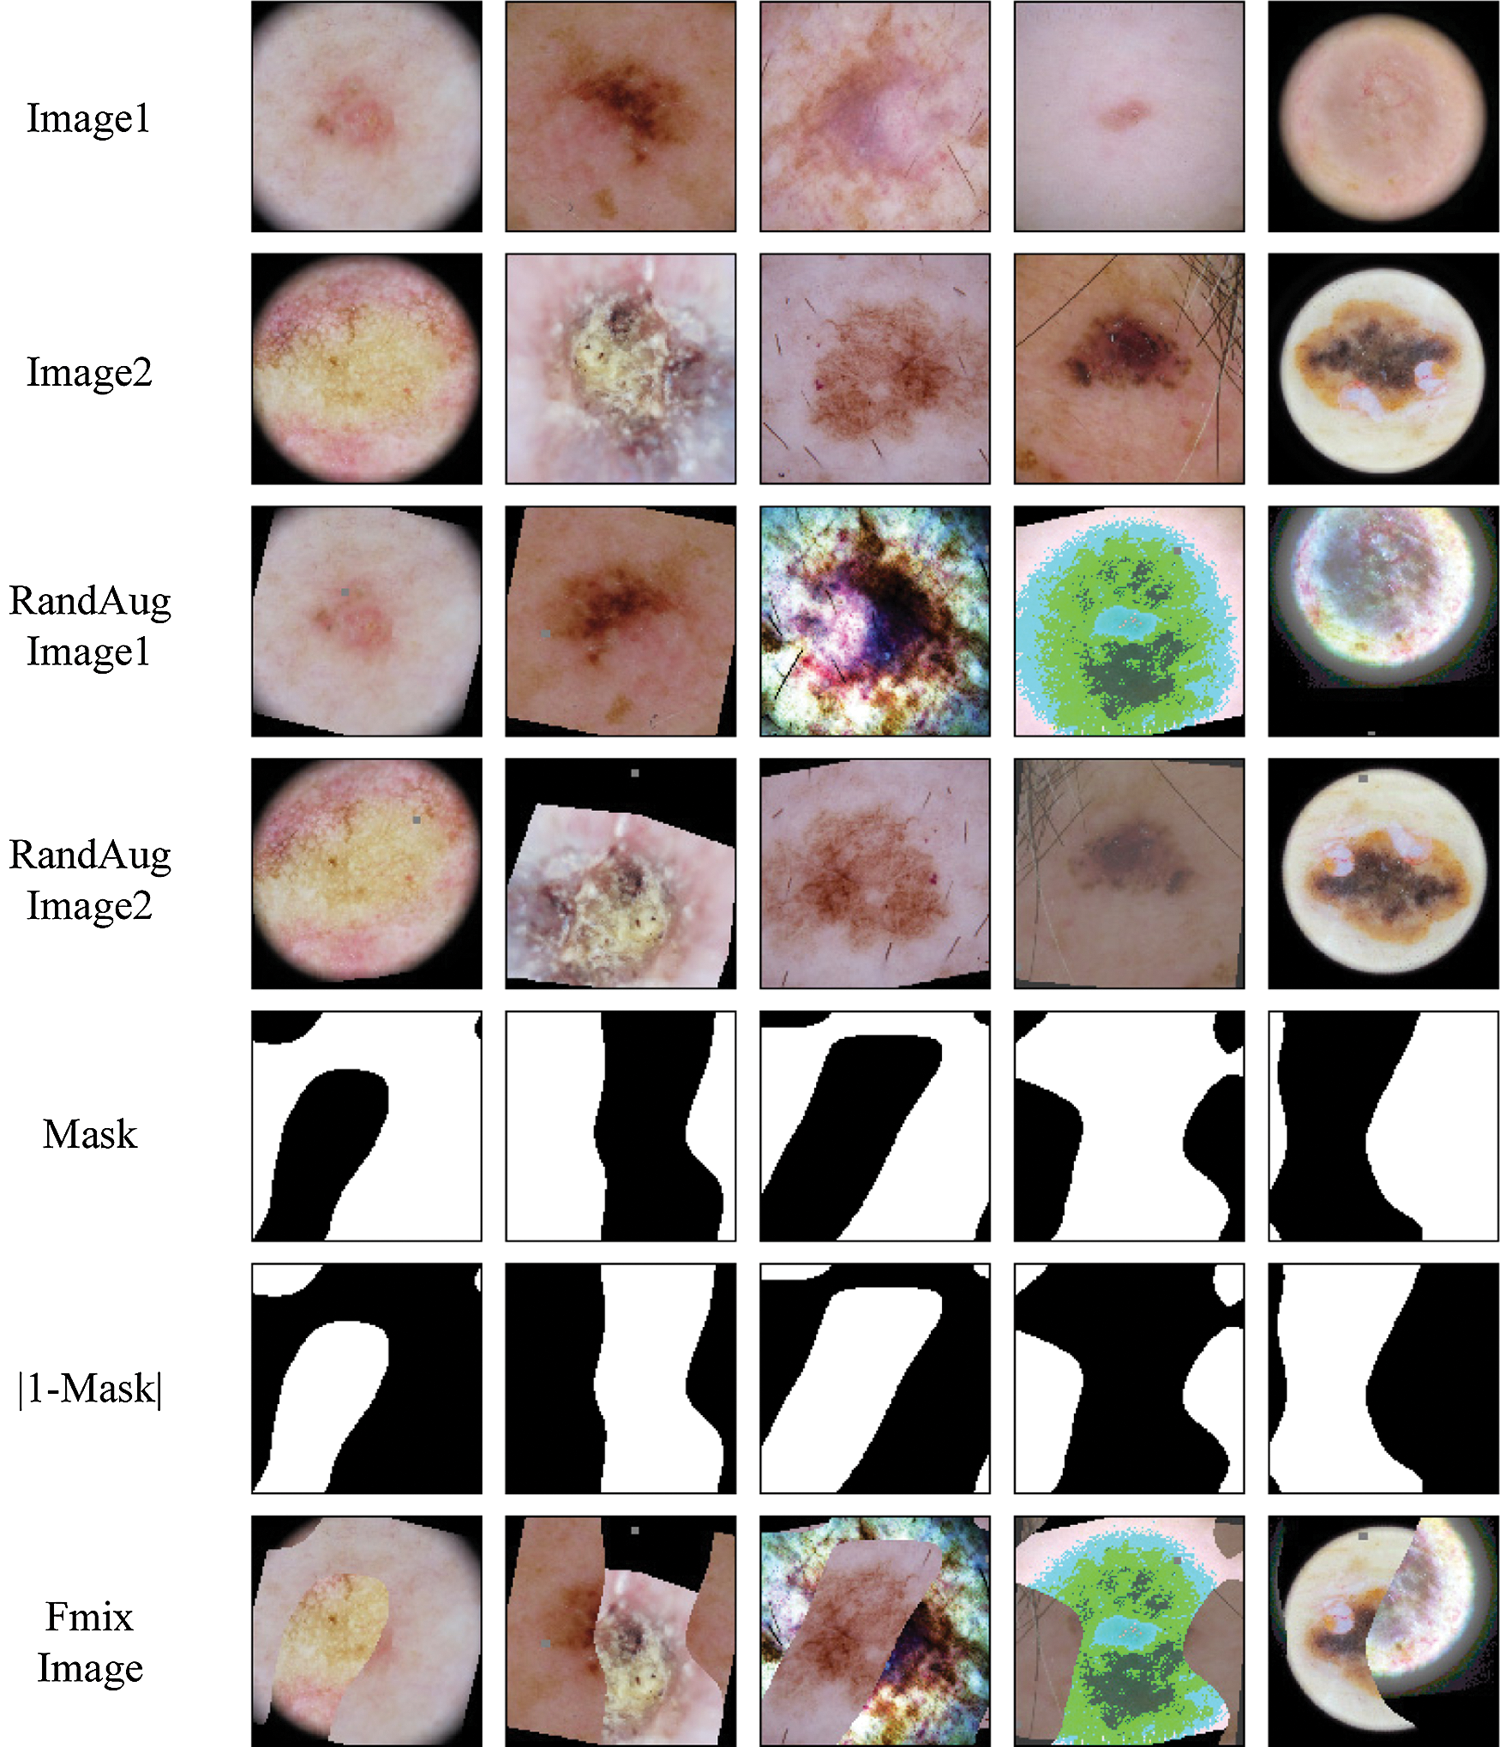
Figure 4: Example mask and mixed images from the ISIC skin 2019 dataset for FMix
We provide some example Mixup and Fmix images for skin lesion in Figs. 3 and 4. Finally,
To prove MRS effectiveness in the field of automatic classification of skin lesion, we perform our experiments on the International Skin Imaging Collaboration 2019 skin lesion classification (ISIC-skin 2019) dataset, which is the largest skin dermoscopy image dataset publicly available. We first introduce the training details and the ISIC-skin 2019 dataset and then conduct semi-supervised learning experiments with part of the labeled training data. Finally, the proposed method is compared and discussed with several state-of-the-art semi-supervised learning methods.
Unless otherwise stated, in all our experiments, we use the “ResNeXt-101-32x8d” architecture in Xie et al. [27] pre-trained on ImageNet as the backbone of our network. Further details of the model are available in Xie et al. [27]. Formally, we replace the last 1000 dimensional fully connected (FC) layer of ResNeXt-101-32x8d with an 8-dimensional FC layer.
During the training phase, we set the batch size to 8 and the training epoch to
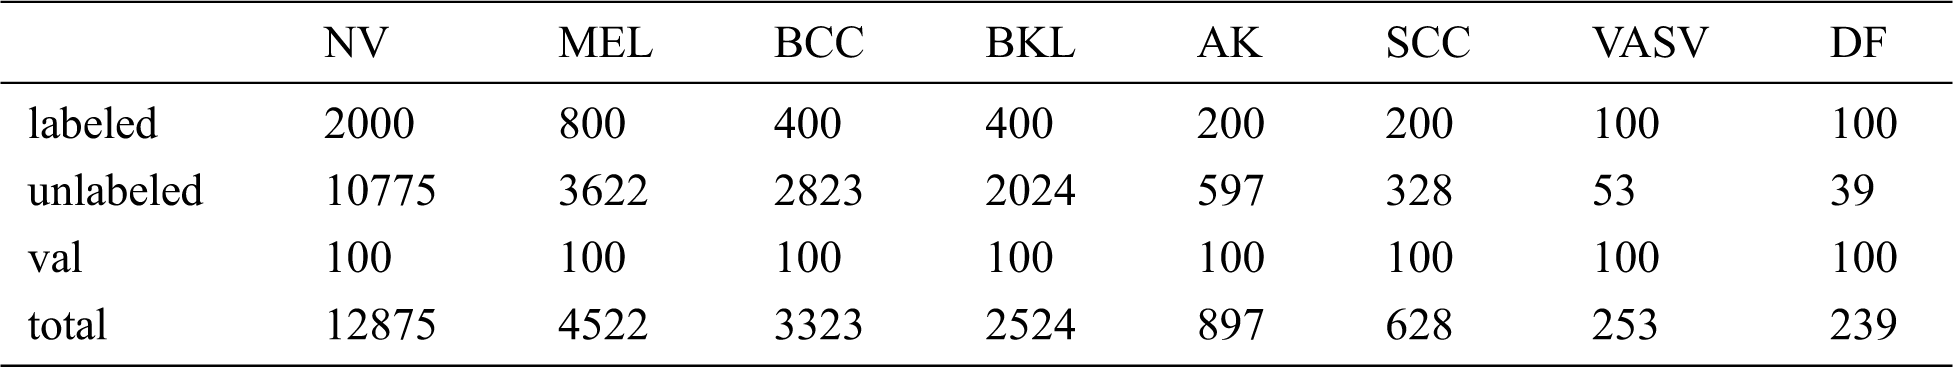
We evaluate the proposed method on the ISIC-skin 2019 dataset, consisting of 25331 images for training across 8 different categories including melanoma (MEL), melanocytic nevus (NV), basal cell carcinoma (BCC), actinic keratosis (AK), benign keratosis (BKL), dermatofibroma (DF), vascular lesion (VASC), and squamous cell carcinoma (SCC), the distribution of samples for training is heavily imbalanced. Since the test set of the data set has no public labels, we take 100 out of each category, a total of 800 as validation set to verify the effectiveness of the method. Then we divide the remaining data into labeled data and unlabeled data. Tab. 1 lists the details of the ISIC-skin 2019 dataset involved in our experiments, and the type and distribution of unlabeled data are unknown to the model during the training process. Finally, we choose the model that works best on the validation set, using the model on a test set with 8238 images, and using the model’s performance as the experimental result.
Table 1: The size of the ISIC dataset and the specific numbers of the labeled, unlabeled, val samples
In particular, in order to fit the model, the image in ISIC-skin 2019 is resized to 256
To quantitatively evaluate the proposed MRS method, we used the sensitivity, specificity, accuracy, area under the receiver operating characteristic curve (AUC), and normalized multi-class accuracy (NMCA) as the performance metrics, which are defined as:
where TP, FN, TN, FP,
3.4 Comparison with Baseline Methods
Since MRS is a semi-supervised learning method, we consider the three methods including Mean Teacher, ICT, and MixMatch as baselines for comparison. We also use labeled data to perform supervised learning as a baseline. In order to make these four baseline methods produce good generalization performance on class-imbalanced distribution, we oversample the minor class labeled data, and reimplemented each of these methods in the same codebase and apply them to the same model to ensure a fair comparison. The experimental results are shown in Tabs. 2 and 3.
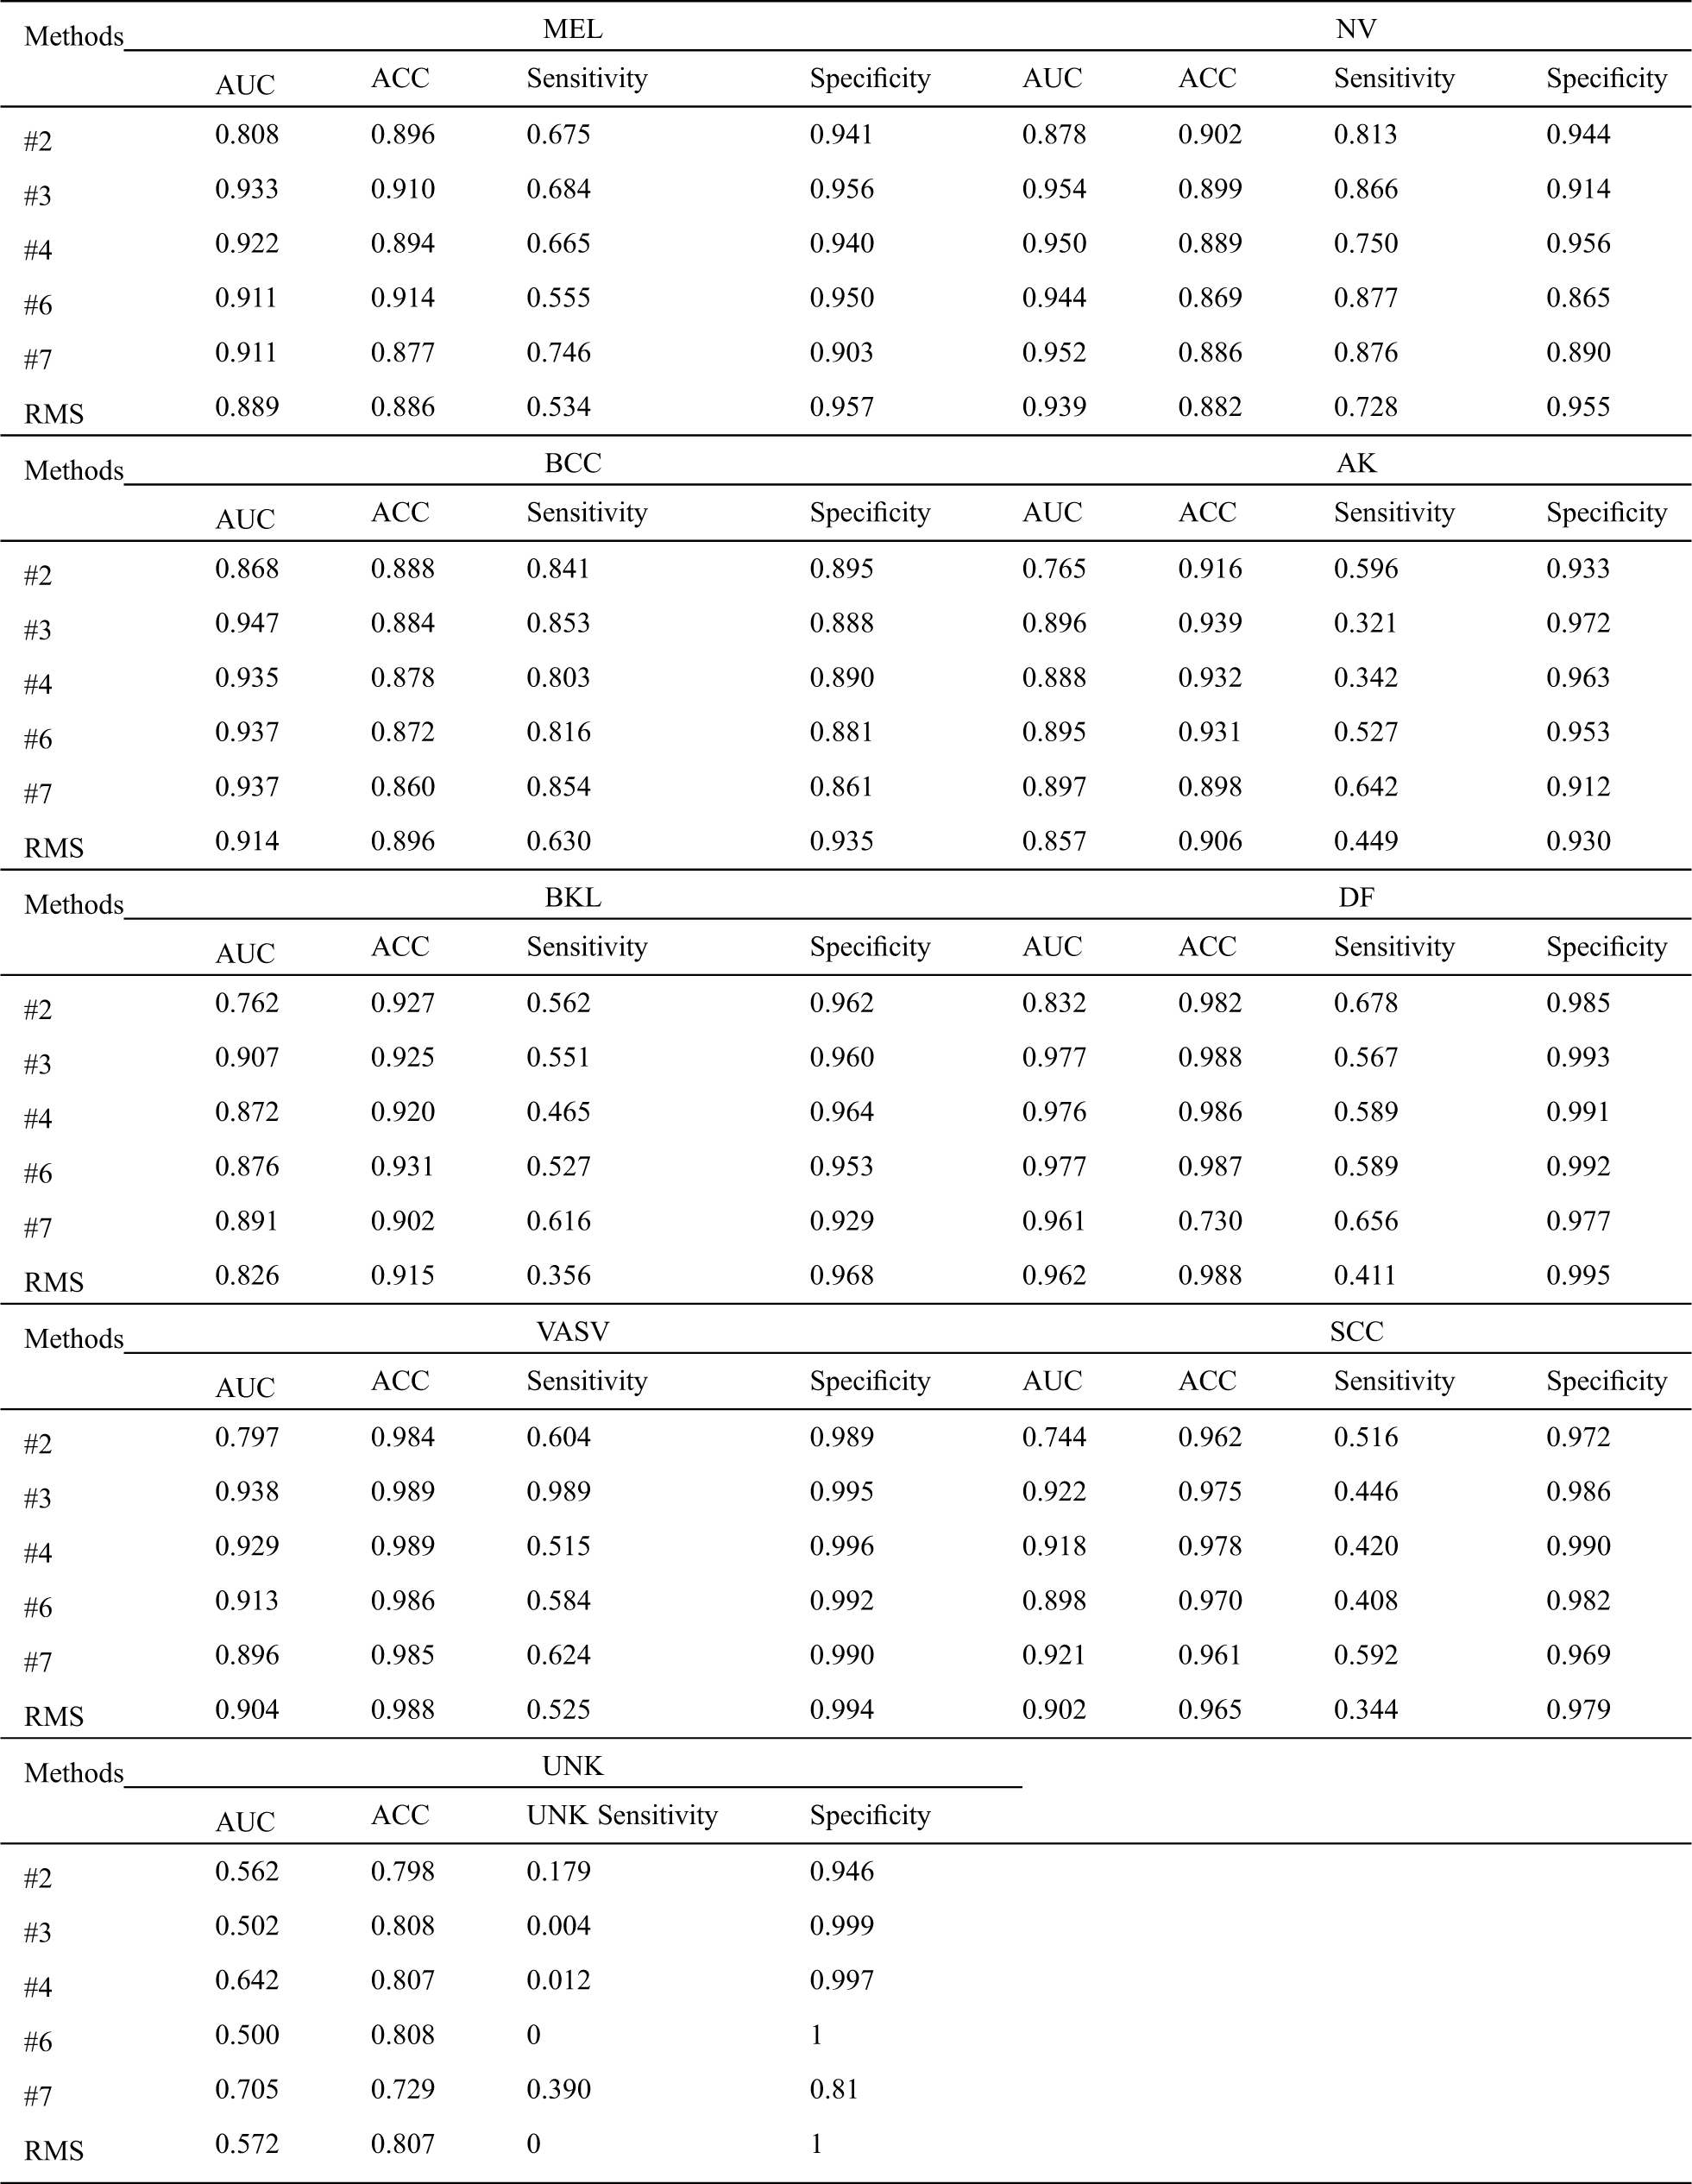
From Tab. 2, we can infer a number of observations, for all methods, even the worst-performing method, the classification is far better than pure chance which confirms that the semi-supervised learning methods can successfully be applied to skin lesion classification. Comparing it with the baseline methods, we can conclude that our RMS method achieves the highest AUC in almost all classes classification except DF, VASV, and SCC, achieve the highest ACC in MEL, NV, AK, and DF, the second ACC in BKL, achieve the highest sensitivity in NV and BCC, the second sensitivity in MEL, VASV, and SCC, and achieve the highest Specificity in AK and DF.
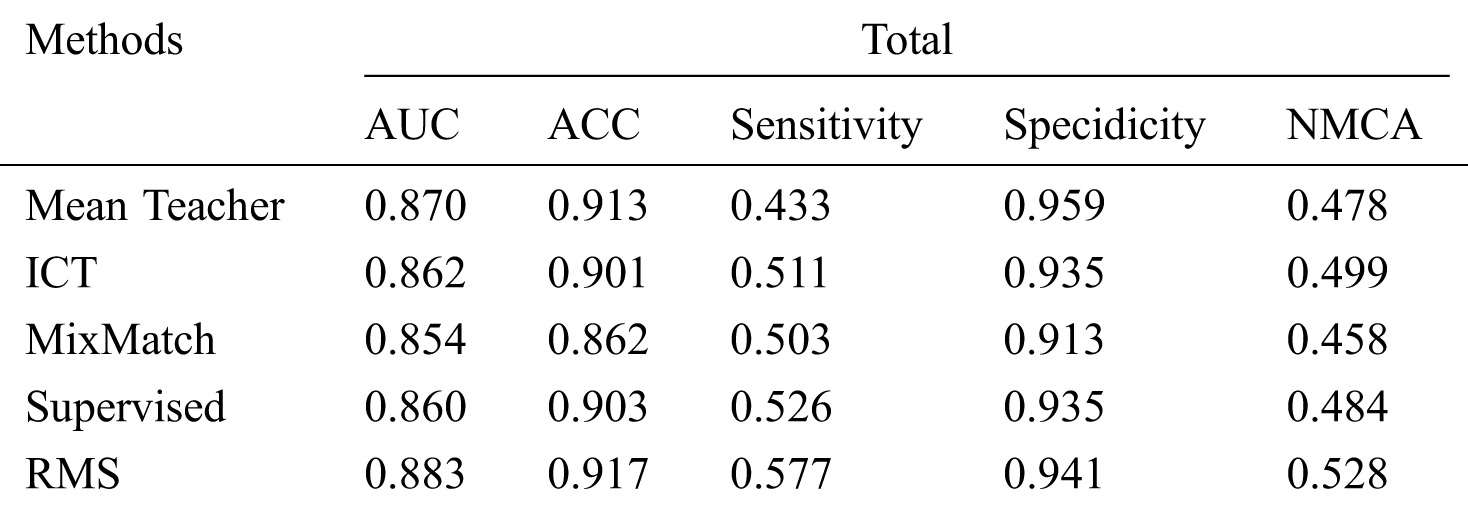
Tab. 3 shows that our RMS achieved the highest overall AUC, ACC, Sensitivity, and NMCA, and the second Specificity comparing with the baseline methods, with a small gap compared to the highest Specificity. Overall, the specificity remains at a high level across all experiments with only minor variations.
Fig. 5 shows the receiver operating characteristic (ROC) curve of our method and baseline methods. It can be found that our method achieved better performance, compared with the other methods. In Fig. 5, the areas under the ROC curves of our method are larger than that of other baseline methods. The experimental results confirm that our method has a better generalization capability.
Table 2: Comparison of the proposed method with the baseline methods
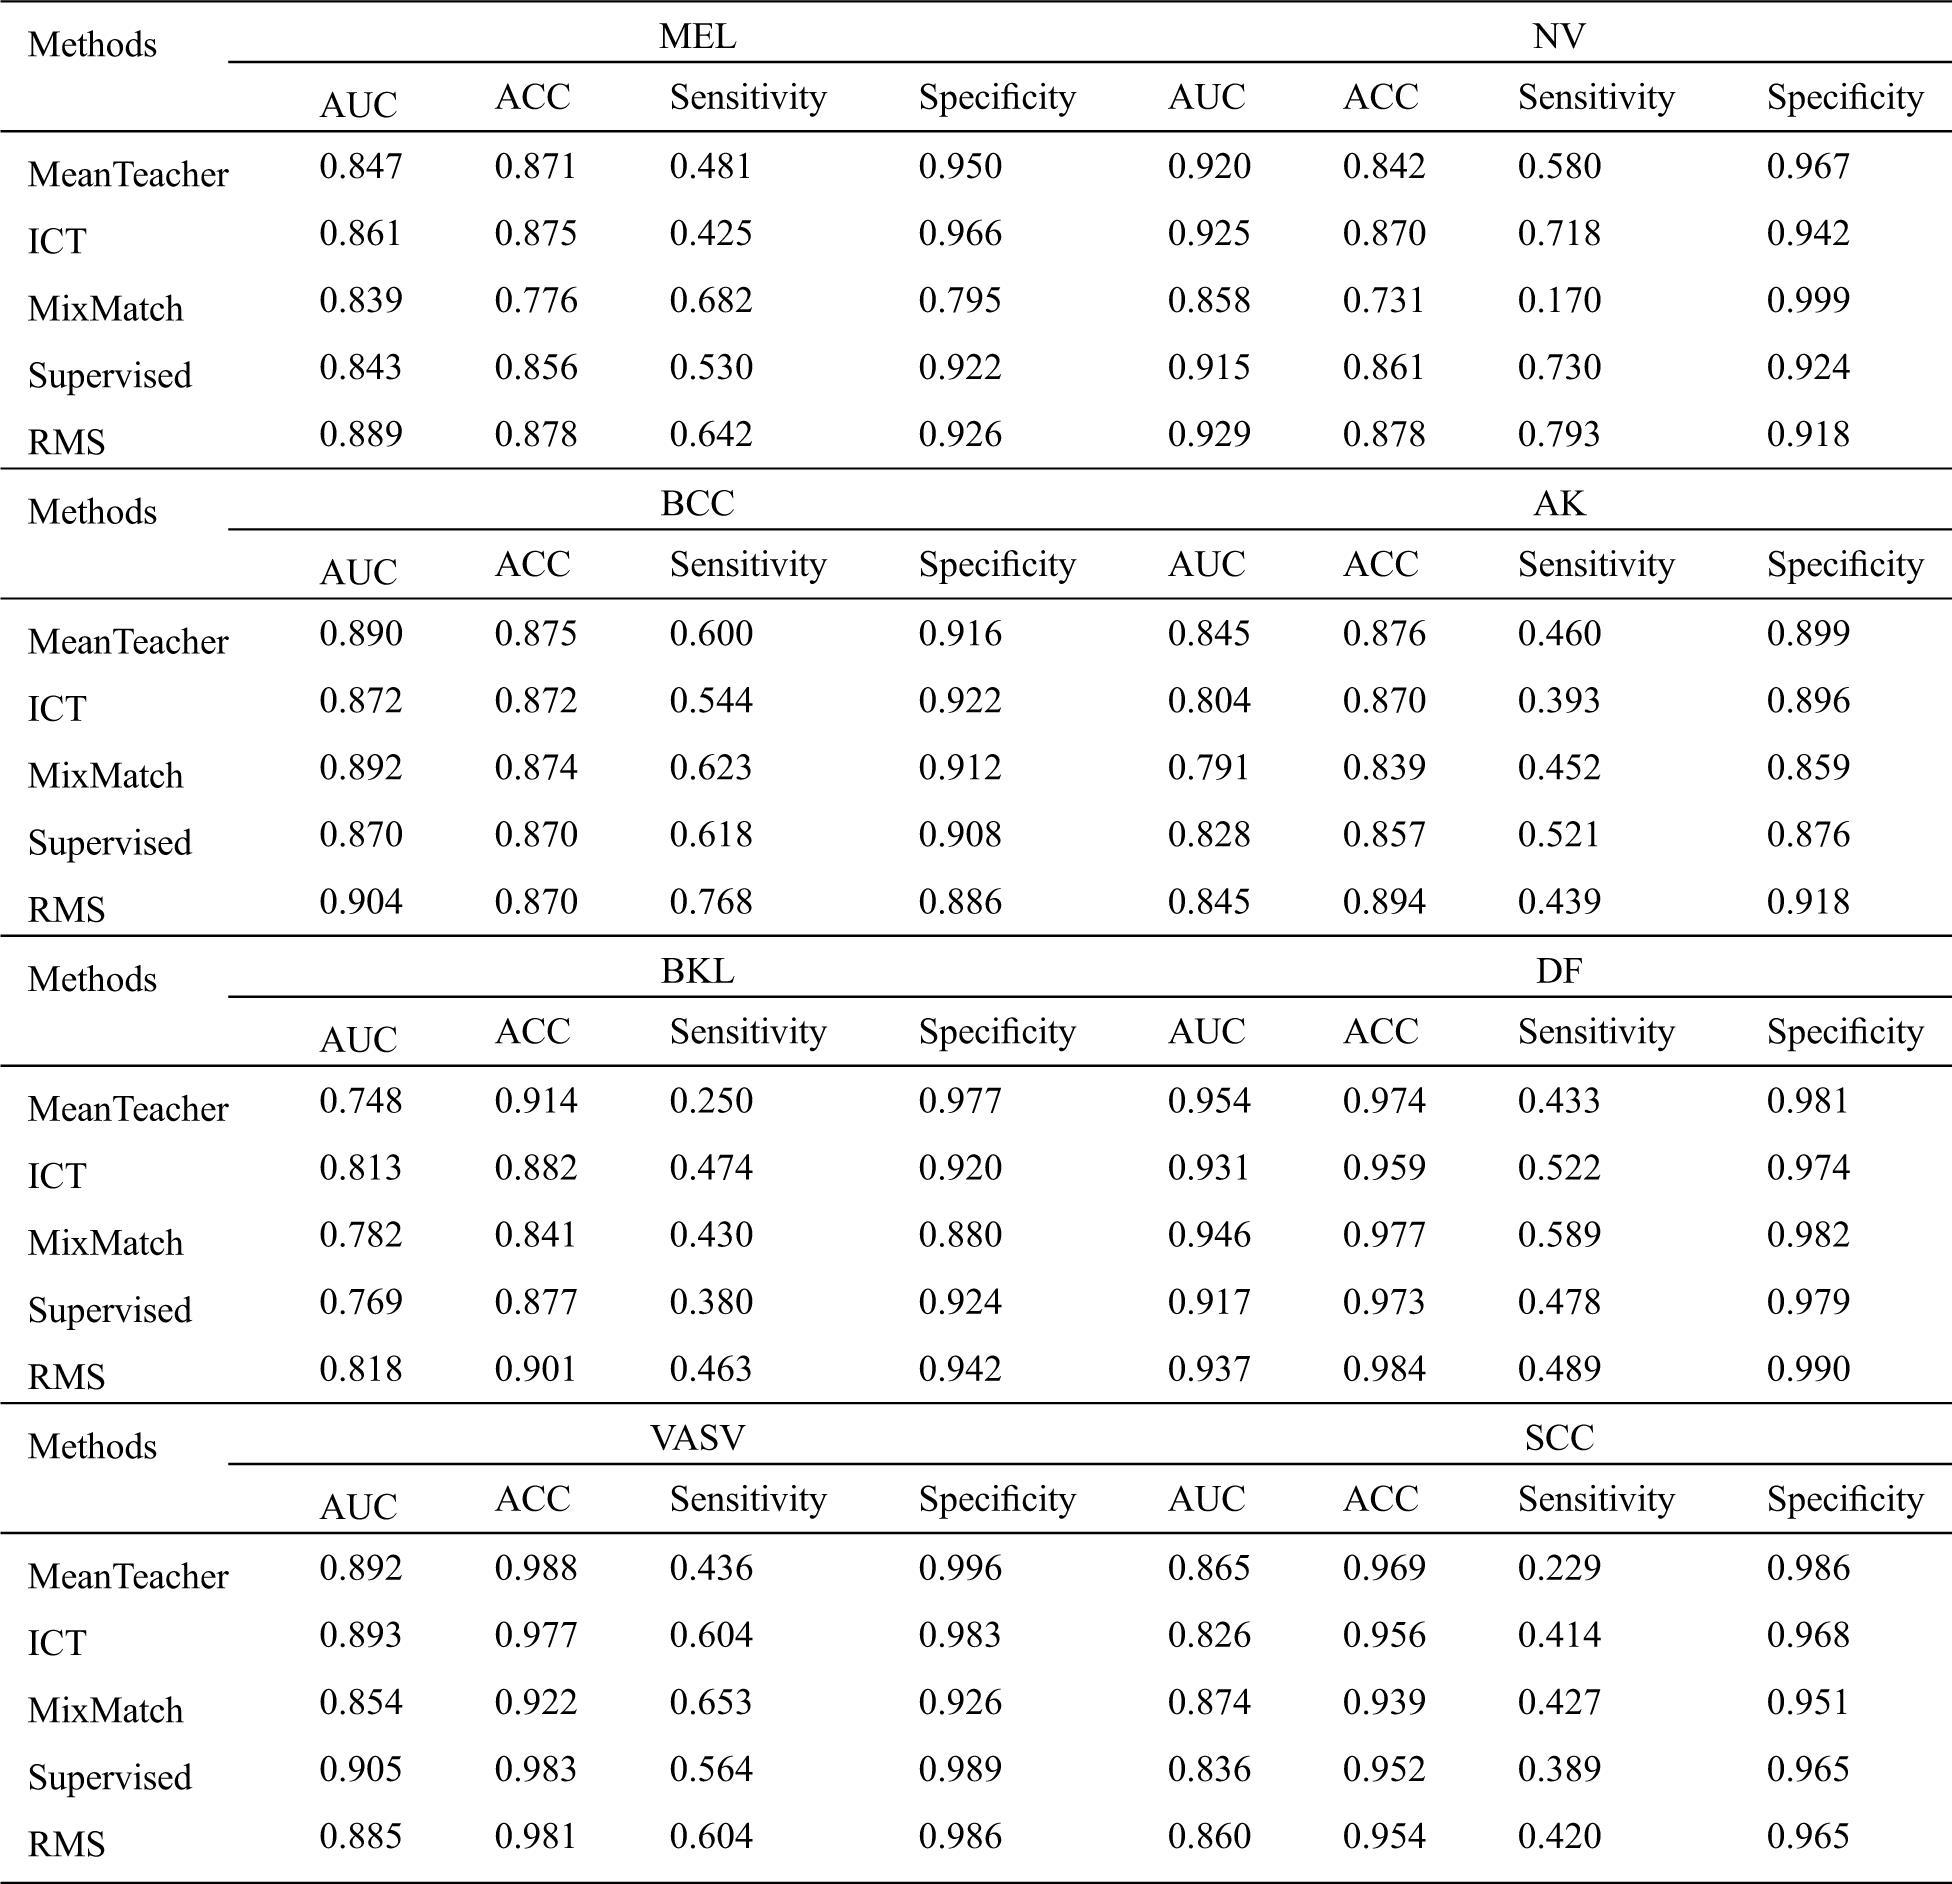
Table 3: Comparison of the proposed method with the baseline methods
It is worth noting that in most aspects, the performance of the supervised method is better than the Mixmatch and Mean Teacher methods. The reason for this phenomenon is that the Mixmatch and mean teacher method is a semi-supervised learning optimization method for uniformly distributed data. In the case where both labeled data and unlabeled data are unevenly distributed, it is difficult for the classifier to extract valid features from unlabeled data, so the performance of the classifier cannot be optimized by the distribution of unlabeled data. However, the performance of the ICT method is superior to the supervised method. This is because compared to Mixmatch, ICT uses unlabeled data only once in a batch, so it has less impact on the distribution of a batch of samples. At the same time, Mixup can completely mix unlabeled data in ICT. In general, our proposed RMS method mixes labeled and unlabeled data using Mixup and Fmix, which has less effect on the distribution of resampled labeled data. Therefore, the unlabeled data can be fully utilized to improve the performance of the classifier in the case of unbalanced categories.
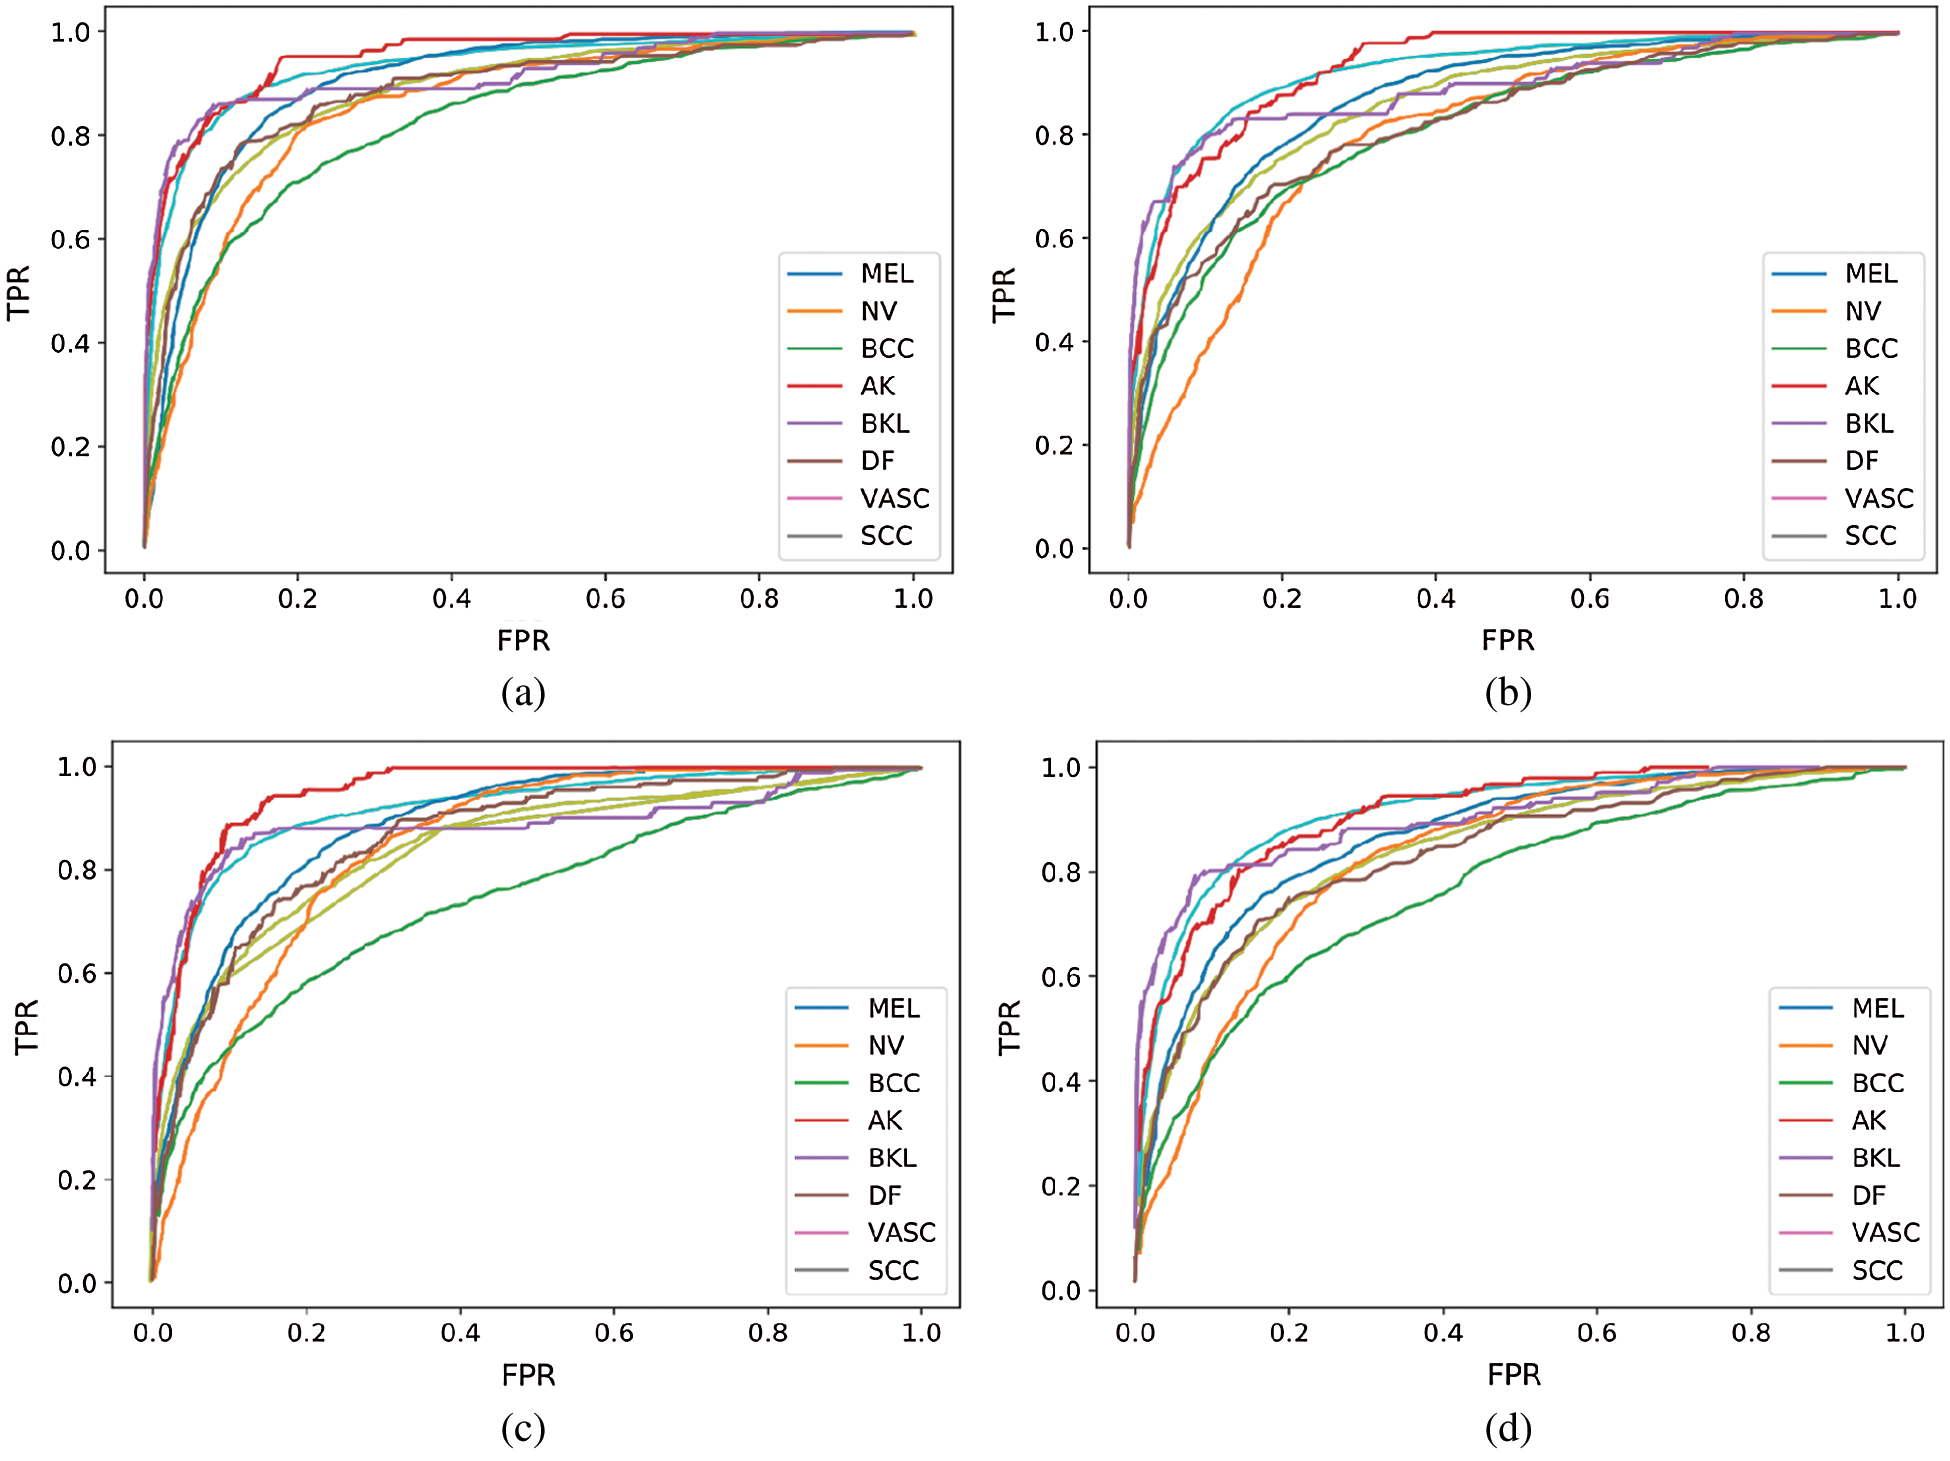
Figure 5: ROC curve of our performing approach and baseline methods
3.5 Comparison with Challenge Records
In this part, we compared the performance of RMS to seven top-ranking performances without using external data in the ISIC-2019 skin lesion classification challenge leaderboard. These reported results on the ISIC-2019 challenge dataset can reflect state-of-the-art performance in the skin lesion classification task.
Since almost all the seven-top ranking methods on the ISIC-2019 skin lesion classification challenge leaderboard use the ensemble model to obtain better generalization performance, in this experiment, we selected a part of the data as supervised data in the labeled data and trained two independent ResNeXt models.
Tab. 4 lists the specific numbers of labeled and unlabeled samples for the two ResNeXt model. The labeled data here is a subset of the labeled data in Tab. 1. After the training is completed, we obtained two ResNeXt models, in 3.3 we also obtained a ResNeXt model. Then we use the ensemble model based on these three models to complete the experimental comparison. As there are UNKNOWN images in the test dataset, but no such category data in the training dataset, we simply select the images whose top-1 probability
Table 4: The specific number of the labeled, unlabeled, val samples for the other models

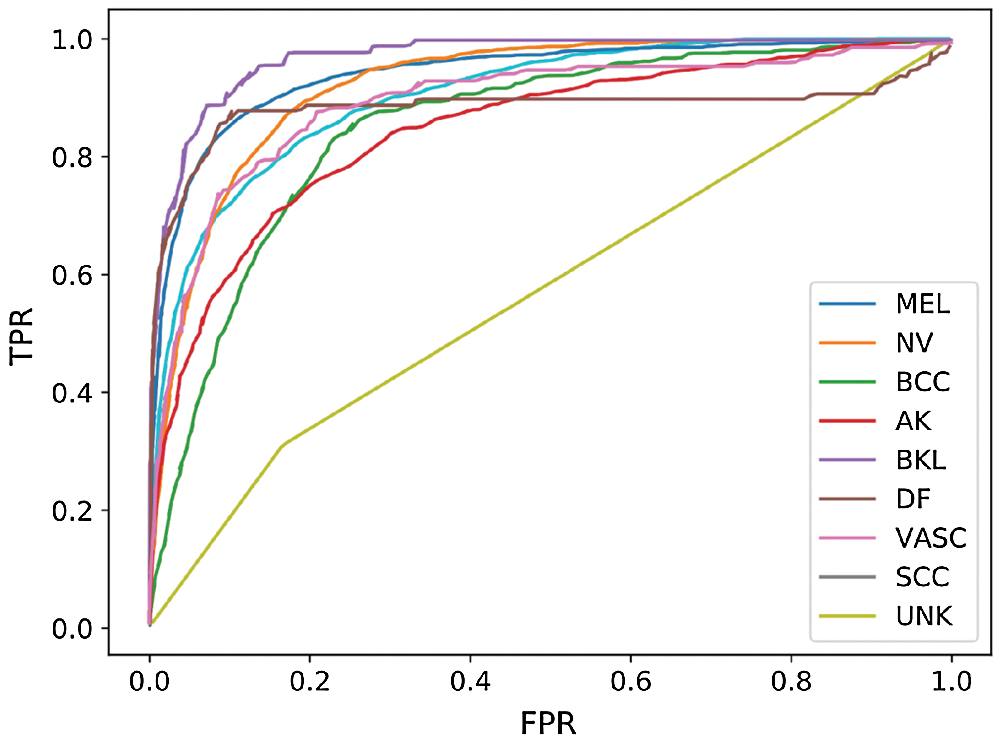
Figure 6: ROC curve of our performing ensemble approach
Tab. 5 shows that our RMS method, which was trained on the ISIC-2019 training dataset only with 4200 labeled images, achieves the highest ACC on BCC, and DF. Moreover, the results obtained by our method are not much different from the list records in other categories of ACC, AUC, sensitivity, and specificity. Meanwhile, almost all methods are unsatisfactory in identifying UNK, whether it is our method or other methods that do not use additional data on the challenge record.
From Tab. 6, comparing the results of our RMS method to challenge records, we can conclude that our method has obtained a balanced accuracy of 55.3% according to the ranking rule of the challenge, an average AUC of 0.865, ACC of 0.916, the sensitivity of 0.449, and specificity of 0.969, with a small gap, compared to the challenge records. It is also worth noting that we only used 4200 labeled images, comparing with other methods that used 25331 labeled images. Fig. 6 shows the receiver operating characteristic (ROC) curve of the ensemble approach we performed.
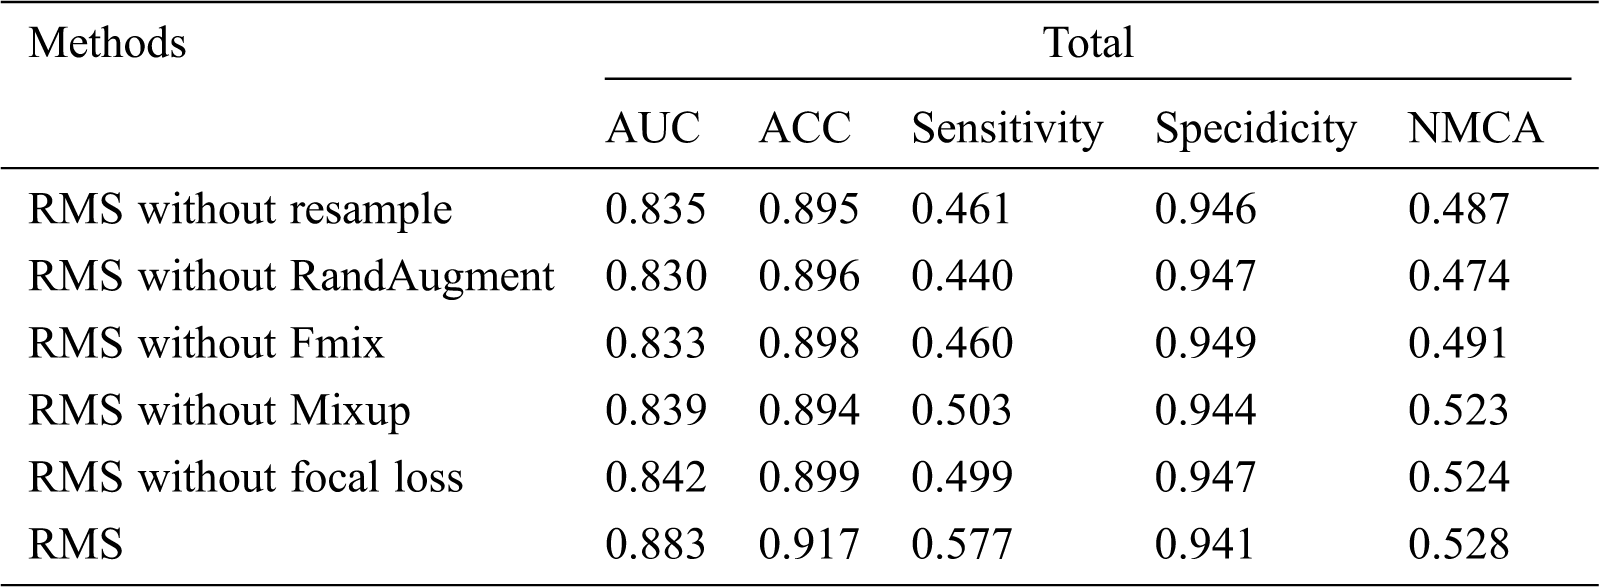
Since our RMS method combines various optimizations and augmentation techniques, we perform an extensive ablation study to better understand why it is able to obtain performant results. Specifically, what we measured is that our method only removes resample, RandAugment, Fmix, Mixup, and focal loss. Tab. 7 shows that our RMS method, which was trained on the ISIC-2019 training dataset only with 4200 labeled images.
Table 5: Comparison of the proposed method with the challenge records
We find that each component contributes to RMS’s performance. Among them, the contribution of RandAugment is the largest, the contribution of rasample is second, and the contribution of focal loss is the smallest.
Table 6: Comparison of the proposed method with the challenge records
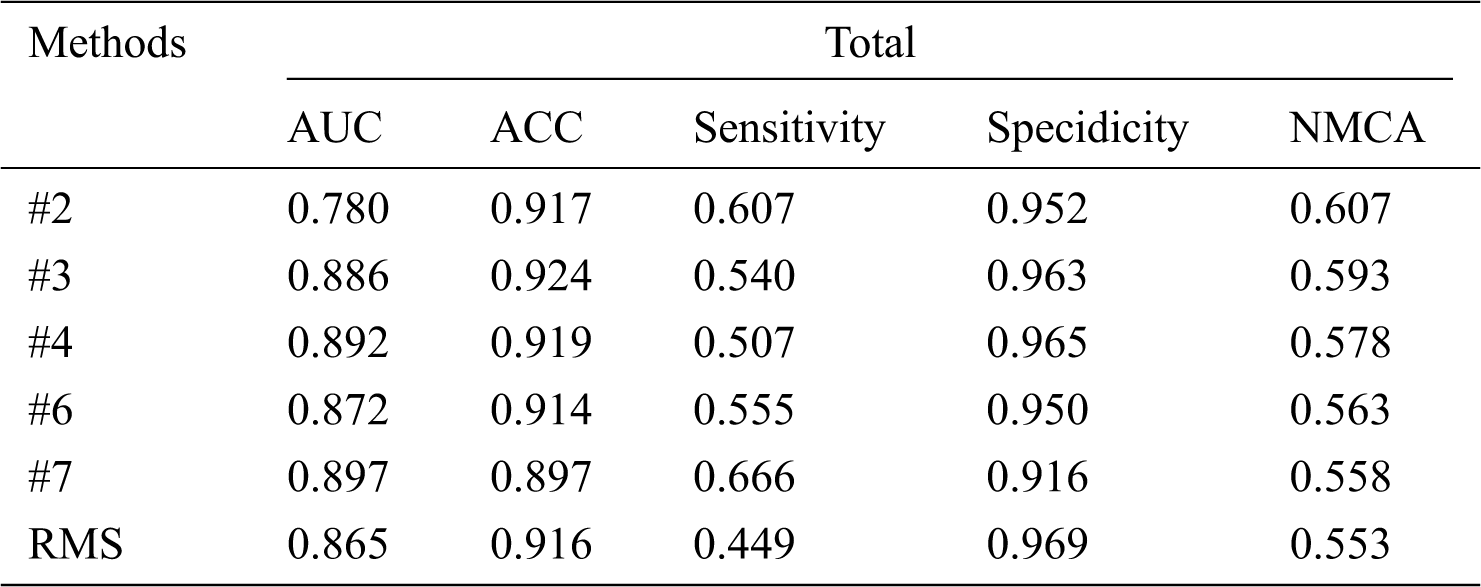
Table 7: Ablation study results
In this paper, we presented a mixed re-sampled class imbalanced semi-supervised learning method for skin lesion classification. The proposed approach has been evaluated on the ISIC-skin 2019 dataset with considerably small labeled images dataset. Despite using only 4800 labeled images, our method has only a small gap comparing the performance to seven top-ranking performances in the ISIC-2019 skin classification challenge leaderboard using all the 25331 labeled data. The results have shown that our method can significantly improve the performance compared to other semi-supervised methods on the same task. Achieving state-of-the-art performance, this research confirms previous findings and contributes to our understanding of semi-supervised learning methods for skin lesion classification. A natural progression of this work is to improve the recognition performance of unknown classes. Further research should concentrate on incorporating additional ideas from the semi-supervised and the class-imbalanced learning literature into our methods.
Funding Statement: Our research fund is funded by Fundamental Research Funds for the Central Universities (3072020CFQ0602, 3072020CF0604, 3072020CFP0601) and 2019Industrial Internet Innovation and Development Engineering (KY1060020002, KY 10600200008).
Conflicts of Interest: The authors declare that they have no conflicts of interest to report regarding the present study.
1. R. Werner and A. Schlaefer. (2019). “Skin lesion classification using CNNs with patch-based attention and diagnosis-guided loss weighting,” IEEE Transactions on Biomedical Engineering, vol. 67, no. 2, pp. 495–503. [Google Scholar]
2. F. Liu, J. Yan, W. Wang, J. Liu, J. Li et al. (2020). , “Scalable skin lesion multi-classification recognition system,” Computers, Materials & Continua, vol. 62, no. 2, pp. 801–816. [Google Scholar]
3. J. Zhang, Y. Xie, Y. Xia and C. Shen. (2019). “Attention residual learning for skin lesion classification,” IEEE Transactions on Medical Imaging, vol. 38, no. 9, pp. 2092–2103. [Google Scholar]
4. A. Mahbod, G. Schaefer, C. Wang, R. Ecker and I. Ellinge. (2019). “Skin lesion classification using hybrid deep neural networks,” in Proc. IEEE ICASSP, Brighton, UK, pp. 1229–1233. [Google Scholar]
5. J. Liu, W. Wang, J. Chen, G. Sun and A. Yang. (2020). “Classification and research of skin lesions based on machine learning,” Computers, Materials & Continua, vol. 62, no. 3, pp. 1187–1200. [Google Scholar]
6. H. Kittler, H. Pehamberger, K. Wolff and M. Binder. (2002). “Diagnostic accuracy of dermoscopy,” Lancet Oncology, vol. 3, no. 3, pp. 159–165. [Google Scholar]
7. C. Xue, Q. Dou, X. Shi, H. Chen and P. A. Heng. (2019). “Robust learning at noisy labeled medical images: Applied to skin lesion classification,” in Proc. IEEE ISBI, Venice, Italy, pp. 1280–1283. [Google Scholar]
8. K. Fang and J. Q. OuYang. (2020). “Classification algorithm optimization based on Triple-GAN,” Journal on Artificial Intelligence, vol. 2, no. 1, pp. 1–15. [Google Scholar]
9. L. Yan, Y. H. Zheng and J. Cao. (2018). “Few-shot learning for short text classification,” Multimedia Tools and Applications, vol. 77, no. 22, pp. 29799–29810. [Google Scholar]
10. X. Liang, P. Hu, L. Zhang, J. Sun and G. Yin. (2019). “MCFNet: Multi-layer concatenation fusion network for medical images fusion,” IEEE Sensors Journal, vol. 19, no. 16, pp. 7107–7119. [Google Scholar]
11. M. Behrouzian Nejad and M. Ebrahim Shiri. (2019). “A new enhanced learning approach to automatic image classification based on SALP swarm algorithm,” Computer Systems Science and Engineering, vol. 34, no. 2, pp. 91–100. [Google Scholar]
12. A. Mahbod, G. Schaefer, I. Ellinger, R. Ecker, A. Pitiot et al. (2019). , “Fusing fine-tuned deep features for skin lesion classification,” Computerized Medical Imaging and Graphics, vol. 71, no. 4, pp. 19–29. [Google Scholar]
13. S. H. Kassani, P. H. Kassani, M. J. Wesolowski, K. A. Schneider and R. Deters. (2019). “Depthwise separable convolutional neural network for skin lesion classification,” in Proc. IEEE ISSPIT, United Arab Emirates, pp. 1–6. [Google Scholar]
14. A. Esteva, B. Kuprel, R. A. Novoa, J. Ko, S. M. Swetter et al. (2017). , “Erratum: Corrigendum: Dermatologist-level classification of skin cancer with deep neural networks,” Nature, vol. 546, no. 7660, pp. 686. [Google Scholar]
15. D. Berthelot, N. Carlini, I. Goodfellow, N. Papernot, A. Oliver et al. (2019). , “Mixmatch: A holistic approach to semi-supervised learning,” in Proc. NIPS, Vancouver, Canada, pp. 5050–5060. [Google Scholar]
16. A. Tarvainen and H. Valpola. (2017). “Mean teachers are better role models: Weight-averaged consistency targets improve semi-supervised deep learning results,” in Proc. NIPS, California, CA, USA, pp. 1195–1204. [Google Scholar]
17. V. Verma, A. Lamb, J. Kannala, Y. Bengio and D. Lopez-Paz. (2019). “Interpolation consistency training for semi-supervised learning,” in Proc. AAAI, Hilton Hawaiian Village, Honolulu, Hawaii, USA, pp. 3635–3641. [Google Scholar]
18. Y. Cui, Y. Song, C. Sun, A. Howard and S. Belongie. (2018). “Large scale fine-grained categorization and domain-specific transfer learning,” in Proc. IEEE CVPR, Salt Lake City, UT, USA, pp. 4109–4118. [Google Scholar]
19. C. Huang, Y. Li, C. Change Loy and X. Tang. (2016). “Learning deep representation for imbalanced classification,” in Proc. IEEE CVPR, Las Vegas, NV, USA, pp. 5375–5384. [Google Scholar]
20. X. Zhang, Z. Fang, Y. Wen, Z. Li and Y. Qiao. (2017). “Range loss for deep face recognition with long-tailed training data,” in Proc. IEEE ICCV, Venice, Italy, pp. 5409–5418. [Google Scholar]
21. H. Zhang, M. Cisse, Y. N. Dauphin and D. Lopez-Paz. (2018). “Mixup: Beyond empirical risk minimization,” in Proc. ICLR, Vancouver, BC, Canada. [Google Scholar]
22. E. Harris, A. Marcu, M. Painter, M. Niranjan, A. Prugel-Bennett et al. (2002). , “Understanding and enhancing mixed sample data augmentation.” arXiv :2002.12047. [Google Scholar]
23. P. Tschandl, C. Rosendahl and H. Kittler. (2018). “The HAM10000 dataset, a large collection of multi-source dermatoscopic images of common pigmented skin lesions,” Scientific Data, vol. 5, no. 1, pp. 180161. [Google Scholar]
24. N. C. Codella, D. Gutman, M. E. Celebi, B. Helba, M. A. Marchetti et al. (2018). , “Skin lesion analysis toward melanoma detection: A challenge at the 2017 international symposium on biomedical imaging (ISBIhosted by the international skin imaging collaboration (ISIC),” in Proc. IEEE ISBI, Washington, DC, USA, pp. 168–172. [Google Scholar]
25. M. Combalia, N. C. Codella, V. Rotemberg, B. Helba, V. Vilaplana et al. (2019). , “Bcn20000: Dermoscopic lesions in the wild.” arXiv: 1908.02288. [Google Scholar]
26. T.-Y. Lin, P. Goyal, R. Girshick, K. He and P. Dollár. (2017). “Focal loss for dense object detection,” in Proc. IEEE ICCV, Venice, Italy, pp. 2980–2988. [Google Scholar]
27. S. Xie, R. Girshick, P. Dollár, Z. Tu and K. He. (2017). “Aggregated residual transformations for deep neural networks,” in Proc. IEEE CVPR, Honolulu, HI, USA, pp. 1492–1500. [Google Scholar]
 | This work is licensed under a Creative Commons Attribution 4.0 International License, which permits unrestricted use, distribution, and reproduction in any medium, provided the original work is properly cited. |