DOI:10.32604/iasc.2021.016408
| Intelligent Automation & Soft Computing DOI:10.32604/iasc.2021.016408 | |
| Article |
A K-means++ Based User Classification Method for Social E-commerce
1School of Computer Science, Beijing University of Posts and Telecommunications, Beijing, 100876, China
2Institute of Information Engineering, Chinese Academy of Sciences, Beijing, 100088, China
3China Information Technology Security Evaluation Center, Beijing, 100088, China
4Department of Computer Science, Framingham State University, Framingham, MA, 01772, USA
*Corresponding Author: Keyue Li. Email: likeyue@bupt.edu.cn
Received: 01 January 2021; Accepted: 02 February 2021
Abstract: At present, the research on the classification of e-commerce users is relatively mature, but with the rise of mobile social networks, the combination of social networks and e-commerce networks has become a trend and is developing rapidly. Traditional e-commerce user classification methods are not suitable for social e-commerce users. Therefore, based on the research on traditional e-commerce user classification methods, according to the characteristics of social e-commerce users, we improved data preprocessing and parameter tuning methods, and proposed a clustering method of social e-commerce users based on the K-means++ algorithm. The test on the actual data of social e-commerce users showed that the retention rates of users of various classes are significantly different, which express that the proposed method can classify social e-commerce users accurately.
Keywords: Social e-commerce; machine learning; cluster analysis; user classification
Social e-commerce is based on a network of interpersonal relationships, using Internet social tools to engage in the sales of goods or services. It is one of the important manifestations of new e-commerce. In recent years, the popularization of 4G networks and smart phones, as well as the continuous development of social software and mobile payment technology, has provided comprehensive hardware and software support for the rapid development of the social e-commerce industry.
According to the “2019 China Social E-commerce Industry Development Report” released by the Internet Society of China, in 2019, the number of employees in China’s social e-commerce industry is expected to reach 48.01 million, a year-on-year increase of 58.3%, and the market size is expected to reach 206.58 billion yuan, a year-on-year increase of 63.2%. Unlike the centralized traditional e-commerce platforms such as Taobao and JD.com, social e-commerce has very low barriers to entry and it is convenient to open stores. By building a community or becoming an opinion leader, it can communicate well with customers, as well as solicit needs, get feedback, and maintain close contact with customers.
At present, China’s social e-commerce industry doesn’t have a unified industry standard, and there are many social tools and software used to assume the role of a trading platform. There is no difference between e-commerce users and ordinary users on the platform side, and they have not undergone unified registration. The quality of the goods is good or bad, and is lack of classification. This makes the classification analysis of social e-commerce difficult.
This paper proposes a clustering analysis method based on K-means++, which can realize the classification of social e-commerce based on the operating data and software usage data of social e-commerce, and screen out ordinary users and active users of the software. This method analyzes the three-month data of about 70,000 social e-commerce users, and establishes a clustering model based on the K-means++ algorithm to classify users. Experiments show that there are significant differences in the retention rates of various users. The method in this article can realize the stratification of different users of social e-commerce software, so as to formulate corresponding operation plans for different users.
In order to divide social e-commerce users into different groups, it is necessary to analyze multiple attributes of users based on a clustering algorithm. Data clustering is unsupervised learning, which can be divided into structural or decentralized. The main difference between the two is that the structural clustering algorithm uses the clusters that have been successful in the past to classify, while the decentralized algorithm determines all classifications at once, and the latter is more suitable for our classification needs. K-means clustering is a commonly used decentralized algorithm. The term “k-means” was first proposed by MacQueen in 1967 [1]. In 1997, Chaudhuri et al. [2] proposed a modified k-means for the poor performance of the traditional k-means algorithm in some data sets. The traditional k-means selects a clustering center for each category, but it cannot achieve a good clustering effect for non-convex or elongated categories. Therefore, this paper proposes that a category can contain multiple cluster centers to optimize the clustering performance of k-means. The traditional k-means algorithm has high computational complexity and large amount of calculation. Kanungo et al. [3] therefore proposed a method named “KD tree” to accelerate the k-means algorithm.
Arthur et al. [4] proposed the K-means++ algorithm in 2007, which later became one of the more commonly used K-means modified algorithms. The original K-means algorithm randomly selects K points in the data set as cluster centers at first, while K-means++ selects new cluster centers one by one after randomly selecting the first cluster center. Points farther from the current cluster center have a higher probability of being selected as the new cluster center. This improved algorithm converges faster and can achieve better results.
K-means and its improved algorithm have been applied in many fields as soon as they were proposed. Lee et al. [5] present an analysis of the correlation of annotated information unit (textual) tags and geographical identification metadata geotags with K-means clustering. Manjushree et al. [6] use an improved K-means clustering algorithm to divide online data and predict commodity prices dynamically. Liu et al. [7] and others proposed a smart home hybrid intrusion detection method based on convolutional neural network and K-means. On the smart home device node, use K-means to generate a rule base through clustering, and then use principal component analysis to extract dimensionality reduction features. This hybrid method can improve the detection rate of the smart home intrusion detection system. Ahuja et al. [8] used K-Means clustering and K-nearest neighbor algorithm to construct a movie recommendation system and proved in experiments that the effect of this system is better than the existing technology. Maamar et al. [9] propose a hybrid approach to detect anomalies associated with electricity theft in the grid system, based on K-means algorithms and Deep Neural Network. Tang et al. [10] propose a non-uniform clustering routing algorithm based on the improved K-means algorithm to balance and reduce the energy consumption of nodes in a large-scale wireless sensor network and extend the network life. Ahmed et al. [11] present a survey of parallel K-means and Fuzzy-c-means clustering algorithms based on their implementations in parallel environments such as Hadoop, MapReduce, Graphical Processing Units, and multi-core systems. Cui et al. [12] propose a clustering algorithm based on self-organizing mapping network and weight particle swarm optimization SOM&WPSO (Self-Organization Map and Weight Particle Swarm Optimization). Yang et al. [13] propose a novel multi-feature weighting based K-means (MFWK-means) algorithm to analyze the MOOC learner’s characteristics and classify the learners into different groups.
2.2 User Analysis of Social Networks
User analysis is an important part of social network analysis. Most existing research uses user-generated content or social links between users to simulate users. Wu et al. [14] modeled users on the Content Curation Social Network (CCSN) in a unified framework by mining user-generated content and social links. They proposed a potential Bayesian model multi-level LDA (MLLDA), which can represent users with potential interest found in social links formed by user-contributed text descriptions and information sharing. In 2018, the team proposed a new algorithm [15]. In the Content Curation Social Network (CCSN), two kinds of user relationships are merged to calculate the user’s influence score, and then to identify users with high influence. Peleshchyshyn et al. [16] proposed a method to identify the specific role and influence of social network users. Khanday et al. [17] analyzed several different models for calculating user influence. They demonstrated these models and analyzed and compared different methods. The conclusion is that because this problem is difficult, there is currently no method better than others.
In 2017, Wu et al. [18] proposed the Latent Model, trying to explain how the changing social network structure and users’ historical preferences over time affect each user’s future behavior and predict each user’s consumption preferences and social connections in the near future. Malli et al. [19] proposed a new online social network user profile rating model, which solves the problem of large and complex user data. Ma Ning et al. combined the knowledge of BP neural network, genetic algorithm and fuzzy theory, designed a GA-BP hybrid algorithm based on fuzzy theory, and constructed an air quality evaluation model. Dashun Wang and Chaoming Song combined the mobility of people to explore social network information and found that the mobility of people plays an important role in shaping the local and global structural characteristics of social networks.
3 Collection of Social E-commerce Data
Social e-commerce mainly engages in business activities through social software, including looking for customers, maintaining customer relationships, promoting products, completing sales conversions, and performing after-sales maintenance. In order to better analyze the behavior patterns of social e-commerce, we have developed an auxiliary tool for social e-commerce - Smart Space. Through this tool, an independent operating environment of social software and automated auxiliary capabilities are provided for social e-commerce, and the information collection module of the auxiliary process is used to collect social information released by social e-commerce, and upload it to the back-end server for model training. We provide this tool to nearly 10,000 social e-commerce personnel participating in the experiment to obtain social information about their e-commerce activities.
The entire data collection program is mainly composed of two parts, the Smart Space application and the background server. The overall structure of the program is shown in Fig. 1. The Smart Space application is deployed in the mobile phones of social e-commerce personnel, based on the application layer of the Android platform, to provide social e-commerce with a secure container for the independent operation of social software. In the Smart Space app, an automated auxiliary module is provided to provide social e-commerce with automated auxiliary capabilities for various business processes, and collect social information in the auxiliary process through the information capture module. At the same time, an information collection service is implemented in the Smart Space, through which the collected social information is cached and uploaded locally. The back-end server is responsible for receiving the collected data uploaded by the Smart Space, and firstly preprocessing the data, then classifying the social e-commerce through the data based on the machine learning classification model, and finally storing the classification results.
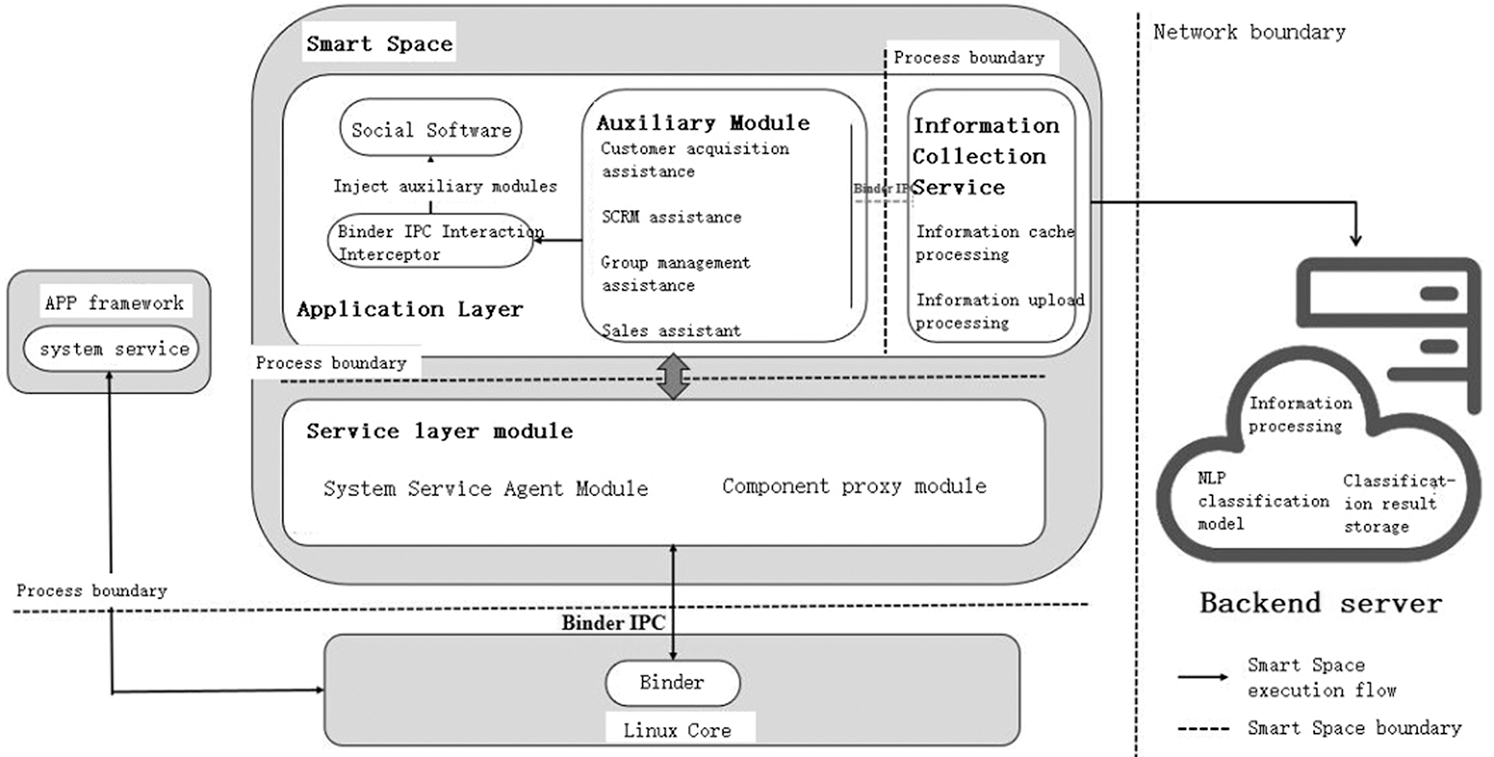
Figure 1: Overall architecture diagram of the data collection program
(1) Secure Container
The design goal of a secure container is to realize an application container that can run social software independently without modifying the OS or obtaining root permissions. The basic principle of its realization is to create an independent container process, dynamically load the APK file of social software, and monitor and intercept process communication interfaces such as Binder IPC through Libc hook, Java reflection, dynamic proxy and other technical means and through the automatic auxiliary module to achieve the collection of social information. The main part of the container is mainly composed of two parts: application layer module and service layer module.
The application layer module is responsible for the process startup and execution of social software, and its main functions include three parts:
1. Interactive interception function. The application layer module completes the interception of the interaction between the application process in the container and the bottom layer of the system, and modifies the calling logic. By hooking or dynamic proxying the system library API, Binder communication interface, etc., the application layer module intercepts all the interfaces that social software interacts with the system during the execution process, and controls the process boundary of the interaction between social applications and system services.
2. Social information collection function. When the social application process is initialized, the application layer module injects the corresponding plug-in in the automatic auxiliary module into the social application process to realize the loading of the automatic auxiliary module by the social software. The automatic assistance module provides social e-commerce with e-commerce auxiliary functions including customer acquisition assistance, SCRM (Social Customer Relationship Management) assistance, group management assistance, sales assistance and daily affairs assistance. When social e-commerce is conducting e-commerce activities, it publishes social information with commercial attributes through auxiliary functions. The automatic auxiliary module will automatically collect the social information and send it to the information collection service for processing.
3. Local processing function of social information. The information collection service receives the social information collected by the automatic auxiliary module, and firstly caches it locally. The data is compressed and encrypted during the caching process. Then through the timer, periodically upload the collected data to the background server, and the upload process uses HTTPS to ensure the safety of data transmission.
The main function of the service layer module is to take over the modified call logic of the application layer module by simulating system services, modify the parameters in the communication process, and finally call the real system service. The service layer module exists in the container in the form of an independent process. The key simulation system services are AMS and PMS. Through these two proxy services, the system service support for the startup and operation of social software is realized.
(2) Backend server
The back-end server mainly implements machine learning model processing of collected social data, including data preprocessing, data training, classification, and result storage. Its core processing logic will be described in Chapter 5.
In the process of social information collection and processing, this program includes four key processes which are social software process initialization, social software process execution, social information local processing, and social information background processing. The entire process is shown in Fig. 2.
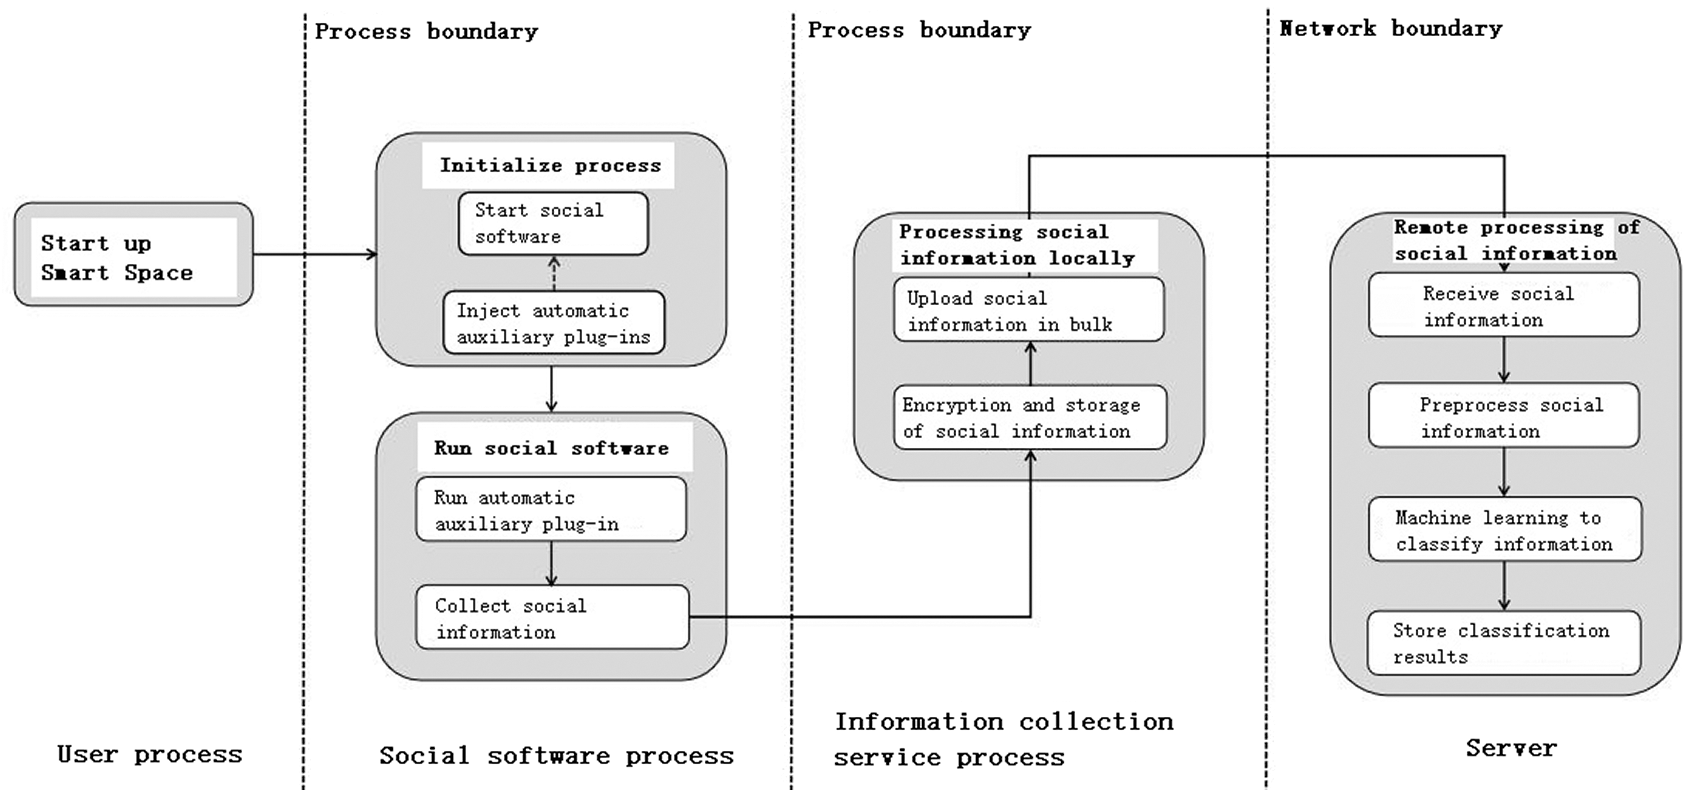
Figure 2: Key flow chart of data collection program
(1) Social software process initialization
When the Smart Space starts the social software, it first intercepts the callback functions of all its components in the life cycle, and when the process is initialized, that is, when the handleBindApplication function is processed, the auxiliary module plug-in is injected to realize the automatic auxiliary module process loading.
(2) Social software process execution
The process execution of social software is completed by the application layer module and service layer module of the smart space. In social software, social e-commerce uses automatic auxiliary modules to complete business activities, triggers the information capture module to collect social information, and sends it to the information collection service for subsequent processing.
(3) Local processing of social information
The local processing of social information is mainly completed by the information collection service of the smart space. In order to ensure the safe storage and transmission of collected social information, the information collection service first implements local secure caching by encrypting and compressing information, and then uploading data using the HTTPS secure communication transmission protocol.
(4) Social information background processing
The background processing of social information is done by the background server. First, the back-end server receives the social information uploaded by the Smart Space, and then decrypts and decompresses the social information, and performs data cleaning on the plaintext data, and then implements accurate classification of social e-commerce through data based on machine learning modeling, and finally stores the classification results to the target database.
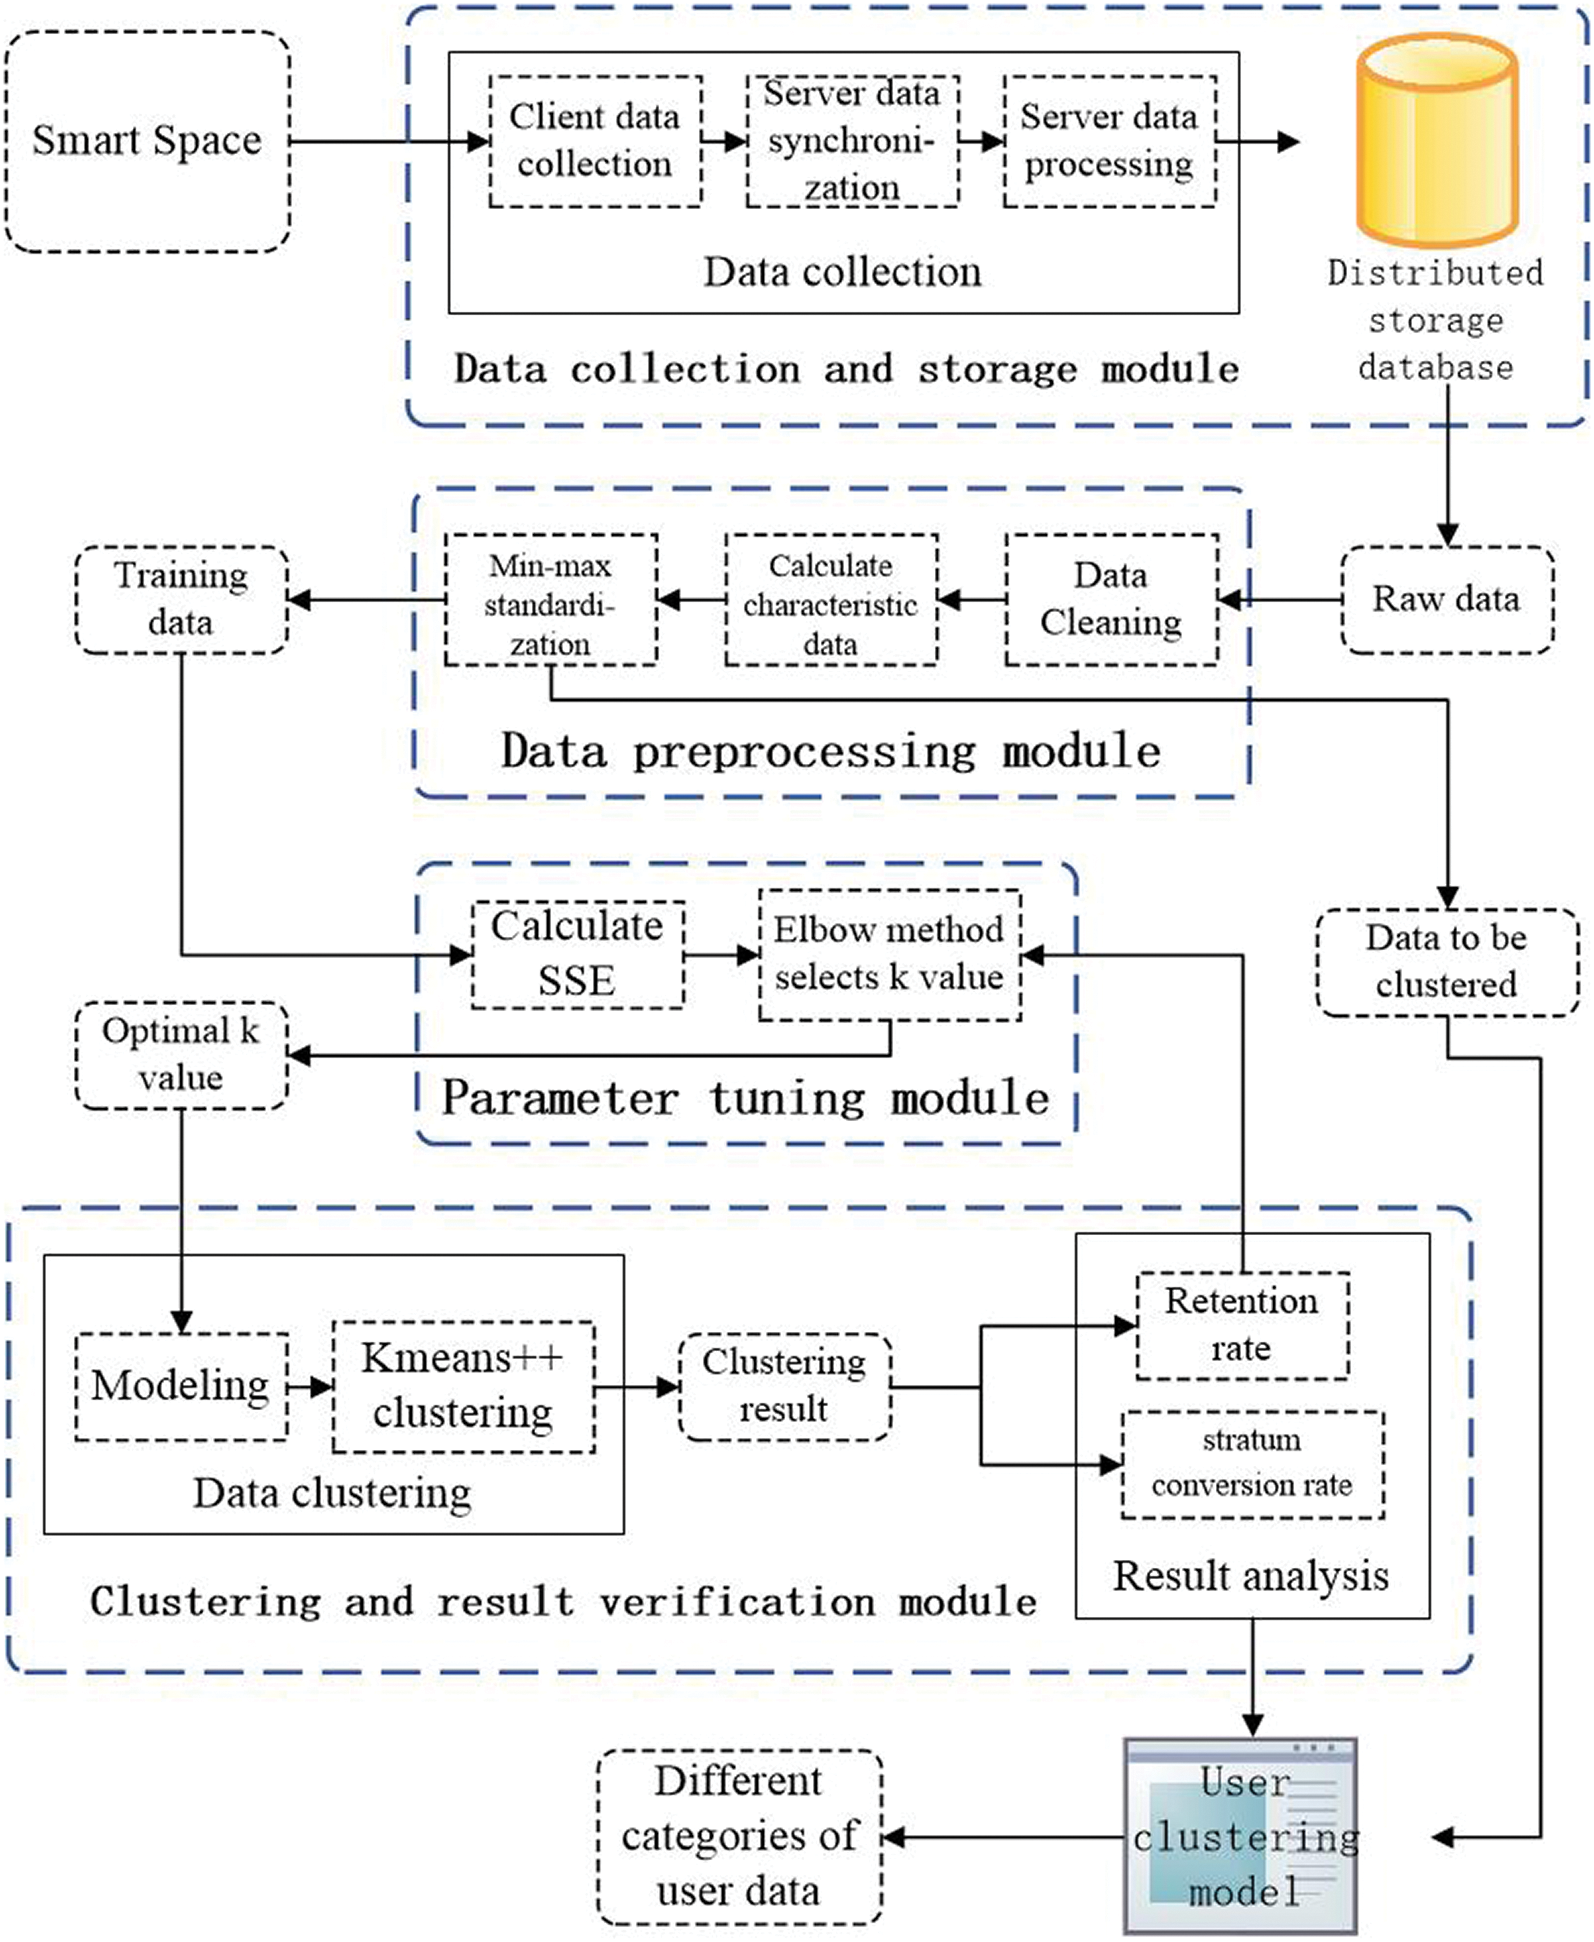
Figure 3: The architecture diagram of the clustering scheme
This section proposes a clustering method including four stages of data collection and storage, data preprocessing, parameter tuning and clustering result verification. The architecture diagram of the clustering scheme is shown in Fig. 3.
4.1 Data Collection and Storage Module
This module is mainly realized by using the functions in the data collection program in Chapter 3, which is mainly divided into data collection and data storage.
The data collection stage is divided into client data collection and server data synchronization. Client data collection is mainly completed by the information collection service of Smart Space. After the collection is completed, the client uses the HTTPS secure communication transmission protocol to upload data to the server. After receiving the social information uploaded by Smart Space, the server performs a series of data processing such as decryption and decompression operations on the social information, and then stores the social information in a distributed storage database.
In the data preprocessing module, we first cleaned the original data obtained from the distributed storage database to remove noise points. Next, combined with the original data and usage scenarios, we extracted the four characteristics of the user’s single month usage days, daily average number of transactions, average single transaction amount, and average daily usage time (min). The average daily transaction number reflects the user’s transaction frequency, and the average single transaction amount reflects the user’s sales type. The user’s single month usage days and the average daily usage time reflect the degree of user dependence on social software.
In the data processing stage, due to the large difference in the numerical values of different clustering features, it is necessary to standardize the features to convert the original feature data into dimensionless values. This paper uses the min-max standardization method to standardize the 4 features, and the calculation formula is as follows:
After the above processing, the normalized eigenvalues are all in the interval [0,1].
This paper selects the K-means++ algorithm to cluster the data. The traditional K-means algorithm is sensitive to the initially selected k clustering center points, and different initial clustering centers may lead to completely different clustering results. The K-means++ algorithm is an optimization of the traditional K-means algorithm for randomly initializing the centroid, and it significantly improves the problem of the K-means algorithm due to the initial point selection.
The idea of the K-means++ algorithm is: the initially selected k cluster centers are as far away as possible. The optimization strategy is as follows:
(1) Randomly select a sample point as the first cluster center.
(2) Calculate the distance between each sample point and the current closest cluster center. The larger the distance, the greater the probability of being selected as the cluster center. Then use the Roulette Wheel method to select the next cluster center.
(3) Repeat step (2) to select k cluster centers C = {c1, c2,…, ck}.
The K-means++ algorithm needs to select the k value of the cluster center. Usually, by drawing a two-dimensional graph of k value and SSE (within-cluster sum of squared errors), using the Elbow Method to select the k value at the inflection point of the straight line as the optimal k value. The calculation of SSE is as follows, where
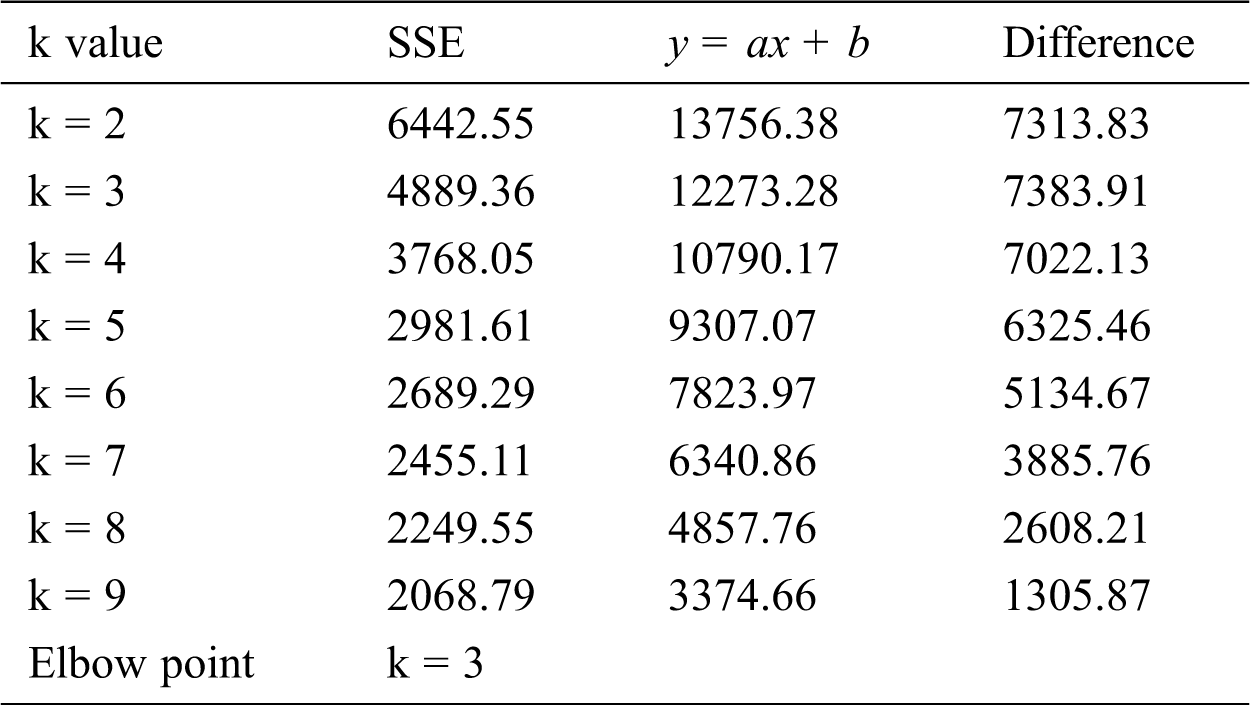
When determining the k value with the Elbow Method, it is necessary to artificially identify the inflection point of the broken line based on the k value and the two-dimensional graph of SSE, which is easy to make subjective judgments. This paper adopts the method of automatically obtaining k value according to the elbow method [20]. This method connects the first point and the last point of the elbow method to a line y = ax + b, and obtains a set of y values in the line according to the abscissa k value. The SSE corresponding to each y value and the abscissa k value is subtracted to obtain a difference set. The k value corresponding to the maximum value in the difference set is the optimal k value.
4.4 Clustering and Result Verification Module
We use the optimal k value obtained in Section 4.3 to cluster the data set and obtain the final clustering result.
The goal of this article is to achieve the stratification and classification of social e-commerce users by clustering user data. In this field, retention rates are commonly used to assess user viscosity. A user has used the software at a certain time, and the user who still uses the software after a period of time is a retained user. Retention rate refers to the proportion of retained users to users who may lose. This paper verifies the clustering results of the user classification by retention rate.
Stratum conversion rate refers to the conversion rate of different clusters in the next month. After judging the user class by the retention rate, this article uses the stratum conversion rate to observe the changes of each cluster class.
Therefore, for the evaluation of the clustering effect, we use the next month retention rate of the cluster and the stratum conversion rate to evaluate the clustering result. When the retention rate does not perform well, it is planned to adjust the k value by automatically selecting the secondary advantage of the k value. Then, perform clustering again according to the new k value, and observe its retention rate.
The retention rate
The calculation of the class conversion rate
This article hopes to obtain a user clustering model which has good clustering effect through clustering and its result analysis. Use this model to cluster user data to obtain different types of users, so as to make appropriate operating strategies for different types of users.
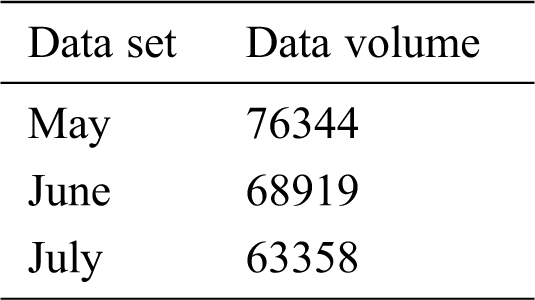
The data is stored in the Hive data warehouse. Due to the large amount of data stored in the data warehouse, it contains not only high-quality data with analytical value, but also some data of temporary and informal users. We need to filter the data through restrictions to find out the real users with analytical value, excluding the occasional users. Through the analysis of the actual transaction data, we find that the users with characteristics that average daily transaction number is above 120 and average daily usage time is between 700 and 800 and users whose average single transaction amount is around 6000 are real users, and their user data has high analysis value. In order to obtain a larger range of data to ensure the authenticity, we choose such a restriction that the users whose average daily transaction number > 100 and average daily usage time > 600 min and the average single transaction amount ≥ 5000. Through this filter, we obtain solid data from the data warehouse.
Hence, we performed the data cleaning on users whose average daily transaction number > 100 and average daily usage time > 600 min and users whose average single transaction amount ≥ 5000. The data volume after cleaning is shown in Tab. 1 below.
In the data processing stage, this paper uses the min-max standardization method to standardize the 4 features. Tab. 2 is an example of some raw data.
The eigenvalues after min-max standardization are all in the [0,1] interval. Tab. 3 is an example of Tab. 2 after the normalization.
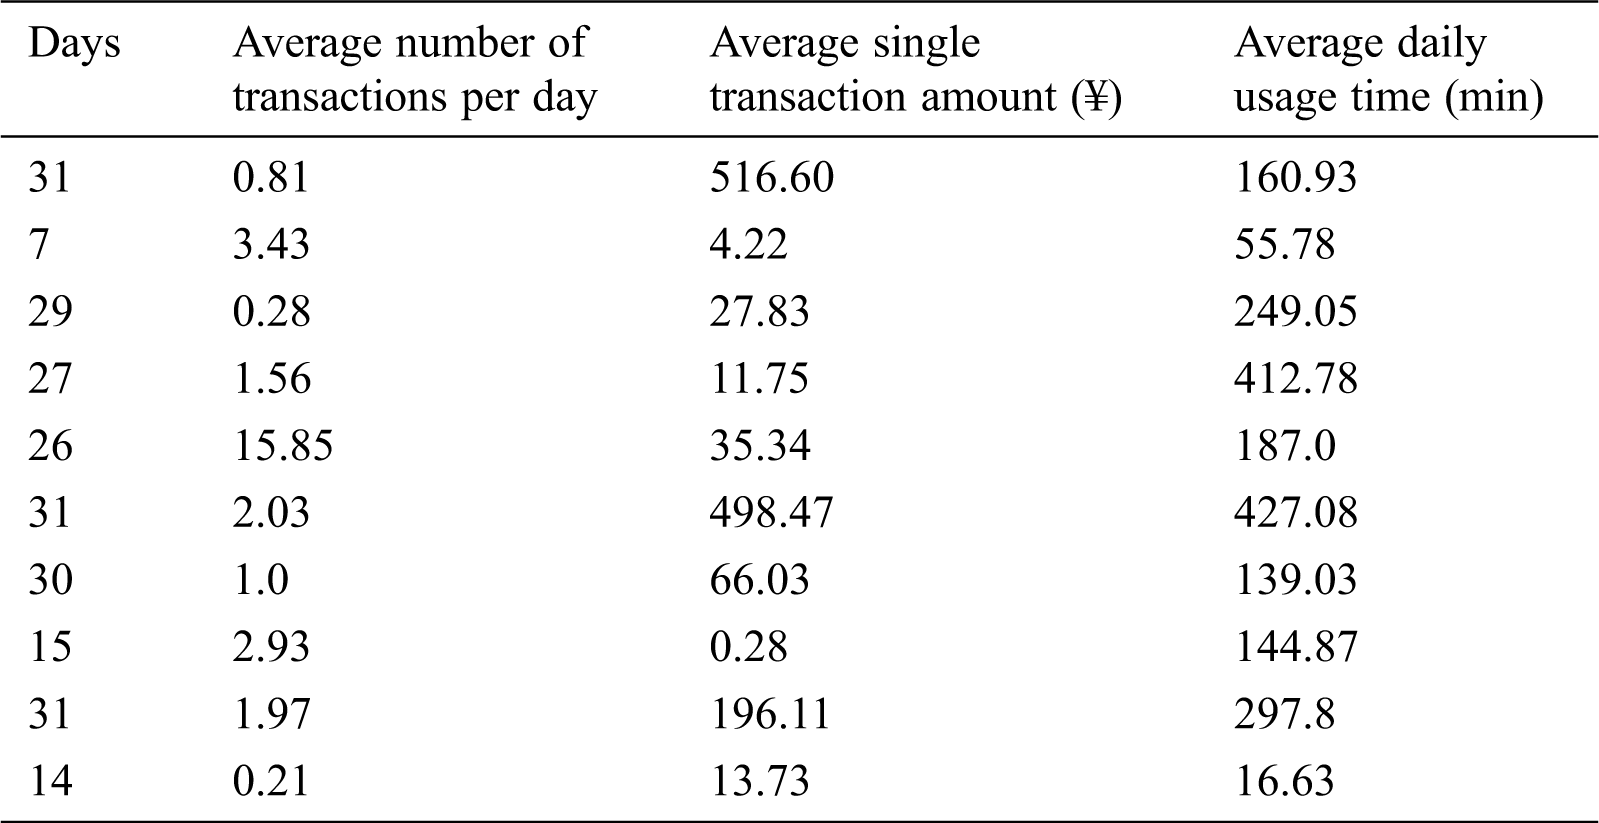
Table 3: Min-max normalized data
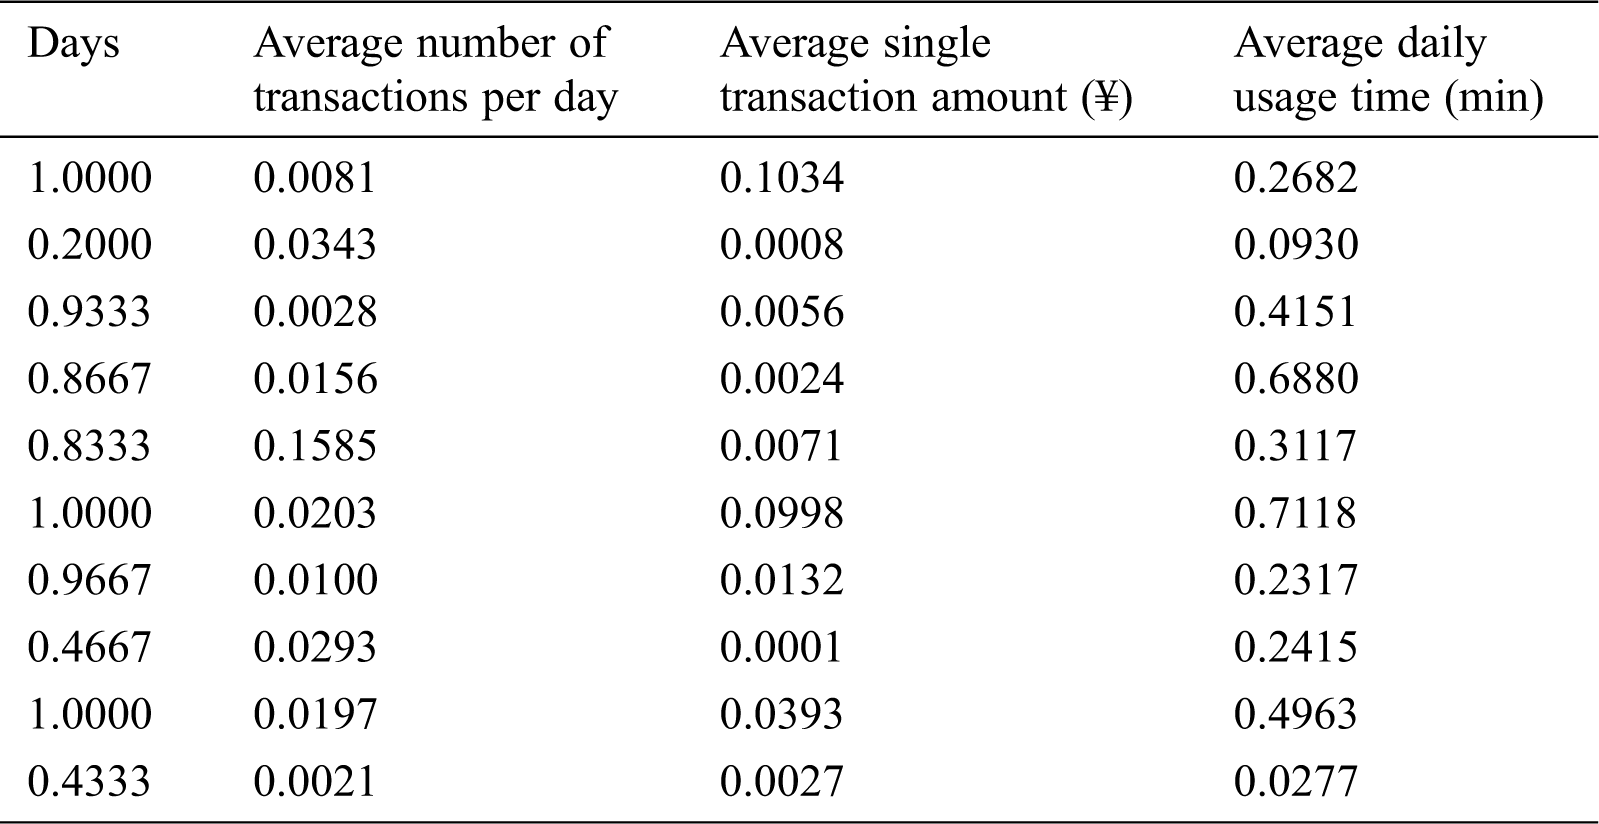

Figure 4: SSE of May
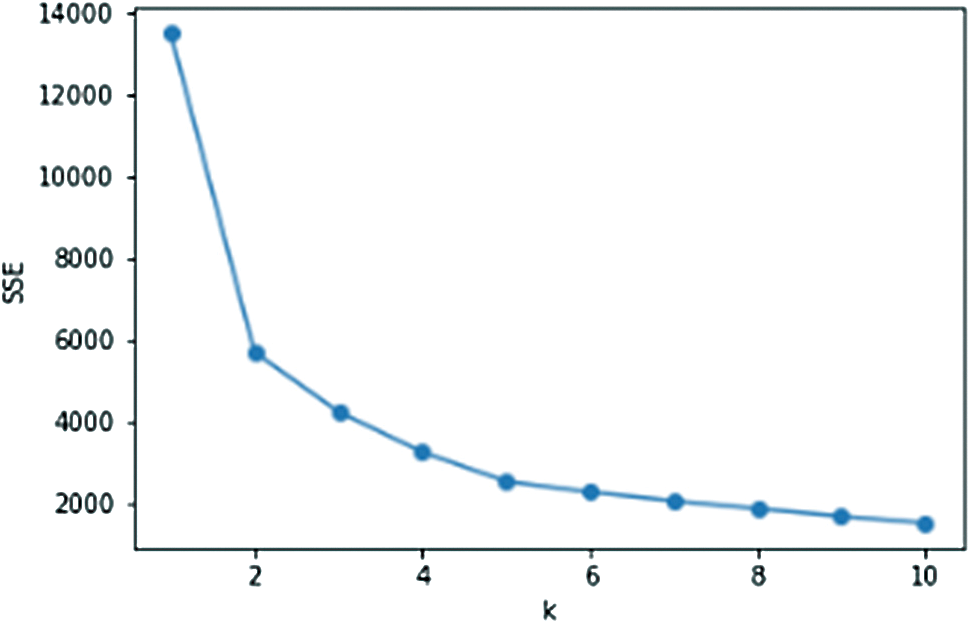
Figure 5: SSE of June
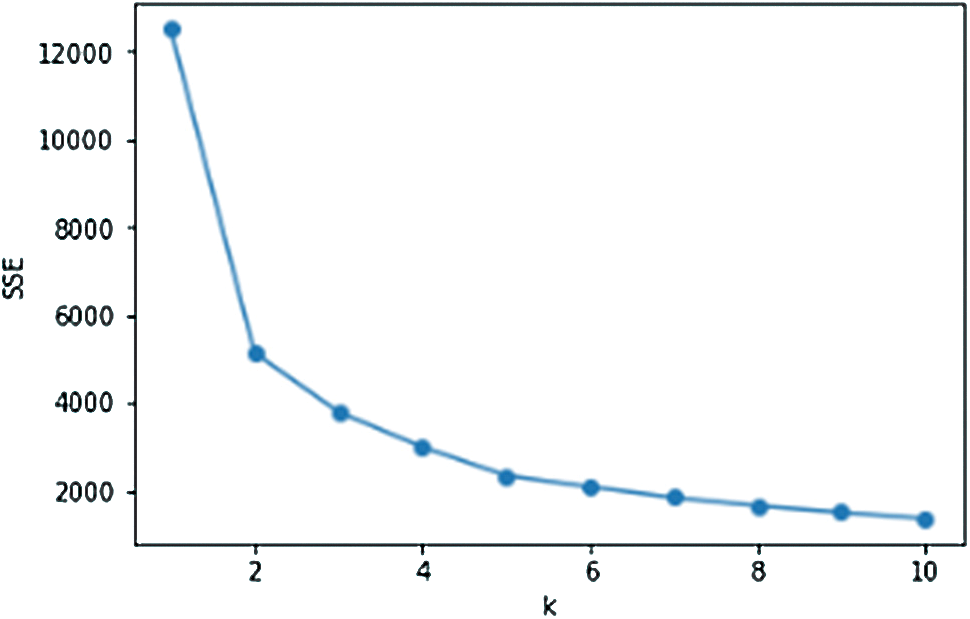
Figure 6: SSE of July
Figs. 4–6 are the line graphs of the k value and SSE of the three data sets. The SSE corresponding to each k value is the smallest SSE obtained after 20 rounds of repeated calculations. From the observation and judgment of the line graph using the traditional elbow method, we can conclude that the elbow point appears near k = 2, 3, 4. According to the chart of SSE of May in Fig. 4, using the elbow method to obtain the value of k, the data in Tab. 4 is obtained.
According to Tab. 4, the maximum difference between the straight line y = ax + b and SSE, the elbow point in May is k = 3. After calculation, the elbow points in June and July are both k = 3. Therefore, we select k = 3 to cluster the three-month data separately.
Table 4: Calculation data of k value obtained by elbow method in May
According to the optimal k value obtained in the previous section, the data of May, June and July were clustered, and the optimal result obtained through 20 rounds of repeated calculations was used as the final clustering result.
By observing the experimental results, we can find that these three graphs show similar results. This phenomenon proves that the data have similar statistical characteristics, and this is also the reason why we take data by month.
The value of the cluster center is the average value of the sample points in the cluster, and the corresponding attributes of the cluster can be derived from the cluster center. The data and retention rates of each cluster center with k = 3 are shown in Tabs. 5–7.
Table 5: Clustering results of May
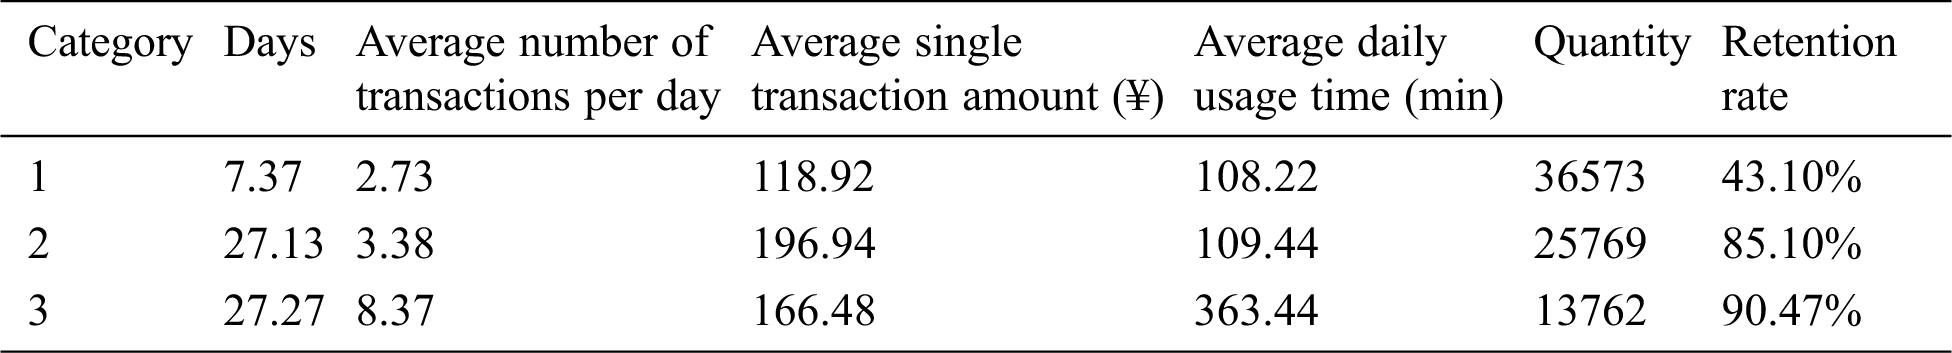
Table 6: Clustering results of June
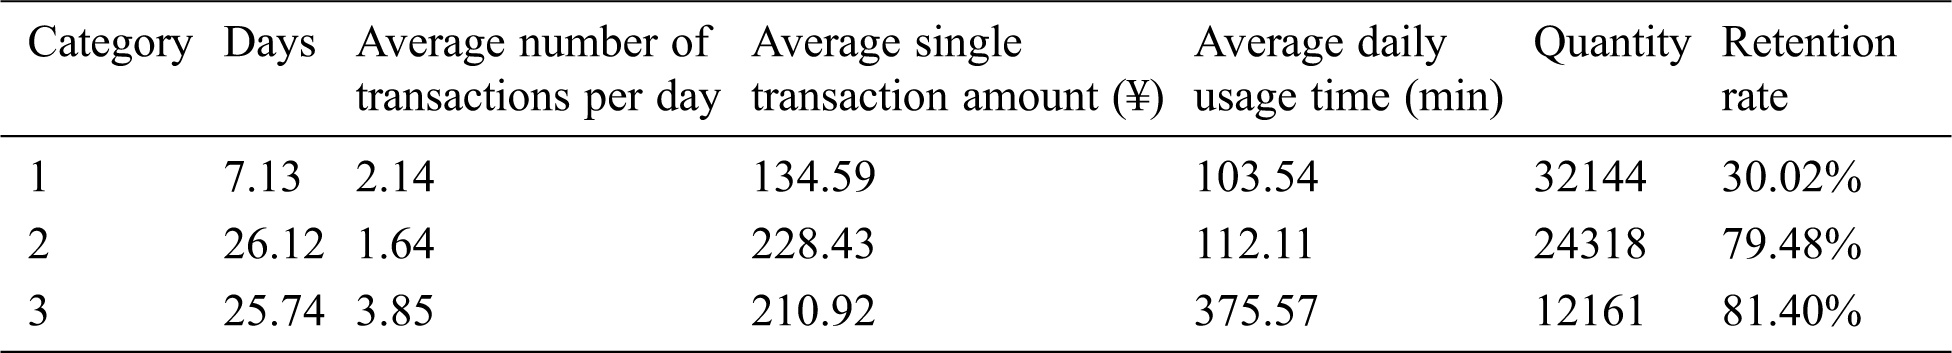
Table 7: Clustering results of July
From the retention rate of k = 3, we can see that the retention rate of category 1 users is relatively low, and the retention rate of category 2 users and category 3 users is relatively high. And the difference in retention rate between category 2 users and category 3 users is small. From the cluster centers, we can see that the values of the cluster features of the category 1 users in May, June, and July are low; the average number of transactions per day and the average daily usage time of category 2 users are lower than those of category 3 users. In terms of overall retention rate, category 1 users are low-level users of the software, and category 2 and category 3 users correspond to middle and high-level users.
The stratum conversion rate of each cluster class when k = 3 are shown in Tabs. 8 and 9.
Table 8: Stratum conversion rate from May to June
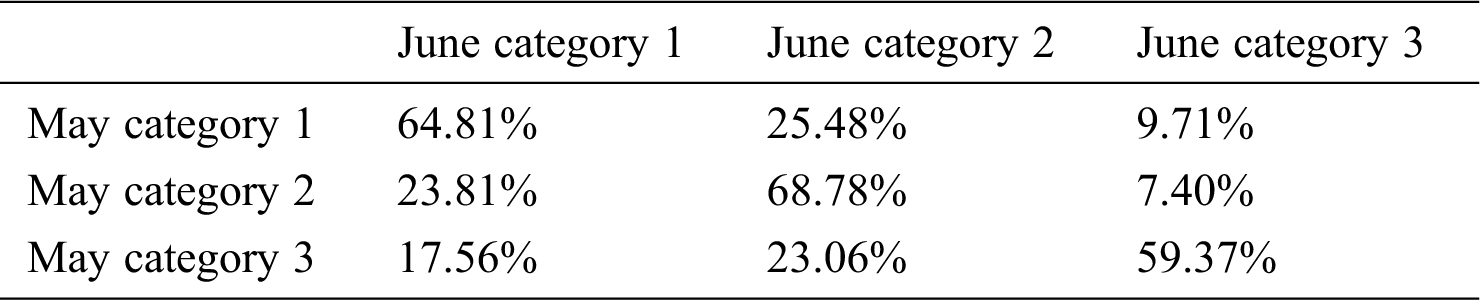
Table 9: Stratum conversion rate from June to July
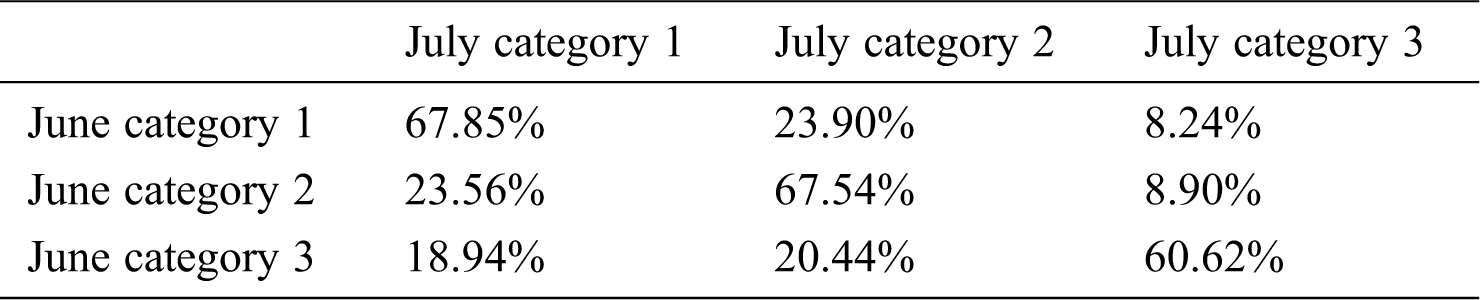
From the overall stratum conversion rate of May and June mentioned above, we can see that users in each category have the highest conversion rate for users in this category next month. More than 60% of category 1 users will still be category 1 users next month, and this part of users is less dependent on software. From the perspective of retention rate, category 1 users are easily eliminated users. Category 2 users and category 3 users have higher retention rates. And from the perspective of conversion rate, these two types of users rely on software to a higher degree. Among them, the percentage of the stratum decline in the category 2 users accounts for only about 20%, and the percentage of the stratum decline in the category 3 users accounts for about 40%. Compared with the category 2 users, the category 3 users have dropped more on the stratum.
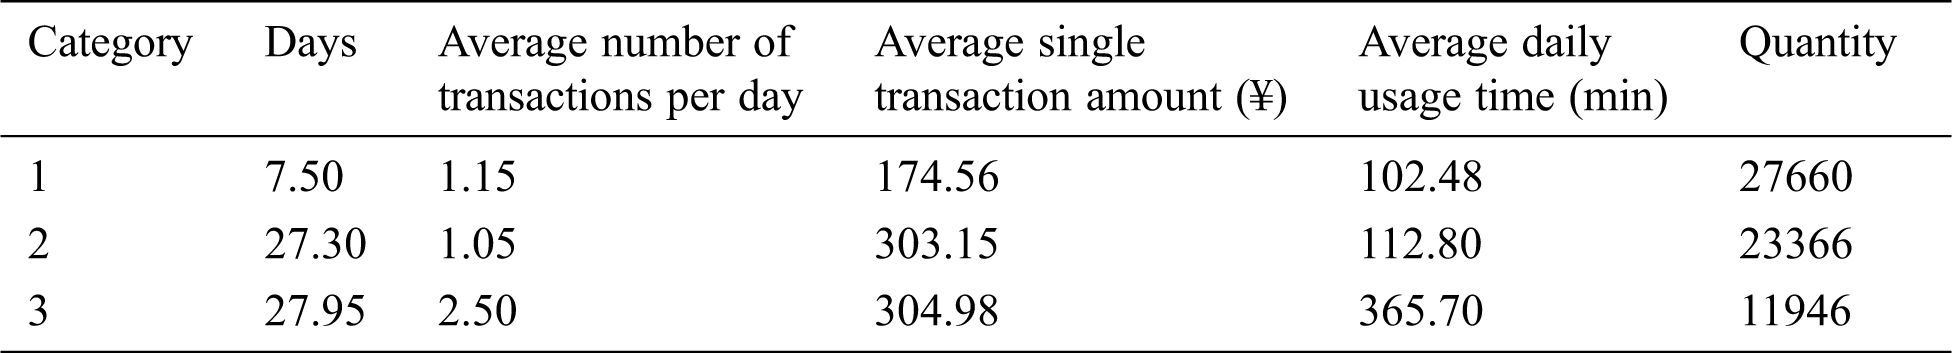
Considering that we are using a social e-commerce dataset, we need to explore how social characteristics affect the experimental results. Thus, we conduct an ablation study where we remove social features. The results are shown in Tab. 10.
Table 10: Clustering results of June
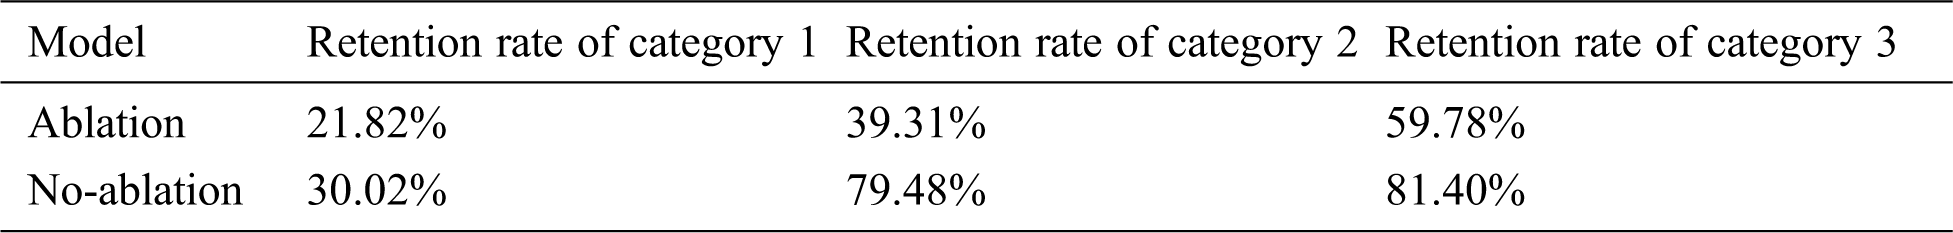
The result of the ablation study is worse than the result of the full model. It can be proved that the social feature has an important contribution to the analysis of user behavior.
This paper uses the K-means++ algorithm to perform a cluster analysis on social e-commerce data, and evaluates the clustering results using the user’s next month retention rate and stratum conversion rate. The clustering results show that there are differences in the retention rates of various classifications of users. The relevant characteristics and user classes of various classifications of users can be summarized from the clustering center and the retention rate.
Through the clustering model of this paper, we can get the low-level, middle-level and high-level users of the social e-commerce software, which facilitates the development of different operation plans for different kinds of users.
Funding Statement: The authors received no specific funding for this study.
Conflicts of Interest: The authors declare that they have no conflicts of interest to report regarding the present study.
1. J. B. MacQueen. (1967). “Some methods for classification and analysis of multivariate observations,” in Proc. of 5th Berkeley Sym. on Mathematical Statistics and Probability, Berkeley, CA, USA, pp. 281–297. [Google Scholar]
2. D. Chaudhuri and B. B. Chaudhuri. (1997). “A novel multiseed nonhierarchical data clustering technique,” IEEE Transactions on Systems, Man, and Cybernetics, Part B (Cybernetics), vol. 27, no. 5, pp. 871–876. [Google Scholar]
3. T. Kanungo, D. M. Mount, N. S. Netanyahu, C. D. Piatko, R. Silverman et al. (2002). , “An efficient k-means clustering algorithm: Analysis and implementation,” IEEE Transactions on Pattern Analysis and Machine Intelligence, vol. 24, no. 7, pp. 881–892. [Google Scholar]
4. D. Arthur and S. Vassilvitskii, “K-means++: The advantages of careful seeding,” in Proc. of the Eighteenth Annual ACM-SIAM Sym. on Discrete Algorithms, New Orleans, LA, USA, pp. 1027–1035, 2007. [Google Scholar]
5. S. S. Lee, D. Won and D. McLeod. (2008). “Discovering relationships among tags and geotags,” in Proc. of the 2nd Int. Conf. on Weblogs and Social Media, Seattle, WA, USA, pp. 202–203. [Google Scholar]
6. N. Manjushree and N. Bhavana. (2020). “Predicting dynamic product price by online analysis: Modified k-means cluster,” Advances in Intelligent Systems and Computing, vol. 1120, pp. 1–15. [Google Scholar]
7. K. Liu, Z. Fan, M. Liu and S. Zhang. (2018). “Hybrid intrusion detection method based on k-means and CNN for smart home,” in 2018 IEEE 8th Annual Int. Conf. on CYBER Technology in Automation, Control, and Intelligent Systems (CYBER). Tianjin, China, pp. 312–317. [Google Scholar]
8. R. Ahuja, A. Solanki and A. Nayyar. (2019). “Movie recommender system using k-means clustering and k-nearest neighbor,” in 2019 9th Int. Conf. on Cloud Computing, Data Science & Engineering (Confluence), Noida, India, pp. 263–268. [Google Scholar]
9. A. Maamar and K. Benahmed. (2019). “A hybrid model for anomalies detection in AMI system combining k-means clustering and deep neural network,” Computers Materials & Continua, vol. 60, no. 1, pp. 15–40. [Google Scholar]
10. X. Tang, M. Zhang, P. Yu, W. Liu, N. Cao et al. (2020). , “A nonuniform clustering routing algorithm based on an improved k-means algorithm,” Computers Materials & Continua, vol. 64, no. 3, pp. 1725–1739. [Google Scholar]
11. A. Ahmed and B. Akay. (2019). “A survey and systematic categorization of parallel k-means and fuzzy-c-means algorithms,” Computer Systems Science and Engineering, vol. 34, no. 5, pp. 259–281. [Google Scholar]
12. G. R. Cui, H. Li, Y. C. Zhang, R. J. Bu, Y. Kang et al. (2020). , “Weighted particle swarm clustering algorithm for self-organizing maps,” Journal of Quantum Computing, vol. 2, no. 2, pp. 85–95. [Google Scholar]
13. Y. Yang, D. Zhou and X. Yang. (2019). “A multi-feature weighting based k-means algorithm for MOOC learner classification,” Computers Materials & Continua, vol. 59, no. 2, pp. 625–633. [Google Scholar]
14. L. Wu, D. Wang, X. Zhang, S. Liu, L.Zhang et al. (2017). , “Multi-level LDA for modelling users on content curation social networks,” Neurocomputing, vol. 236, no. 11, pp. 73–81. [Google Scholar]
15. L. Wu, B. Yang, M. Jian, J. Sang, D. Zhang et al. (2018). , “MPPR: Multi perspective page rank for user influence estimation,” in 2018 IEEE Int. Conf. on Big Data and Smart Computing (BigComp). Shanghai, China, pp. 25–29. [Google Scholar]
16. A. Peleshchyshyn, V. Vus, O. Markovets and S. Albota. (2018). “Identifying specific roles of users of social networks and their influence methods,” in 2018 IEEE 13th Int. Scientific and Technical Conf. on Computer Sciences and Information Technologies (CSIT). Lviv, Ukraine, pp. 39–42. [Google Scholar]
17. H. A. Khanday, A. H. Ganai and R. Hashmy. (2018). “A comparative analysis of identifying influential users in online social networks,” in 2018 Int. Conf. on Soft-computing and Network Security (ICSNS). Coimbatore, India, pp. 1–6. [Google Scholar]
18. L. Wu, Y. Ge, Q. Liu, E. Chen, R. Hong et al. (2017). , “Modeling the evolution of users’ preferences and social links in social networking services,” IEEE Transactions on Knowledge and Data Engineering, vol. 29, no. 6, pp. 1240–1253. [Google Scholar]
19. M. Malli, N. Said and A. Fadlalah. (2017). “A new model for rating users’ profiles in online social networks,” Computer and Information Science, vol. 10, no. 2, pp. 39. [Google Scholar]
20. G. Wu, J. Zhang and D. Yuan. (2019). “Automatically obtaining k value based on k-means elbow method,” Software, vol. 40, no. 5, pp. 167–170. [Google Scholar]
 | This work is licensed under a Creative Commons Attribution 4.0 International License, which permits unrestricted use, distribution, and reproduction in any medium, provided the original work is properly cited. |