DOI:10.32604/iasc.2021.015413
| Intelligent Automation & Soft Computing DOI:10.32604/iasc.2021.015413 | |
| Article |
Predicting COVID-19 Based on Environmental Factors With Machine Learning
1Center For Artificial Intelligence Technology, Faculty of Information Science and Technology, The National University of Malaysia (UKM), Selangor, Malaysia
2Al-Maarif University College, Ramadi, Iraq
*Corresponding Author: Nor Samsiah Sani. Email: norsamsiahsani@ukm.edu.my
Received: 19 November 2020; Accepted: 13 February 2021
Abstract: The coronavirus disease 2019 (COVID-19) has infected more than 50 million people in more than 100 countries, resulting in a major global impact. Many studies on the potential roles of environmental factors in the transmission of the novel COVID-19 have been published. However, the impact of environmental factors on COVID-19 remains controversial. Machine learning techniques have been used effectively in combating the COVID-19 epidemic. However, researches related to machine learning on weather conditions in spreading COVID-19 is generally lacking. Therefore, in this study, three machine learning models (Convolution Neural Network (CNN), ADtree Classifier and BayesNet) based on the confirmed cases and weather variables such as temperature, humidity, wind and precipitation are developed. This study aims to identify the best classification model to classify COVID-19 by using significant weather features chosen by Principle Component Analysis (PCA) feature selection method. The DS4C COVID-19 dataset is used to train and validate each machine learning model. Several data pre-processing tasks such as data cleaning and feature selection have been conducted on the raw dataset to ensure the quality of the training data. The performance of these machine learning algorithms is further rectified based on the selected features set by PCA. Each classifier is then optimized using different tuning parameters to achieve optimum values before comparing the output of the three classifiers against each other. The observational results have shown that the optimized CNN classifier with seven weather variables selected by PCA achieved the highest performance among all the techniques. The experimental results obtained show that the weather variables are more relevant in predicting the confirmed cases as compared to the other variables. Thus, from this result, it is evident that temperature, humidity, wind and precipitation are important features for predicting COVID-19 confirmed cases.
Keywords: Machine learning; deep learning; classification; COVID-19; CNN; Naive Bayes; ADtree
Machine learning is the most dominant way of processing massive data accurately and rapidly. Machine learning is a data analysis tool that automates the creation of analysis models. It is an artificial intelligence branch focused on the concept that systems can learn from data, detect patterns, and make choices with minimal human intervention [1–4]. Machine learning is the most popular and dominant approach to decision making because of the ability to automate complex tasks [3], [5–7]. The machine learning approach involves algorithms and it has been used in many studies, including medical diagnosis, classification, learning correlation, regression, image processing and etc. [8–12]. Machine learning includes three types of algorithm approaches: supervised, unsupervised, and reinforcement learning. These algorithms learn from previous experiences to predict future outcomes. The common machine learning classifiers are Decision Trees (DTs), Random Forest (RF), and Multinomial Logistic Regression. Deep learning has proven to be a popular and robust learning classification approach based on minimum time and optimal performance. The model is composed of multiple layers, which account for its high performance within minimum instants [13]. Machine learning algorithms are used to estimate missing data values. The prediction-based research in medical sciences mostly uses deep learning algorithms such as Convolution Neural Network and other deep learning methods.
The novel coronavirus disease (COVID-19) was first found in Wuhan, China, in December 2019, and has since rapidly spread across the world. The world has been forced to handle the outbreak. Big data has been generated from the global outbreak statistics provided by the World Health Organization (WHO). Large-scale case studies have thoroughly demonstrated the clinical features of patients with pneumonia symptoms [14].
In order to solve the proposed problem in this research, the DS4C dataset was used for experimental analysis. This dataset, provided by the Korea Centers for Disease Control and Prevention (KCDC), is far more effective than other open-source and available datasets. Reasonable training and testing sample are specified in this dataset. The experimental analysis was carried out on the entire dataset, and not on randomly selected samples. The advantages of the dataset over the other available datasets are discussed below:
• The training group does not include duplicate records, which improves the results.
• The dataset is updated daily, as the parameter cases selected for the dataset are useful for the comparison-based classification method.
• A comparative verification of results is possible due to the availability of a reasonable size of training and testing samples.
• The dataset does not have an outlier set of data, which means the data available for the experiment are clean and have been verified.
A growing volume of datasets was studied and analyzed using machine learning computation techniques such as data cleansing, pre-processing, feature extraction, and classification approaches. A precise experimental model was developed for the analysis based on deep learning-based multilayer perception, BayesNet and random tree Classification approach.
The remainder of the paper is structured into four sections. The related works are described in Section 2. The methodology is illustrated in Section 3. The experimental analysis of the proposed objective is explained in Section 4. The concluding remarks are discussed in Section 5.
In this technological era, computational technology plays an important role in analyzing and classifying disease deterrence in the health industry. The world is currently facing a pandemic and is forced to prevent the spread of COVID-19. Researchers have highlighted the possible applications of computational technologies like machine learning, artificial intelligence, deep learning, and the Internet of Things to develop strategies for monitoring, detecting, and preventing COVID-19. The use of computational technology has had a significant impact on health care monitoring and disease deterrence [15]. Furthermore, developing a precise COVID-19 model is very critical for preventive action [16].
Sethi and Mittal used machine learning techniques to track the impact of lockdowns on numerous air contaminants attributable to the COVID-19 pandemic and identify those that cause COVID-19 fatalities in order to implement emission control initiatives. From the study, they found that the ozone and toluene contaminants rose during the lockdowns. They also deduced that the toxins that may affect COVID-19 related mortalities are including ozone, NH3, NO2 and PM10. The lockdown also led to environmental restoration [17]. Chawla et al. [18] conducted studies on COVID-19 history, its technological specifics, causal virus, signs and precautions. The study found that social distancing, staying at home, and lockdowns in the absence of the vaccine are proven deterrence to the spread of the disease, and that technology can play an important role in combating the pandemic. The Autoregressive Integrated Moving Average (ARIMA) model is used to predict the global rate of COVID-19 using previous data outcomes. On the basis of this model, the forecasting was studied using various parameters [19].
A copious number of scientific works that analyze COVID-19 and other medical fields have been recently published. Many researchers highlight the analysis, classification and prediction-based analysis using the machine learning algorithm. Some of the prediction-based researches used texture and numerical-based observation, while others utilized observation as well as image-based results [20]. Bahmad and Abou-Kheir used the Principle Component Analysis (PCA) as a feature extraction for masked and un-masked image-based classification. The PCA utilizes the feature selection and reduction approach. It was observed that the classification is enhanced when the PCA is utilized as a feature extraction method. The researcher employed the deep learning-based approach for the automatic identification of positive cases of COVID-19 patients using CT scan image dataset. The proposed research carried out a 3D analysis of image segmentation and 2D analysis of a subsystem. The evaluation results of this research were 99.6% accurate with 98.2% specificity [21]. Al-Waisy et al. [22] developed a hybrid deep learning system for diagnosing COVID-19 in chest X-ray images. The system was designed to reduce the burden on radiologists and monitor the outbreak. The efficiency and usefulness of the proposed COVID-CheXNet framework has been developed along with the possibility of using it in real clinical centers for fast diagnosis and care. The forecast of the spread of COVID-19 infection in China, Italy, and France was studied based on sex, region, infection feature, age, and recovery time of COVID-19 patients [23].
Furthermore, a machine learning logical model was used for the analysis of COVID-19 transmission using various databases to understand the outbreak inside and outside China. Dey et al. [24] highlighted the frequency of confirmed deaths, and improved cases using the dataset and prevent the prediction of new occurrence from this outcome.
Various studies have been published about the potential factors in the transmission of the COVID-19. However, limited researchers have examined environmental conditions as important factors that could affect the COVID-19 spread [25]. Moreover, the effects of temperature and humidity on the spread of COVID-19 have not been established yet, in-depth study and analysis of the weather features associated are needed. Machine learning techniques have been used effectively in combating the COVID- 19 epidemic. However, machine learning related works on weather factors such as temperature, humidity and wind on the spread of COVID-19 is generally lacking [26]. Therefore, in this research, three machine learning models (CNN, ADtree and BayesNet) based on weather variables of infected cases are developed. This study aims to identify the best classification models for classifying COVID-19 cases based on weather features. The main contribution of this research paper is as follows:
• Data pre-processing was carried out to handle outliers and missing values in the dataset. The feature selection and extraction were performed using the PCA with Ranker search method.
• CNN, ADtree and BayesNet classification models were trained and tested based on weather variables of the COVID 19 dataset.
• Comparative analysis was performed to identify the best classification model based on weather variables of the COVID-19 dataset between the CNN, ADtree and BayesNet.
This section describes the dataset, data cleansing, pre-processing, feature extraction and classification methods used. The automation machine learning tool WEKA was used for data cleansing, pre-processing, feature extraction and classification of the DS4C COVID-19 dataset.

Figure 1: Flowchart of implementation of the research
The flow chart of the step-by-step implementation of the research using machine learning algorithms is shown in Fig. 1. The figure shows the training and testing process for the development of classification model.
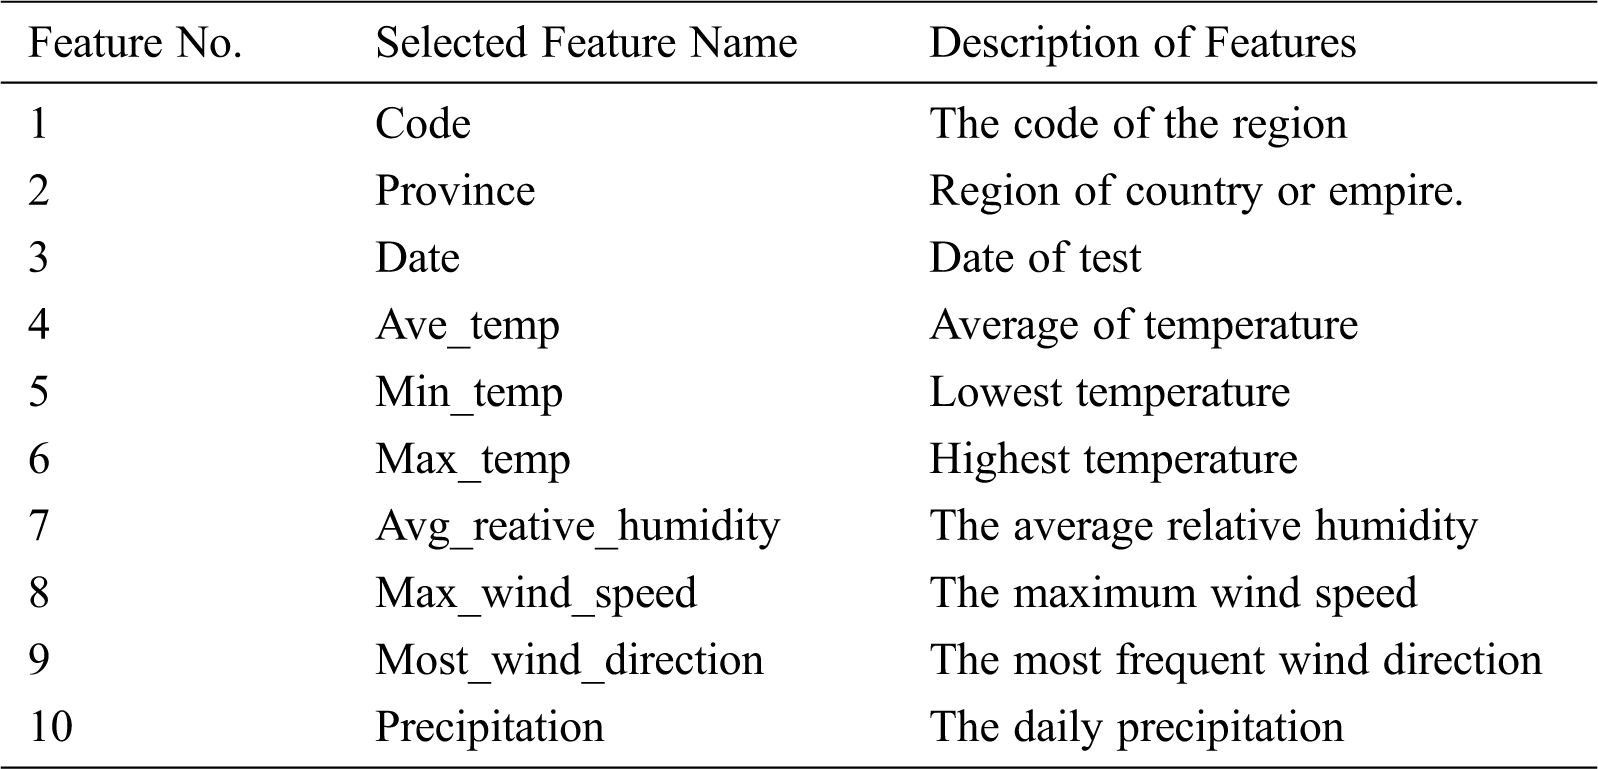
The research experiment is the design and development of classification models for COVID-19 (DS4C) datasets. The dataset was retrieved from the official repository of the Korea Center for Disease Control and Prevention (KCDC). This database consists of daily case reports for 3,520 patients. The dataset summary is in .CSV format with 12 tables for casedata, PatientInfo, PatientRoute, Policy, Region, SearchTreand, SoulFloating, Time, TimeAge, TimeGender, TimeProviance and Weather. The dominant features were selected for analysis using the feature engineering mechanism. The 10 features selected from the database are illustrated in Tab. 1.
Table 1: Details of the selected ten features of DS4C dataset
This study used machine learning to classify COVID-19 cases. The class label was carried out based on average temperature and average relative humidity. The class label used for the classification is described in Tab. 2.
Table 2: Class label used for the classification
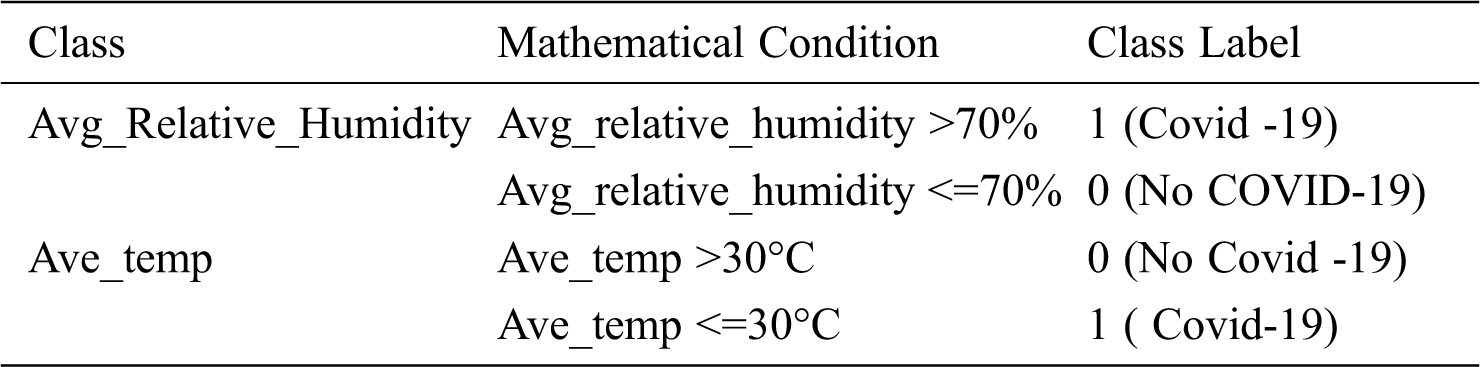
Tab. 2 shows the variables used for the classification model to identify confirmed COVID-19 and non-COVID-19 cases. The data labelling was carried out using two classes.
There is a significant potential for spread due to unfavorable environmental conditions like monsoons, post-monsoons, and winter. Similarly, an increase in relative humidity tends to increase the growth rate, while an increase in temperature leads to a decrease in COVID-19 spread, and vice versa. The range of confirmed cases encountered when the temperature is less than 30oC and the relative humidity is higher than 70% shows that there is an environmental impact on the number of COVID-19 cases [27,28].
This study analyzed confirmed cases of COVID-19 using the classification model. Two class labels were used to classify the data: 1 for confirmed COVID-19 cases and 0 for non-COVID-19 cases. If the relative humidity is high (>70%) and the average temperature is less than or equal to 30°C, the data is labelled 1, indicating COVID-19 confirmed cases. However, if the relative humidity is less than or equal to 70% and the average temperature is greater than 30°C, they are labelled class 0 to indicate non-COVID-19 cases.
The DS4Cdataset was prepared in a suitable format before starting the experiments. The pre-processing included the following steps:
1. Data Collection (The DS4C COVID Dataset).
2. Data Cleansing (‘Training’ 3,99,021, ‘Testing’ 2,16,029):
3. Missing data handling.
4. Removing or estimating missing values in the data.
5. Database balancing.
6. Correcting imbalances in the target field.
Removing duplicate records.
Data Pre-processing (‘Training’ 399,021, ‘Testing’ 216,029):
a) Data entry.
b) Converting data from ‘type’ to ‘others’ (single-valued attributes).
The development of classification models including the Convolution Neural Network (CNN), ADtree, and BayesNet, using 39,858 train and 21,468 test dataset.
Interpretation and Analysis: Algorithm performance was measured using the accuracy metric.
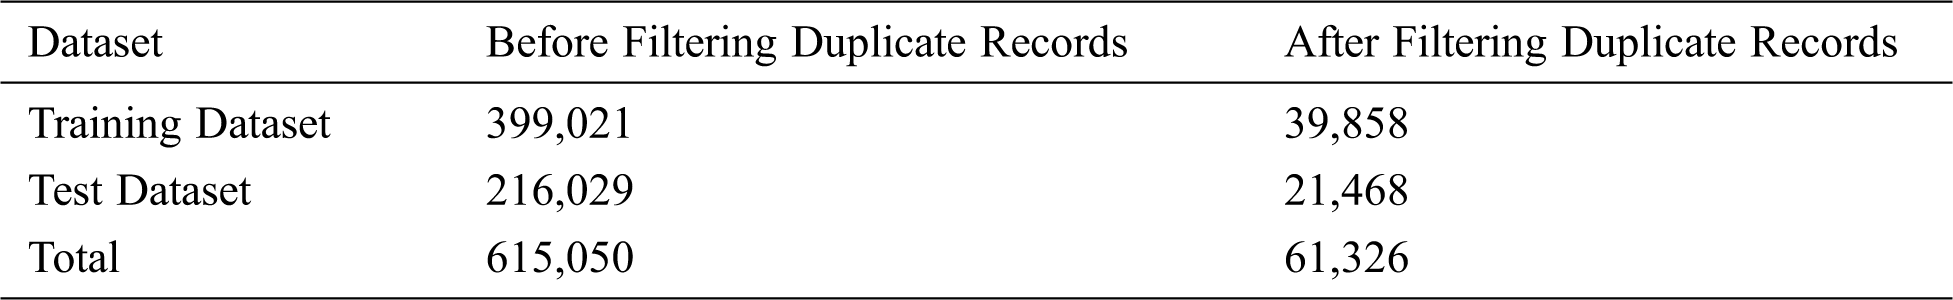
A total of 399,021 DS4C COVID-19 record was analyzed. The training dataset consisted of 10% of the dataset: 39,858 documents. Meanwhile, after filtering out duplicate records, a total of 21,468 records were given as the test-set on which the machine learning models were applied. The details of data filtering process are described in Tab. 3.
Table 3: Before and after filtering DS4C dataset
Detailed description of the pre-processing operation dataset is shown in Fig. 2.

Figure 2: Pre-processing of the DS4C COVID-19 dataset
The feature extraction was carried out using the PCA method. The PCA feature extraction techniques generate new features comprising a linear combination of initial features. These techniques are directed towards the maximum variance of the dataset, excluding the variance which has been already counted. The components generated from the PCA wrap exclude the maximum variance, and each component takes a lesser value than the initial values.
PCA is the most important and prominent feature extraction technique in machine learning. Its sensitivity reduces the dimension and record duplication in a specific layer of a selected feature [29].
The selected feature and processed form of data classification were carried out using deep learning, BayesNet and random tree techniques.
3.3.1 Convolution Neural Network Classification
The deep learning classification is part of the machine learning algorithm using neural network and representation learning. Deep learning architecture is implemented using deep neural networks, such as Convolution Neural Network and Recurrent Neural Network for large databases. These deep neural networks perform better than simple neural networks. They have multiple layers which show linear perception. Convolution Neural Network (CNN) is one of the classification algorithms used for deep learning group. The CNN uses a feed-forward artificial neural network.
Recently, the deep learning approach was used for prediction-based research in medical sciences. The classification, prediction and recognition were carried out using text and observation-based research. The deep learning method was used for the prediction and classification of COVID-19 patients’ analysis. The outcome of COVID-19 research is utilized in saving thousands of lives and producing massive data that can be used for machine learning model training. Deep learning is used for an accurate prediction of COVID-19 patient. These types of diagnosis save time and are cost-effective for patients.
The author developed the COVID-Net based on the Convolution Neural Network used to diagnose COVID-19 positive cases from chest radiography images [30]. The deep learning-based algorithm was used to predict mortality risk in a person that has been infected. The research was carried out using the structured observation data of 29 COVID-19 patients. For the detection and identification of acute respiratory distress syndrome (ARDS), the research was carried out using deep learning based on the observation of numerical outcomes of COVID-19 patients [31]. The proposed system achieved 80% research accuracy. The prediction research for COVID-19 positive patients using a data sample consisting of 53 people was implemented using deep learning. Most of the prediction-based research efforts carried out on COVID-19 patients were using deep learning approaches [32]. Deep learning algorithms attempt to learn from multiple levels of representation by using a hierarchy of multiple layers. The proposed structure of the Convolution Neural Network is shown in Fig. 3.

Figure 3: Structure of deep learning algorithm for convolution network
The model uses multiple layers which gradually extract higher-level features from the raw input [33].
The BayesNet classification works on the basis of Bayes theorem. This network is generated using the conditional probability of each node as a directed acyclic graph. In this technique, attributes are nominal, and no missing value parameter is used as they are replaced globally. The output of this classification algorithm can be represented by a graph [34]. The graphical representation of BayesNet classification for the proposed system is shown in Fig. 4.

Figure 4: The architecture of BayesNet
De Freitas Barbosa et al. used the Bayes Network for COVID-19 diagnostic blood testing. The performance evaluation was extracted using precision and specificity. The precision and the specificity of the proposed research were 0.938 and 0.936, respectively. The Bayes Network had been proven as the best classifier based on low computational cost [35]. Many infections and respiratory symptoms were treated, and the BayesNet was used alongside an X-ray image dataset to diagnose COVID-19. The precision of the classification was 89.78%. The proposed classifier-based system is fast, robust and cost-effective [36].
The alternating decision trees (ADtree) classification technique provides a mechanism for combining weak hypotheses generated during boosting into a single interpretable representation. To implement this technique, inequality conditions that compare a single feature with a constant were generated during each boosting iteration. In the omission, the conditions for this algorithm are difficult to implement. This approach offers an exciting decision tree by applying an improved logistic algorithm. The network is generated on the basis of average value of cases [37]. The architecture of ADTree for the proposed research is shown in Fig. 5.

Figure 5: The architecture of ADtree for the proposed research
The tree-based classification is a prominent approach in medical sciences. ADtree, a decision tree, achieve higher accuracy than NbTree, Random Forest and REPTree. The researcher used the prediction and classification approach of the ADtree to identify COVID-19 positive cases in various structured datasets. This classifier approach is superior in terms of speed and accuracy [38]. The study found that the ADtree is the best model for classifying positive, death and recovered cases using the COVID-19 DS4C dataset. The classification achieved 89.90% accuracy.
3.4 Performance Measurement Terms
This research experimented three classifiers based on deep learning-based Convolution Neural Network, BayesNet and ADtree methodologies. The performance evaluation was carried based on accuracy [39]. Accuracy is used to measure performance based on correctly classified instances in the dataset. It provides the percentage of true prediction with respect to total prediction. It can be calculated using True Positive (TP), False Positive (FP), False Negative (FN) and True Negative (TN) as shown in Eq. (1):
This research involves the experimental analysis—data pre-processing and cleansing, feature extraction and classification—of the DS4C COVID-19 dataset. The data pre-processing was carried out using numeric cleaning, missing values and repetitive value estimation, and missing value replacement to eliminate the outliers in the data. The experiment was tested on series .csv data form. The feature extraction was carried out to reduce instances and feature selection using principal component analysis (PCA) techniques. For the feature extraction, the PCA with the ranker search method was used. PCA techniques were employed to identify significant features from the dataset before running the classification models. A total of 61,326 instances were searched using 10 features. The features selected have 0.95 degrees of freedom from the variance. The ranked features using PCA techniques are described in Tab. 4.
Table 4: The detail of selected features using PCA
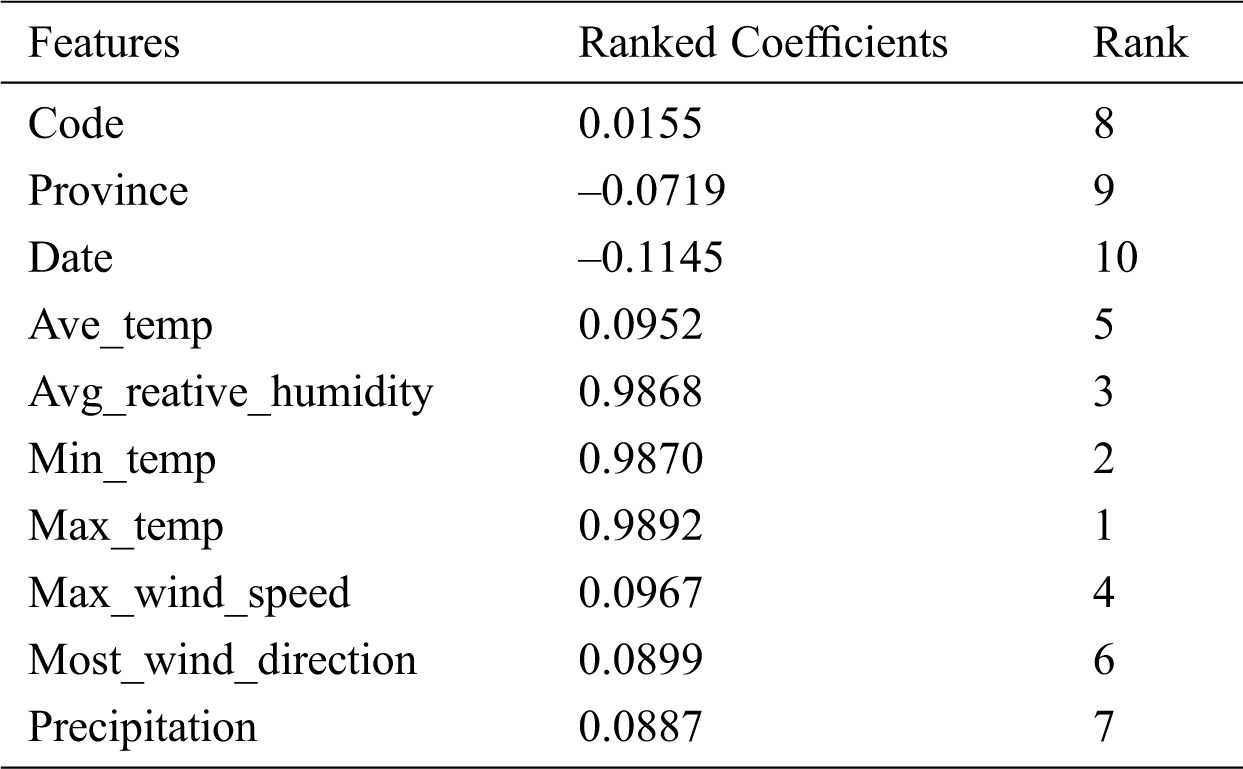
According to the PCA, the significant features were Max_temp, Min_temp, Avg_reative_humidity, Max_wind_speed, Ave_temp, Most_wind_direction and Precipitation, with a score of 0.9892, 0.987, 0.9868, 0.0967, 0.0952, 0.0899 and 0.0887, respectively. The lowest ranked features were Code, Province and Date with scores of 0.0155, –0.0719, and –0.1145, respectively. Three features which are Code, Province and Date were removed, while the remaining seven were selected for testing using the classification models.
After identifying the significant features, three different classification models are evaluated which are Convolution Neural Network (CNN), ADtree Classifier and BayesNet. The performance of these models are calculated using accuracy metrics.
A parameter-tuning experiment was conducted to determine the best parameters of several available options [40,41].
4.1.1 Convolution Neural Network Classification
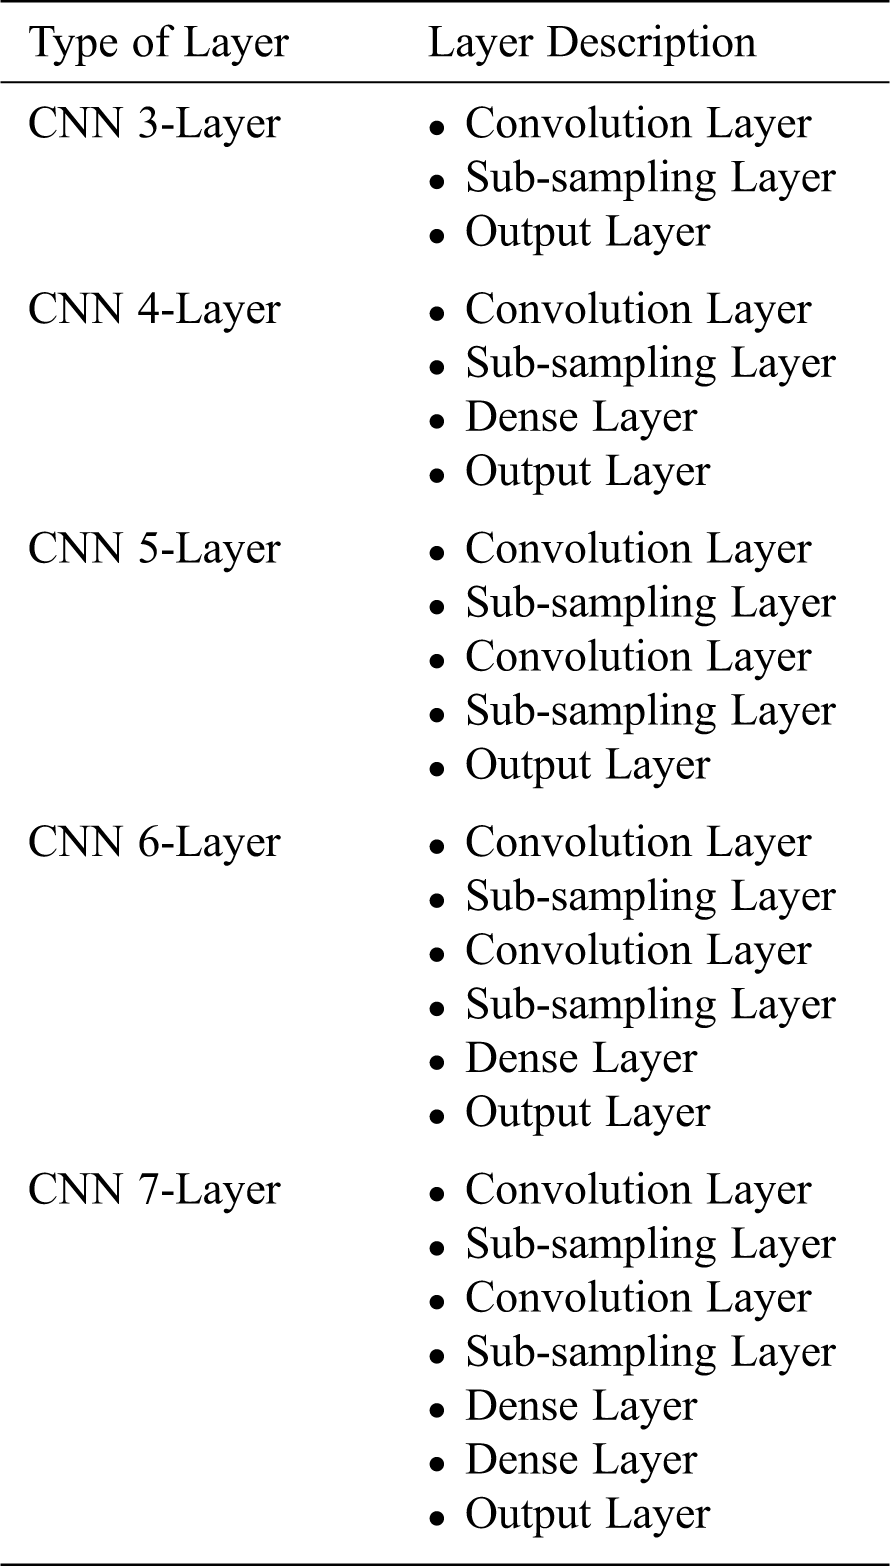
A CNN architecture is formed by a stack of distinct layers that transform the input into output through a differentiable function. A few different layers are commonly used, including the convolution layer, sub-sampling layer, dense layer, and output layer. Tab. 5 shows the parameter setup of the CNN.
Table 5: CNN layers and its description
The performance of CNN is calculated based on the type of layer. The comparative parameter setup based on CNN layer is described in Tab. 6.
Table 6: The accuracy of Convolution Neural Network with tuning parameter

From the above table, it is observed that CNN layer 5 has the highest accuracy percentage of 99.56; meanwhile, the minimum accuracy is achieved in CNN layer 3. By defining suitable layers for each dataset, the accuracy is observed to increase. This is because CNN architecture allows more training instances inside the hidden layers, including the Convolutional Layer, Dense Layer and Sub-sampling layer. In conclusion, it is proven that using the right CNN layer for parameter tuning can give an optimum and the best result.
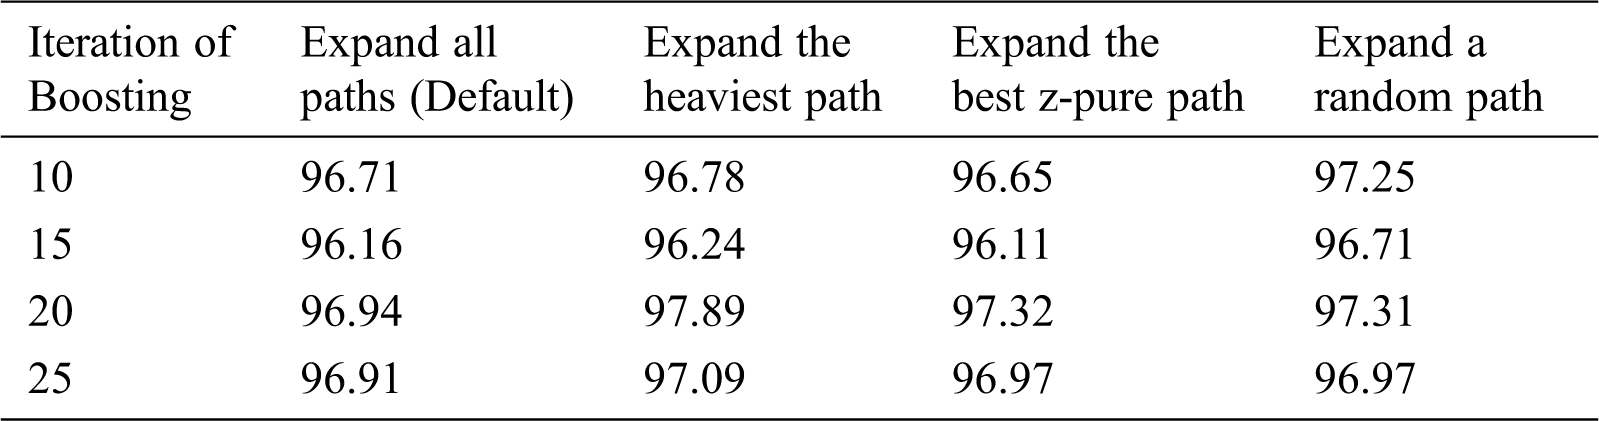
The performance of the classifier is impacted by tuning parameter. The classifier was tested using different tuning parameters. The ADtree classifier was tested for 10, 15, 20 and 25 boosting iterations. The Tab. 7. shows that the best performance was obtained when using 20 boosting iterations and expanding the heaviest path search method. The comparative performance of ADtree classification is described in Tab. 7.
Table 7: The accuracy of ADtree for turning parameter
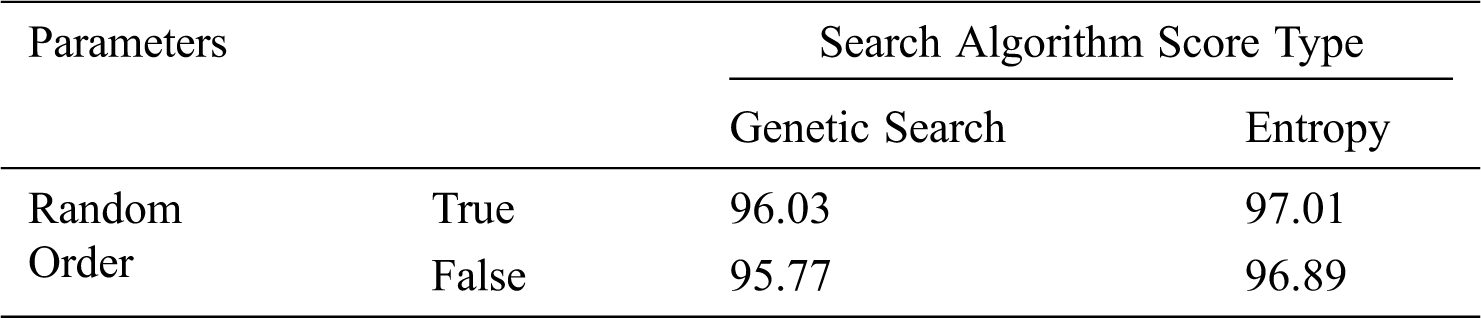
The BayseNet classification was performed by searching algorithm,score type and logical values of random order as the tuning parameters. The comparative performance of the BayseNet classification based on search type and random order values is shown in Tab. 8. For the preparation and testing model in machine learning, the cost function is utilized to assess the given dataset presentation. This function computes the error between the predicted and expected values. The cost work is utilized to minimize the mistakes in preparing and testing. For the extraction of cost work, different separation measures were utilized. For this study, entropy is used as the cost function in the BayesNet classification. The BayseNet uses entropy measure to select the most informative variables without setting a threshold level and to maximize the posterior probabilities. The results show that the most efficient performance is found where the Random Order is True, the Search Algorithm is Genetic Search, and the Score Type is Entropy. Genetic search is used to find a well-scoring Bayes Network structure. It works by having a Bayes Network structure population and allowing them to mutate and apply cross over to get offspring. From here, the best network structure was found to obtain a 97.01% of performance level.
Table 8: Performance of BayesNet classifier with a tuning parameter
4.2 Parameterization of the Classification Models
The CNN, ADtree and BayesNet classification models have been described in general in the previous section. On the basis of CNN experiments, all results presented here were obtained with a CNN layer 5.
For the ADtree, all results presented in the Section 4.3 were obtained with the following parameters, where the value of used parameter is listed in brackets: Iteration of Boosting (20); the type of search to perform when building the tree (expands the heaviest path, whereby it searches the path with the most weighted instances).
Based on the BayesNet experiments, all results described in the Section 4.3 were obtained with the following parameters setup, where the chosen parameter’s value is listed in brackets: Random Order (20); Search Algorithm (Genetic Search); Score Type (Entropy).
4.3 The Performance Evaluation of Different Classifier
The experimental analysis was carried out using CNN, ADtree and BayseNet classifier. Each classifier achieves good performance with the parameter tuning procedure. The classification models were validated using 70% train and 30% test dataset. It is a common practice to split the data into 70% as training and 30% as testing set [42].
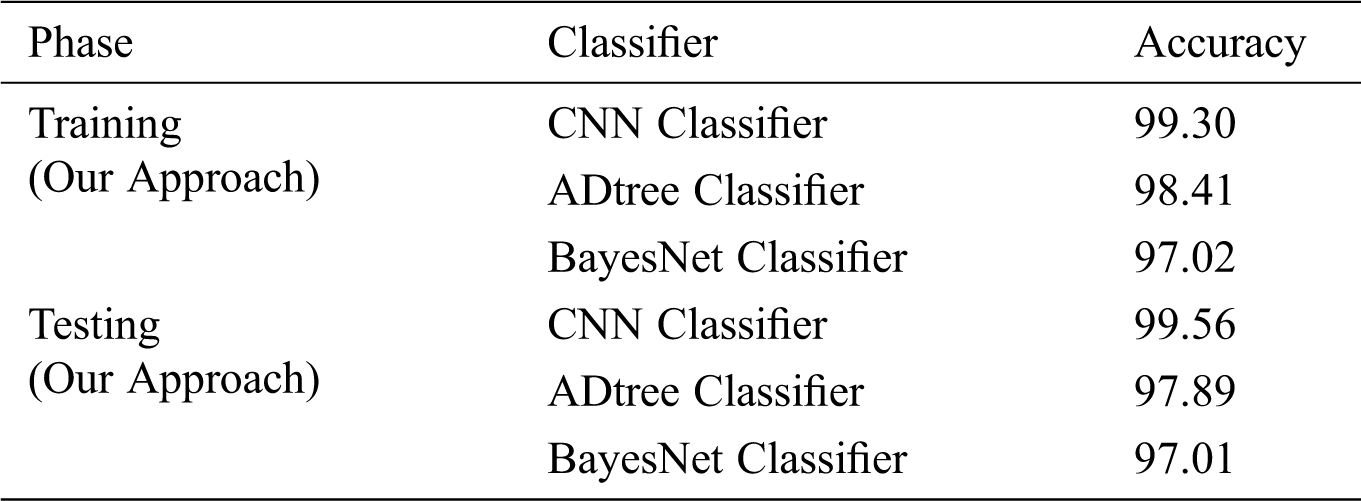
The experiment was tested for training and testing classification towards the performance evaluation. The comparative performance for training and testing phase implemented using a Convolution Neural Network, ADtree and BayseNet and classified based on accuracy, is calculated and shown in Tab. 9.
Table 9: Comparative performance of the implemented classifier
The comparison of the testing performance of our proposed research classifier approach with respect to the results of other classifier based on DS4C COVID-19 dataset is shown in Tab. 10.
Table 10: Comparative results of testing performance of our experiment with previous work
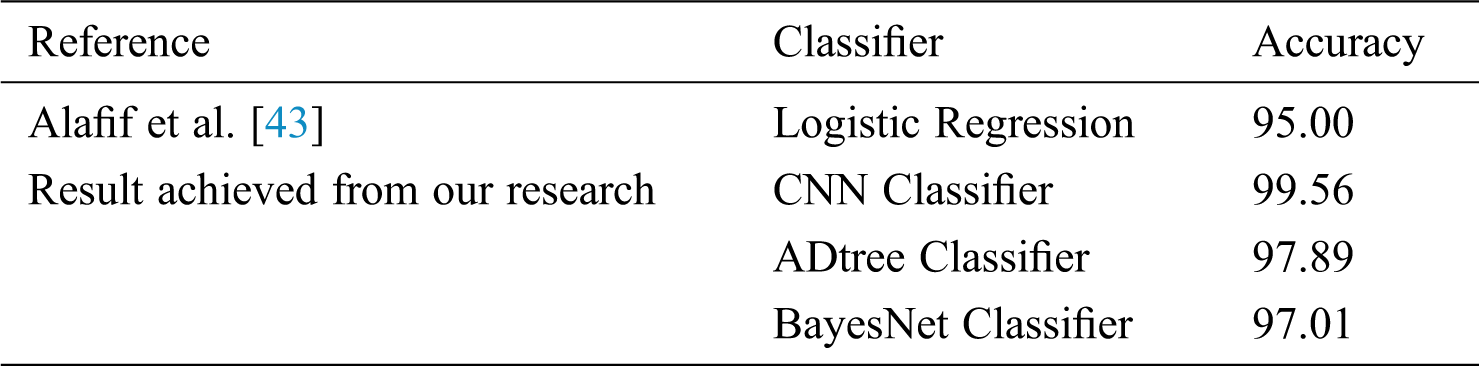
Tab. 10 shows the results achieved from the CNN classifier in our research is 99.56% accurate. This indicates that the CNN outperformed the other models.
This study provides a comparison of performance between three classification methods: Convolution Neural Network (CNN), ADtree and BayesNet techniques in classifying B40 households using the DS4C COVID dataset. The classification accuracy of these three methods is compared to each other. Prior to performance comparison, several pre-processing techniques such as data cleaning, feature selection, and parameter tuning were conducted. The data pre-processing was carried out to remove the missing and outlier values of the dataset. The feature selection and extraction were carried out using the principal component analysis (PCA) with Ranker search method. Using PCA with the Ranker search method, the ten features are ranked based on the Ranked Coefficients. We removed the lowest four features (i.e., Code, Province and Date) and the remaining significant seven features were selected (i.e., Max_temp, Min_temp, Avg_reative_humidity, Max_wind_speed, Ave_temp, Most_wind_direction and Precipitation) for further classification. After obtaining optimal values of each classifier, a series of experiments was carried out using 70% of the training set and 30% of the test. The comparative analysis of the Convolution Neural Network, ADtree and BayesNet classification were carried out using accuracy measures. The experimental results show that the Convolution Neural Network achieved the highest accuracy at 99.56%. The second highest accuracy was achieved by ADtree classification approach at 97.89 %. The BayesNet classifier achieved the lowest accuracy at 97.01%. The Convolution Neural Network has been proven to be the superior classification algorithm for the DS4C COVID-19 dataset analysis as compared to ADtree and BayesNet classifications based on weather variables. Hence, we can conclude that COVID-19 classification with seven weather variables (i.e., Max_temp, Min_temp, Avg_reative_humidity, Max_wind_speed, Ave_temp, Most_wind_direction and Precipitation) will perform better if CNN is used instead of ADtree and BayesNet.
Future work can be conducted by leveraging other factors such as policies, herd immunity, population density, migration patterns, and other aspects that might directly influence how the spread of the COVID-19 disease occurs. Thus, the development of machine learning models based on weather conditions associated with health policies is a knowledge of great value for the benefit of mankind in this critical period.
Funding Statement: This publication was supported by the Universiti Kebangsaan Malaysia (UKM) and Ministry of Education, Malaysia (MOE) under the Research University Grant (project code: FRGS/1/2018/ICT02/UKM/02/6 and GUP-2019-060).
Conflicts of Interest: The authors declare that they have no conflicts of interest to report regarding the present study.
1. Z. A. Othman, A. A. Bakar, N. S. Sani and J. Sallim. (2020). “Household overspending model amongst B40, M40 and T20 using classification algorithm,” International Journal of Advanced Computer Science and Applications, vol. 11, no. 7, pp. 392–399. [Google Scholar]
2. A. A. Bakar, R. Hamdan and N. S. Sani. (2020). “Ensemble learning for multidimensional poverty classification,” Sains Malaysiana, vol. 49, no. 2, pp. 447–459. [Google Scholar]
3. N. S. Sani, S. Sahran, A. H. Abd Rahman and E. N. Muzaffar. (2018). “Redefining selection of features and classification algorithms for room occupancy detection,” International Journal on Advanced Science, Engineering and Information Technology, vol. 8, no. 4–2, pp. 1486–1493. [Google Scholar]
4. J. D. Holliday, N. S. Sani and P. Willett. (2015). “Calculation of substructural analysis weights using a genetic algorithm,” Journal of Chemical Information and Modeling, vol. 55, no. 2, pp. 214–221. [Google Scholar]
5. J. Holliday, N. Sani and P. Willett. (2018). “Ligand-based virtual screening using a genetic algorithm with data fusion,” MATCH: Communications in Mathematical and in Computer Chemistry, vol. 80, no. 3, pp. 623–638. [Google Scholar]
6. S. Shabudin, N. S. Sani, K. A. Z. Ariffin and M. Aliff. (2020). “Feature selection for phishing website classification,” International Journal of Advanced Computer Science and Applications, vol. 11, no. 4, pp. 587–595. [Google Scholar]
7. T. K. M. Zali, N. S. Sani, A. H. Abd Rahman and M. Aliff. (2019). “Attractiveness analysis of quiz games,” International Journal of Advanced Computer Science and Applications, vol. 10, no. 8, pp. 205–210. [Google Scholar]
8. M. Mittal, R. K. Sharma and V. P. Singh. (2015). “Modified single pass clustering with variable threshold approach,” International Journal of Innovative Computing Information and Control, vol. 11, no. 1, pp. 375–386. [Google Scholar]
9. M. Mittal, R. K. Sharma, V. P. Singh and R. Kumar. (2019). “Adaptive threshold based clustering: A deterministic partitioning approach,” International Journal of Information System Modeling and Design (IJISMD), vol. 10, no. 1, pp. 42–59. [Google Scholar]
10. M. A. Mohammed, K. H. Abdulkareem, S. A. Mostafa, M. K. A. Ghani, M. S. Maashi et al. (2020). , “Voice pathology detection and classification using convolutional neural network model,” Applied Sciences, vol. 10, no. 11, pp. 3723. [Google Scholar]
11. K. H. Abdulkareem, M. A. Mohammed, S. S. Gunasekaran, M. N. Al-Mhiqani, A. A. Mutlag et al. (2019). , “A review of Fog computing and machine learning: Concepts, applications, challenges, and open issues,” IEEE Access, vol. 7, pp. 153123–153140. [Google Scholar]
12. S. Lalmuanawma, J. Hussain and L. Chhakchhuak. (2020). “Applications of machine learning and artificial intelligence for Covid-19 (SARS-CoV-2) pandemic: A review,” Chaos Solitons & Fractals: Nonlinear Science, and Nonequilibrium and Complex Phenomena, vol. 139, no. 110059, pp. 1–6. [Google Scholar]
13. H. I. Fawaz, G. Forestier, J. Weber, L. Idoumghar and P. A. Muller. (2019). “Deep learning for time series classification: A review,” Data Mining and Knowledge Discovery, vol. 33, no. 4, pp. 917–963. [Google Scholar]
14. C. C. Lai, T. P. Shih, W. C. Ko, H. J. Tang and P. R. Hsueh. (2020). “Severe acute respiratory syndrome coronavirus 2 (SARS-CoV-2) and corona virus disease-2019 (COVID-19The epidemic and the challenges,” International Journal of Antimicrobial Agents, vol. 55, no. 105924, pp. 1–9. [Google Scholar]
15. D. S. W. Ting, L. Carin, V. Dzau and T. Y. Wong. (2020). “Digital technology and COVID-19,” Nature Medicine, vol. 26, no. 4, pp. 459–461. [Google Scholar]
16. M. A. Mohammed, K. H. Abdulkareem, A. S. Al-Waisy, S. A. Mostafa, S. Al-Fahdawi et al. (2020). , “Benchmarking methodology for selection of optimal COVID-19 diagnostic model based on entropy and TOPSIS methods,” IEEE Access, vol. 1, no. 1, pp. 1–17. [Google Scholar]
17. J. K. Sethi and M. Mittal. (2020). “Monitoring the impact of air quality on the COVID-19 fatalities in Delhi, India: Using machine learning techniques,” Disaster Medicine and Public Health Preparedness, vol. 22, pp. 1–8. [Google Scholar]
18. S. Chawla, M. Mittal, M. Chawla and L. M. Goyal. (2020). “Corona Virus-SARS-CoV-2: An insight to another way of natural disaster,” EAI Endorsed Transactions on Pervasive Health and Technology, vol. 6, no. 22, pp. 164823. [Google Scholar]
19. D. Benvenuto, M. Giovanetti, L. Vassallo, S. Angeletti and M. Ciccozzi. (2020). “Application of the ARIMA model on the COVID-2019 epidemic dataset,” Data in Brief, vol. 29, pp. 105340. [Google Scholar]
20. M. J. Horry, S. Chakraborty, M. Paul, A. Ulhaq, B. Pradhan et al. (2020). , “COVID-19 detection through transfer learning using multimodal imaging data,” IEEE Access, vol. 8, pp. 149808–149824. [Google Scholar]
21. H. F. Bahmad and W. Abou-Kheir. (2020). “Crosstalk between COVID-19 and prostate cancer,” Prostate Cancer and Prostatic Diseases, vol. 23, no. 4, pp. 561–563. [Google Scholar]
22. A. S. Al-Waisy, S. Al-Fahdawi, M. A. Mohammed, K. H. Abdulkareem, S. Mostafa et al. (2020). , “COVID-CheXNet: Hybrid deep learning framework for identifying COVID-19 virus in chest X-rays images,” Soft Computing, pp. 1–16. [Google Scholar]
23. I. Ahmed, A. Azhar, N. Eltaweel and B. K. Tan. (2020). “First Covid-19 maternal mortality in the UK associated with thrombotic complications,” British Journal of Haematology, vol. 190, pp. e37–e38. [Google Scholar]
24. S. K. Dey, M. M. Rahman, U. R. Siddiqi and A. Howlader. (2020). “Analyzing the epidemiological outbreak of COVID-19: A visual exploratory data analysis approach,” Journal of Medical Virology, vol. 92, no. 6, pp. 632–638. [Google Scholar]
25. P. Mecenas, R. Bastos, A. Vallinoto and D. Normando. (2020). “Effects of temperature and humidity on the spread of COVID-19: A systematic review,” PLoS One, vol. 15, no. 9, pp. e0238339. [Google Scholar]
26. Z. Malki, E. S. Atlam, A. E. Hassanien, G. Dagnew, M. A. Elhosseini et al. (2020). , “Association between weather data and COVID-19 pandemic predicting mortality rate: Machine learning approaches,” Chaos, Solitons & Fractals, vol. 138, no. 10223, pp. 110137. [Google Scholar]
27. J. E. Park, W. S. Son, Y. Ryu, S. B. Choi, O. Kwon et al. (2019). , “Effects of temperature, humidity, and diurnal temperature range on influenza incidence in a temperate region,” Influenza and Other Respiratory Viruses, vol. 14, no. 1, pp. 11–18. [Google Scholar]
28. S. Yuan, S. Jiang and Z. L. Li. (2020). “Do humidity and temperature impact the spread of the novel coronavirus?,” Frontiers in Public Health, vol. 8, pp. 138513. [Google Scholar]
29. S. Lang, F. Bravo-Marquez, C. Beckham, M. Hall and E. Frank. (2019). “Wekadeeplearning4j: A deep learning package for weka based on deeplearning4j,” Knowledge-Based Systems, vol. 178, pp. 48–50. [Google Scholar]
30. L. Wang, Z. Q. Lin and A. Wong. (2020). “Covid-net: A tailored deep convolutional neural network design for detection of covid-19 cases from chest x-ray images,” Scientific Reports, vol. 10, no. 1, pp. 1–12. [Google Scholar]
31. L. Wynants, B. Van Calster, G. S. Collins, R. D. Riley, G. Heinze et al. (2020). , “Prediction models for diagnosis and prognosis of covid-19 infection: Systematic review and critical appraisal,” BMJ, vol. 369, no. m1328, pp. 1. [Google Scholar]
32. S. D. Khan, L. Alarabi and S. Basalamah. (2020). “Toward smart lockdown: A novel approach for COVID-19 hotspots prediction using a deep hybrid neural network,” Computers, vol. 9, no. 4, pp. 99. [Google Scholar]
33. M. Norouzi, A. Souri and M. S. Zamini. (2016). “A data mining classification approach for behavioral malware detection,” Journal of Computer Networks and Communications, vol. 2016, no. 2, pp. 1–9. [Google Scholar]
34. A. Nakra and M. Duhan. (2019). “Comparative analysis of bayes net classifier, naive bayes classifier and combination of both classifiers using WEKA,” International Journal of Information Technology and Computer Science, vol. 11, no. 3, pp. 38–45. [Google Scholar]
35. V. A. de Freitas Barbosa, J. C. Gomes, M. A. de Santana, J. E. de Almeida Albuquerque, R. G. de Souza et al. (2020). , “Heg. IA: An intelligent system to support diagnosis of Covid-19 based on blood tests,” medRxiv. [Google Scholar]
36. J. C. Gomes, V. A. de Freitas Barbosa, M. A. de Santana, J. Bandeira, M. J. S. Valenca et al. (2020). , “IKONOS: An intelligent tool to support diagnosis of Covid-19 by texture analysis of x-ray images,” medRxiv. [Google Scholar]
37. G. H. Al-Rawashdeh and R. B. Mamat. (2019). “Comparison of four email classification algorithms using WEKA,” International Journal of Computer Science and Information Security (IJCSIS), vol. 17, no. 2, pp. 42–54. [Google Scholar]
38. S. Lal, N. Sardana and A. Sureka. (2019). “Three-level learning for improving cross-project logging prediction for if-blocks,” Journal of King Saud University-Computer and Information Sciences, vol. 31, no. 4, pp. 481–496. [Google Scholar]
39. J. Zhang, J. Shao, Z. Ren, J. Yu, X. Li et al. (2020). , “A high-accuracy calibration method using sensor sensitivity difference for piezoelectric dynamometer,” Journal of Dynamic Systems, Measurement, and Control, vol. 142, no. 1, pp. 817. [Google Scholar]
40. N. S. Sani, A. H. Abd Rahman, A. Adam, I. Shlash and M. Aliff. (2020). “Ensemble learning for rainfall prediction,” International Journal of Advanced Computer Science and Applications, vol. 11, no. 11, pp. 153–162. [Google Scholar]
41. N. S. Sani, A. F. M. Nafuri, Z. A. Othman, M. Z. A. Nazri and K. N. Mohamad. (2020). “Drop-out prediction in higher education among B40 students,” International Journal of Advanced Computer Science and Applications, vol. 11, no. 11, pp. 550–559. [Google Scholar]
42. H. Liu and M. Cocea. (2017). “Semi-random partitioning of data into training and test sets in granular computing context,” Granular Computing, vol. 2, no. 4, pp. 357–386. [Google Scholar]
43. T. Alafif, R. Alotaibi, A. Albassam and A. Almudhayyani. (2020). “On the prediction of isolation, release, and decease for COVID-19 patients: A case study in South Korea,” ISA Transactions, pp. 1–13. [Google Scholar]
 | This work is licensed under a Creative Commons Attribution 4.0 International License, which permits unrestricted use, distribution, and reproduction in any medium, provided the original work is properly cited. |