DOI:10.32604/iasc.2021.016516
| Intelligent Automation & Soft Computing DOI:10.32604/iasc.2021.016516 | |
| Article |
Non-contact Real-time Monitoring of Driver’s Physiological Parameters under Ambient Light Condition
1Beijing Key Laboratory of Urban Rod Traffic Intelligent Control Technology, North China University of Technology, Beijing, 100144, China
2College of Sciences, North China University of Technology, Beijing, 100144, China
3Department of Mathematical Sciences, Middle Tennessee State University Murfreesboro, TN, 37132, USA
*Corresponding Author: Jiancheng Zou. Email: zjc@ncut.edu.cn
Received: 04 January 2021; Accepted: 06 March 2021
Abstract: Real-time and effective monitoring of a driver’s physiological parameters and psychological states can provide early warnings and help avoid traffic accidents. In this paper, we propose a non-contact real-time monitoring algorithm for physiological parameters of drivers under ambient light conditions. First, video sequences of the driver’s head are obtained by an ordinary USB camera and the AdaBoost algorithm is used to locate the driver’s facial region. Second, a face expression recognition algorithm based on an improved convolutional neural network (CNN) is proposed to recognize the driver’s facial expression. The forehead region is divided into three RGB channels as the region of interest (ROI), and the ICA algorithm is used to separate the ROI into three independent components. After that, the most significant component is selected for calculation of the heart rate and respiratory rate of the driver. Comparing the experimental results with the indications of finger clip devices, the proposed algorithm can monitor a driver’s physiological parameters in real time in a non-contact way that will not interfere with normal driving. The results of facial expression recognition can help verify the monitoring results of physiological parameters, and therefore, more accurately evaluate drivers’ physical condition.
Keywords: Non-contact monitoring; ICA; heart rate; respiratory rate; convolution neural network
While the transportation industry facilitates economic development, it also brings great challenges to personal safety. The number of traffic accidents has increased greatly, with both human and economic losses: in 2019, there were nearly 200,000 traffic accidents in China, resulting in 52,388 deaths, 275,125 injuries, and 160 million dollars of direct property losses. Although the number of accidents decreased by 18.3% in 2019, the number of casualties is still substantial [1]. The occurrence of traffic accidents may result from a combination of multiple factors, including human, vehicle, environment and weather, and road factors [2]. In particular, the driver’s condition might be the direct cause of a traffic accident.
Real-time and effective monitoring of a driver’s physical and mental states can effectively reduce the probability of traffic accidents [3]. Figures show that heart rate, heart rate variability and respiratory rate are important physiological parameters for monitoring cardiovascular and cerebrovascular diseases [4]. It can also be of great significance to incorporate expression recognition and analysis to evaluate driver’s physical conditions. Through the recognition of driver’s emotions, and with the monitoring results of physiological parameters, the driver’s physical states can be more accurately evaluated.
At present, ECG [5] monitoring is mainly used to accurately detect physiological data in a clinical setting. Common medical detection equipment includes electronic blood pressure pulse meters and finger clip pulse oximeters. However, such medical detection equipment requires direct contact with the skin for measurement. Additionally, the connecting wire may affect the comfort level of the testers and is not suitable for mobile detection. Some types of equipment are complex and need to be operated by professional medical staff. As such, they are not suitable for daily rapid detection. Furthermore, people may become nervous if they are equipped with instruments, affecting the accuracy of the measurement results [6]. There is an obvious demand for a scheme that can accurately, conveniently and quickly detect physiological parameters such as heart rate and blood oxygen saturation. Therefore, the technology of non-contact inspection of physiological parameters has attracted the attention of researchers.
In 2000, Wu et al. [6] improved the technology of contact photoplethysmography (PPG) and proposed non-contact imaging photoplethysmography (IPPG). With imaging equipment, IPPG can collect the reflected light of the tested body part and obtain changes in blood volume from the changes of reflected light. Using this data, IPPG can then be used to analyze physiological parameters such as heart rate, respiratory rate, and blood oxygen saturation. IPPG equipment is contactless, low-cost, and simple to operate, which has quickly attracted attention in research and practical applications.
At present, only a few research institutions in China have used imaging technology to detect non-contact physiological signals. Since 2012, Sun et al. [7] at Shanghai Jiaotong University, jointly with Loughborough University in the UK, have been studying non-contact physiological signal measurement based on IPPG to obtain measurements of heart rate, respiratory rate, and heart rate variability. In 2012, Liu et al. of Tianjin University started research on non-contact heart rate measurement [8,9], and set up a heart rate measurement system. Later, Shandong University [10] and Beijing University of Science and Technology [11] also carried out studies on the detection of physiological parameters based on videos.
In this paper, a non-contact real-time monitoring algorithm is proposed for examining driver’s physiological parameters under ambient light conditions. This algorithm can be combined with non-contact real-time physiological parameter monitoring techniques and deep learning algorithms for facial expression recognition in the evaluation of driver’s physical conditions. The remainder of the paper is organized as follows: In Section 2, a brief introduction is made of the related previous research; in Section 3, the new model is proposed with detailed descriptions; in Section 4, the experiment design and results are provided; and in the last section, a discussion is made and a conclusion is drawn.
PPG and IPPG have identical basic principles. Both of them make use of the optical characteristics of human tissues, capturing the changes of light intensity caused by changes in blood volume and analyzing thses changes to get the relevant physiological parameters. However, PPG and IPPG differ in their modes of implementation. In physiological signal measurement based on PPG, a specific light source is used to emit a certain wavelength of light, with which the physiological signals are measured. The wavelength of light penetrates the skin or is detected by the sensor after being scattered by the skin. The light needs to have a strong ability to penetrate the skin, so red or near-infrared light is generally selected as the light source. By contrast, in physiological signal measurement based on IPPG, imaging equipment is used to collect the reflected light on the skin surface. Therefore, as long as the light can reach the dermis of the skin and be absorbed and reflected by the blood, a light source that emits long wavelength light can be used, or the visible light in the environment can be directly used without an additional light source.
The basic principle of using PPG or IPPG to detect changes in blood volume is the Lamber-Beer law [11,12]. The changes in blood volume reflect the activity of the heart and blood circulation system. These changes in blood volume result in a waveform detected by PPG or IPPG, referred to as the blood volume pulse (BVP).
If the monochromatic light with wavelength and light intensity is vertically irradiated into a medium, the transmitted light intensity after passing through the medium is as shown in formula 1.
where
The absorbance A of the medium is as shown in formula 2.
Formula 2 is referred to as the Lamber-Beer law.
In 2005, Wieringa et al. [13] succeeded in extracting heart rate and blood oxygen saturation by using IPPG. They used 660 nm, 810 nm and 940 nm light sources to irradiate the arm, collected the reflected light with a camera, and analyzed the heart rate and blood oxygen saturation. In 2006, Takano et al. [14] extracted heart rate and respiratory rate data by using a black-and-white CCD camera under natural light conditions. In 2007, Humphreys et al. [15] used IPPG and selected 760 nm and 880 nm LED light source and a CMOS camera to measure the non-contact blood oxygen saturation. In several articles published by Poh et al. from 2010 to 2014, a scheme was proposed to realize heart rate measurement by using a webcam without contacting the subjects under test [16–19]. Using IPPG technology, the heart rate of the subjects was obtained after signal processing with high accuracy, simple equipment, and low cost. In addition, researchers from Loughborough University [17] in the UK and Xerox Corporation [20] in the US used IPPG to measure physiological parameters such as pulse variation signal and pulse wave transmission time.
2.2 Facial Expression Recognition Based on CNN
Compared with the traditional expression recognition method [21], the expression recognition method based on deep learning is more efficient and more robust, because the uniquely data-driven deep learning method does not have the tedious image preprocessing and feature extraction process of the traditional method, and is no longer sensitive to lighting, posture, occlusion, and other issues.
A convolutional neural network (CNN) is a special artificial neural network. Its architecture mainly includes the feature extraction layer and the feature mapping layer. Different from general artificial neural networks, a CNN has two characteristics: local connection and weight sharing. A CNN can significantly reduce the number of training parameters and improve the learning efficiency of the network. Therefore, CNNs are widely applied in many fields, especially in image processing and pattern recognition. Thus far, CNNs have adhered to a standard design criterion, that is, the way to stack the convolution layers and pooling layers [22,23], as shown in Fig. 1.
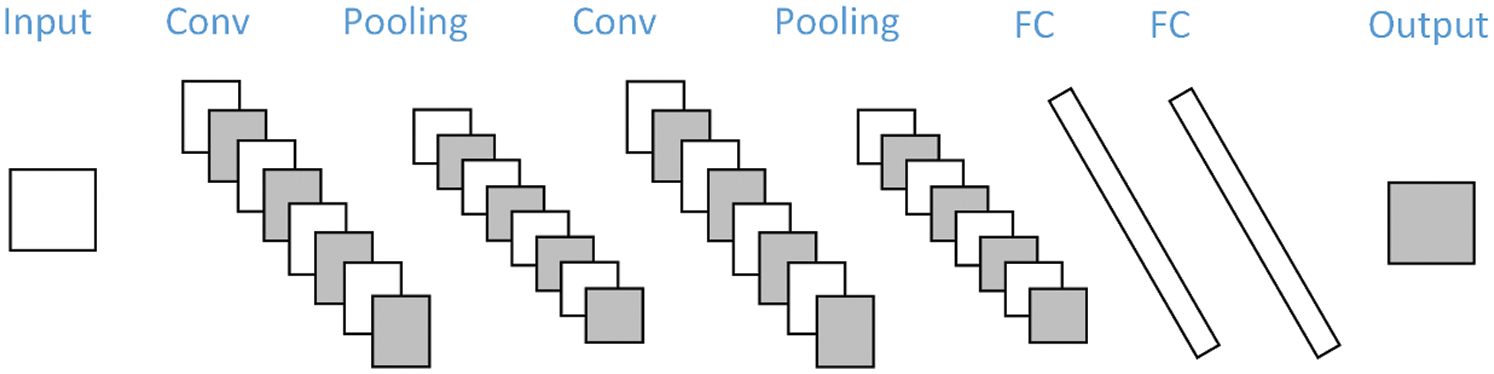
Figure 1: General architecture of the CNN model
In this paper, a real-time monitoring algorithm is proposed to examine a driver’s physiological parameters under ambient light conditions. The main flow of the proposed algorithm is shown in Fig. 2.
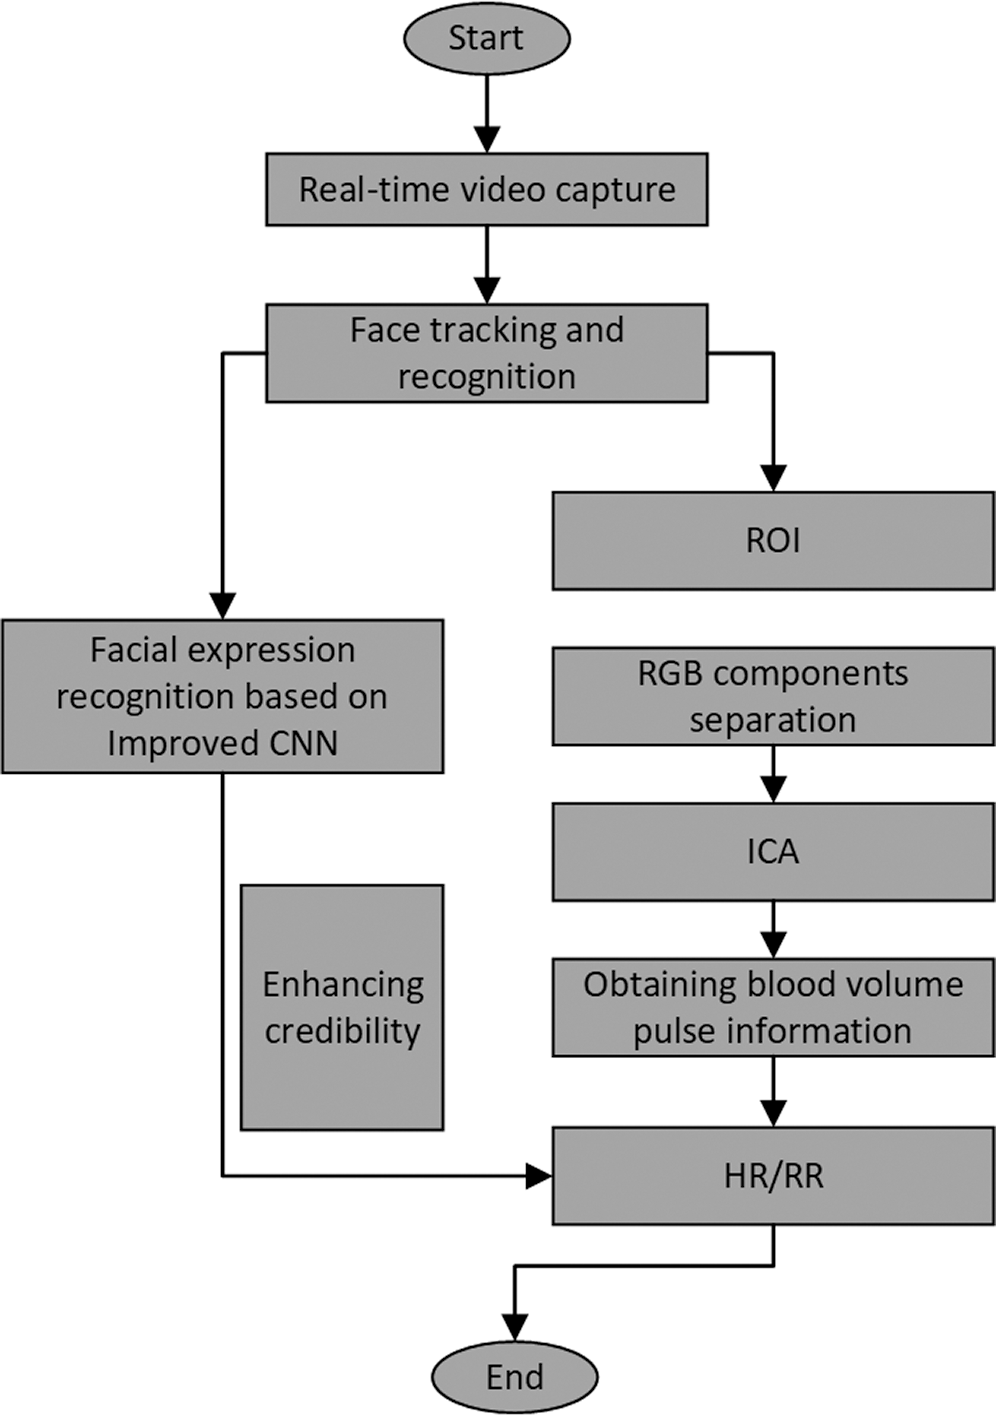
Figure 2: The main flow of the proposed algorithm
3.1 Face Tracking and ROI Selection
After the video stream is obtained in real time through an ordinary USB camera, it is necessary to determine the position of the driver’s face in the video. In this paper, the AdaBoost face detection algorithm [24,25], which is now relatively mature, is used to locate the driver’s face area. The detected face area is shown in Fig. 3a.
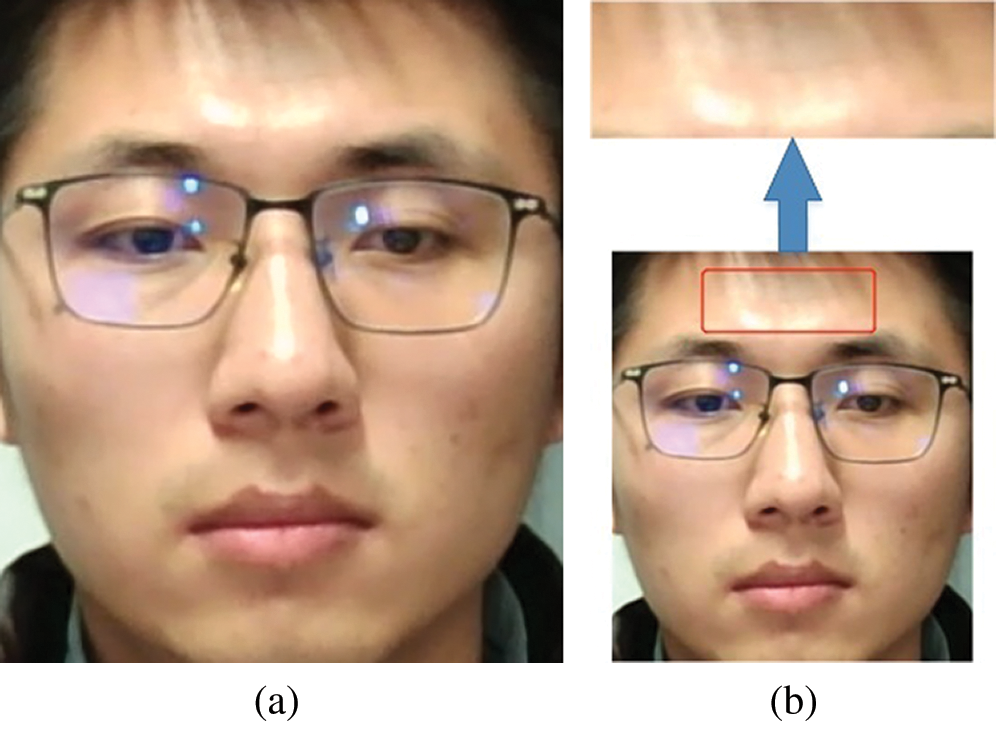
Figure 3: (a) The face tracking result (b) The ROI extracted
Verkruysse et al. [26] studied the extraction of BVP signals from different areas of the subject’s face as the ROI and compared the results. The research results of Verkruysse et al. showed that the extracted BVP is better when the rectangular area of the forehead is selected as the ROI, and it is easy to obtain the heart rate information when this ROI is transferred to the frequency domain. The frequency of unconscious eyes movements is very close to the BVP, causing great interference to BVP signals when the ROI includes the eyes. Therefore, the rectangular area of the forehead is selected as the ROI to extract BVP signals, as shown in Fig. 3b.
3.2 Facial Expression Recognition Based on Improved CNN
In this section, a CNN was used to identify driver’s expressions. The expression analysis results can be used further to verify the monitoring results of physiological parameters. If a driver is in a negative state, they may have different expressions on their face, such as pain or excitement.
In view of the low recognition rate of the classical AlexNet, an expression recognition method based on improved CNN is proposed. First, a small convolution kernel was used to extract the local features carefully. Then, two consecutive convolution layers were constructed to increase the nonlinear expression ability of the network. Finally, the batch normalization layer was added after each convolution layer to improve the speed and further enhance the feature expression ability of the network. The improved network model is comprised of three continuous convolution layers, three pooling layers, two fully connected layers and one Softmax classification layer. As shown in Fig. 4, the convolution kernel size of the first continuous convolution layer is
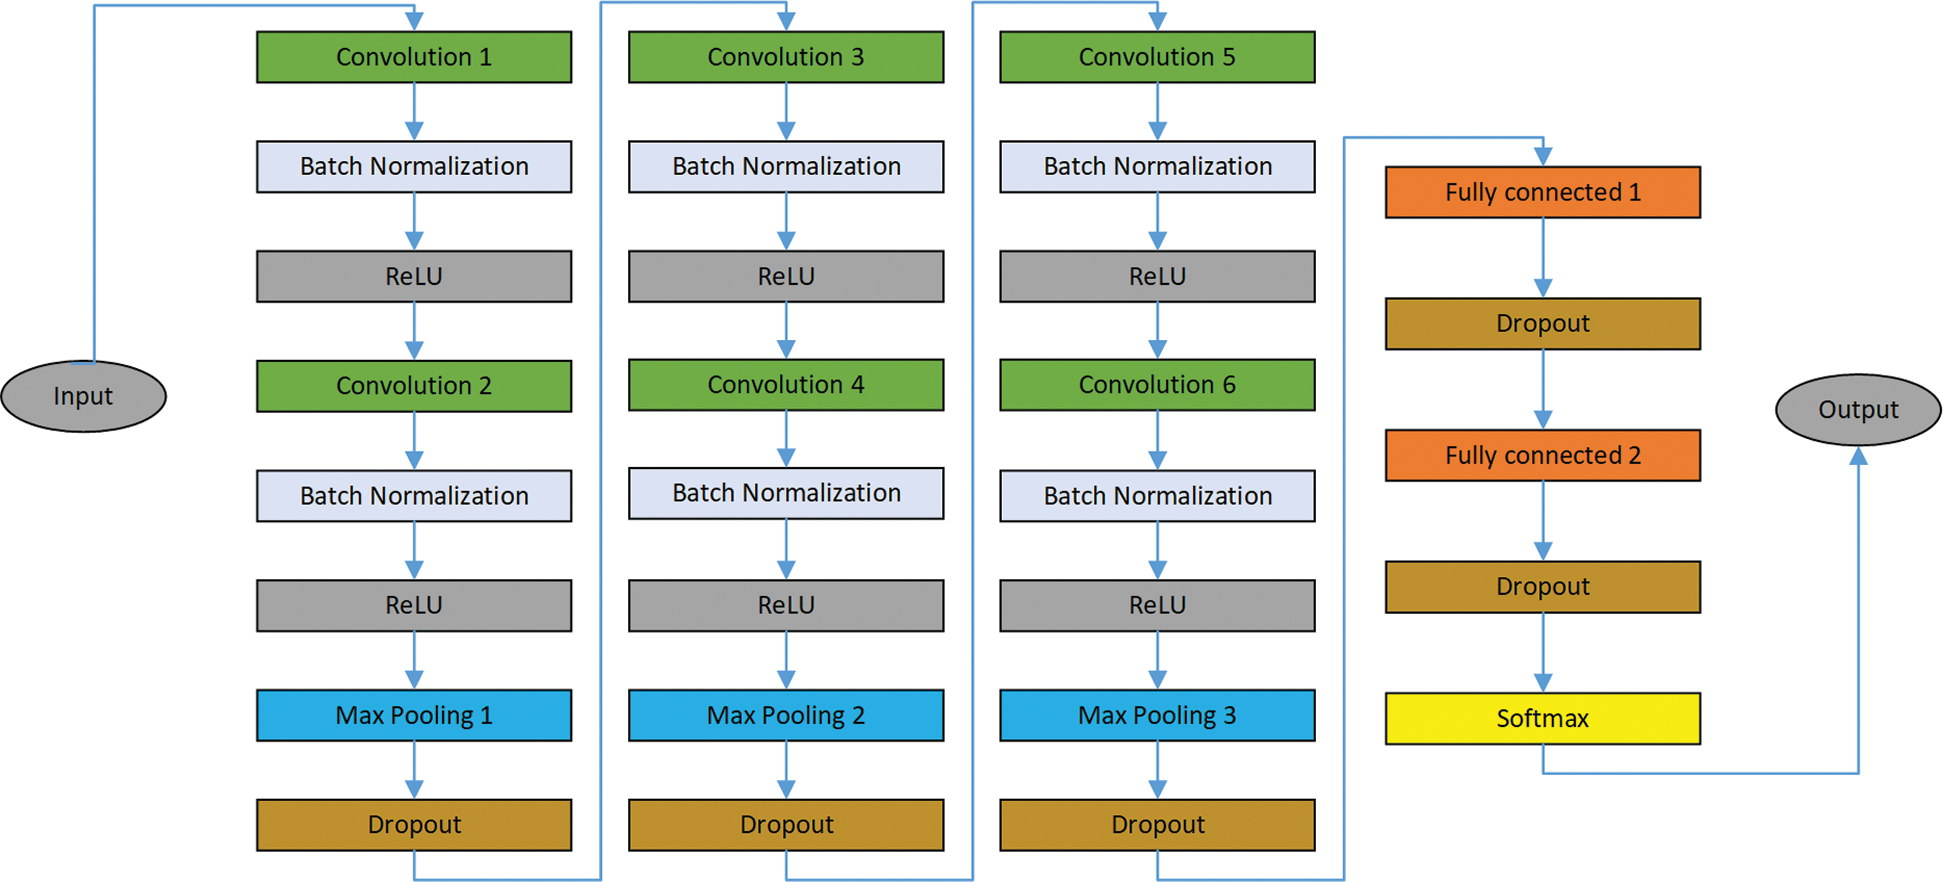
Figure 4: The architecture of CNN model improved in this paper
Tab. 1 lists the parameters of the main layers from the network model in this paper. The experimental results showed that this method can effectively improve the classification accuracy, accelerate the network convergence speed, and shorten the training time, as shown in Tabs. 2 and 3.
Table 1: The main layer parameters of the network model in this paper
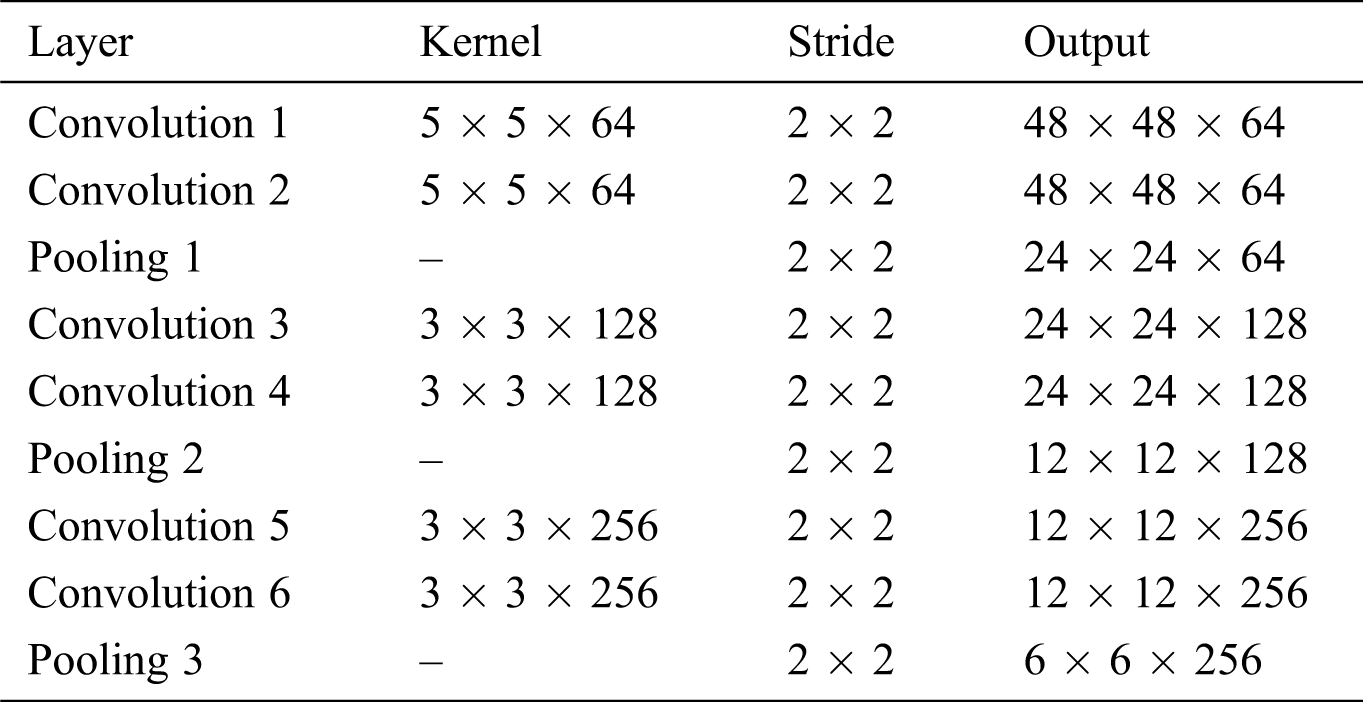
Table 2: Comparison of the experimental results of several networks (training time, epoch, recognition rate)
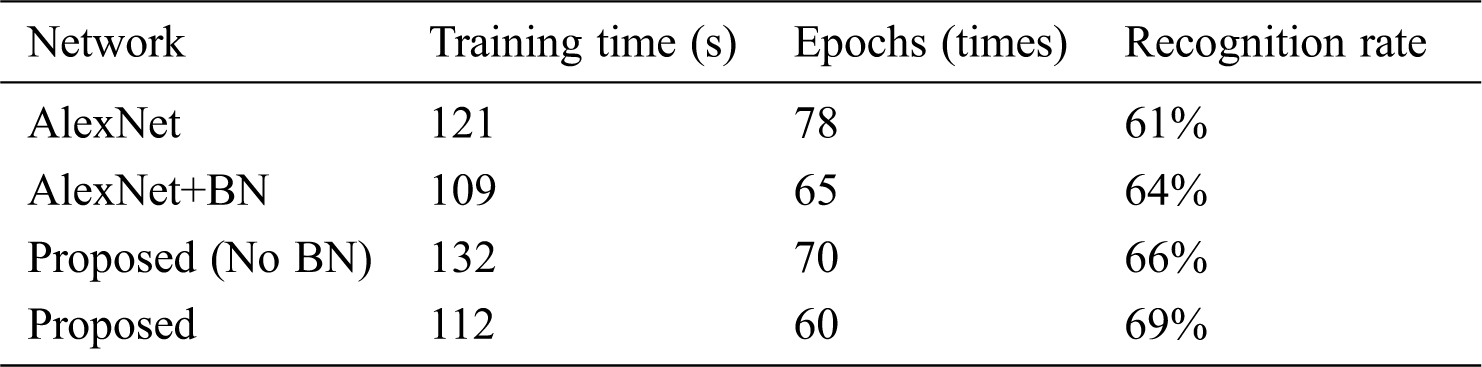
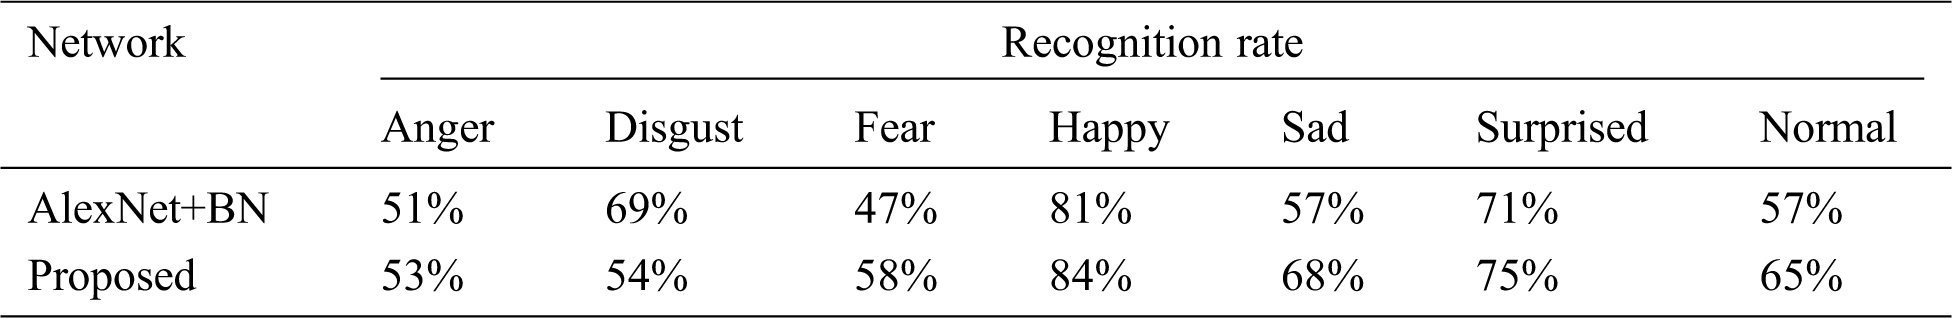
Table 3: Recognition rate of different expressions
After the driver’s facial expressions, such as happy, surprised, and disgusted, were recognized, the recognition results were combined with the monitoring results of physiological parameters for validation analysis. As a result, this analysis can accurately evaluate the driver’s physical state.
3.3 Acquisition of BVP Signals
In this section, the BVP signal was extracted from the ROI in the face video sequences.
The experimental data were a 10-second face video of a driver driving a vehicle. First, the video was extracted according to the frequency of 25 frames per second. Second, the ROI in each frame image was divided into three RGB channels and the gray mean value of the ROI region under each channel was calculated. Third, the BVP signals under the three color channels were obtained, as shown in Fig. 5b. Then through the Fourier transform, the spectrum images of the BVP signals were obtained, as shown in Fig. 5c. Related research has showed that the BVP signals from the red and blue channels are relatively weak, while the signal regularity of the green channel is stronger, as a result of the absorption of oxyhemoglobin under light. However, the BVP signals obtained from the green channel were not enough to calculate physiological parameters such as heart rate. The ICA algorithm was therefore used to separate the three independent components from the three RGB channels and the spectrum images of the three independent components were obtained through Fourier transform (see Fig. 6).
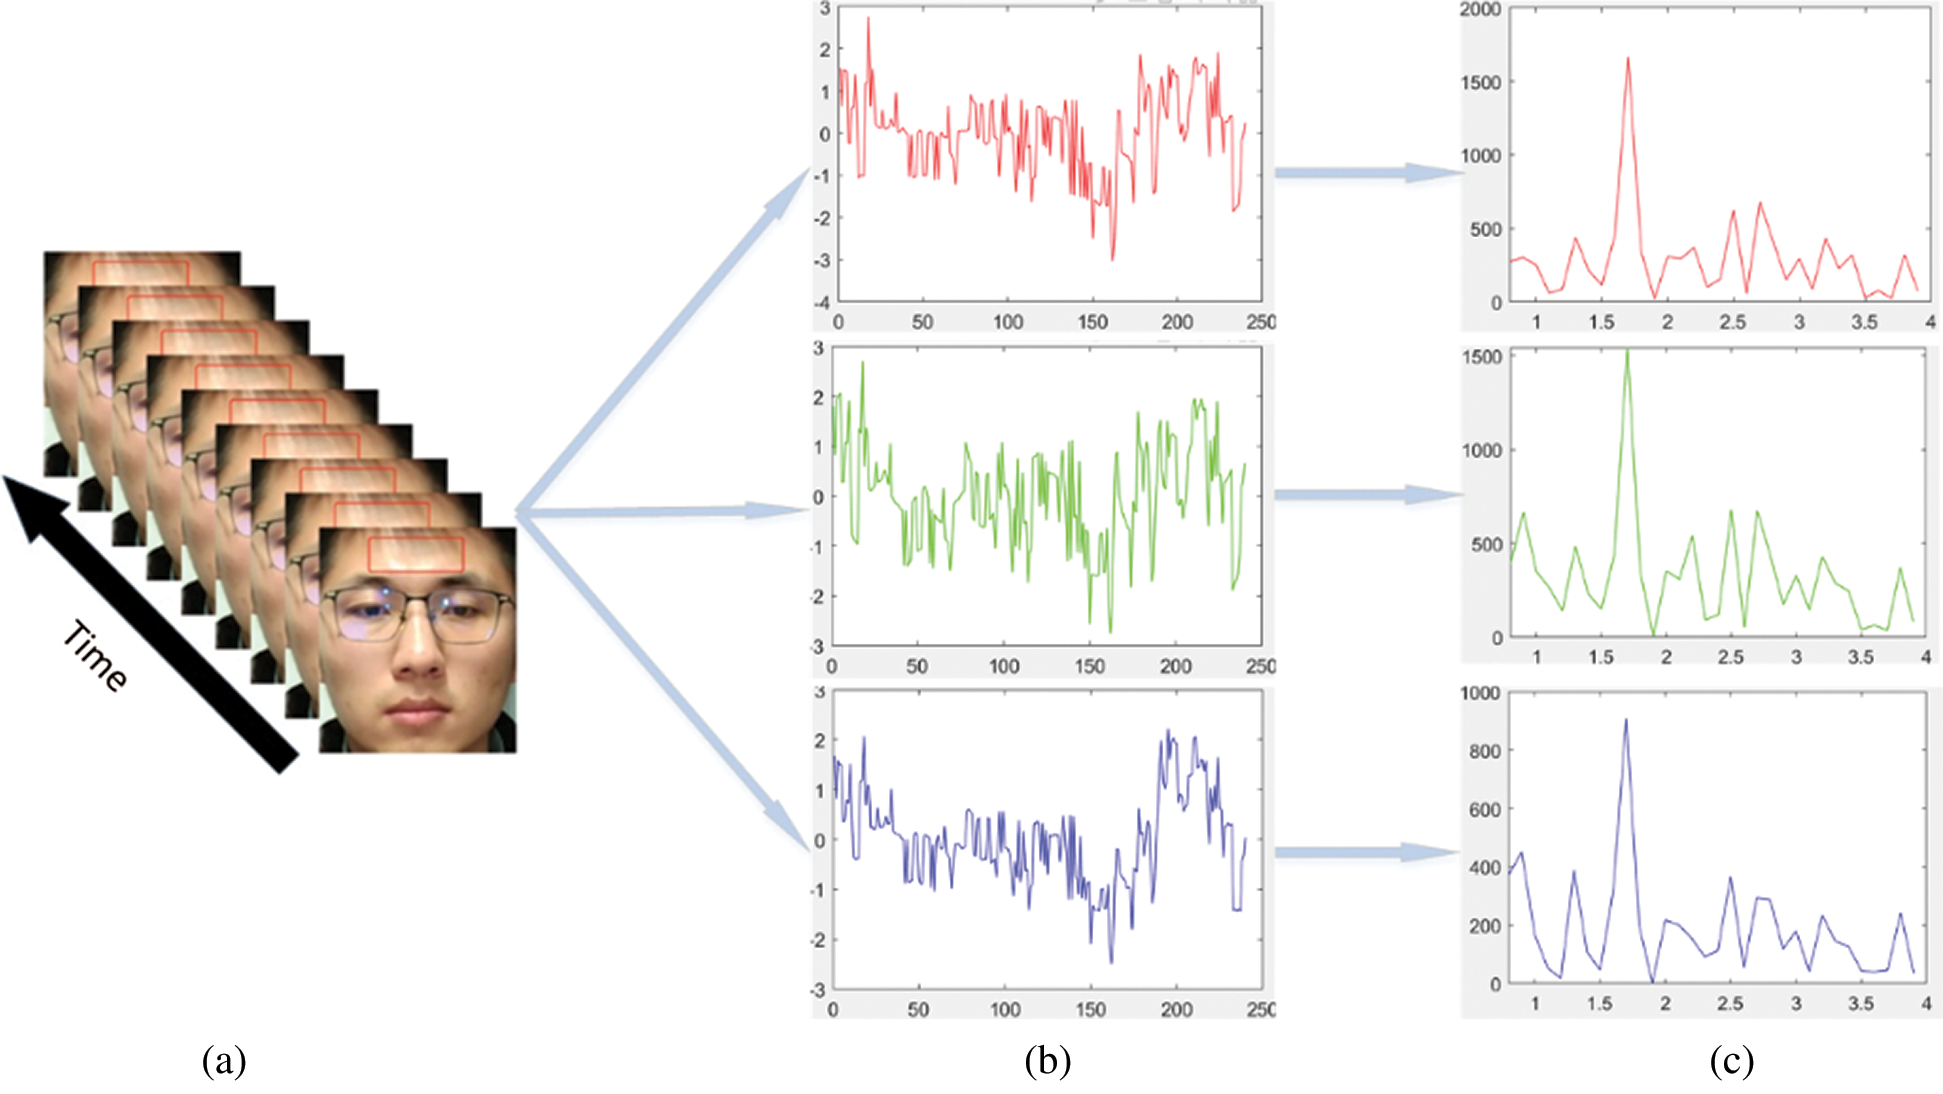
Figure 5: The ROI frame sequences and BVP signals obtained by three RGB channels
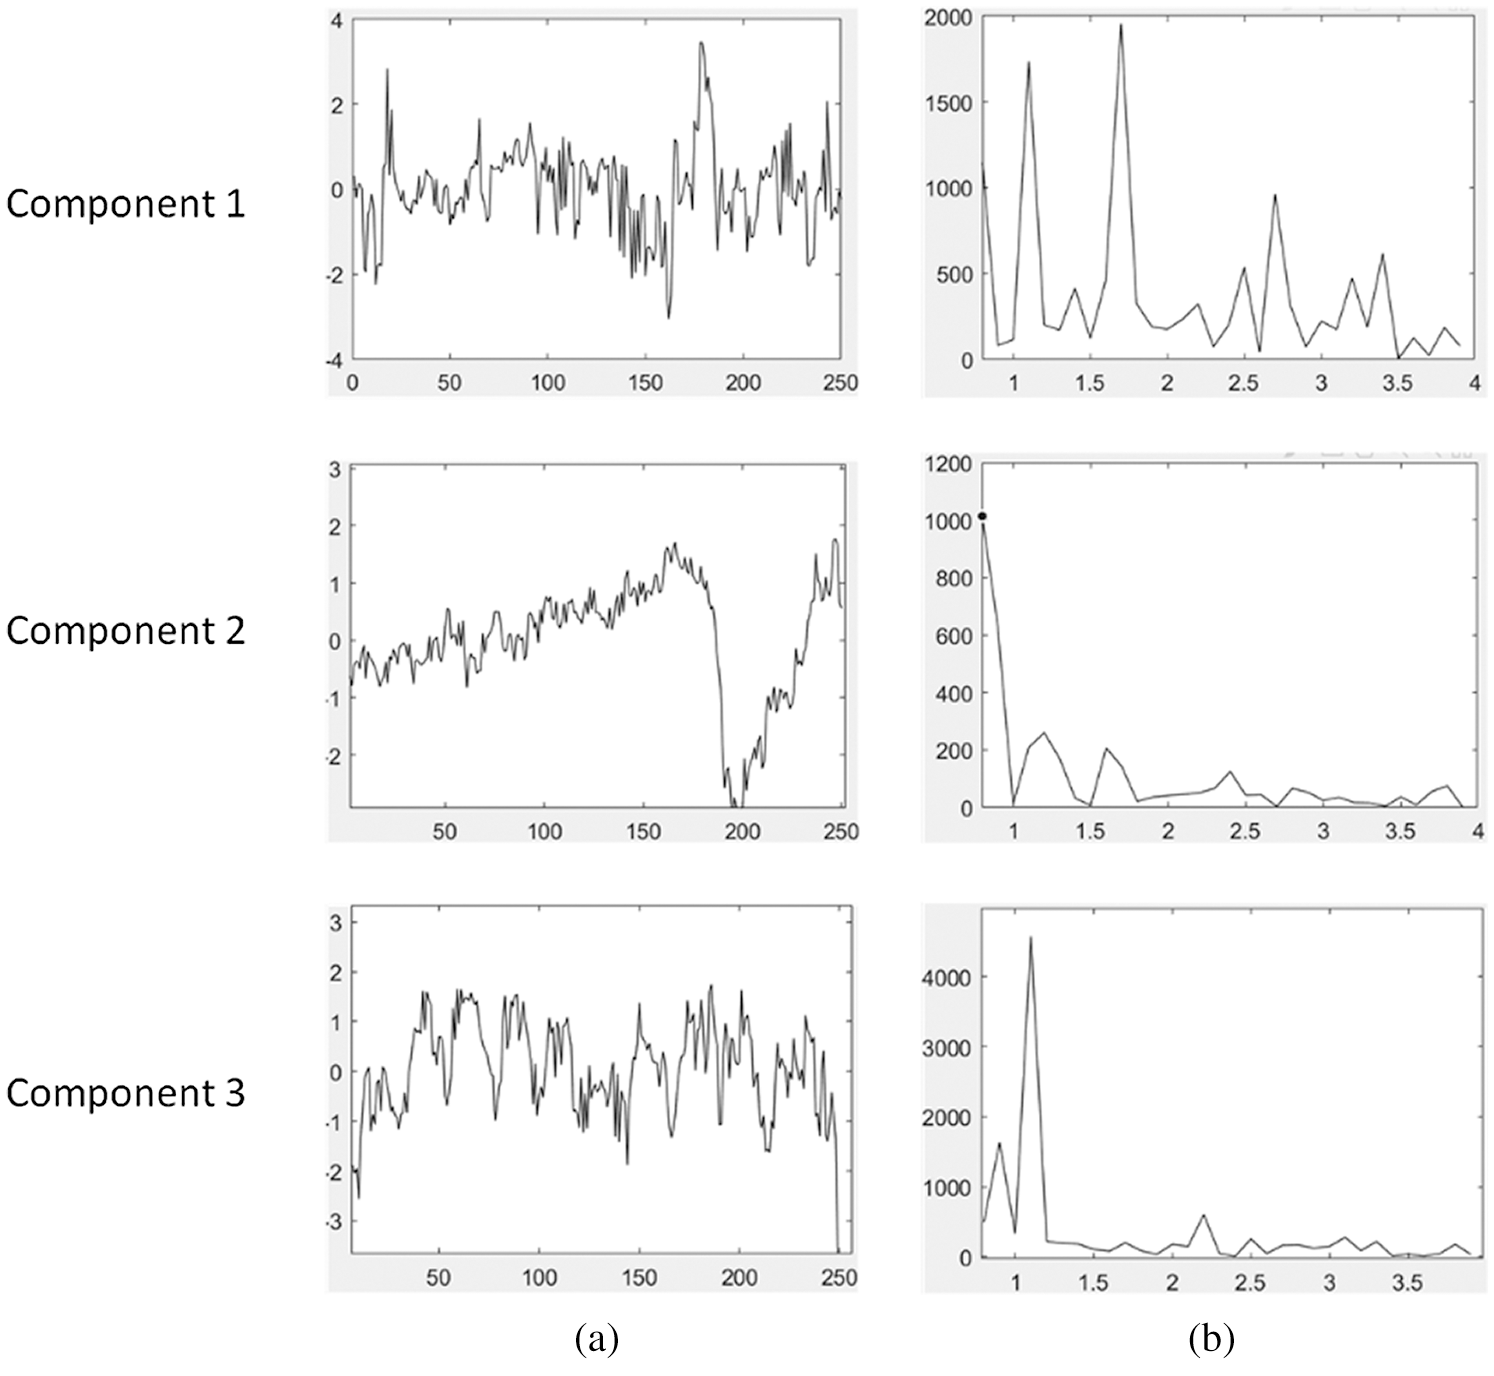
Figure 6: Three components separated by ICA and corresponding spectrum images
3.4 Obtaining Physiological Parameters
The respiratory rate and heart rate of typical adults in a resting state are 12–20 times and 60–100 times per minute, respectively. In consideration of the possible frequency ranges of respiratory rate and heart rate, the respiratory rate extraction frequency band was set to 0.15–0.6 Hz and the heart rate extraction frequency band was set to 0.8–2.4 Hz. The peak power of the frequency spectrum images after the Fourier transform was used in the two frequency bands to obtain the respiratory rate and heart rate of the subject, which were 0.3 Hz and 1.2 Hz, respectively (see Fig. 7). Accordingly, the respiratory rate and heart rate were 18 times and 72 times per minute, respectively.
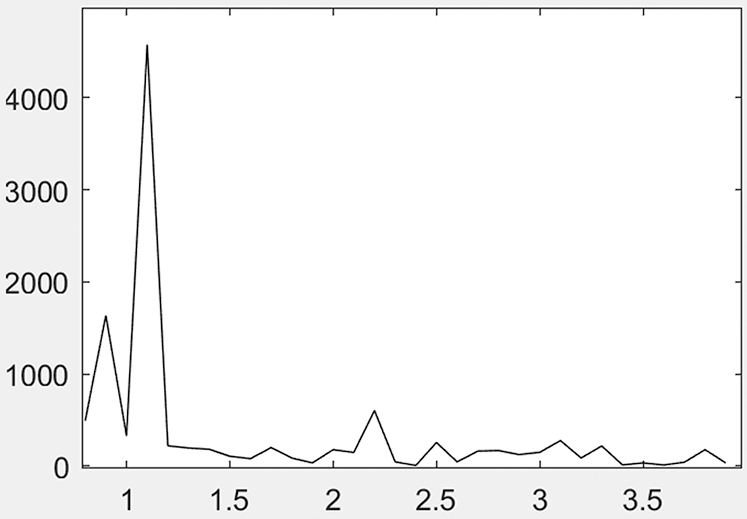
Figure 7: The independent component selected to calculate the physiological parameters
The experimental environment was an automobile being driven under normal road conditions. An ordinary USB camera (see Tab. 4 for the specific parameters of the camera) was placed on the back of the steering wheel, from which a video was taken of the driver’s face area. The video was transferred to the laptop through a USB cable in real time. Then the proposed algorithm was used to extract the physiological parameter information and expression analysis results of the driver from the video sequences in real time.
The experimental environment is shown in Fig. 8.
Table 4: Relevant parameters of the camera used in the experiment
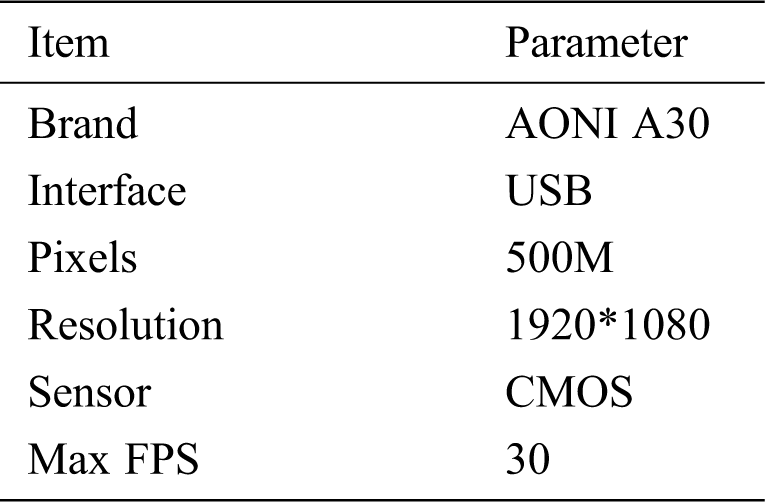
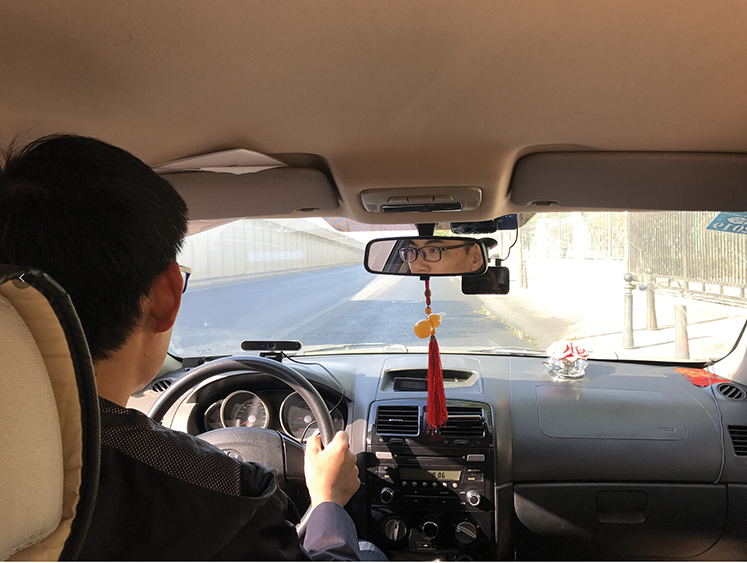
Figure 8: The experimental environment
4.2 Real-time Monitoring Results
Five volunteers were selected to participate in the road experiment. Each volunteer was measured once in the morning and once in the afternoon, and a total of 10 measurements were measured. Each time the driver’s heart rate was stable, data at the time were selected as the experimental results, and then the monitoring results were compared with the measured results of a simultaneous finger clip device. The comparison data are shown in Tab. 5. In order to better characterize the consistency of the two measurement methods, the Bland-Altman analysis method [27] was introduced. The consistency comparison results of heart rate and respiratory frequency are shown in Fig. 9.
Table 5: The experimental results obtained by the proposed algorithm and reference equipment
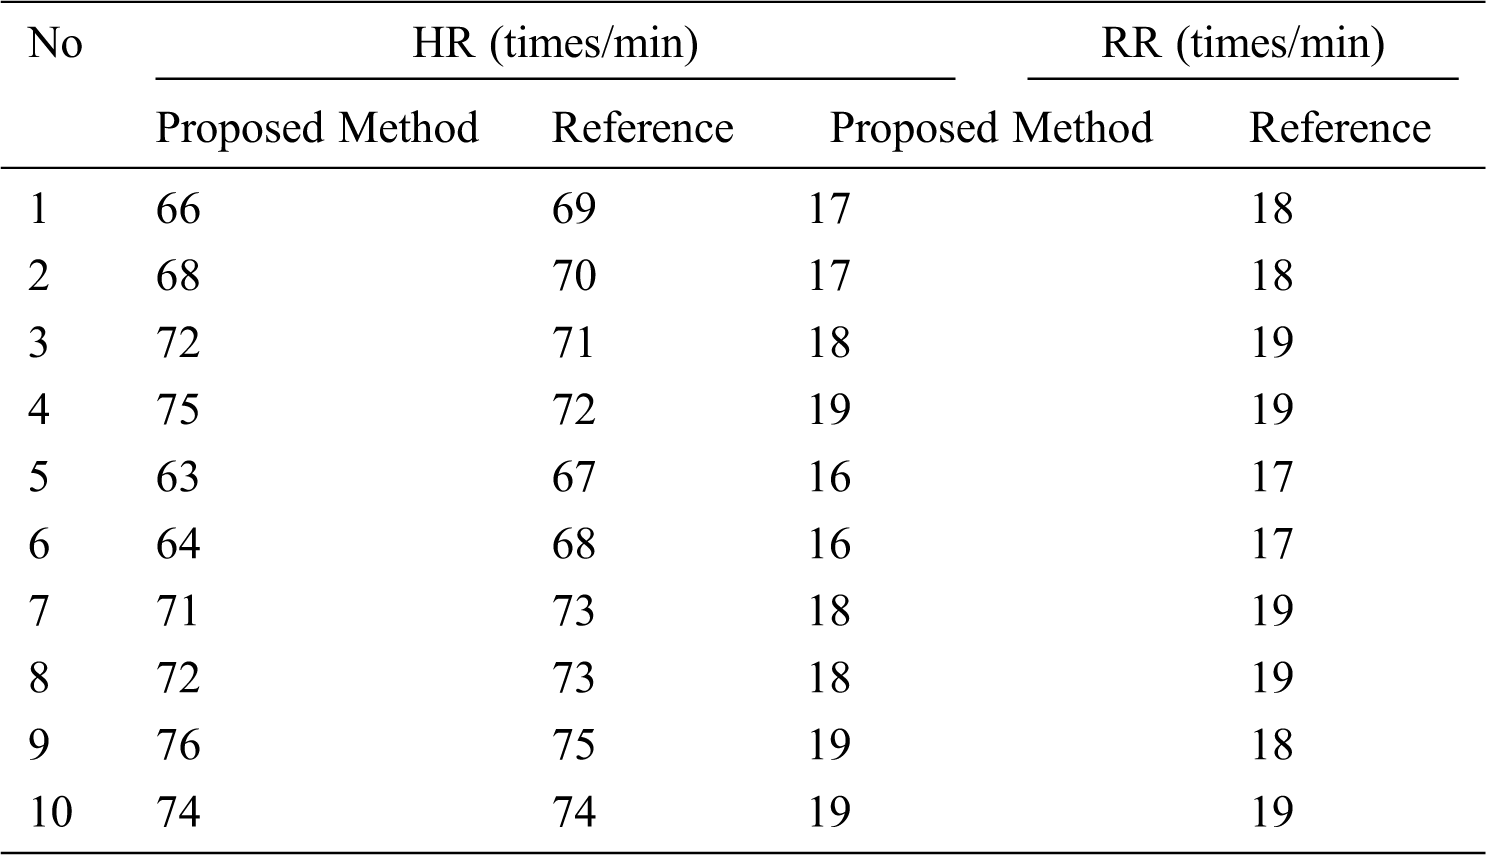
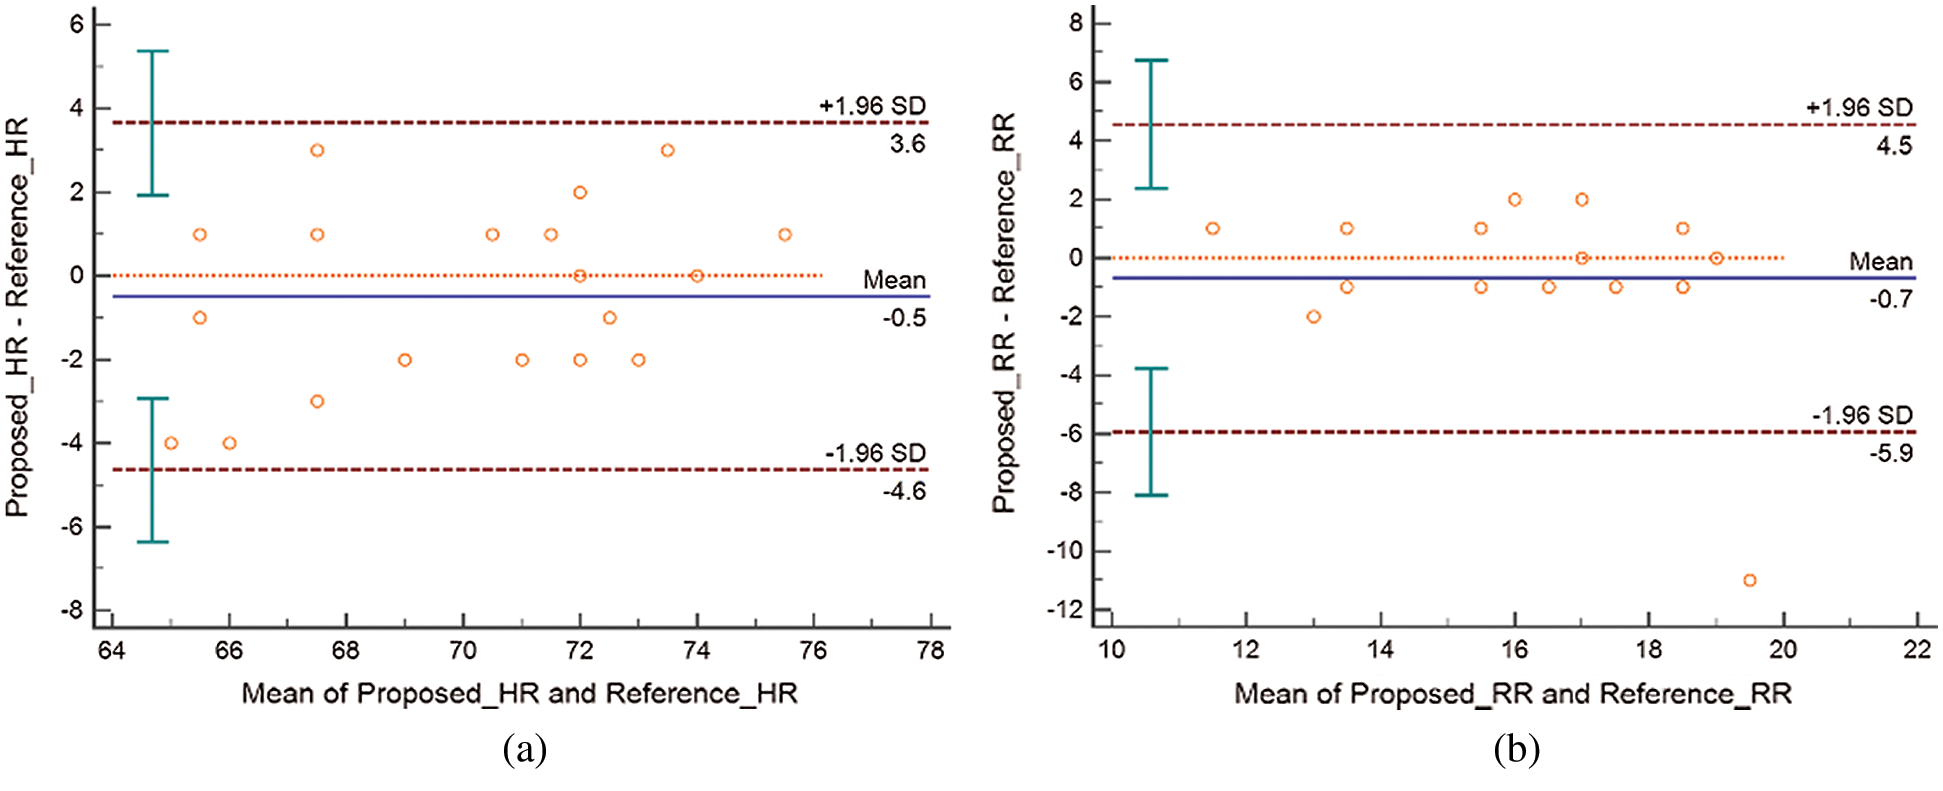
Figure 9: Bland-Altman plots demonstrating the agreement between the proposed method and reference device. (a) Consistency comparison of heart rate measurement results. (b) Consistency comparison of respiratory rate measurement results. The lines represent the mean and 95% limits of agreement
It can be seen from the experimental results that the monitoring results of the algorithm proposed in this paper are relatively accurate when compared with the contact medical equipment, and the consistency is maintained above 95%.
In this paper, a real-time monitoring algorithm is proposed to examine a driver’s physiological parameters under ambient light conditions. The video sequences of the driver’s head were captured by an ordinary USB camera. Subsequently, BVP signals of the driver were acquired in real time from the video, and both heart rate and respiratory rate data were calculated according to the BVP signals. Compared with the monitoring results of contact medical equipment, the proposed algorithm has a relatively high accuracy, and the non-contact data acquisition method does not interfere with normal driving. In addition, a facial expression recognition algorithm based on improved CNN is proposed to recognize the driver’s facial expressions. The results of facial expression recognition can help verify the monitoring results of physiological parameters, so as to evaluate the driver’s physical condition more accurately. The research content in this paper has valuable practical application potential such as real-time monitoring of driver status and related early warning.
Acknowledgement: We thank LetPub (www.letpub.com) for its linguistic assistance during the preparation of this manuscript.
Funding Statement: The work of this paper is supported by the National Natural Science Foundation of China (grant number 61572038), and the Innovation Capability Improvement Project of Science and Technology Service for the Elderly by Beijing Municipal Science & Technology Commission.
Conflicts of Interest: We have no conflicts of interest to report regarding the present study.
1. CSY. China Statistical Yearbook. Beijing, China: China Statistical Publishing House, 2020. [Online]. Available: http://www.stats.gov.cn/tjsj/ndsj/2020/indexch.htm. [Google Scholar]
2. H. Bu, “Cause analysis and prevention of road traffic accidents,” Journal of Wuhan Public Security Cadre's College, vol. 33, no. 2, pp. 16–20, 2019. [Google Scholar]
3. Q. Zhang, G. Q. Xu, M. Wang, Y. M. Zhou and W. Feng, “Webcam based non-contact real-time monitoring for the physiological parameters of drivers,” in Proc. IEEE 4th Annual Int. Conf. on Cyber Technology in Automation, Control, and Intelligent Systems, Hong Kong, China, pp. 648–652, 2014. [Google Scholar]
4. S. Q. Li, C. J. He and P. X. Huang, “Study on TCM syndrome discipline of congestive heart failure based on retrospective analysis of clinical cases,” China Journal of Traditional Chinese Medicine & Pharmacy, vol. 28, no. 5, pp. 191–197, 2013. [Google Scholar]
5. Y. Zhao, J. Cheng, P. Zhan and X. Peng, “ECG classification using deep CNN improved by wavelet transform,” Computers, Materials & Continua, vol. 64, no. 3, pp. 1615–1628, 2020. [Google Scholar]
6. T. Wu, V. Blazek and H. J. Schmitt, “Photoplethysmography imaging: A new noninvasive and noncontact method for mapping of the dermal perfusion changes,” in Proc. the Int. Society for Optical Engineering, pp. 62–70, 2000. [Google Scholar]
7. Y. Sun, C. Papin, V. A. Peris and R. S. Kalawsky, “Use of ambient light in remote photoplethysmographic systems: Comparison between a high-performance camera and a low-cost webcam,” Journal of Biomedical Optics, vol. 17, no. 3, pp. 037005, 2012. [Google Scholar]
8. Y. Liu, J. F. Ouyang and Y. G. Yan, “An improved method of measuring heart rate using a webcam,” in Proc. Photonics North, Montréal, Canada, pp. 92880S, 2014. [Google Scholar]
9. Y. Liu, J. F. Ouyang and Y. G. Yan, “De-noising of life feature signals based on wavelet transform,” in Proc. Congress on IEMDA, 2014 & Proc. of the Congress on CCSA, Sanya, Hainan, China, pp. 284–291, 2015. [Google Scholar]
10. L. Ma, “Research on techniques of the noncontact detection of physiological parameters based on ordinary camera, M.S. Thesies." Shandong University, China, 2017. [Google Scholar]
11. L. Q. Kong, J. Y. Zhao and Q. Zhao, “Non-contact detection of oxygen saturation based on visible light imaging device using ambient light,” Opticals Express, vol. 21, no. 15, pp. 17464–17471, 2013. [Google Scholar]
12. J. Zou, T. Chen and X. Yang, “Non-contact real-time heart rate measurement algorithm based on PPG-standard deviation,” Computers, Materials & Continua, vol. 60, no. 3, pp. 1029–1040, 2019. [Google Scholar]
13. F. P. Wieringa, F. Mastik and A. F. Van, “Contactless multiple wavelength photoplethysmographic imaging: A first step toward "SpO2, camera'' technology,” Annals of Biomedical Engineering, vol. 33, no. 8, pp. 1034–1041, 2005. [Google Scholar]
14. C. Takano and Y. Ohta, “Heart rate measurement based on a time-lapse image,” Medical Engineering & Physics, vol. 29, no. 8, pp. 853–857, 2007. [Google Scholar]
15. K. Humphreys, T. Ward and C. Markham, “Noncontact simultaneous dual wavelength photoplethysmography: A further step toward noncontact pulse oximetry,” Review of Scientific Instruments, vol. 78, no. 4, pp. 044304, 2007. [Google Scholar]
16. M. Z. Poh, D. J. Mcduff and R. W. Picard, “Non-contact, automated cardiac pulse measurements using video imaging and blind source separation,” Optics Express, vol. 18, no. 10, pp. 10762–10774, 2010. [Google Scholar]
17. M. Z. Poh, D. J. Mcduff and R. W. Picard, “Advancements in noncontact, multiparameter physiological measurements using a webcam,” IEEE Transactions on Biomedical Engineering, vol. 58, no. 1, pp. 7–11, 2011. [Google Scholar]
18. M. Z. Poh, D. J. Mcduff and R. W. Picard, “A medical mirror for non-contact health monitoring,” in Proc. Int. Conf. on Computer Graphics and Interactive Techniques, Vancouver, BC, Canada, pp. 1, 2011. [Google Scholar]
19. Y. Sun, S. Hu and V. Azorinperis, “Noncontact imaging photoplethysmography to effectively access pulse rate variability,” Journal of Biomedical Optics, vol. 18, no. 6, pp. 061205, 2013. [Google Scholar]
20. L. K. Mestha and S. Kyal, “System and method for determining video-based pulse transit time with time-series signals,” U.S. Patent Application 14/026739, 2013. [Google Scholar]
21. Y. Li, H. Sun, Z. Chen, Y. Ding and S. Zhou, “Stacked attention networks for referring expressions comprehension,” Computers, Materials & Continua, vol. 65, no. 3, pp. 2529–2541, 2020. [Google Scholar]
22. X. G. Chen, X. Yang, M. S. Wang and J. C. Zou, “Convolution neural network for automatic facial expression recognition,” in Proc. Int. Conf. on Applied System Innovation, Sapporo, Japan, pp. 814–817, 2017. [Google Scholar]
23. R. Chen, L. Pan, C. Li, Y. Zhou, A. Chen et al., “An improved deep fusion CNN for image recognition,” Computers, Materials & Continua, vol. 65, no. 2, pp. 1691–1706, 2020. [Google Scholar]
24. P. Viola and M. Jones, “Rapid object detection using a boosted cascade of simple features,” in Proc. Cvpr, Kauai, HI, USA, pp. 511–518, 2001. [Google Scholar]
25. B. Hu, H. Zhao, Y. Yang, B. Zhou and A. Noel, “Multiple faces tracking using feature fusion and neural network in video,” Intelligent Automation & Soft Computing, vol. 26, no. `4, pp. 1549–1560, 2020. [Google Scholar]
26. W. Verkruysse, L. O. Svaasand and J. S. Nelson, “Remote plethysmographic imaging using ambient light,” Optics Express, vol. 16, no. 26, pp. 21434–21445, 2008. [Google Scholar]
27. J. M. Bland and D. G. Altman, “Statistical methods for assessing agreement between two methods of clinical measurement,” Int. Journal of Nursing Studies, vol. 47, no. 8, pp. 931–936, 2010. [Google Scholar]
 | This work is licensed under a Creative Commons Attribution 4.0 International License, which permits unrestricted use, distribution, and reproduction in any medium, provided the original work is properly cited. |