DOI:10.32604/iasc.2021.016622
| Intelligent Automation & Soft Computing DOI:10.32604/iasc.2021.016622 | |
| Article |
Data Mining of Scientometrics for Classifying Science Journals
1Faculty of Engineering & Information Technology, Foundation University Islamabad, Islamabad, Pakistan
2Torrens University, Australia
3FAST-NUCES, Peshawar, Pakistan
*Corresponding Author: Muhammad Shaheen. Email: dr.shaheen@fui.edu.pk
Received: 06 January 2021; Accepted: 25 February 2021
Abstract: While there are several Scientometrics that can be used to assess the quality of the scientific work published in journals and conferences, yet; their validity and suitability is a great concern for stakeholders from both academia and industry. Different organizations have a different set of criteria for assessing the journals publishing scientific content. This is mostly based on the information generated from Scientometrics. A unified journal ranking system is therefore required that is acceptable to all concerned. This paper, collects data concerning Scientometrics for unified assessment of journals and proposes a mechanism of assessment using data mining methods. In order to carry out the research, big data for the proposed Scientometrics is stored in an integrated database. K Means clustering is then applied. This is to group the journals in different unsupervised clusters. The clusters are then labelled to find the exact rank of a science journal by using a state-of-the-art technique of labelling clusters. The classifier for the new instances is trained by using Naïve Bayes Classification Model. The new metrics proposed, include Eigen factor, Audience Factor, Impact Factor, Article Influence and Citations. In addition to this, the Prestige of Journal (PoJ) for the evaluation of journals is also proposed. The accuracy of both K means clustering and Naïve Bayes classification is 80%. The methods can be generalized to any problem of journal classification.
Keywords: Data mining; scientometric; journal classification
Assessing the quality of any journal is a complicated and multifaced task that cannot be standardized easily. As much as this task is complicated, it is equivalently important for the entire scientific community that is in constant quest of finding good quality resources that can support and help in development of new knowledge. Analysis of the globalized research practices reveal that different people and organizations have different set of criteria to assess the quality of the journals that are publishing scientific content. While there are several metrics that help us gain insight into any journal’s quality, yet most of these metrics are subject to several biases and discussion. Several researches have tried to solve the mystery by removing the biases from the journal metrics yet this problem is still ongoing and requires further investigation. Generally speaking, the quality and repute of any research journal depends on the number of research publications, number of citations, repute of the journal, repute of the database where the journal is indexed and much more.
With the advent of technology, data mining has emerged as a popular data analysis technique for analyzing large datasets. This study uses K-Means (a popular algorithm of clustering which is an unsupervised technique) with the inclusion of a variant proposed by Shaheen et al. [1,2]. The metrics for quality evaluation of science journals are picked from the existing literature. A new metrics, ‘Prestige of Journal (PoJ)’ is proposed in this study. A very short introduction and use of PoJ is given by Shaheen et al. [3]. The data for many journals for this metrics is collected from online sources. The journals are then classified by using an automated data mining technique i.e., K Means clustering which is used for unsupervised classification of data. The results obtained from K Means clustering are unsupervised classes or the classes that do not bear any label. The method of labelling clusters is also proposed by the author of this paper and applied in this study for the first time.
2 Summary of the Literature Review
Before proceeding further, let us briefly understand how the quality of journal is evaluated. The validity and quality of these methods is still a hot debate within the research communities. As a start, Impact Factor (IF) is one of the metrics that is widely accepted as a measure to measure the quality of a journal. Impact Factor does not consider the circulation based on usability and the prestige of the scientific content [4,5]. It considers self-citation as a full citation in a script and is computed for a period of one year [6]. The numbers of citations counted by this metrics are of the journals which are indexed in the clarivate analytics web of science [6,7]. Impact factor is calculated by Eq. (1).
Y1 represents current and Y2 represents the previous year.
Article Influence (AI) [8] is another metrics of journal evaluation that is the average impact of the papers published in the journal. Article Influence of a journal is computed for the first five years after its publication. AI is computed by using Eq. (2).
Arendt [9] presents a detailed comparative study of Impact Factor and Article Influence. Both these indicators consider the frequency of publication/citation only. Eigenfactor [10] appreciably excluded self-citations from the equation but the problem related to citation of journals from a particular selected database was to be sorted out. Eigenfactor was proposed by Carl Bergstrom in the year 2007 and it includes only the journals cited in the Web of Science database. This indicator uses data of the citations to track and measure the impact made by a certain journal relative to other journals. As mentioned earlier, it does not count self citation, also, it uses the time window of five years for evaluation. In 2007, Journal Citation Reports (JCR) included Eigenfactor. Citation window was expanded in Eigenfactor for those fields that experienced rapid citations within the first two years of publication. This reduced the bias that was claimed to be shown by other factors.
It is worth nothing that the factor of ‘time’, is not considered in most of the metrics. ‘Time’ as we know, might play an important role in the calculation of a journal’s overall impact. In Journal Immediacy Index, the citations of articles in journals are evaluated with respect to time. The value of the Journal Immediacy Index can be determined by using Eq. (3);
Another metrics, H-index or Hirsch index is a measure of productivity that is calculated both for the journals and the scientists. H-index calculates the deceptive scientific influence of a scientist or a journal as well as the actual scientific productivity. Hirsch introduced H-index to characterize a researcher’s scientific output. “A scientist has index h if h number of his n total papers have at least h citations each and the other (n-h) papers have h citations” [11].
Jacsó [12] argued that the ranking of a journal should not only evaluate the quantity but also, it’s quality for which González et al. [13] proposed a ranking scheme of SJR. SJR is primarily used for measuring the importance of the citations made and gives a realistic picture of impact of the journal on the society. It weighs citations, considering the prestige of the journal citing it. The formulation of the prestige metrics is proposed by Jacsó [12]. SJR also addressed the problem of self-citation by giving one-third score to self-citation in the ranking process [14]. SJR is computed by using Eq. (4).
Moving on, SNIP (Source Normalized Impact per Paper) [15] is used to find the impact of the journal based on the context-based citations. The context that is considered includes the citation frequency of the authors, the domain or field of study, impact of the citation and relevance of the indexing repository [16–18]. In short, SNIP calculates ratio of citation impact and extent of topicality as given in Eq. (5).
From the existing literature, we conclude the following limitations and shortcomings of the existing systems of journal ranking:
• In the score of a journal, self-citation is either counted as a full citation or as none. The credit added to the journal score in both the cases may add bias value to the actual rank of the journal.
• In the evaluation merely based on quantitative measures, some important assessments that could not be quantified may be miscued.
• Multiple journal indexing schemes indexed science journals. The ranking mechanism for each indexing scheme is different and solely rely upon the metrics of its own database.
• Automated information systems are in use for the evaluation of journal metrics. Big data analytics, despite its potential to extract useful patterns from larger databases is not used for classification of such journals, to the best of our research.
This study devised a mechanism for determining the scores of journals based on different metrics. Self-citation is mechanized, and a new metrics of PoJ is introduced. A data mining based method that used the combination of both supervised and unsupervised classification is proposed for classification of journals and determining their ranks. Before presenting the algorithms of the proposed method, a brief introduction of the data mining techniques is given in the next section.
This research uses Data Mining (DM) for discovery of knowledge from huge databases. The process followed for discovery of knowledge from data, to find meaningful patterns, is according to guidelines of Shaheen et al. [19]. Data mining is extensively used for classification either on supervised or unsupervised datasets. If the class labels are provided to the user in datasets, then classification technique used is ‘supervised classification’. In case of unavailability of class labels, ‘unsupervised classification’ techniques are used [20,21]. This paper uses a type of unsupervised classification that is ‘clustering’. Several clustering techniques have already been developed as well as reviewed by Shaheen et al. [22,23].
As mentioned earlier, the study uses K-Means algorithm of clustering. The data points in this algorithm is mapped on Cartesian space and the similarities and dissimilarities in the data points are based upon Euclidean distance. The whole dataset is converted to the coordinated points and every record/tuple of a database is given one, and only one, point mapped on the axis of Cartesian system [24,25]. The coordinate point contains all the attribute values for a particular tuple of the database. Based on Euclidean distance from the cluster center to a certain point, specific points are allocated to K clusters. At the start of K Means process, cluster centers are chosen at random. The steps of K Means clustering algorithm are given in Refs. [2,26,27].
Clusters are unlabeled groups of data. Shaheen et al. [2] proposed a method for labelling clusters. Since there was a need to find the exact rank of each journal based on proposed ranking indicators so clusters were labelled by using a special technique. As mentioned earlier, clusters do not contain class labels. The clusters obtained after applying K Means clustering contain labels like cluster1, cluster2 etc. The labels of clusters are not meaningful and they do not give any clue about the class or category of data points contained. A technique of labelling clusters, proposed by Shaheen et al. [1,2] applies labels by using correlation analysis between the dependent and the independent variable. The step-wise procedure for labelling clusters is given below:
• Select number of clusters K for the dataset.
• Convert the dataset to the set number of clusters by using K Means clustering algorithm.
• Divide the dataset into dependent and independent variables [28].
• Use spearman ranked correlation coefficient for all the independent variable to find the value of each with dependent variable. The correlation value between the two attributes is named as ‘Weight Value’ in this study. Eq. (6) is used to find the correlation value.
• Multiply weight value with the actual value to calculate the new value of the variable.
• Sort the values in descending order concerning the weight of the variable.
Labelling of clusters is the final step of the training phase (A machine learning algorithm is executed in two phases, i.e., training and testing phase). Once the labelled clusters are formed, new instances are classified into one of the existing class by using Naïve Bayes Classification. Naïve Bayes Classification uses the probability of occurrence which is plotted using standard graphs with the assumption of Naïve [29]. In Naïve assumption, the attribute is correlated with the class attribute independently. It is used in complex classification algorithms, for instance, boosted trees [30,31] and random forests [32,33]. Bayes Classifier does not produce much accurate results when the number of attributes in a dataset is large. This makes Naïve Bayes Classification method simpler to apply on a dataset with several attributes. Bayes theorem is based on prior and posterior probability. These equations are given below:
P(hyp) = The probability of hypothesis also known as prior belief
P(x/hyp) = The likelihood probability of x if hyp is given
P(x) = The marginal probability of x
P(hyp/x) = The likelihood probability of hypothesis if x is given, also called posterior probability.
The class independence assumption in Naïve Bayes Classifier is given in Eq. (8).
At the end of training phase, a new instance x = (x1 ,x2 ,x3 …xn) is classified by using Eq. (9).
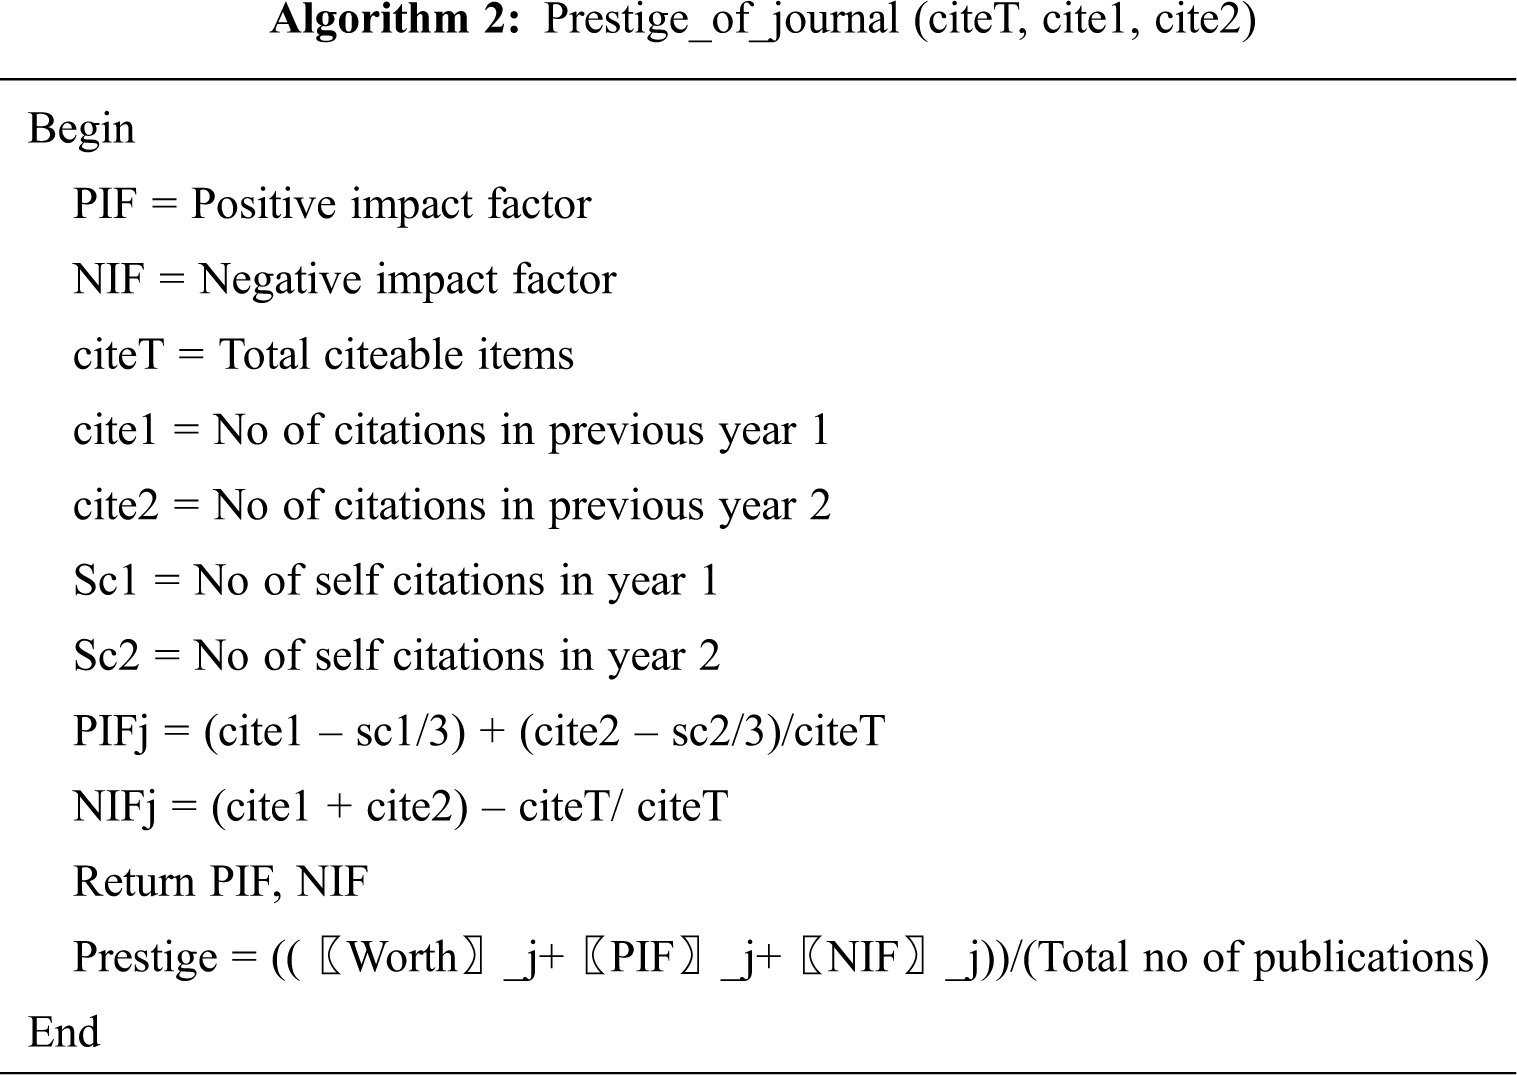
Impact factor is considered to be the most popular journal assessment metrics. Impact Factor considers cited articles only. The journals which are frequently published are expected to get a higher citation. Similarly, most of the metrics give equal importance and weightage to self-citation which may add some bias to journal classification. The existing metrics of assessment are developed by the organizations which rely upon their own databases only. The demographics of the editorial board, metrics developed by other organizations and other factors contributing to the repute of a journal are not considered in the assessment process. A new metric “Prestige of Journal (PoJ)” is proposed in this study to address the problems given above. The prestige of a journal is calculated on the following basis:
• Positive Impact Factor of the journal PIF (1/3rd value for self-citations): Self-citations are not removed but given a worth equal to 1/3rd of the total value as proposed by SJR [13,14,34]. PIF is used to measure citations of a journal within a time frame. To calculate the number of citations of a journal J in 2010, the number of citations of the journal in the last three years i.e., 2008, 2009 and 2010 are computed and marked as positive instances. The score obtained from positive instances is given the name of PIF in this paper.
• Negative Impact Factor (NIF) (1/3rd value for self-citations): NIF computed negative instances of the papers and all those instances which are not positive are included in this set. These papers are not included in the calculation of the impact factor. This will make the assessment more relative.
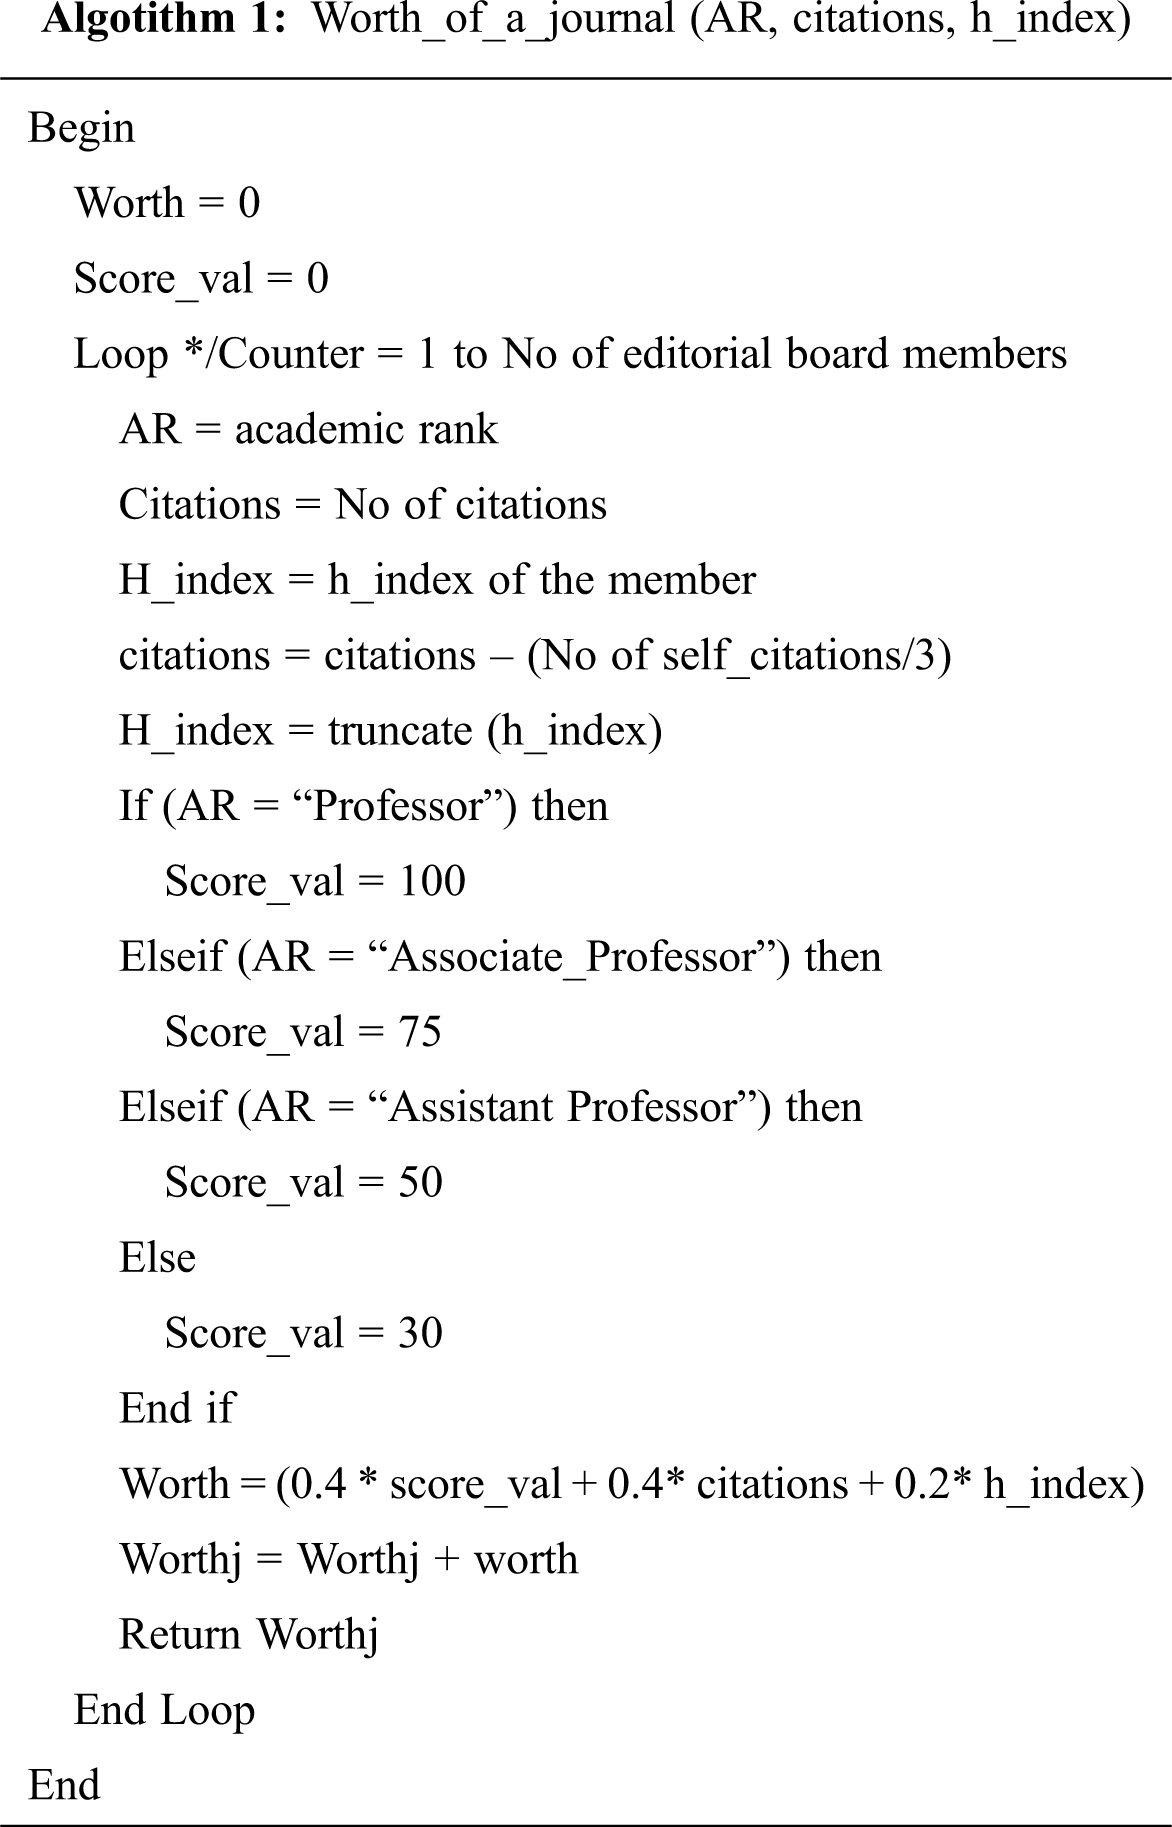
• Worth of the Journal: Worth of the journal is computed by the publication index and other demographical attributes of the editorial board and review committee. It is computed by the number of citations, academic or research rank of the editorial board member and h index of the editorial board member. The reason to include worth is to cater the frequency of journals. Some particular journals are published two or three times a year. Calculating the rank of such a journal using conventional methods would yield lesser rank than those journals which are frequently published. Factors given below are used in the calculation of a journal’s worth:
• academic rank: The academic rank of members of reviewers and editorial board members committee is considered and given a weight of 40%. (Professor and equivalent = 100%, Associate Professor and equivalent = 75%, Assistant Professor and equivalent = 50%, Any other = 30%). Academic Rank is country specific and can be changed according to indigenous conditions.
• No of citations: The number of citations of the members is also considered and given a weight of 40%.
• h index of the member: The weight of h index of the member is 20%. The equation to compute the worth of a journal is given in Eq. (10).
3.1 Use of Labelled Clustering
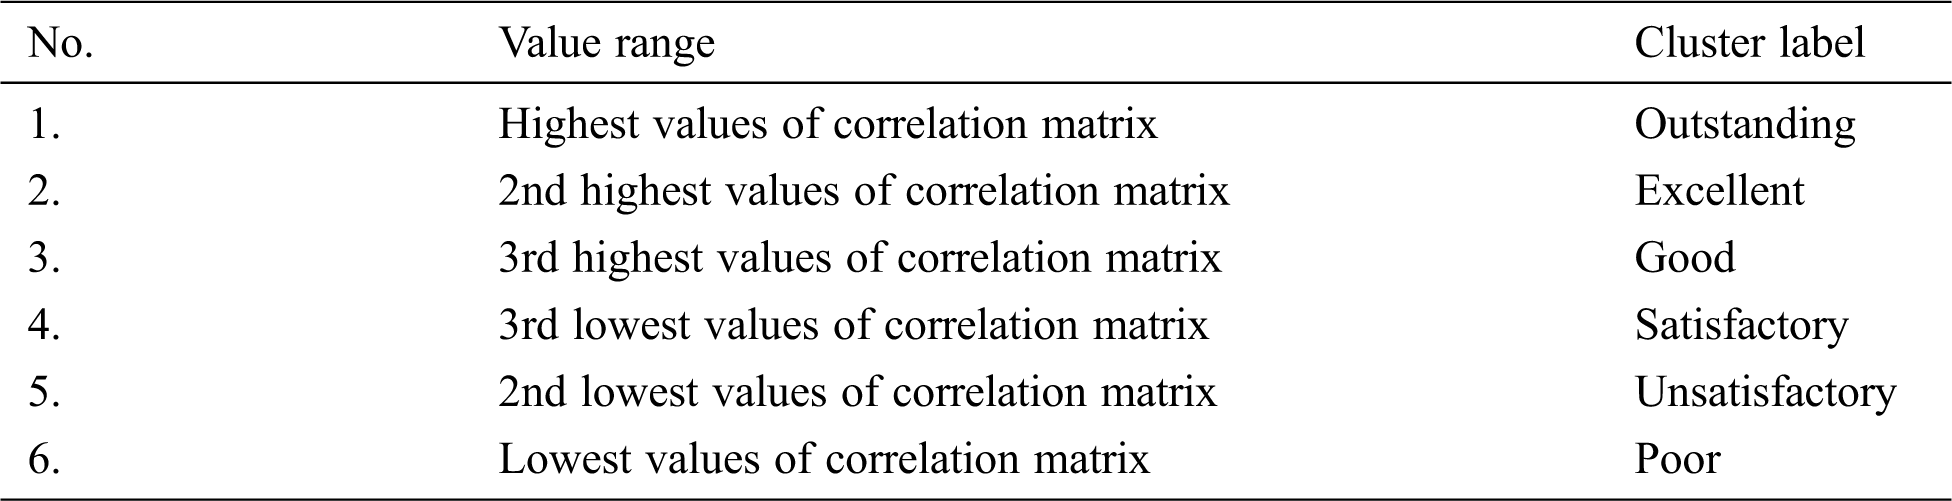
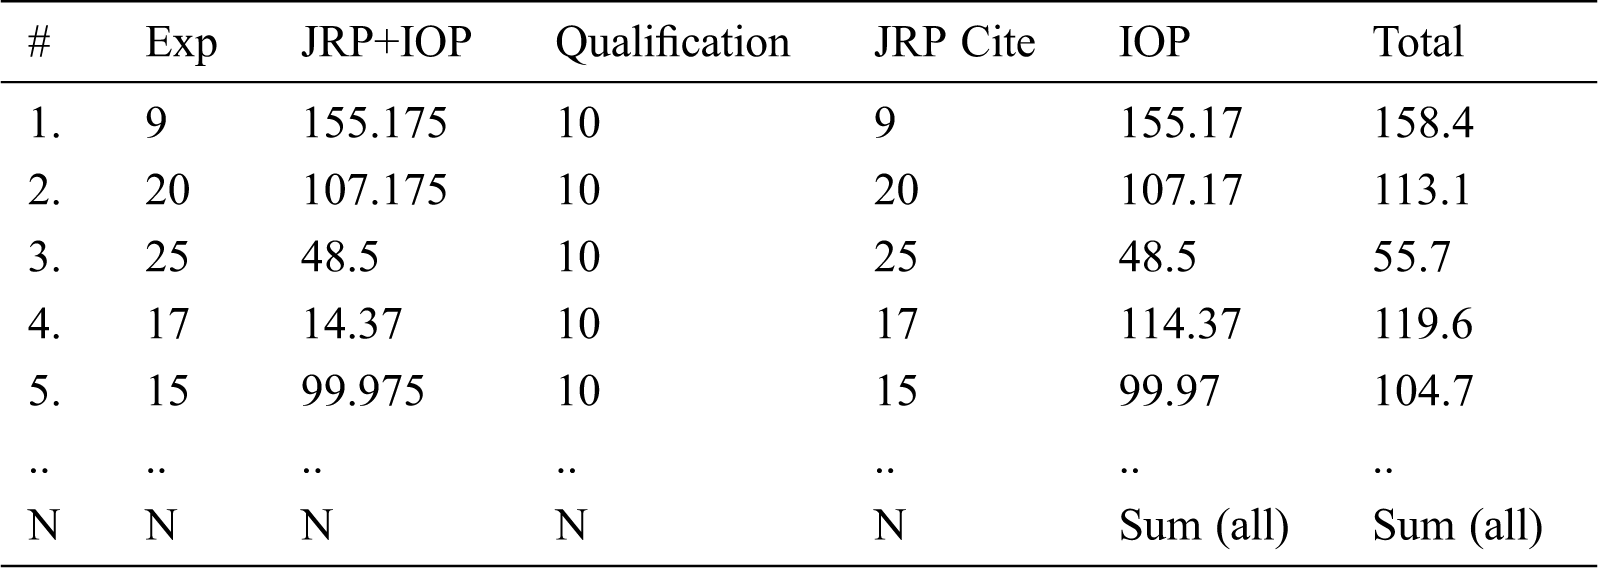
All the metrics discussed in literature review and the new metrics; that is, ‘Prestige of journal (PoJ)’, are stored in a shared integrated database. The structure of the database is given in Tab. 1. Data mining is used on the database comprising of journal metrics. To remove biases in journal evaluation, all the self-citations are removed. Current journal ranking techniques only consider the positive examples of citations while the proposed technique includes negative examples as well. Weights are allocated to the citations, PIF, NIF and qualifications on a theoretical basis. Self-citations were included in the calculation of the impact factor, which was removed in the Eigenfactor Value [35]. The Prestige of Journal (Eq. 11), along with other attributes i.e., Eigenfactor, Number of Citations, h index and Article Influence are placed in a database. The attributes stored in the database are then grouped by using the K-Means algorithm. Unlabeled clusters can be better utilized by allocating them the labels. This is done using the method presented in the section on methodology. The labels are given in Tab. 2.
Table 1: Structure of the database
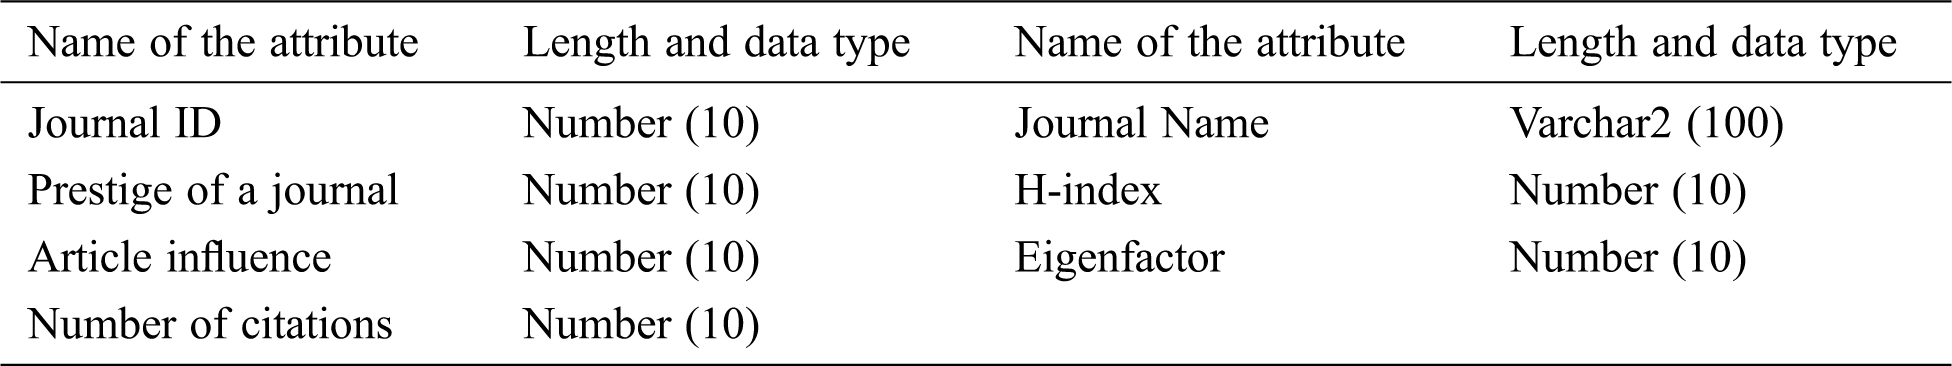
Table 2: Labels allocated to the clusters based on the value of correlation coefficient
In the training phase, the labels are applied on individual database instances which serve as a test case for each incoming example. Each new incoming instance is classified in one of the existing classes (the labels are given in Tab. 2) by using Naïve Bayes Classification.
An experiment was performed on a dataset of 6000 science journals of different database indexing agencies. Five values i.e., POJ, H-index, AI, EF and citations for each science journal is calculated and stored in the database. The indicators used for each journal are calculated using Eqs. (1)–(5) and the PoJ is computed using Eq. (11). The values of worth of journals is shown in Tab. 3 which are used to find prestige of the journal.
In order to apply K Means Clustering, the data is mapped onto a coordinate system in such a way that the values of variables, which in this case are values of journal metrics, are represented by points in the cartesian plane. Fig. 1 shows the clusters with each color representing one cluster. The density of the cluster with red points is smaller than the density of other clusters. At this stage, the clusters can only be discriminated based on the difference in color because of being unlabeled. Fig. 2a shows the clusters after applying labels on them. The labels/ranks are decided based on the correlation analysis of each indicator with the market value of the journal. After applying labels, the points are classified into six pre-defined categories. The one with maximum correlation value is ranked as the outstanding and the rest are ranked accordingly. This is shown in Fig. 2.
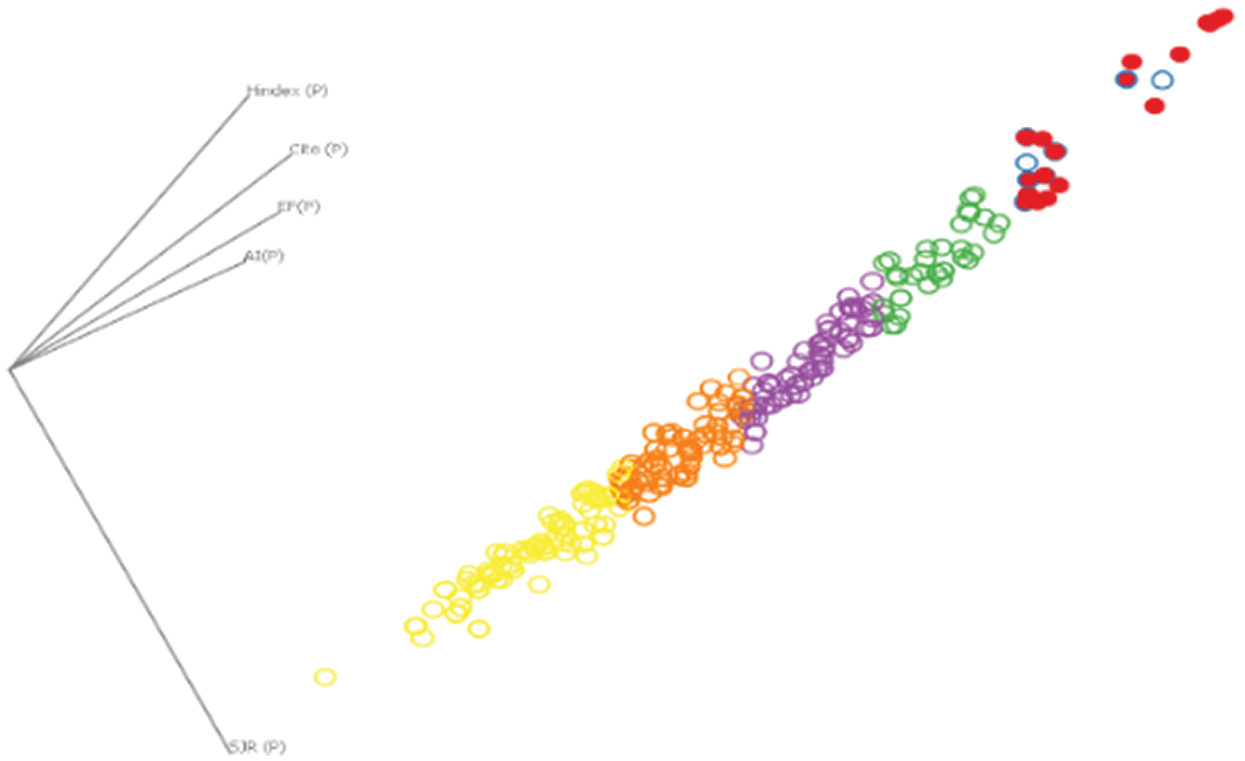
Figure 1: Clusters obtained after applying K Means clustering
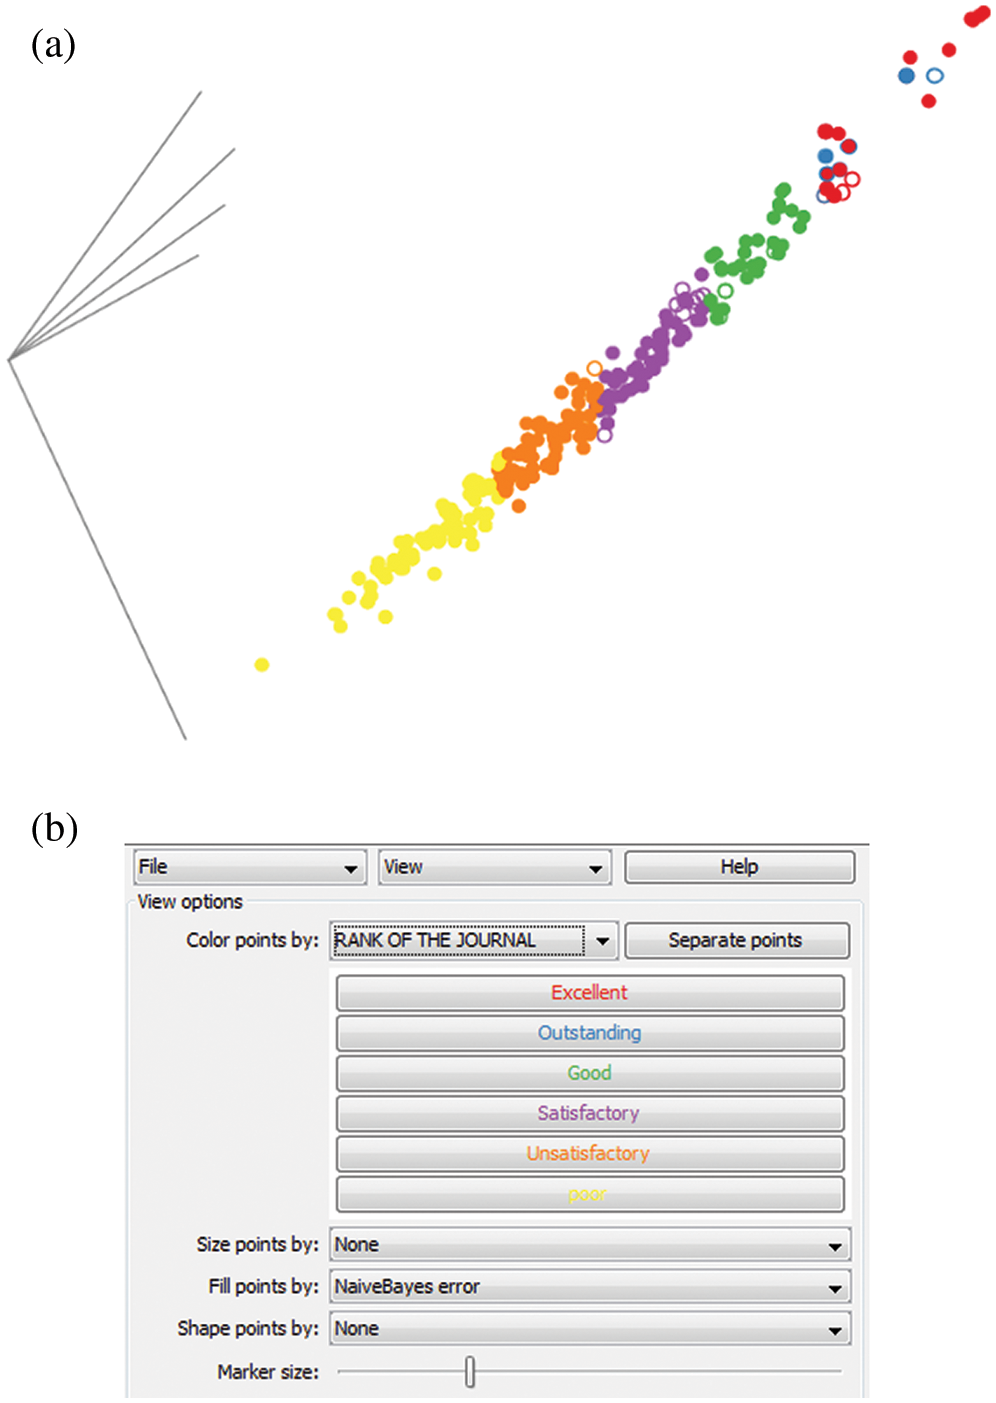
Figure 2: Labels of clusters
The histograms in Fig. 3 show that most of the journals are placed in the unsatisfactory category. Only 13% of the journals are categorized as outstanding journals. The detailed histograms are shown in Fig. 3. Once the clusters are labelled with journal categories. The values of all the indicators with unknown class value are given to the system as input for finding the class label. The system takes the input, calculates Prestige, H-Index, Article Influence and Eigenfactor of the journal before applying Naïve Bayes Classification as explained in the methodology section.
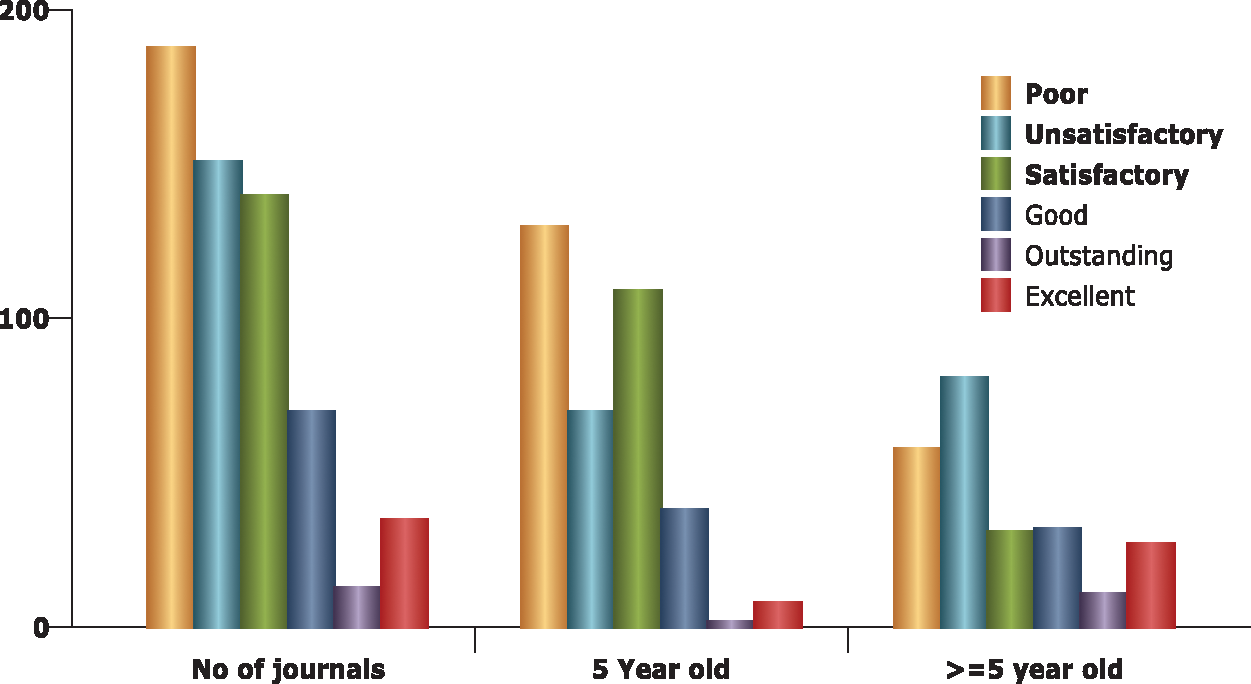
Figure 3: Category wise distribution of journals
There are some factors on the basis of which the proposed technique can be compared with existing journal ranking techniques. A simple theoretical comparison reveals few facts that have been discussed before and highlighted again. These are:
• The journals that have been evaluated are taken from diverse sources.
• All published articles are included, whether cited or not for evaluation of prestige of the journal.
• Author’s self-citations is removed before evaluating the prestige of the journal.
• The target window for journals is extended to 5 years.
• In order to calculate prestige, weights were allocated to different factors involved in the evaluation of journals. These weights are calculated on the basis of Euclidean and Kronecker measures.
• The experience, qualifications and research impact of editorial board and review committee is also consideration for evaluation of a journal’s worth.
SJR, as we know is an accepted indicator that is widely used for evaluation of journals. A comparison of PoJ is given with SJR for all the selected science journals that are divided into eight categories on the basis of their impact factor. The reason for dividing the journals into eight categories is to diversify the input. The minimum and maximum impact factors of the considered journals are 1 and 4 with an interval of 0.5. The results are given in Fig. 4 below:
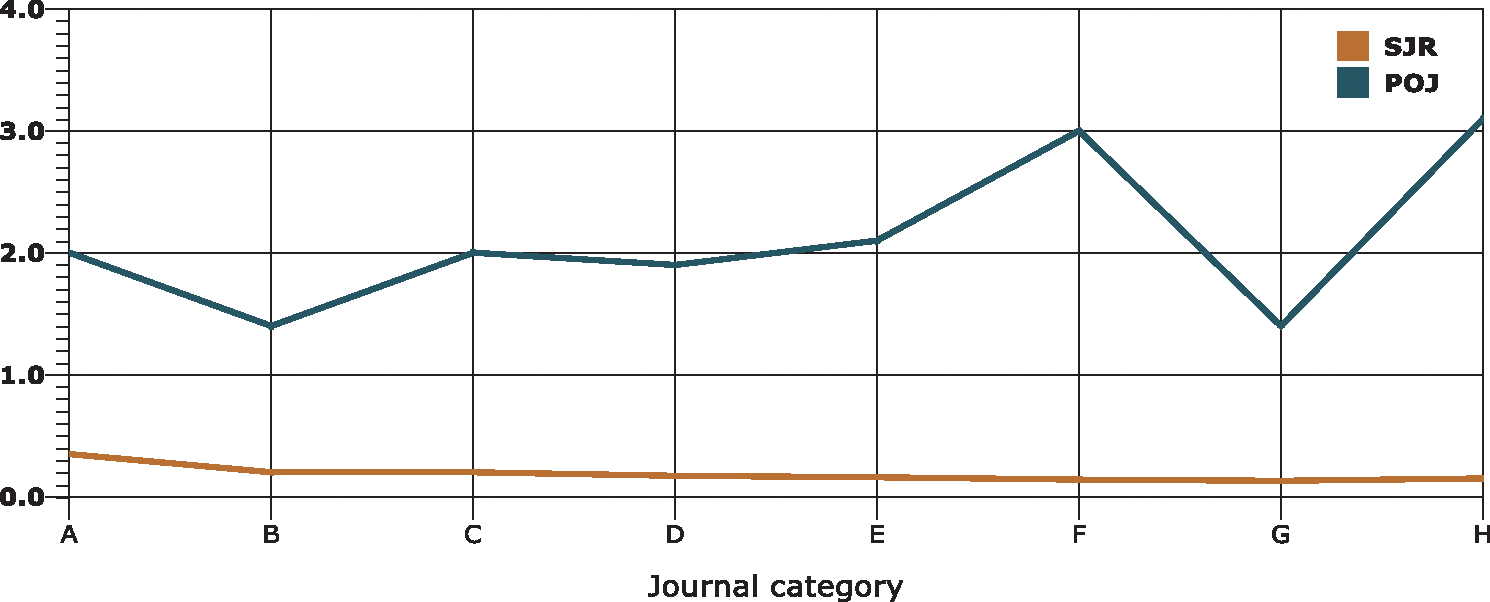
Figure 4: PoJ vs SJR
Fig. 4 reveals that SJR does not have change much for all the journals categories while a clear change can be observed in POJ. This makes POJ more appropriate for ranking science journals. The prestige of review members/editorial board and the number of citations of a journal caused larger variance in PoJ value. Domain-wise difference in the prestige of journals is also observed, which should be. Category G & H showed this difference in PoJ.
The comparison given in Fig. 5 shows division of journals on the basis of IF and PoJ. The minimum and the maximum Impact Factors of the given categories are 0.5 and 4 with an interval of 0.5. The first thing that can be concluded immediately from the figure is that the IF and PoJ give dissimilar results. In the figure we can observe that the journals with Impact Factor around 3.5 have substantially different output of PoJ. On the other hand, the journals with lesser Impact Factor have higher PoJ. The theoretical aspects discussed before may be the reasons for this difference. This short analysis explains how PoJ indifferently values journals prestige as compared to IF.
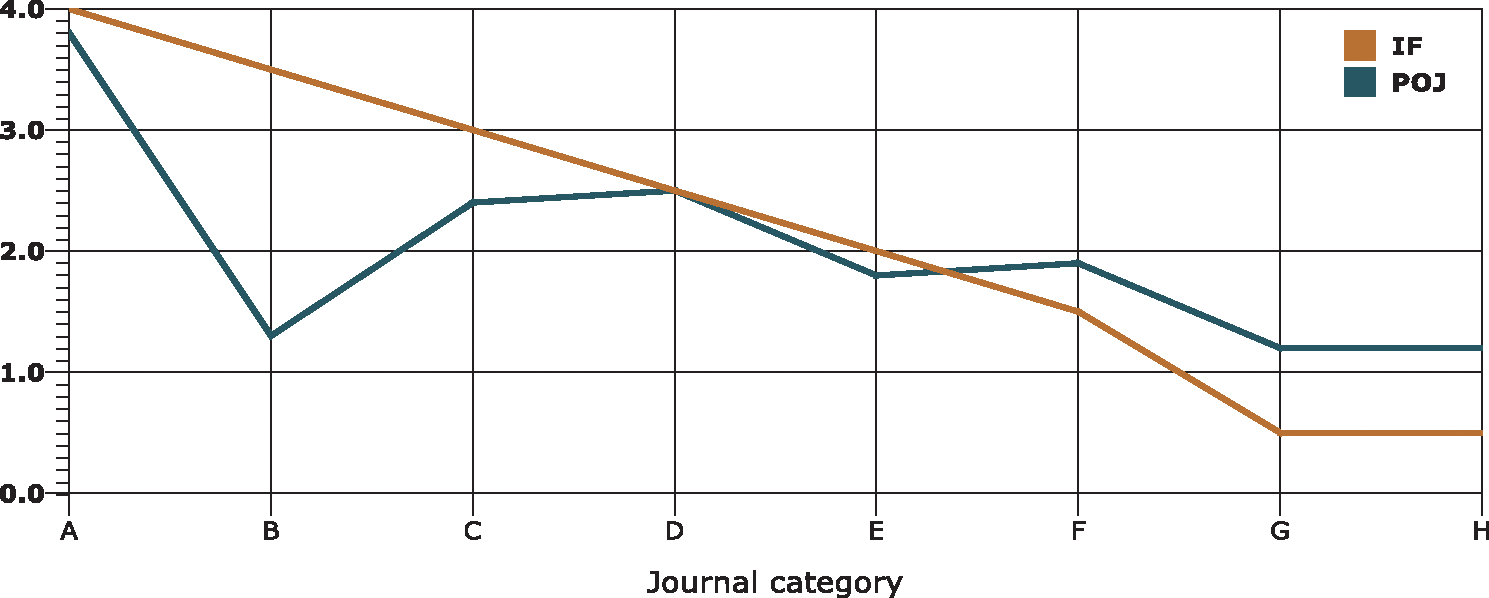
Figure 5: PoJ vs Impact factor
This study proposed a unified classifier for the ranking of science journals of different indexed databases. The metrics for journal evaluation are selected from existing journal ranking systems and one new indicator with the name of Prestige of Journal (PoJ) is introduced. Analysis of selected set of journals reveal that PoJ is better in the terms of precision and accuracy. In the current practice, the main limitation is that the parameters involved in computing PoJ are not explicitly stored in all the existing indexed databases. An indexing scheme that cover PoJ may be developed. The paper also proposed a journal classification system based on K means clustering and Naïve Bayes classification. The clusters obtained through K means are labeled by using a clustering labeling technique. This reduced bias that may be added to the ranking systems when non-machine inputs in qualitative assessments are taken into consideration. The complexity of K means clustering is high which is further increased by adding the algorithm of labeling clusters. Non-centroid based methods may be considered in the future to reduce the overall complexity of the technique. The new technique shows improvements that are not only validated empirically, but are also backed by qualitative discussion. The technique is different for the reasons given in section 5 and empirical comparisons are also presented in the same section.
Funding Statement: The authors received no specific funding for this study.
Conflicts of Interest: The authors declare that they have no conflicts of interest to report regarding the present study.
1. M. Shaheen, M. Shahbaz and A. Guergachi, “Context based positive and negative spatio-temporal association rule mining,” Knowledge-Based Systems, vol. 37, pp. 261–273, 2013. [Google Scholar]
2. M. Shaheen, F. Basit and S. Iqbal, “Labeled clustering: A unique method for labeling unsupervised classes,” in 8th Int. Conf. on Internet and Secured Transaction (ICITST-2013London, UK: IEEE UK/RI Computer Chapter, 2013. [Google Scholar]
3. M. Shaheen and M. Mehmood, “Knowledge discovery from scientometrics database,” in Lecture Notes in Engineering & Computer Science: Proc. World Congress on Engineering, pp. 156–160, 2019. [Google Scholar]
4. J. M. Campanario and A. Molina, “Surviving bad times: The role of citations, self-citations and numbers of citable items in recovery of the journal impact factor after at least four years of continuous decreases,” Scientometrics, vol. 81, no. 3, pp. 859–864, 2009. [Google Scholar]
5. E. Garfield, “The history and meaning of the journal impact factor,” Journal of the American Medical Association, vol. 295, no. 1, pp. 90–93, 2006. [Google Scholar]
6. M. E. Falagas, V. D. Kouranos, R. Arencibia-Jorge and D. E. Karageorgopoulos, “Comparison of SCImago journal rank indicator with journal impact factor,” FASEB Journal, vol. 22, no. 8, pp. 2623–2628, 2008. [Google Scholar]
7. T. Scientific, “ISI web of knowledge science citation index and journal citation report,” 2013. [Google Scholar]
8. S. J. Liebowitz and J. P. Palmer, “Assessing the relative impacts of economics journals,” Journal of Economic Literature, vol. 22, no. 1, pp. 77–88, 1983. [Google Scholar]
9. J. Arendt, “Are article influence scores comparable across scientific fields?,” Issues in Science and Technology Librarianship, vol. 60, no. 4, pp. 1–10, 2010. [Google Scholar]
10. C. Chang, M. McAleer and L. Oxley, “Journal impact versus eigenfactor and article influence”, Working Papers in Economics 10/67, University of Canterbury, Department of Economics and Finance, vol. 737, 2010. [Google Scholar]
11. J. E. Hirsch, “An index to quantify an individual’s scientific research output,” Proceedings of the National Academy of Sciences of the United States of America, vol. 102, no. 46, pp. 16569–16572, 2005. [Google Scholar]
12. P. Jacsó, “Comparison of journal impact rankings in the SCImago Journal & country rank and the journal citation reports databases,” Online Information Review, vol. 34, no. 4, pp. 642–657, 2010. [Google Scholar]
13. B. González-Pereira, V. Guerrero-Bote and F. Moya-Anegon, “The SJR indicator: A new indicator of journals' scientific prestige,” arXiv:0912.4141, 2009. [Google Scholar]
14. L. Colledge, F. de Moya-Anegón, V. Guerrero-Bote, C. López-Illescas, M.El Aisati et al., “SJR and SNIP: Two new journal metrics in Elsevier’s Scopus,” Serials: Journal for the Serials Community, vol. 23, no. 3, pp. 215–221, 2010. [Google Scholar]
15. J. Bar-Ilan, “Which h-index?—A comparison of WoS, Scopus and Google Scholar,” Scientometrics, vol. 74, no. 2, pp. 257–271, 2008. [Google Scholar]
16. L. Leydesdorff and T. Opthof, “Scopus’s source normalized impact per paper (SNIP) versus a journal impact factor based on fractional counting of citations,” Journal of the American Society for Information Science and Technology, vol. 61, no. 11, pp. 2365–2369, 2010. [Google Scholar]
17. J. K. Vanclay, “An evaluation of the Australian research council’s journal ranking,” Journal of Informetrics, vol. 5, no. 2, pp. 265–274, 2011. [Google Scholar]
18. H. F. Moed, “Measuring contextual citation impact of scientific journals,” Journal of Informetrics, vol. 4, no. 3, pp. 265–277, 2010. [Google Scholar]
19. M. Shaheen and M. Z. Khan, “A method of data mining for selection of site for wind turbines,” Renewable and Sustainable Energy Reviews, vol. 55, no. 7, pp. 1225–1233, 2015. [Google Scholar]
20. S. Wang and W. Shi, Data mining and knowledge discovery. In: Kresse, W., Danko, D. (eds.). Springer Handbook of Geographic Information, Springer Handbooks. Springer, Berlin, Heidelberg, pp. 49–58, 2011. [Google Scholar]
21. S. Amreshi and C. Conati, “Combining unsupervised and supervised classification to build user models for exploratory learning environments,” Journal of Educational Data Mining, vol. 1, no. 1, pp. 1–54, 2009. [Google Scholar]
22. M. Shaheen, M. Shahbaz, Z. ur Rehman and A. Guergachi, “Data mining applications in hydrocarbon exploration,” Artificial Intelligence Review, vol. 35, no. 1, pp. 1–18, 2011. [Google Scholar]
23. J. Poelmans, P. Elzinga, S. Viaene and G. Dedene, “Formal concept analysis in knowledge discovery: A survey,” In: Croitoru, M., Ferrá, S., Lukose, D. (eds.). Conceptual Structures: From Information to Intelligence, ICCS 2010. Lecture Notes in Computer Science, vol. 6208. Springer, Berlin, Heidelberg, pp. 139–153, 2010. [Google Scholar]
24. T. Kanungo, D. M. Mount, N. S. Netanyahu, C. D. Piatko, R. Silverman et al., “An efficient K-means clustering algorithm: analysis and implementation,” IEEE Transactions on Pattern Analysis and Machine Intelligence, vol. 24, no. 7, pp. 881–892, 2002. [Google Scholar]
25. J. A. Hartigan and M. A. Wong, “A K-Means clustering algorithm,” Applied Statistics, vol. 28, no. 1, pp. 100–108, 1979. [Google Scholar]
26. S. Z. Selim and M. A. Ismail, “K-Means-Type algorithm: Generalized convergence theorem and characterization of local optimality,” IEEE Transactions on Pattern Analysis and Machine Intelligence, vol. 6, no. 1, pp. 81–87, 1984. [Google Scholar]
27. M. Shaheen, M. Shahbaz, A. Guergachi and Z. Rehman, “Mining sustainability indicators to classify hydrocarbon development,” Knowledge-Based Systems, vol. 24, no. 8, pp. 1159–1168, 2011. [Google Scholar]
28. J. Wu and S. Coggeshall, Foundations of predictive analytics. Chapman & Hall/CRC Data Mining and Knowledge Discovery Series, Portland, OR, United States, 2012. [Google Scholar]
29. D. E. Holmes, J. Tweedale and L. C. Jain, “Data mining techniques in clustering, association and classification, ” in D. E. Holmes, L. C. Jain (eds.Data mining: Foundations and intelligent paradigms. Intelligent systems reference library, vol. 23. Berlin, Heidelberg: Springer, 2012. [Google Scholar]
30. Q. Wang, G. M. Garrity, J. M. Tiedje and J. R. Cole, “Naïve Bayesian classifier for rapid assignment of rRNA sequences into the new bacterial taxonomy,” Applied and Environmental Microbiology, vol. 73, no. 16, pp. 5261–5267, 2007. [Google Scholar]
31. G. Ridgeway, “Generalized boosted models: A guide to the gbm package,” 2007. https://pbil.univ-lyon1.fr/CRAN/web/packages/gbm/vignettes/gbm.pdf. [Google Scholar]
32. A. Prinzie and D. V. D. Poel, “Random multiclass classification: Generalizing random forests to random MNL and random NB,” in R. Wagner, N. Revell, G. Pernul (eds.Database and expert systems applications. Lecture Notes in Computer Science, vol. 4653. Berlin, Heidelberg: Springer, 2007. [Google Scholar]
33. S. Iqbal, M. Shaheen and F. Basit, “A machine learning based method for optimal journal classification,” in 8th Int. Conf. for Internet Technology and Secured Transactions (ICITST-2013London, UK: IEEE UK/RI Computer Chapter, 2013. [Google Scholar]
34. V. P. Guerrero-Bote,and F. Moya-Anegon, “A further step forward in measuring journals’ scientific prestige: The SJR2 indicator,” Journal of Informetrics, vol. 6, no. 4, pp. 674–688, 2012. [Google Scholar]
35. D. Butler, “Free journal-ranking tool enters citation market,” Nature, vol. 451, no. 6, 2008. [Google Scholar]
 | This work is licensed under a Creative Commons Attribution 4.0 International License, which permits unrestricted use, distribution, and reproduction in any medium, provided the original work is properly cited. |