DOI:10.32604/iasc.2021.017478
| Intelligent Automation & Soft Computing DOI:10.32604/iasc.2021.017478 | |
| Article |
Machine Learning Based Framework for Classification of Children with ADHD and Healthy Controls
Computer Science and Engineering Department, Thapar Institute of Engineering and Technology, Patiala, Punjab, India
*Corresponding Author: Anshu Parashar. Email: aparashar@thapar.edu
Received: 27 January 2021; Accepted: 01 March 2021
Abstract: Electrophysiological (EEG) signals provide good temporal resolution and can be effectively used to assess and diagnose children with Attention Deficit Hyperactivity Disorder (ADHD). This study aims to develop a machine learning model to classify children with ADHD and Healthy Controls. In this study, EEG signals captured under cognitive tasks were obtained from an open-access database of 60 children with ADHD and 60 Healthy Controls children of similar age. The regional contributions towards attaining higher accuracy are identified and further tested using three classifiers: AdaBoost, Random Forest and Support Vector Machine. The EEG data from 19 channels is taken as input features in individual and combinatorial sets to classifiers. Evaluating all the classifiers' overall performance, the highest accuracy of 84% is obtained with the AdaBoost classifier when all the Right Hemisphere channels are taken into consideration. The higher sensitivity of 96% indicates a better true positive detection rate of the model created with the Right Hemisphere features. This study highlights the intrinsic physiological contrast prevalent in brain activity of ADHD and healthy children, which can be effectively utilized for diagnostic purposes.
Keywords: Attention deficit hyperactivity disorder; classification; electroencephalography; adaboost; random forest; support vector machine; machine learning
Attention Deficit Hyperactivity Disorder (ADHD) is a neuro-developmental disorder most commonly diagnosed in children referred to psychiatric clinics. Children with ADHD are often unaware of their surroundings and are unable to sit still in one place. The disorder inhibits learning essential skills such as self-control and focuses, which hinders children's overall development. The clinical symptoms include impairment in cognitive attentiveness and behavioral abnormality such as high impulsivity/hyperactivity. The worldwide prevalence of ADHD is estimated close to 5% in children [1] and approximately 2.5% is found in adulthood [2]. ADHD has a negative impact on all aspects of the life of a child. Children with ADHD have to bear academic losses due to inattention and behavioral spontaneity, which inhibit them in executing demanding or repetitive tasks by nature. Parenting a child with ADHD is often challenging as it demands continuous monitoring of the child due to impulsive behaviour. The situation becomes more grim when ADHD gets extended from childhood to adulthood which further upsets the professional and personal life of the person. The diagnosis of ADHD in clinical setups is based on the widely adopted diagnostic manuals ICD-11 and DSM-5. The information collected from parents /caretakers and neuropsychological assessments of several clinical rating scales defined for ADHD form the basis for the diagnosis. ADHD shows high comorbidity with many other psychiatric disorders such as autism spectrum disorders, intellectual disorders, motor disorders, conduct disorder, and tic disorders [3]; the clinical psychologist's experience, judgment, and interpretation are paramount for accurate diagnosis of ADHD. Most of the performed tests involve rating scales that are highly subjective and may vary from one clinician to another. Therefore, the development of diagnostic models for the classification of ADHD has been on the scientific community's radar for a long. Neurophysiological techniques such as Electroencephalography (EEG) involving the recording of signals emanating from the brain can be beneficial for developing diagnostic models that could be put into clinical practise as an adjunct to the subjective diagnosis made by psychiatrists.
So far, many researchers have made contributions in this direction. Magee et al. [4] differentiated 253 ADHD children from 67 age-matched controls by examining the EEG signals acquired under eyes-closed resting conditions. The classification results using logical regression yielded an accuracy of 87% with a sensitivity of 89% and specificity of 79.6%. Lee et al. [5] used frontal lobe electrodes and wavelet-based features from these two channels' signals. Further, they used self-organizing maps to obtain ADHD and normal clusters and achieved 60% overall accuracy. Allahverdy et al. [6] differentiated ADHD and control groups by exploring nonlinear EEG features' utility. For this purpose, MLP neural network classifier was used that led to a regional classification of 86% from the frontal region, 61 % from parietal, 62% from the central region, and 56% from the occipital region. The overall accuracy after combining features of all the electrodes was 68.6%. Helgadóttir et al. [7] investigated classification accuracies in a huge cross-sectional study comprising 310 adolescents with ADHD and 351 controls. The approach followed included the construction of two classification models, namely the age-independent model or age-dependent model. It was eventually concluded that the age-specific classification approach yielded a higher accuracy of 76% than the age-independent model(73%). As an important observation, Poil et al. [8] reported that ADHD effects on EEG strongly depend on age and EEG frequencies. ADHD adults were classified using an SVM classifier with frequency powers in alpha and beta power with a sensitivity of 67% and specificity of 83%. However, the ADHD children could not be classified satisfactorily, with sensitivity remaining 56% and specificity at 70%. The authors remarked SVM as a useful tool for the classification of adults with ADHD but not children with ADHD. Mohammadi et al. [9] tested nonlinear features obtained from EEG under a cognitive attention task for classification accuracies. An accuracy of 92.28 % was achieved after employing minimum Redundancy Maximum Relevance feature selection method with Multi-Layer Perceptron with one hidden layer with five neurons used for classifying 30 children with ADHD from 30 similar age controls. Yang et al. [10] analyzed Event-Related Potentials (ERP) obtained from prefrontal and inferior parietal regions 14 ADHD children and 16 age-matched controls under a spatial Stroop task for classification accuracies. K-Nearest Neighbors (K-NN) and Support Vector Machine (SVM) classifiers were applied, and high accuracy-83.33 % was obtained through the K-NN classifier compared to 56.42% achieved through SVM. Pereda et al. [11] analyzed functional connectivity-based features obtained from EEG signals to classify a total of 33 children into ADHD or healthy controls. The Bayesian Network Classifier machine learning algorithm was applied and a classification rate of 95 % is reported for the high dimensional feature set. It got reduced to 80% if functional connectivity based algorithms were taken into consideration for feature selection. High dimensionality makes the model complex and also hard to implement in the real-time scenario. Khoshnoud et al. [12] investigated the resting state EEG of children with ADHD for diagnostic accuracies. The dataset comprised of 12 ADHD and 12 age-matched normal children. The nonlinear features from the EEG signals and accuracies were obtained through SVM and radial Basis function Neural Network. The classification accuracy- 83.33% was obtained after testing with 4-fold cross-validation. Chen et al. [13] evaluated the Support Vector Machine (SVM) effectiveness in classifying ADHD Children from their Healthy counterparts using resting-state EEG. The classification model yielded an accuracy of 84.59% and an Area Under Curve (AUC) of 0.9158. The results showed the sensitivity of prediction accuracy changes with the brain regions selected for analysis. In a recent study; Altınkaynak et al. [14] analyzed nonlinear features from the ERP signals of 23 unmedicated ADHD children and 23 healthy controls; all of whom performed an oddball auditory task. Many classification models were obtained using machine learning techniques such as Support Vector Machines, Naive Bayes, Random forest, Multilayer perceptron, K- Nearest Neighbors, AdaBoost, and Logistic Regression. Among all, the Multilayer perceptron outperformed other classifiers in distinguishing ADHD children from controls with a high classification outcome of 91.3%. Vijh et al. [15] proposed CNN based classifier for the detection of tumour in the lungs. Jindal et al. [16] propose fuzzy rule-based classifier for health-sector. Jiang et al. [17] integrated CNN and machine learning to predict colon cancer prognosis of stage 3 patients. Aujla et al. [18] proposed deep learning based recommender system for health-sector. Einizade et al. [19] applied graph-based signal processing measures to develop EEG based diagnostic model for children with ADHD. The EEG signals were obtained from an open-access dataset. The structural and functional features obtained from EEG signals led to 79.03% and 82.36% detection accuracy. The fused feature set further led to an even higher classification accuracy of 93.47%. Khaleghi et al. [20] differentiated resting-state EEG signals of 30 children with ADHD in the age group of 7-12 years with EEG signals of 30 healthy controls. The diagnostic accuracy through classification models is evaluated through the KNN classifier. The highest accuracy of 86.40% was reported when nonlinear features are used compared to linear and morphological features.
As primary contribution, our work is intended towards finding out the importance and contribution of different brain regions in the classification of children with ADHD from healthy controls. Every brain region exhibits a different electrical activity level, which depends on the condition under which EEG acquisition is made and how different regions are connected. The regional differences in electrical activity results because of variation in the amount of regional blood flow, non-uniform connectivity between different regions, and brain regions' contributions towards processing the incoming stimuli. The frontal region plays a vital role in attention and concentration, reasoning and judgment; Parietal and Central region is responsible for processing senses, motor or body movement; the temporal region is responsible for memory and learning, understanding language; Occipital lobe is responsible for the vision and object recognition. Also, the brain is split into two halves, namely left and right hemisphere, each of which controls different functions. The left hemisphere is believed to be more involved in analytical thinking, whereas the right hemisphere is related with imagination and holistic thinking. Individuals with ADHD have information processing deficits in the right hemisphere. For example, atypical lateralization with poor right hemisphere processing has been linked to self-reported inattention symptoms [21]. Therefore, it is interesting to determine whether individual [Frontal, Parietal, Central, Temporal, Occipital] or interhemispheric regions (left vs. right) or signals from the combinatorial sets of these different regions contribute towards high accuracy rates. This research investigation will reveal regional contrasts in EEG activity of children with ADHD and their healthy counterparts which will help understand this disorder at large.
This paper is organized as follows. Section 2 discusses materials and proposed methodology. Section 3, provided experimental results and discussion. Finally, Section 4 concludes the paper.
The framework for the Machine Learning-based Classification of ADHD is illustrated in Fig. 1. The different machine learning algorithms have been applied to ADHD state of the art datasets in order to perform the comparative analysis. For the experimentations, we have used Python language and its inbuilt library namely Scikit-learn for implementing machine leaning models. Here, AdaBoost [22], SVM [23], and Random Forest [24] ML algorithm are applied on ADHD data set, and extensive experimentation has been conducted for 1) selection of an appropriate combination of the features that could contribute more for achieving the desired level of prediction accuracy. 2) Selection of appropriate machine learning algorithm for getting better prediction accuracy.
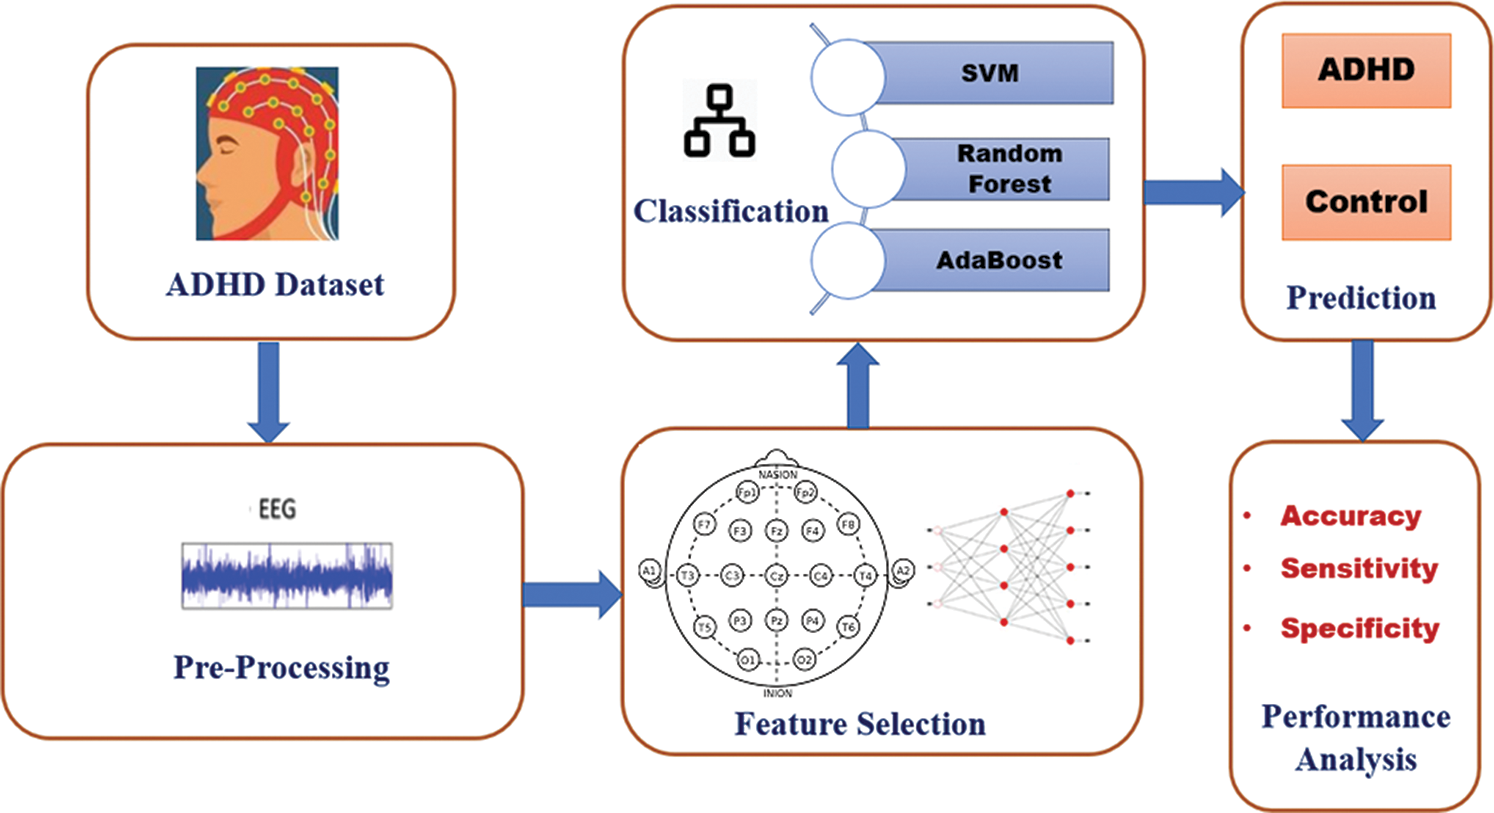
Figure 1: Framework for the classification of ADHD and healthy controls
In this study, EEG recordings were obtained from an open-access database of 60 children with ADHD and 60 age-matched Healthy Controls [25]. In this dataset, EEG recordings are sampled at 128 Hz, and a total of 19 channels (Fz, F7, F8, Fp1, Fp2, Cz, T3, C4, T4, F3, T6, O1, F4, P3, Pz, C3, P4, T5, O2) are available. The dataset is preprocessed and free from artifacts. The EEG signals have been captured under a cognitive task in which children were asked to count the number of characters in the cartoon character pictures shown to them. The picture's size is good enough that it is properly visible to the children’s and the number of characters in each image is a random number between 5 and 16.
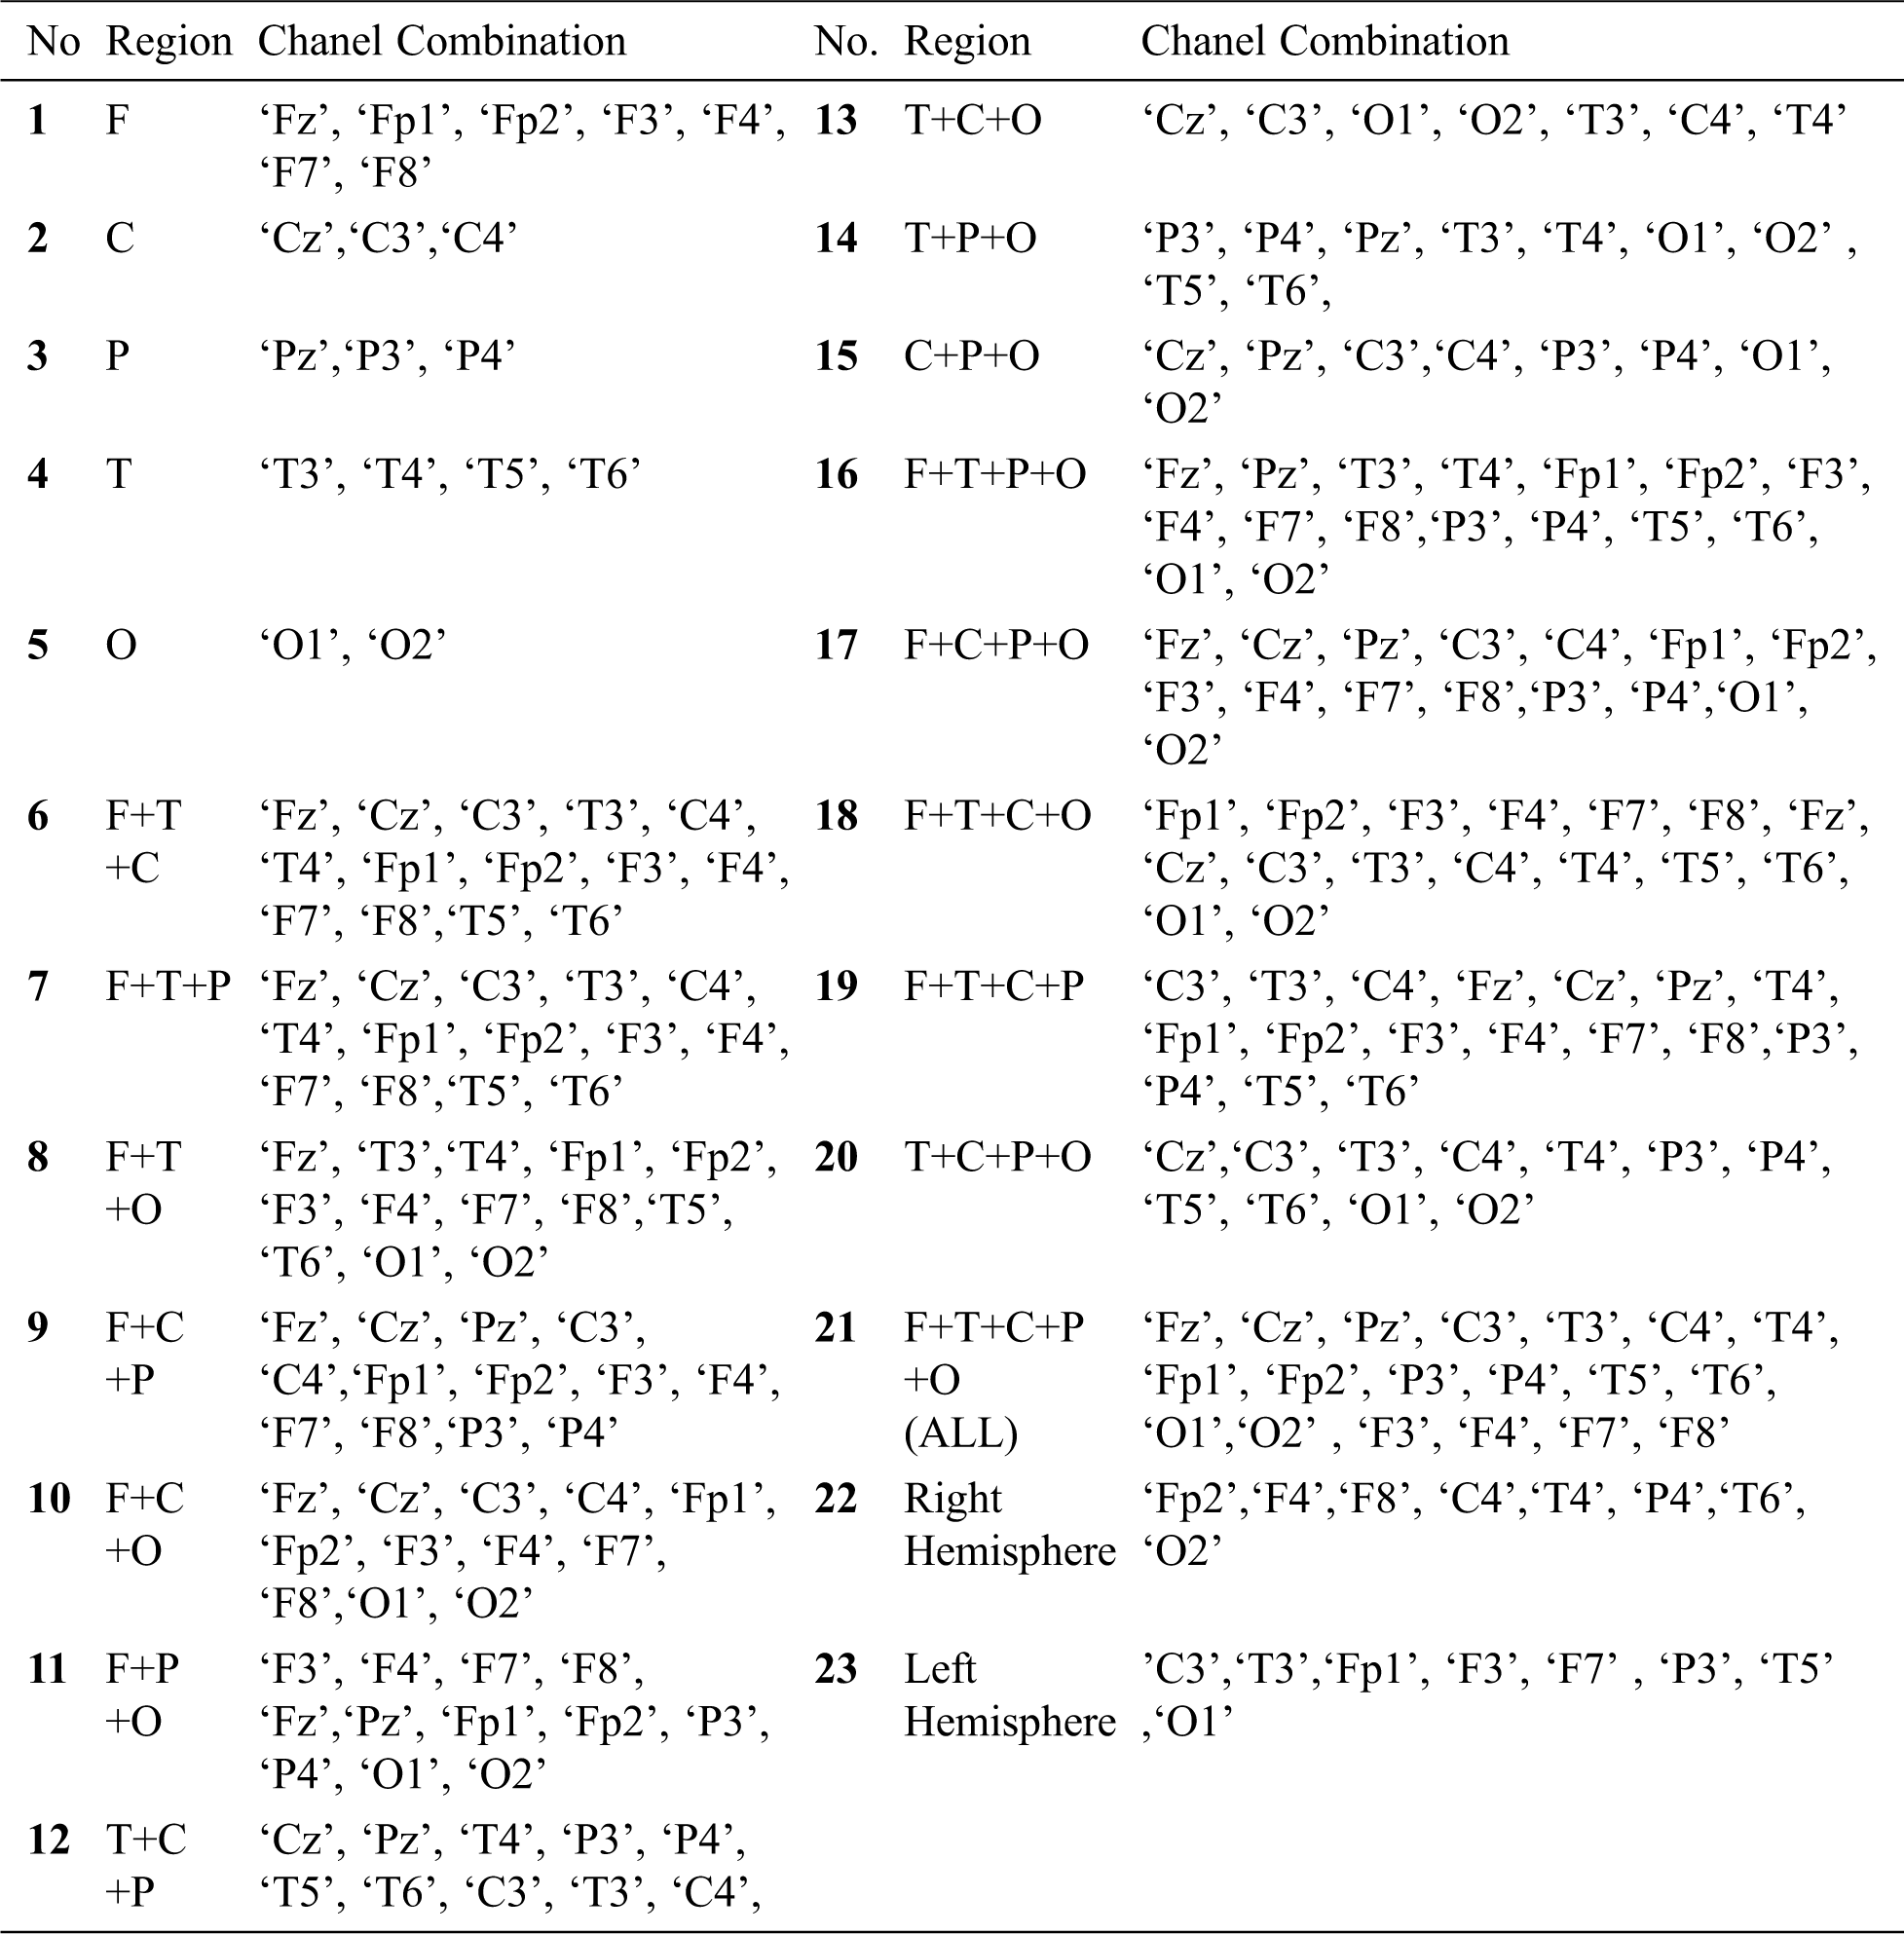
Table 1: Channel combinations considered for classification
As all children’s exhibits different performance behaviour in the cognitive tasks, so the total time duration of EEG recordings varies across the dataset.
The EEG data from 19 channels (Tab. 1) is taken as input features in individual and combinatorial sets to the classifiers. The entire feature set is partitioned into various combinations of Frontal(F), Central(C), Parietal(P), Temporal(T), and Parietal(P) regions were created as shown in Tab. 1. Here, each EEG signal/channel namely: Fz, F7, F8, Fp1, Fp2, Cz, T3, C4, T4, F3, T6, O1, F4, P3, Pz, C3, P4, T5 and O2 are considered as channel features available under the ADHD dataset.
After extracting the different combinations of the feature channels, The feature set is given as input to Support Vector Machine, Random Forest, and AdaBoost machine learning algorithms. The detailed working of these algorithms has been detailed as follows.
Random Forest is the most popular supervised classification technique. Random forests select some dataset randomly and create a decision tree based on that. Random forest works on the concept of bagging, in which it selects new datasets in every iteration and creates a decision tree for the new dataset. In other words, Random Forest splits that dataset into sub-datasets and creates a decision tree for each sub-dataset. In the prediction phase, the prediction is taken from every decision tree. Finally, it selects the prediction result by majority voting value. To overcome the problem of over-fitting, Random forest is considered as an ensemble classifier which prediction rate is better than the decision tree because of averaging the results. The working is diagrammatically represented in Fig. 2. The algorithm for the Random Forest classifier is detailed as follows:
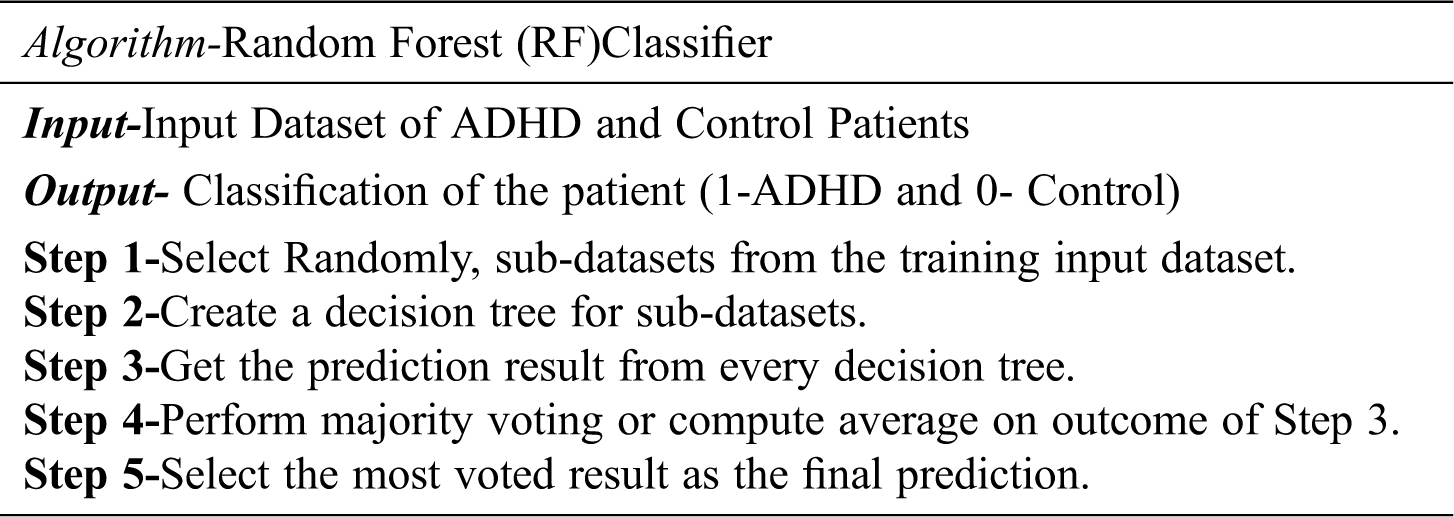
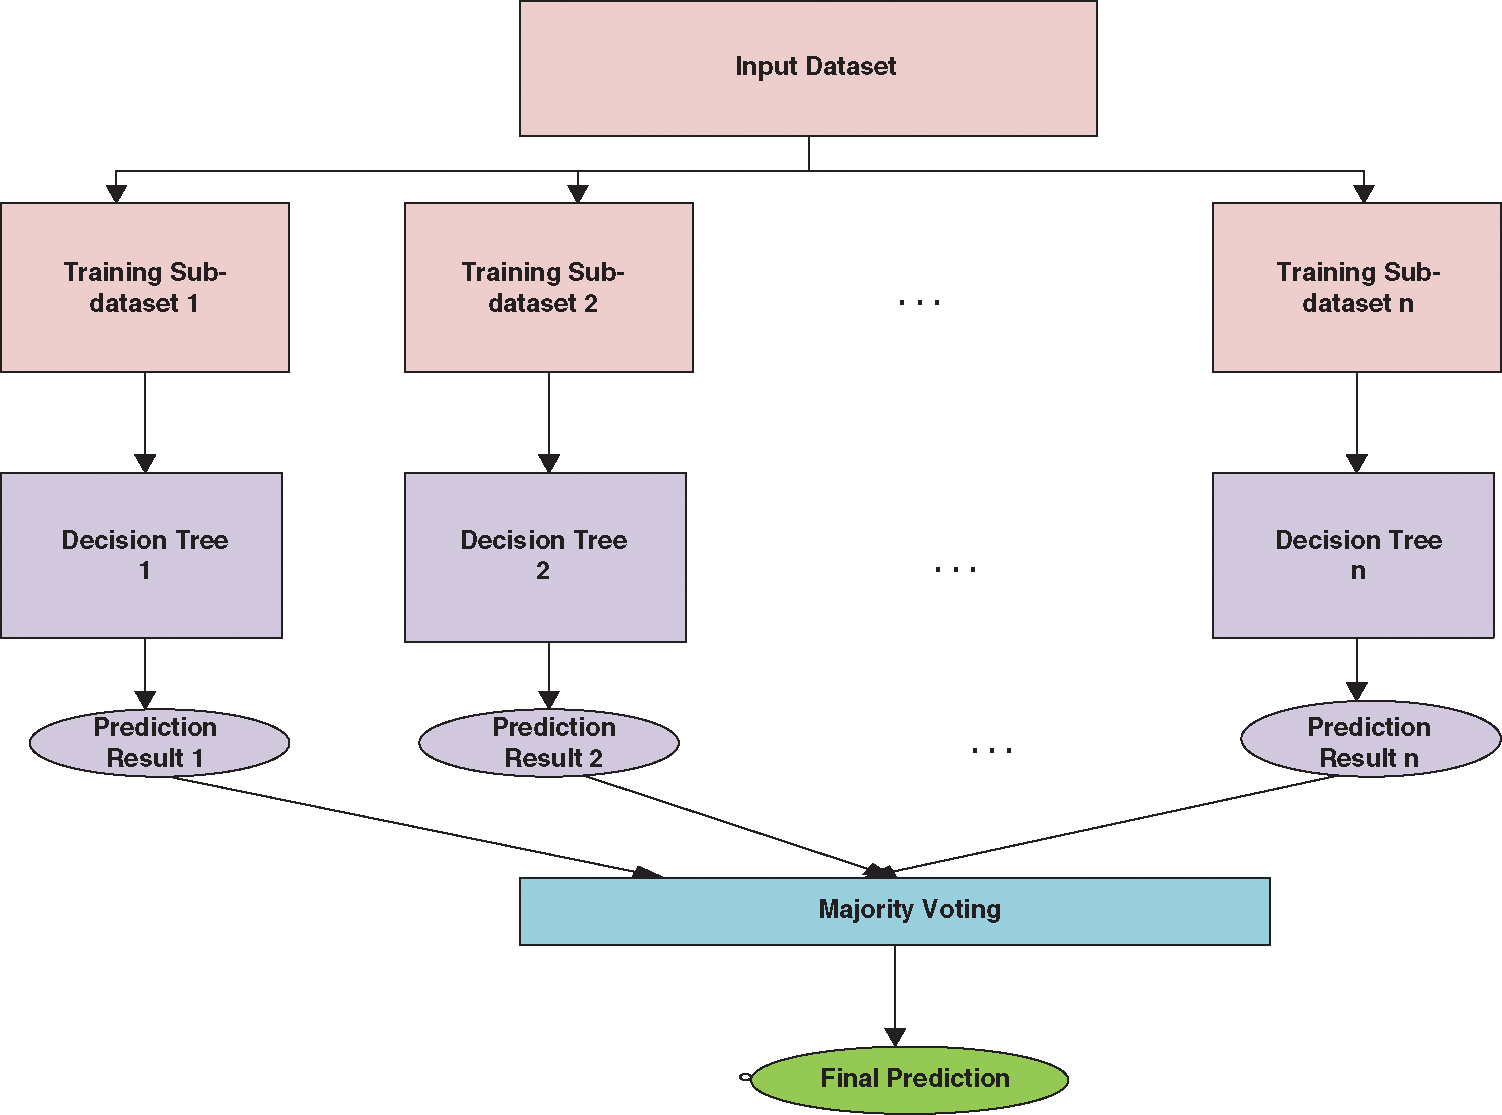
Figure 2: Working of random forest classifier
2.2.2.2 Support Vector Machine (SVM)
SVM is a supervised classification technique. During the training phase, the Support vector machine represents all data values as points in multidimensional space. Then SVM builds a hyperplane between entities of various classes. SVM tries to build the best hyperplane in an iterative manner such that there is a minimal false-positive rate. In other words, SVM tries to build a hyperplane with a maximum margin level so that the dataset is divided into appropriate classes. In the testing or prediction phase, new dataset values are also represented in the same multidimensional space and are classified into some class depending upon the proximity to the hyperplane. Fig. 3 describes the working of SVM classifier. The algorithm for the SVM classifier is detailed as follows:
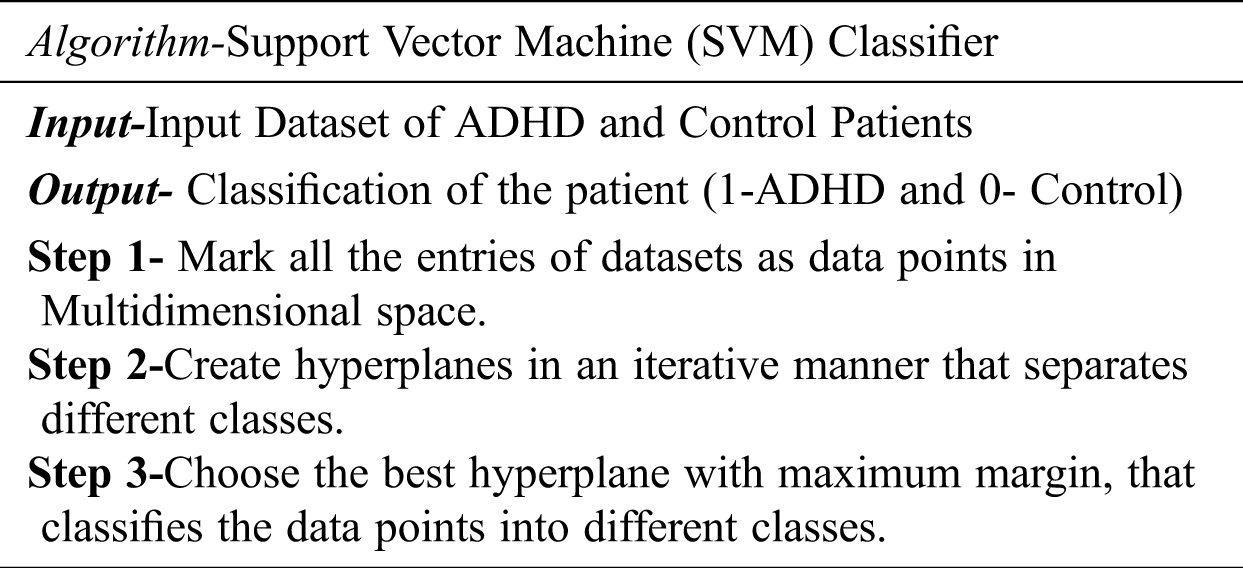
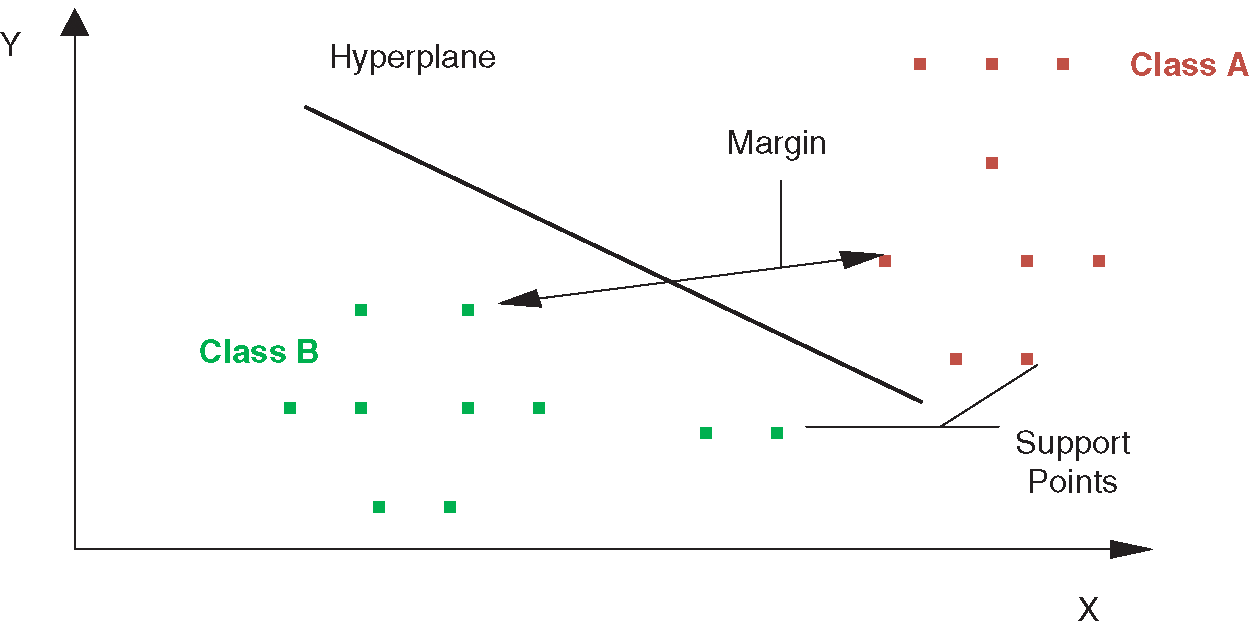
Figure 3: Working of SVM classifier
AdaBoost is an ensemble-based classifier that works on the principle of obtaining a strong classifier by merging weak classifiers. Strong or weak are in terms of classification accuracy. Fig. 4 shows the working of ADA Boost Classifier.
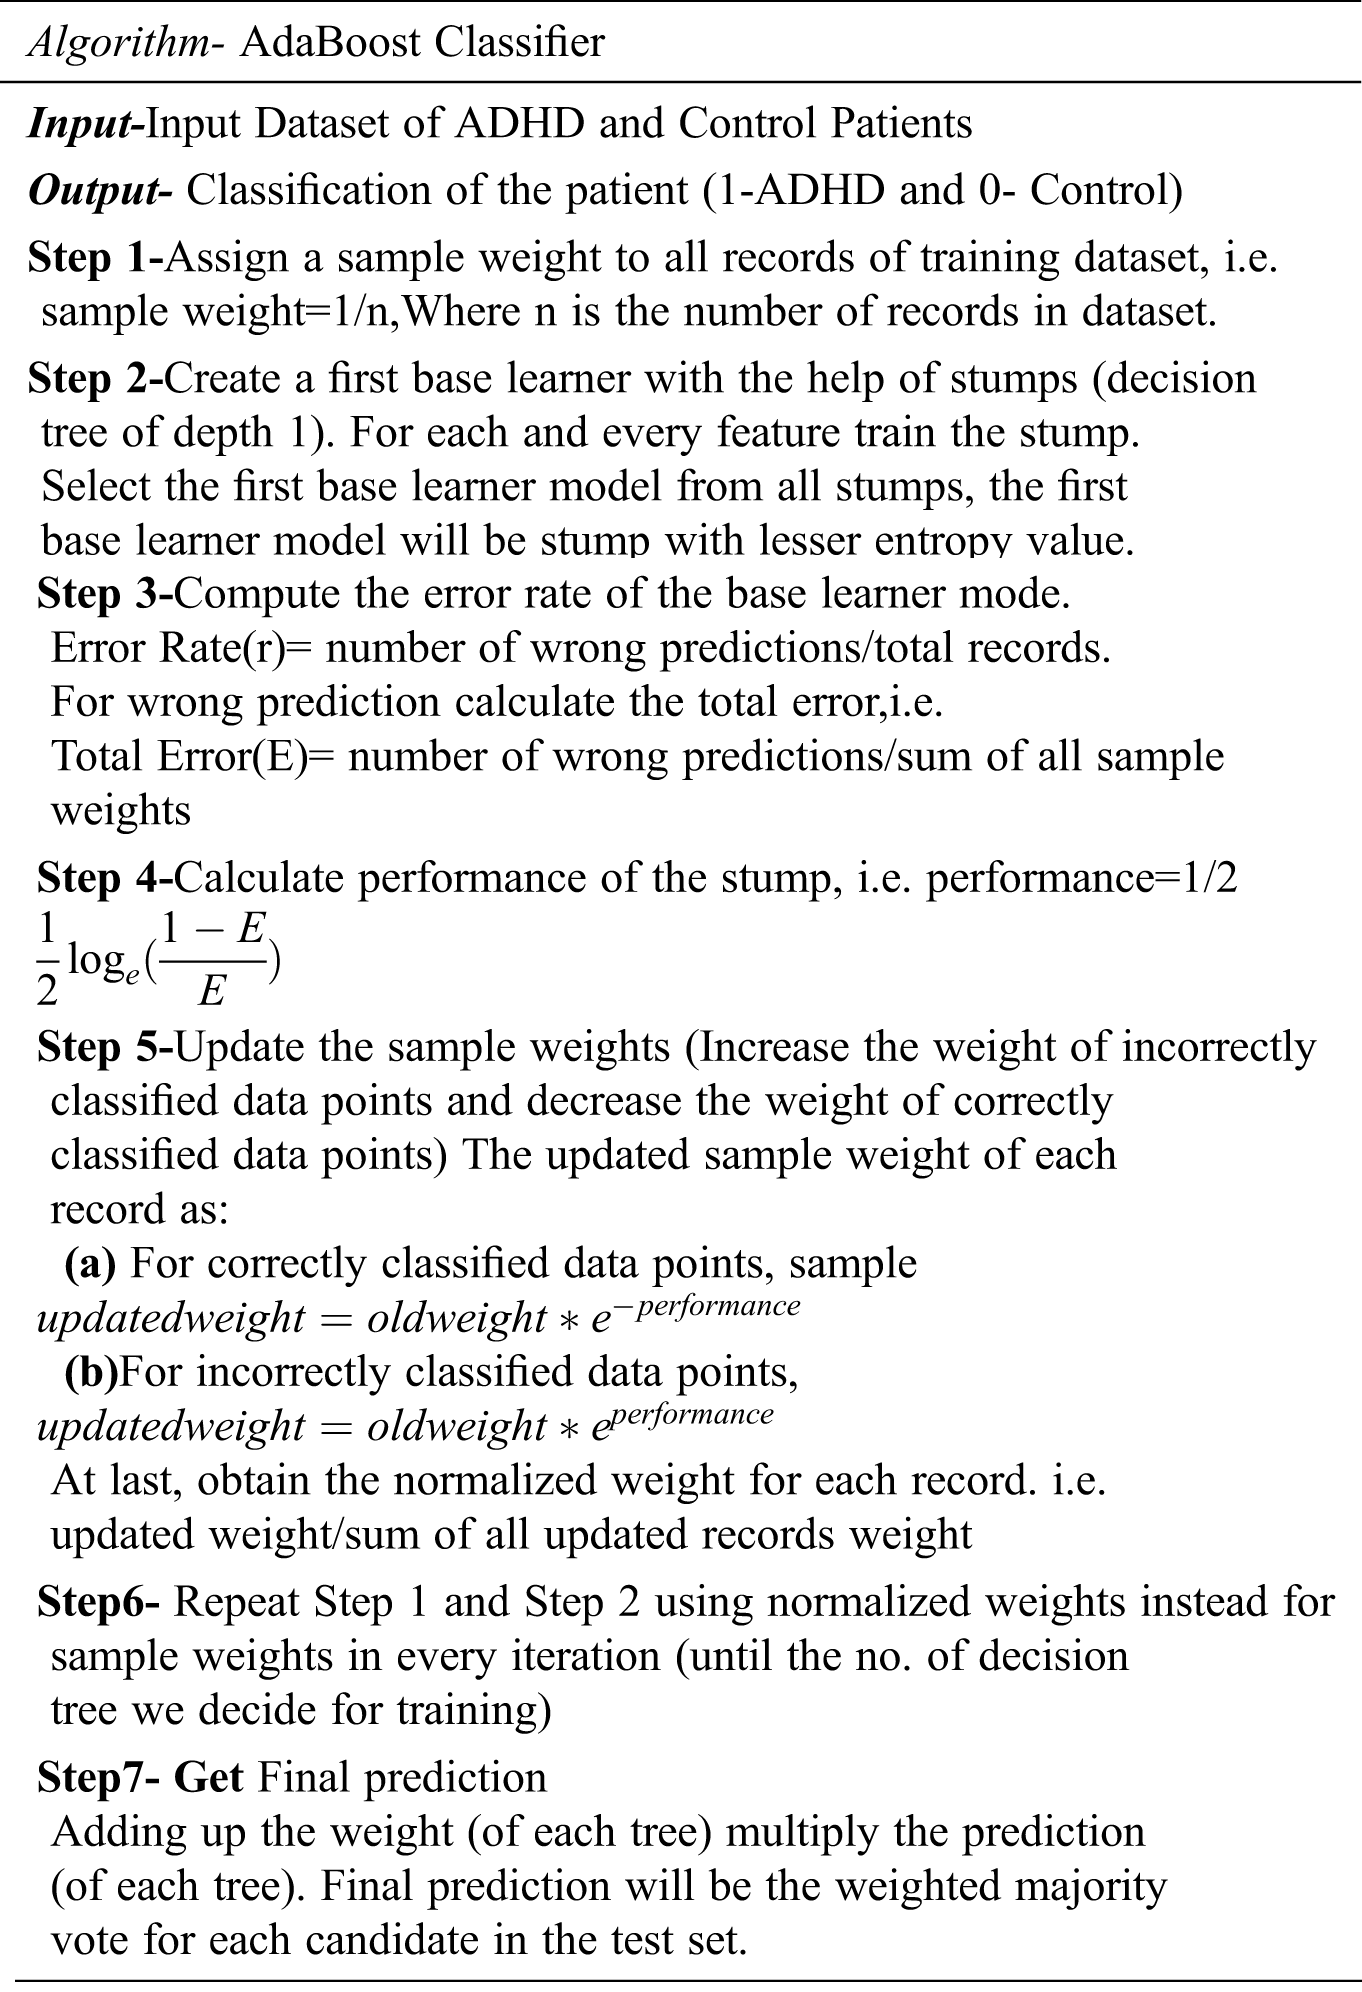
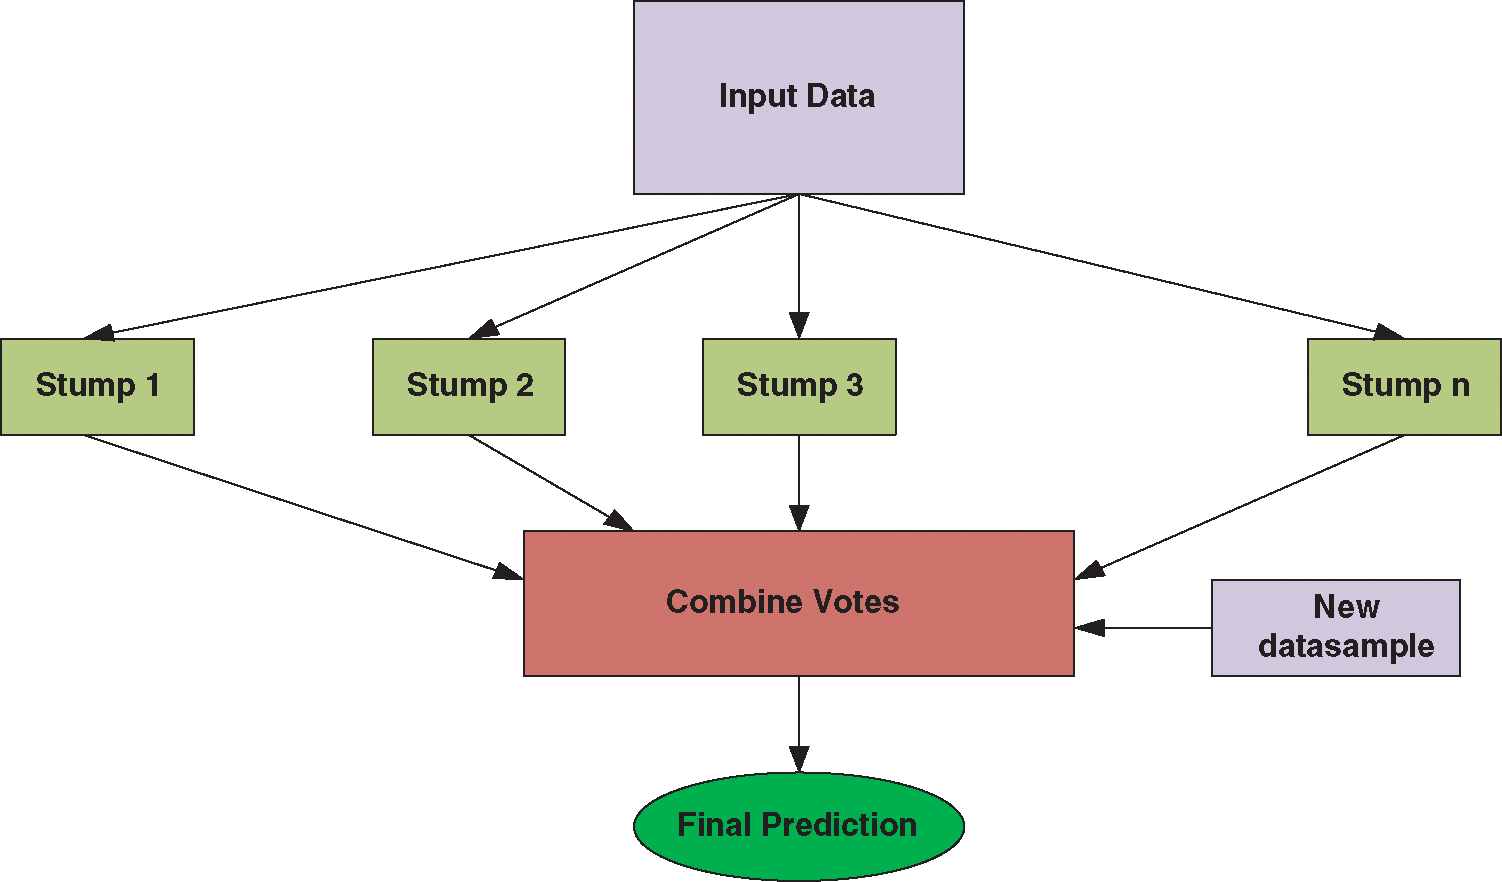
Figure 4: Working of ADA boost classifier
In other words, AdaBoost converts weak classification algorithms into good classification algorithms. In AdaBoost, multiple decision trees will be created in a sequential manner, and in the next model, only misclassified data points will be given for training.
The comparative analysis has been done by comparing the performance measures computed for all the stated feature/classifier combinations. The motive behind this is to determine which channel/feature and classifier combinations are giving better performance based on Accuracy, Sensitivity, and Specificity, as shown in Eqs. (1) and (2). The detailed experimental results and their analysis have been mentioned in the following section.
Tab. 2 presents the classification results when individual regions are considered for distinguishing ADHD and Controls. It is observed that, when AdaBoost classifier is used with input channels of Parietal region, the classification accuracy is maximum [Accuracy = 0.82%, Sensitivity = 81%, and Specificity = 83%]. Among all the three classifiers, the linear classification model implied through the Support Vector machine showed overall poor performance [Average: Accuracy = 51%, Sensitivity = 54.6%, and Specificity = 56%]. Since EEG signals are non-linear in nature and as the AdaBoost classifier is efficient in learning non-linear boundaries, the AdaBoost classifier's performance is betterthan the SVM's performance classifier with RBF Kernel when individual channels are considered. The findings from Tab. 4 highlights significant contributions of electrophysiological activity of bilateral (P3 and P4) and midline (Pz) regions in distinguishing children with ADHD from their healthy counterparts. Fig. 5 shows the values of Area under the Curve (AUC) when channels of individual regions are considered. It is inferred that the relationship (AUC) between the true positives rate and the false positive rate is higher in the model developed with the AdaBoost classifier when channels from parietal regions are taken into consideration.
Table 2: Classification performance with individual regional channels
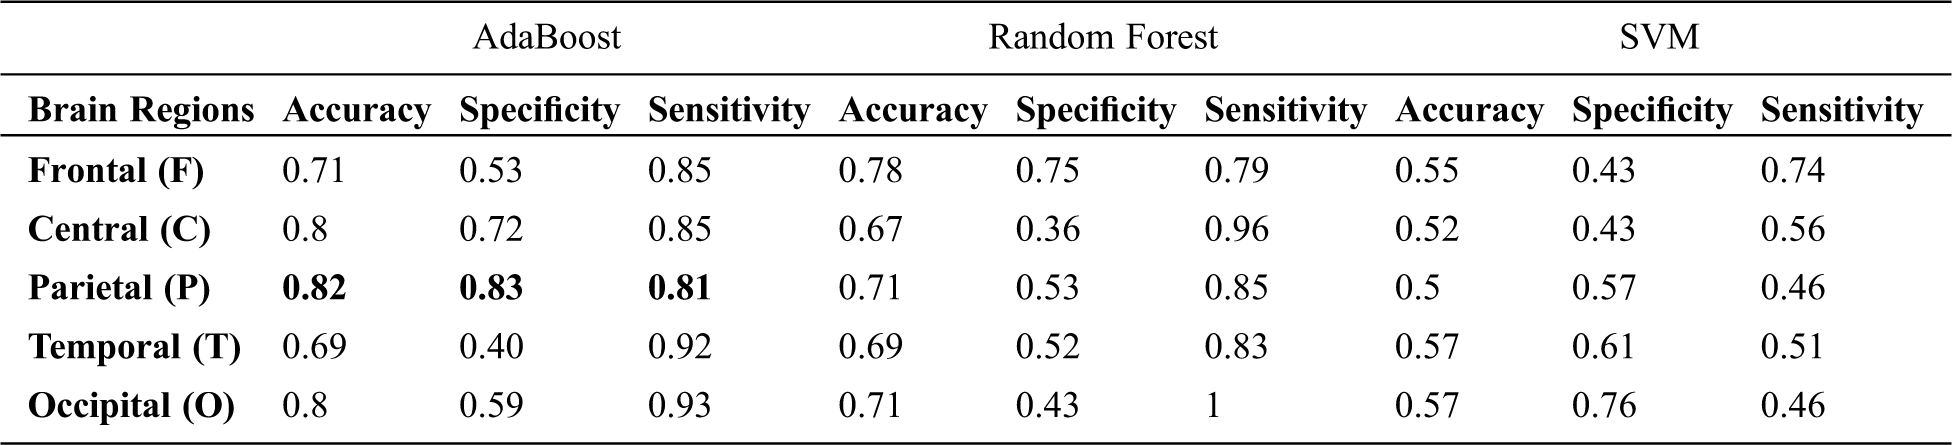
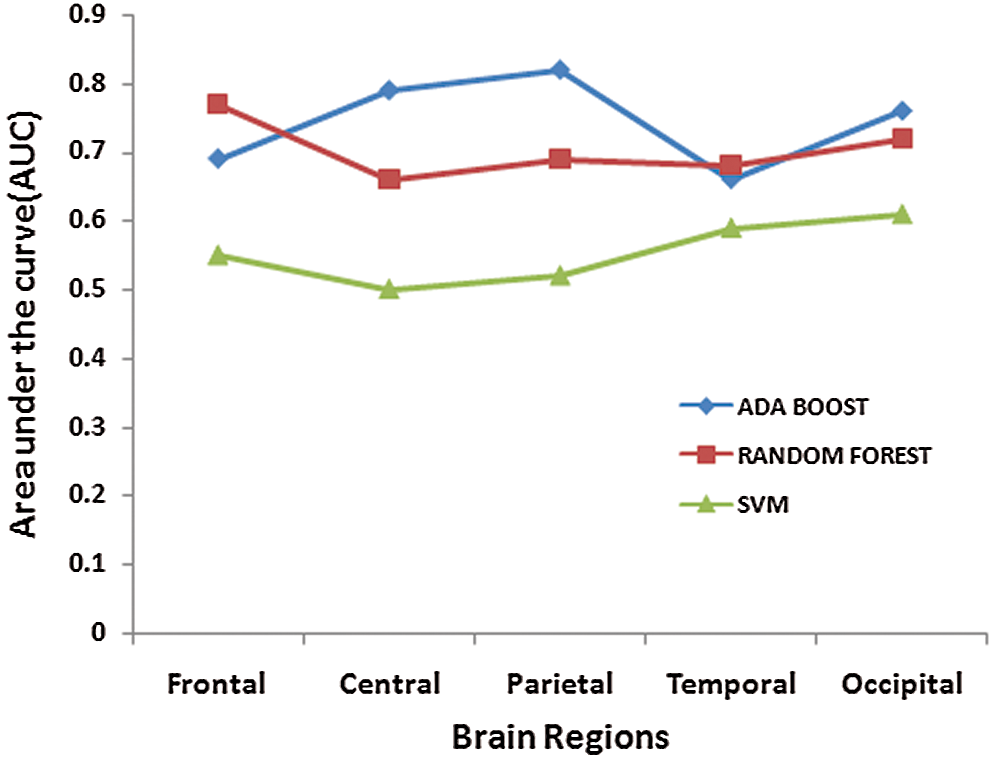
Figure 5: ROC curve for the individual portion of the brain
Tab. 3 presents the classification results when a set of 3 different regional combinations are taken into consideration for classifying ADHD and Controls. When Random forest classifier is used with input set consisting of Frontal, Central and Occipital regions, it is observed that gave the highest accuracy rate [Accuracy = 82%, Sensitivity = 92% and Specificity = 70% ]. The frontal and Central regions are found to be common in combinations (Frontal + Temporal + Central) and (Frontal + Central + Occipital) which have reported higher accuracy levels. This highlights the role of Frontal and Central regions which are associated with attention-related cognitive deficits. ADHD students face huge impairments in Focused and Sustained attention; the contribution of these common regions in the classification of ADHD and Controls is of higher significance here. Among all the three classifier’s, Support Vector Machine showed poor performance on all the combinatorial sets [Average: Accuracy = 56.3%, Sensitivity = 51%, Specificity = 61% ]. Fig. 6 depicts the Area under the Curve (AUC) values when channels from 3 different regions are considered.
Table 3: Classification performance with three regional combinatorial sets.
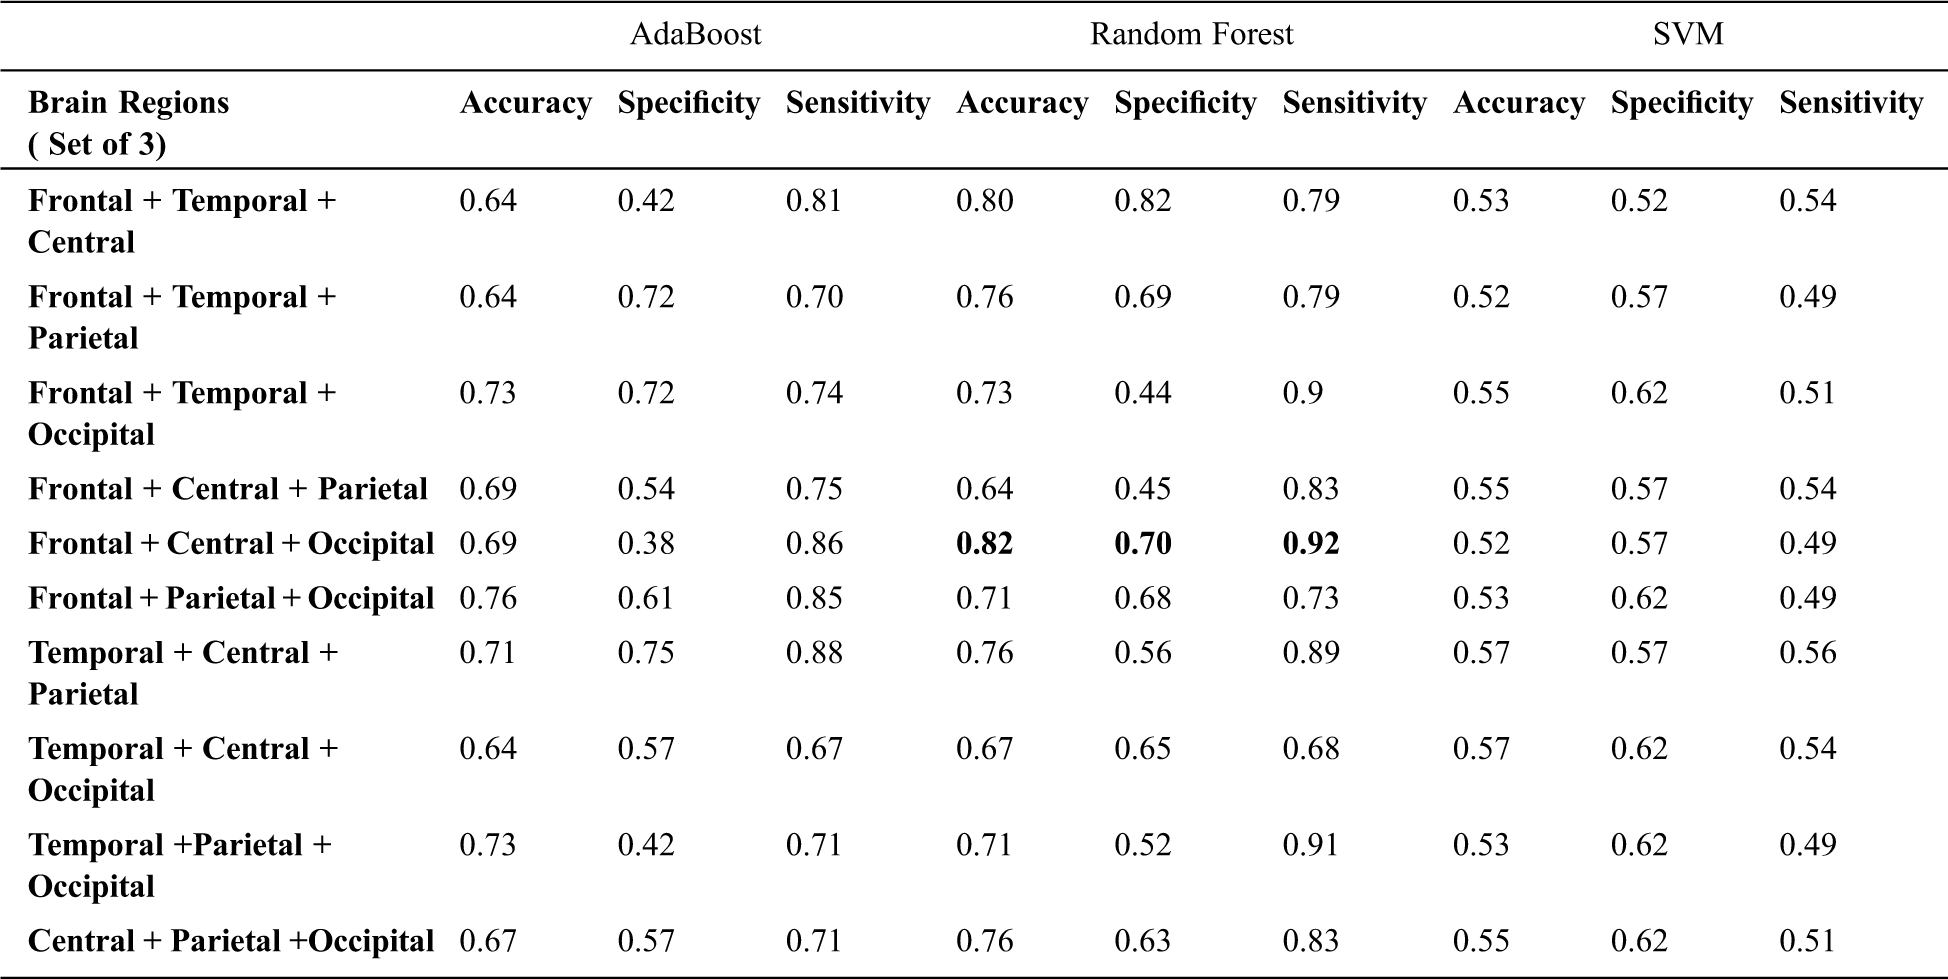
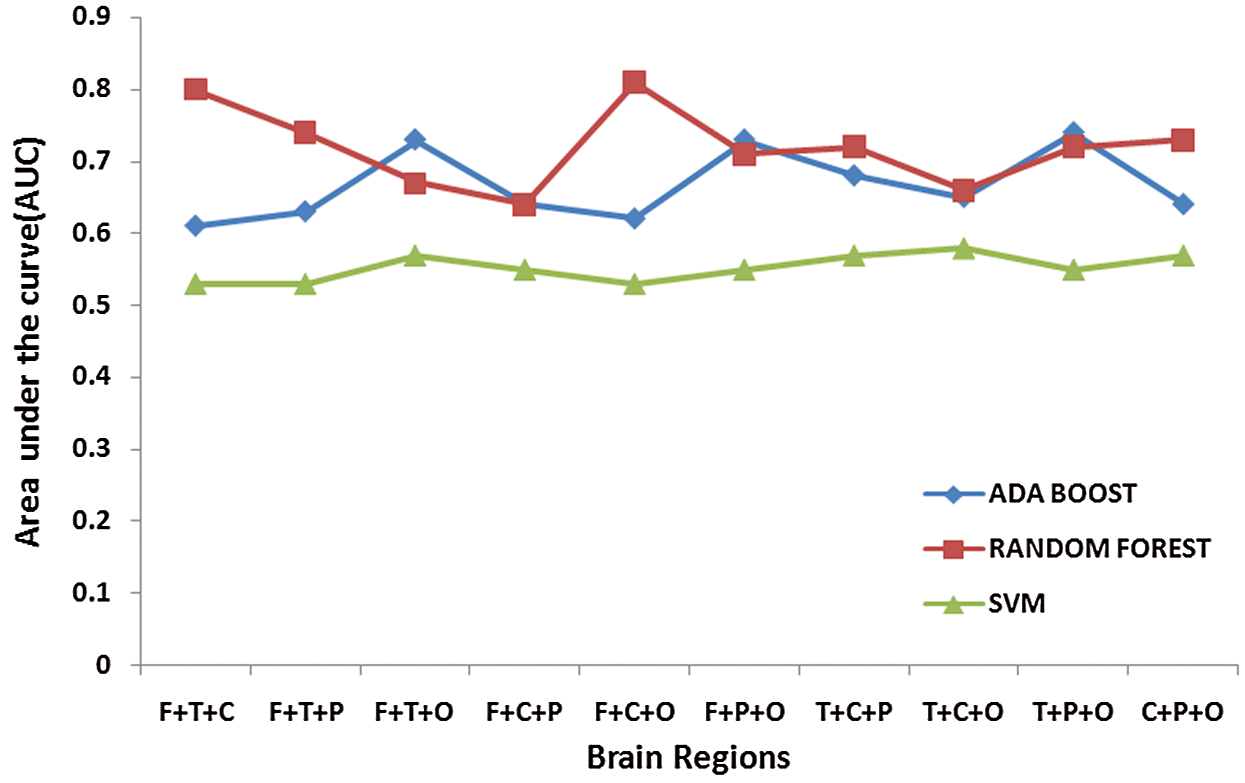
Figure 6: Area under the Curve (AUC) values for three regional combination sets
Further, the combinatorial sets consisting of 4 regions are created and tested for classification accuracies. From Tab. 4, it is found that the combinatorial set consisting of channels of Frontal, Temporal, Central, and Parietal regions exhibited a better classification rate [Accuracy = 82%, Sensitivity=92%, Specificity =70%] as compared to some other combinatorial sets as shown in Tab. 4. The frontal, temporal and parietal regions are part of dorsal and ventral attentional networks and thus have higher significance in classifying ADHD children from Healthy controls. Fig. 7 shows the values of Area under the Curve (AUC) when channels from 4 different regions are considered.
Table 4: Classification performance with four regional combinatorial sets.

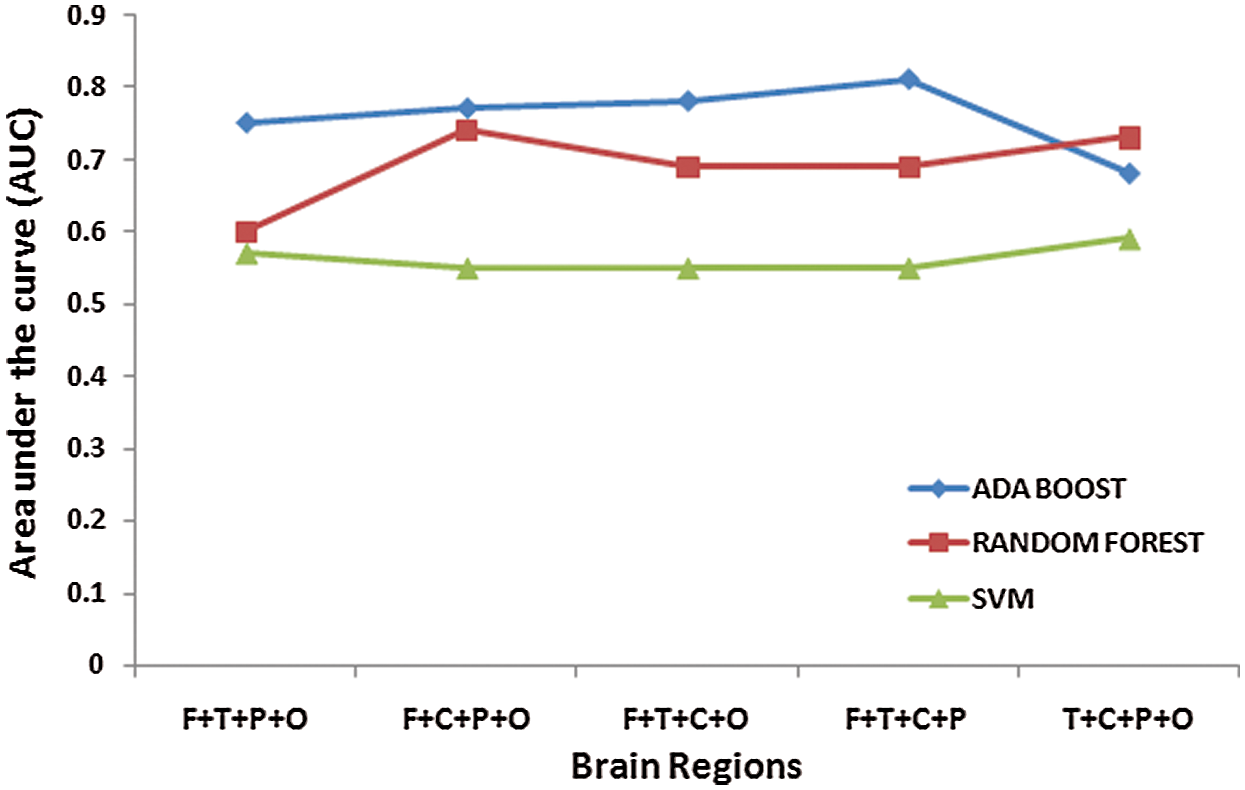
Figure 7: Area under the Curve (AUC) values for four regional combination sets
Further, the results are presented that indicate brain lateralization as a significant dysfunction in ADHD. From Tab. 5 it has been found that classification accuracy rate is the maximum with AdaBoost classifier when channels of Right Hemisphere are taken into consideration [Accuracy = 84%, Sensitivity= 96%, and Specificity = 70%]. These results indicate that laterality in brain functionality indicating activity of the Right hemisphere in ADHD is different from that of Healthy Controls. These findings are also supported by the previous neuroimaging meta-analysis where abnormal structural brain lateralization has been reported in the right hemisphere [26–27]. This structural abnormality in the right hemisphere may affect cognitive functions related to attention and inhibition [28]. Fig. 8 shows the values of Area under the Curve (AUC) when channels from two different hemispheres are considered. It is inferred that AUC values representing the relationship between the true positives rate and the false positive rate are higher in the model developed with the AdaBoost classifier when channels from the lateral right hemisphere are taken into consideration.
Table 5: Hemispheric differences in classification performances

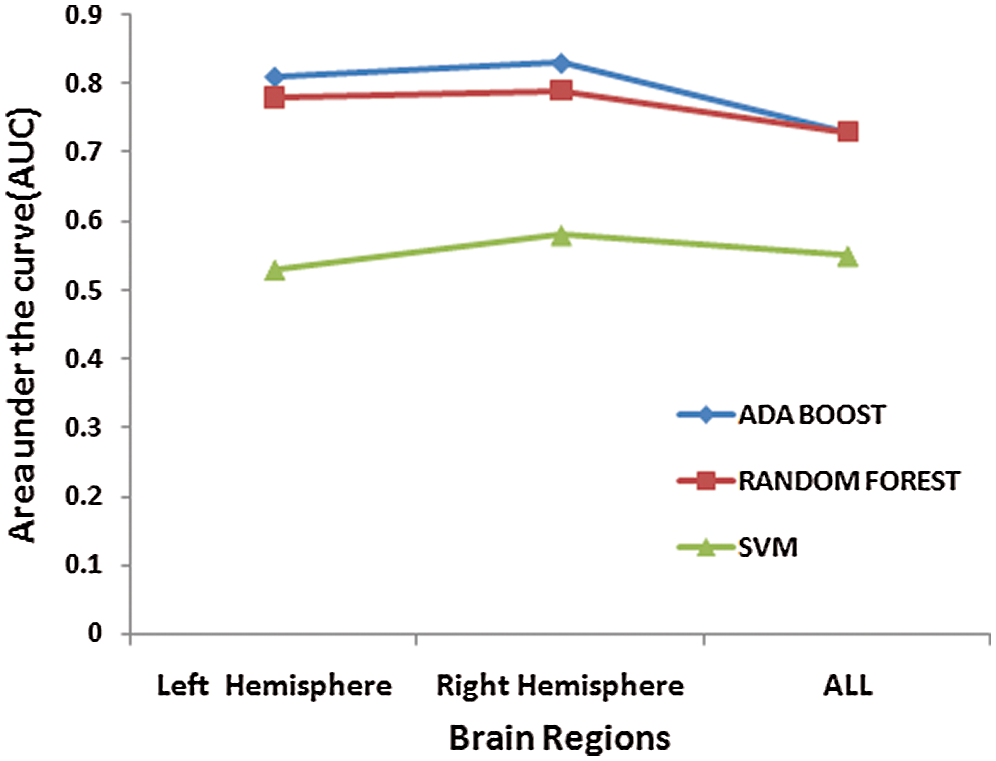
Figure 8: Area under the Curve (AUC) values of lateral hemispheric regions
This study aimed to find regional contributions towards developing an accurate classification model for the diagnosis of children with Attention Deficit Hyperactive Disorder (ADHD). With this objective in mind, EEG signals from an open-access dataset consisting of 60ADHD and 60 Healthy controls are analyzed to develop a classification model for the diagnosis of children with ADHD. The classification approach involved testing the model with the individual, combinatorial sets, and lateral hemisphere channels. The combinatorial sets of three and four regional structures are formed by creating sets of regional structures namely frontal, temporal, central, parietal, occipital regions, and later tested for classification accuracies. For this purpose, AdaBoost, Random Forest and Support Vector Machine the (SVM) classifier are used. Evaluating all the classifiers' overall performance, the highest accuracy of 84% is obtained with the AdaBoost classifier when all the channels of the Right Hemisphere are taken into consideration. Also, the sensitivity of 96% obtained in this case indicates a higher true positive detection rate of the model created with the right hemisphere's channels. This outcome highlights the intrinsic physiological contrast prevalent in brain activity of ADHD and Healthy children which can be effectively utilized for diagnostic purposes. These results are also in sync with the findings of previous neuro-imaging meta-analysis studies concluding atypical structural abnormalities in the right hemisphere of ADHD children and adults.
In the future, more work will be dedicated to the improvement of the accuracy of the existing model and testing the model on larger datasets.
Funding Statement: The authors received no specific funding for this study.
Conflicts of Interest: The authors declare that they have no conflicts of interest to report regarding the present study.
1. G. Polanczyk, M. S. de Lima, B. L. Horta, J. Biederman and L. A. Rohde, “The worldwide prevalence of ADHD: A systematic review and meta regression analysis,” American Journal of Psychiatry, vol. 164, no. 6, pp. 942–948, 2007. [Google Scholar]
2. V. Simon, P. Czobor, S. Balint, A. Meszaros and I. Bitter, “Prevalence and correlates of adult attention-deficit hyperactivity disorder: meta-analysis,” British Journal of Psychiatry, vol. 194, no. 3, pp. 204–211, 2009. [Google Scholar]
3. A. Thapar and M. Cooper, “Attention deficit hyperactivity disorder,” The Lancet, vol. 387, no. 10024, pp. 1240–1250, 2016. [Google Scholar]
4. C. A. Magee, A. R. Clarke, R. J. Barry, R. McCarthy and M. Selikowitz, “Examining the diagnostic utility of EEG power measures in children with attention deficit/hyperactivity disorder,” Clinical Neurophysiology, vol. 116, no. 5, pp. 1033–1040, 2005. [Google Scholar]
5. N. K. Lee and D. Wang, “Self-organizing map based extraction algorithm for DNA motifidentification with heterogeneous model,” Journal of Bioinformatics, vol. 10, no. 1, pp. 56–68, 2011. [Google Scholar]
6. A. Allahverdy, M. N. Ali and R. M. Mohammad, “Detecting ADHD children using symbolic dynamic of nonlinear features of EEG,” in Proc. of the Conference on Electrical Engineering, Tehran, Iran, pp. 712–717, 2011. [Google Scholar]
7. H. Helgadóttir, O. O. Gudmundsson, G. Baldursson, P. Magnússon, N. Blin et al., “Electroencephalography as a clinical tool for diagnosing and monitoring attention deficit hyperactivity disorder: A cross-sectional study,” British Medical Journal Open, vol. 5, no. 1, pp. 1–9, 2015. [Google Scholar]
8. S. S. Poil, S. Bollmann, C. Ghisleni, R. L. O’Gorman and P. Klaver, “Age dependent electroencephalographic changes in attention-deficit/hyperactivity disorder (ADHD),” Clinical Neurophysiology, vol. 125, no. 8, pp. 1626–1638, 2014. [Google Scholar]
9. M. R. Mohammadi, A. Khaleghi, A. M. Nasrabadi, M. S. Rafieivand, M. Begol et al., “EEG classification of ADHD and normal children using non-linear features and neural network,” Biomedical Engineering Letters, vol. 6, no. 2, pp. 66–73, 2016. [Google Scholar]
10. J. Yang, W. Li, S. Wang, J. Lu and L. Zou, “Classification of children with attention deficit hyperactivity disorder using pca and k-nearest neighbors during interference control task,” in Proc. of the Advances in Cognitive Neurodynamics, Singapore: Springer, 2016. [Google Scholar]
11. E. Pereda, M. García-Torres, B. Melián-Batista, S. Mañas, L. Méndez et al., “The blessing of dimensionality: Feature selection outperforms functional connectivity-based feature transformation to classify ADHD subjects from EEG patterns of phase synchronization,” PLoS ONE, vol. 13, no. 8, pp. 1–24, 2018. [Google Scholar]
12. S. Khoshnoud, M. A. Nazari and M. Shamsi, “Functional brain dynamic analysis of ADHD and control children using nonlinear dynamical features of EEG signals,” Journal of Integrative Neuroscience, vol. 17, no. 1, pp. 17–30, 2018. [Google Scholar]
13. H. Chen, W. Chen, Y. Song, L. Sun and X. Li, “EEG characteristics of children with attention-deficit/hyperactivity disorder,” Neuroscience, vol. 406, no. 318, pp. 444–456, 2019. [Google Scholar]
14. M. Altınkaynak, N. Dolu, A. Güven, F. Pektaş, S. Özmen et al., “Diagnosis of attention deficit hyperactivity disorder with combined time and frequency features,” Biocybernetics and Biomedical Engineering, vol. 40, no. 3, pp. 927–937, 2020. [Google Scholar]
15. S. Vijh, P. Gaurav and H. M. Pandey, “Hybrid bio-inspired algorithm and convolutional neural network for automatic lung tumor detection,” Neural Computing and Applications, pp. 1–14, 2020. [Google Scholar]
16. A. Jindal, A. Dua, N. Kumar, A. K. Das, A. V. Vasilakos et al., “Providing healthcare-as-a-service using fuzzy rule based big data analytics in cloud computing,” IEEE Journal of Biomedical and Health Informatics, vol. 22, no. 5, pp. 1605–1618, 2018. [Google Scholar]
17. D. Jiang, J. Liao, H. Duan, Q. Wu, G. Owen et al., “A machine learning-based prognostic predictor for stage III colon cancer,” Scientific Reports, vol. 10, no. 1, pp. 2849, 2020. [Google Scholar]
18. G. S. Aujla, A. Jindal, R. Chaudhary, N. Kumar, S. Vashist et al., “Vashist etal, DLRS: deep learning-based recommender system for smart healthcare ecosystem,” in Proc. of the IEEE Int. Conf. on Communications, Shangai, China, pp. 1–6, 2019. [Google Scholar]
19. A. Einizade, M. Mozafari, M. Rezaei-Dastjerdehei, E. Aghdaei, A. M. Mijani et al., “Detecting ADHD children based on EEG signals using graph signal processing techniques,” in Proc. of the Int. Conf. on Biomedical Engineering, Tehran, Iran, pp. 264–270, 2020. [Google Scholar]
20. A. Khaleghi, P. M. Birgani, M. F. Fooladi and M. R. Mohammadi, “Applicable features of electroencephalogram for ADHD diagnosis,” Research on Biomedical Engineering, vol. 36, no. 1, pp. 1–11, 2020. [Google Scholar]
21. S. M. H. Mohamed, A. B. Norbert, H. G. Reint and J. V. D. M. Jaap, “Brain lateralization and self-reported symptoms of ADHD in a population sample of adults: A dimensional approach,” Frontiers in Psychology, vol. 6, no. 1, pp. 1418, 2015. [Google Scholar]
22. Y. Freund and R. E. Schapire, “A decision-theoretic generalization of on-line learning and an application to boosting,” Journal of Computer and System Sciences, vol. 55, no. 1, pp. 119–139, 1997. [Google Scholar]
23. V. N. Vapnik, “An overview of statistical learning theory,” IEEE Trans. on Neural Networks, vol. 10, no. 5, pp. 988–999, 1999. [Google Scholar]
24. L. Breiman, “Random forests,” Machine Learning, vol. 45, no. 1, pp. 5–32, 2001. [Google Scholar]
25. A. M. Nasrabadi, A. Allahverdy, M. Samavati and M. R. Mohammadi, “EEG data for ADHD/control children,” IEEE Dataport, 2020. [Google Scholar]
26. E. M. Valera, S. V. Faraone, K. E. Murray and L. J. Seidman, “Meta-analysis of structural imaging findings in attention-deficit/hyperactivity disorder,” Biological Psychiatry, vol. 61, no. 12, pp. 1361–1369, 2007. [Google Scholar]
27. T. Frodl and N. Skokauskas, “Meta-analysis of structural MRI studies in children and adults with attention deficit hyperactivity disorder indicates treatment effects,” Acta Psychiatrica Scandinavica, vol. 125, no. 2, pp. 114–126, 2012. [Google Scholar]
28. H. Hart, J. Radua, T. Nakao, D. Mataix-Cols and K. Rubia, “Meta-analysis of functional magnetic resonance imaging studies of inhibition and attention in attention-deficit/hyperactivity disorder: Exploring task-specific, stimulant medication, and age effects,” JAMA Psychiatry, vol. 70, no. 2, pp. 185–198, 2013. [Google Scholar]
 | This work is licensed under a Creative Commons Attribution 4.0 International License, which permits unrestricted use, distribution, and reproduction in any medium, provided the original work is properly cited. |