DOI:10.32604/iasc.2021.016800
| Intelligent Automation & Soft Computing DOI:10.32604/iasc.2021.016800 | |
| Article |
Leveraging Convolutional Neural Network for COVID-19 Disease Detection Using CT Scan Images
Department of Computer Science, College of Computers and Information Technology, Taif University, P.O. Box 11099, Taif, Saudi Arabia
*Corresponding Author: Mehedi Masud. Email: mmasud@tu.edu.sa
Received: 12 January 2021; Accepted: 11 March 2021
Abstract: In 2020, the world faced an unprecedented pandemic outbreak of coronavirus disease (COVID-19), which causes severe threats to patients suffering from diabetes, kidney problems, and heart problems. A rapid testing mechanism is a primary obstacle to controlling the spread of COVID-19. Current tests focus on the reverse transcription-polymerase chain reaction (RT-PCR). The PCR test takes around 4–6 h to identify COVID-19 patients. Various research has recommended AI-based models leveraging machine learning, deep learning, and neural networks to classify COVID-19 and non-COVID patients from chest X-ray and computerized tomography (CT) scan images. However, no model can be claimed as a standard since models use different datasets. Convolutional neural network (CNN)-based deep learning models are widely used for image analysis to diagnose and classify various diseases. In this research, we develop a CNN-based diagnostic model to detect COVID-19 patients by analyzing the features in CT scan images. This research considered a publicly available CT scan dataset and fed it into the proposed CNN model to classify COVID-19 infected patients. The model achieved 99.76%, 96.10%, and 96% accuracy in training, validation, and test phases, respectively. It achieved scores of 0.986 in area under curve (AUC) and 0.99 in the precision-recall curve (PRC). We compared the model’s performance to that of three state-of-the-art pretrained models (MobileNetV2, InceptionV3, and Xception). The results show that the model can be used as a diagnostic tool for digital healthcare, particularly in COVID-19 chest CT image classification.
Keywords: Deep learning; healthcare; COVID-19; computer vision; CT images
COVID-19 is a coronavirus disease that infects humans very quickly. COVID-19 is more infectious and deadly than common coronaviruses. It transmits primarily by human-to-human contact. Humans have not experienced this virus before, and are panicking and acting unpredictably. The main signs of COVID-19 infection are a mild fever, dry cough, and breathing problems [1]. A patient may have other problems such as tiredness, muscle pain, and anosmia. COVID-19 symptoms are mild in most cases, but some patients have higher risk, such as older people, pregnant women, and those with chronic diseases such as diabetes, heart disease, and lung disease.
Suspected COVID-19 patients require quick testing to enable proper treatment, guidance for self-isolation, and tracing of close contacts. Traditional COVID-19 diagnosis involves an RT-PCR test from nose and throat samples. This requires a dedicated kit and a minimum of 24 h to yield an outcome. The test is not entirely reliable, and another RT-PCR test or another kind of test is sometimes required to ensure diagnosis [2]. For an X-ray, a radiographer employs a dedicated machine and applies radiation to generate a 2-D image of the chest. A CT scan uses a computer to merge 2-D X-ray images into a 3-D image. It requires a specialized machine and a specialist radiographer. The CT scan is a common technique to diagnose pneumonia. It is a rapid test that is comparatively easy to accomplish.
Much published research has proposed AI-based models that employ machine learning, deep learning (DL), and neural network techniques to classify COVID-19 and non-COVID patients from chest X-ray and CT scan images, often with promising outcomes. However, these approaches require rigorous testing, and no model can be claimed as a standard, as models use various datasets. Among these, deep learning-based models show promising results. Deep learning models are instrumental in complex tasks, such as extracting hidden key features and identifying areas of interest in images, which facilitates medical image analysis for disease diagnosis. They require no handcrafted feature-extraction.
Deep learning models have been used for chest X-ray image analysis for various disease identification and classification tasks. The ChestNet [3] model is used to detect pneumonia from chest X-ray images. The model shows better performances compared to radiologist in detecting pneumonia from chest X-ray images. Another ChestNet model was proposed to identify thorax diseases from chest radiography images, and a simple convolutional neural network (CNN) model was proposed to diagnose tuberculosis (TB) from X-ray images. The authors evaluated the model on two datasets, achieving 86.2% accuracy. A deep neural network model was proposed to classify normal and abnormal chest X-rays [4]. A CNN model was used to classify tuberculosis disease from chest X-rays [5].
Another deep learning technique was used to identify CT image features to detect pulmonary nodules [6]. Different pretrained CNN models were used to diagnose thorax diseases [7]. A deep neural network model was proposed to classify brain CT images [8]. A combination of multilayer and generalized regression neural networks was used for chest disease diagnosis [9].
The histogram equalization technique for image segmentation and a feedforward neural network were used to classify TB, pneumonia, and lung cancer [10]. However, the performance was not as good as that of deep learning-based models. DL models show better accuracy in classification processes, motivating researchers to consider applying these models to medical images for disease classification. Moreover, DL models have successfully extracted valuable features that discriminate various classes of images [11–13]. CNN models are the most used techniques in several types of medical image classification for their superior extraction of various level features from images [14,15].
The remainder of this paper is structured as follows. Section 2 discusses related work. Section 3 discusses the materials, method, and data preprocessing used in the proposed model. Section 4 presents the model and provides performance results, analysis, and comparisons. Section 5 provides conclusions and suggestions for future work.
Alom et al. [16] presented a deep learning model to detect and segment COVID-19 from X-ray images. A transfer learning-based model and the inception recurrent residual neural network (IRRCNN) were used to detect COVID-19, and the NABLA-N model was used for segmentation. The model achieved 98.78% accuracy in COVID-19 detection. Runwen et al. [17] used the ShuffleNet transfer learning model to classify COVID and non-COVID cases using CT scans. The model achieved scores of 90.52%, 91.58%, and 0.9689% in sensitivity, specificity, and area under the curve (AUC). The dataset contained 521 COVID-19 cases, 397 healthy people, 76 bacterial pneumonia patients, and 48 SARS images.
Gozes et al. [18] proposed a system including segmentation of the lung, detection of COVID-19 in CT slices, and identification of COVID-19 cases by applying a predefined threshold value built on the number of COVID-19 positive slices. The model used the ResNet50 network for COVID-19 detection and obtained scores of 94%, 98%, and 0.9940 in sensitivity, specificity, and AUC, respectively.
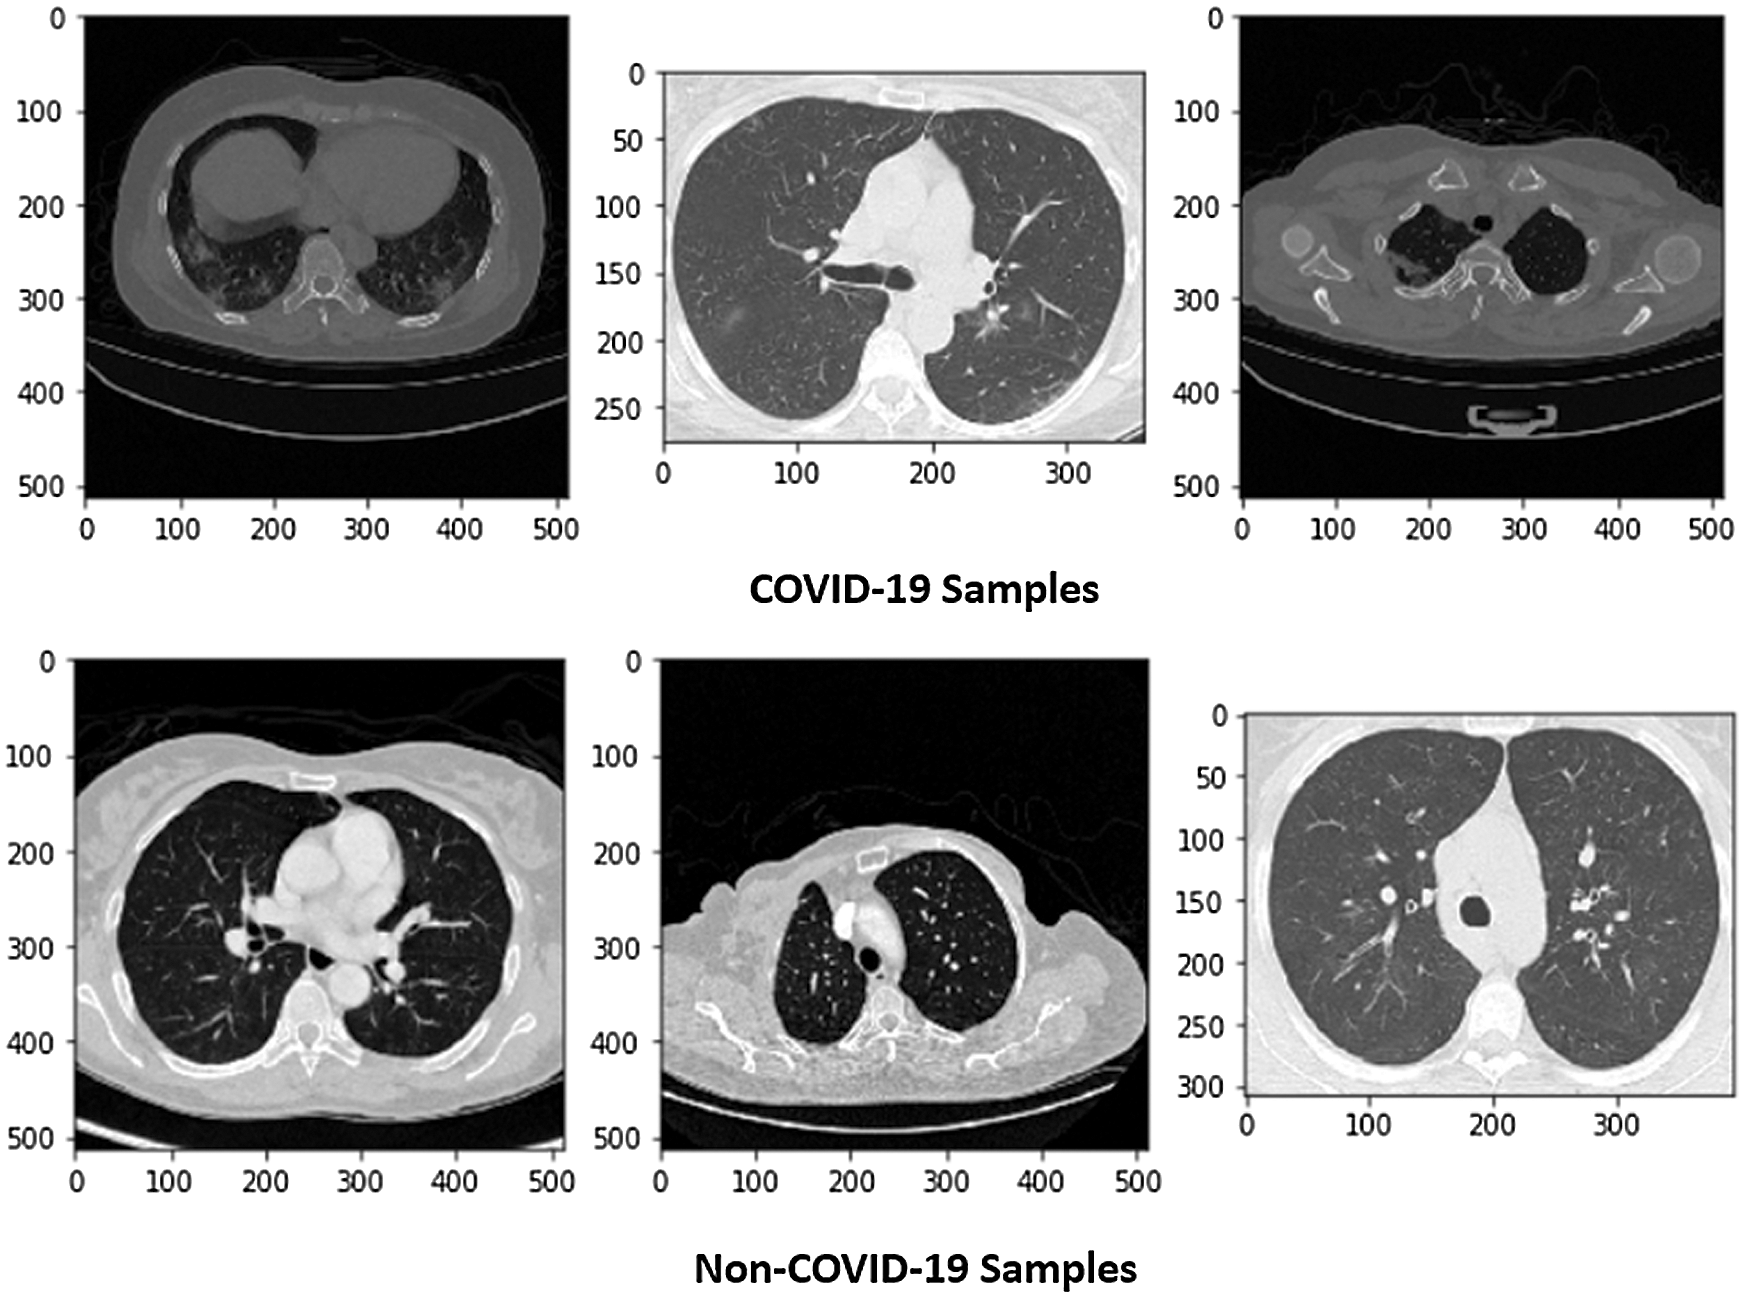
Figure 1: Sample of X-ray images (COVID and Non-COVID cases)
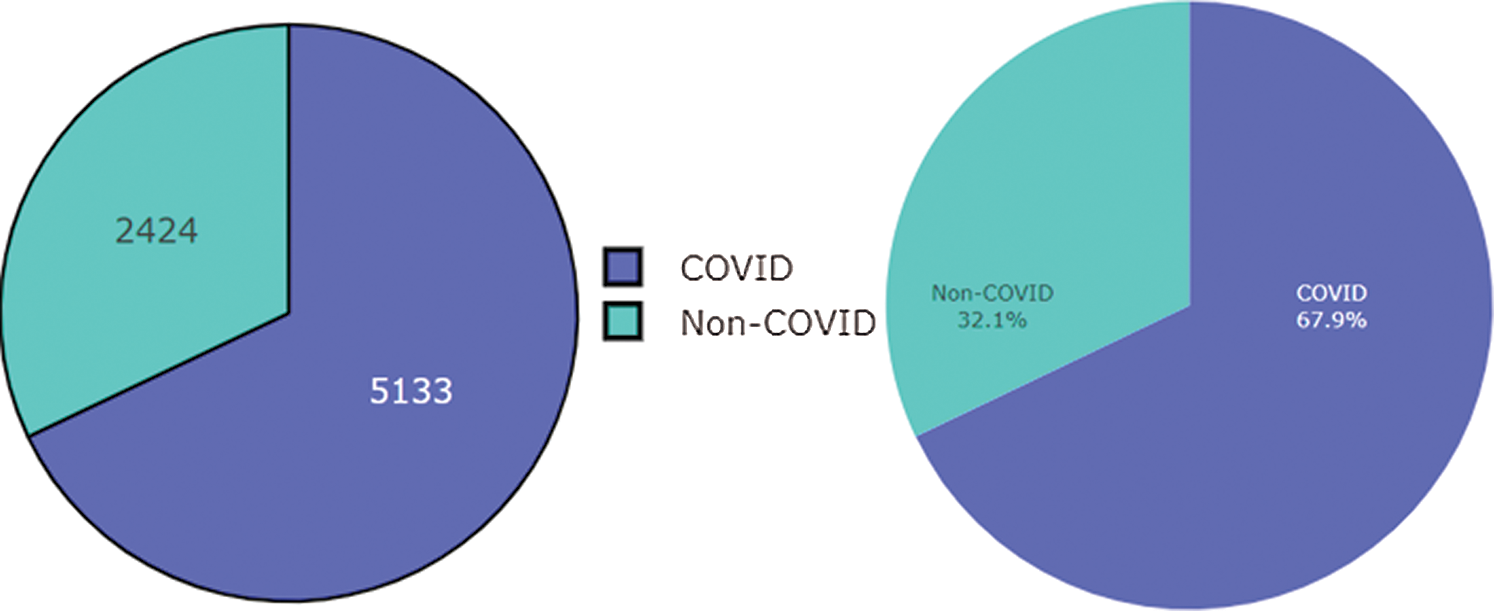
Figure 2: Dataset of COVID and Non-COVID cases distributions
Jaiswal et al. [19] used a DenseNet201 pretrained model to classify COVID-19 patients using 2,492 CT scans. The model was compared to other pretrained models, such as VGG16, ResNet152V2, and InceptionResNetV2. The DenseNet201 model achieved the best accuracy, 96.25%.
Jin et al. [20] proposed a 2D CNN model to detect COVID-19 using a segmentation technique on CT slices. The authors used 496 COVID-19 positive and 260 negative images. The model achieved 0.9791, 94.06%, and 95.47% scores in AUC, sensitivity, and specificity, respectively. Since the onset of the COVID-19 pandemic, researchers have proposed deep learning-based methods for automatic screening of positive COVID-19 cases using different radiology images, such as CXR and CT scans.
Ahuja et al. [21] applied data augmentation and pretrained models to classify COVID-19 from CT images. Stationary wavelets, random rotation, translation, and shear tasks were used in data augmentation. ResNet50, ResNet18, and SqueezeNet were used for classification. The ResNet18 model performed better and achieved a 0.9965 AUC value. Liu et al. [22] developed a model using the weights of different networks such as VGG16, ResNet18, and ResNet50. The model performed prediction on five lesions. The model with VGG16 achieved the highest AUC score of 0.94.
This research used a publicly available dataset consisting of CT scan images [23] and X-ray images. Some images were produced from augmentation techniques. The CT scan dataset had 5493 non-COVID images and 3914 COVID images. After manual observation of the images, we observed that the quality of some images was poor, and those images were not considered in model training. After manual preprocessing, the total number of images was 7557. Some sample images of COVID and non-COVID cases are shown in Fig. 1. The dataset had a different ratio of COVID and non-COVID cases, as shown in Fig. 2. Images were of different sizes, with high variation. Fig. 3 presents the five most frequent sizes of the images. Fig. 3 shows that images of 1024 × 1024 × 3 were most common. The dataset was unbalanced, and the images had various noises. Therefore, appropriate preprocessing was necessary before training a model on this dataset.
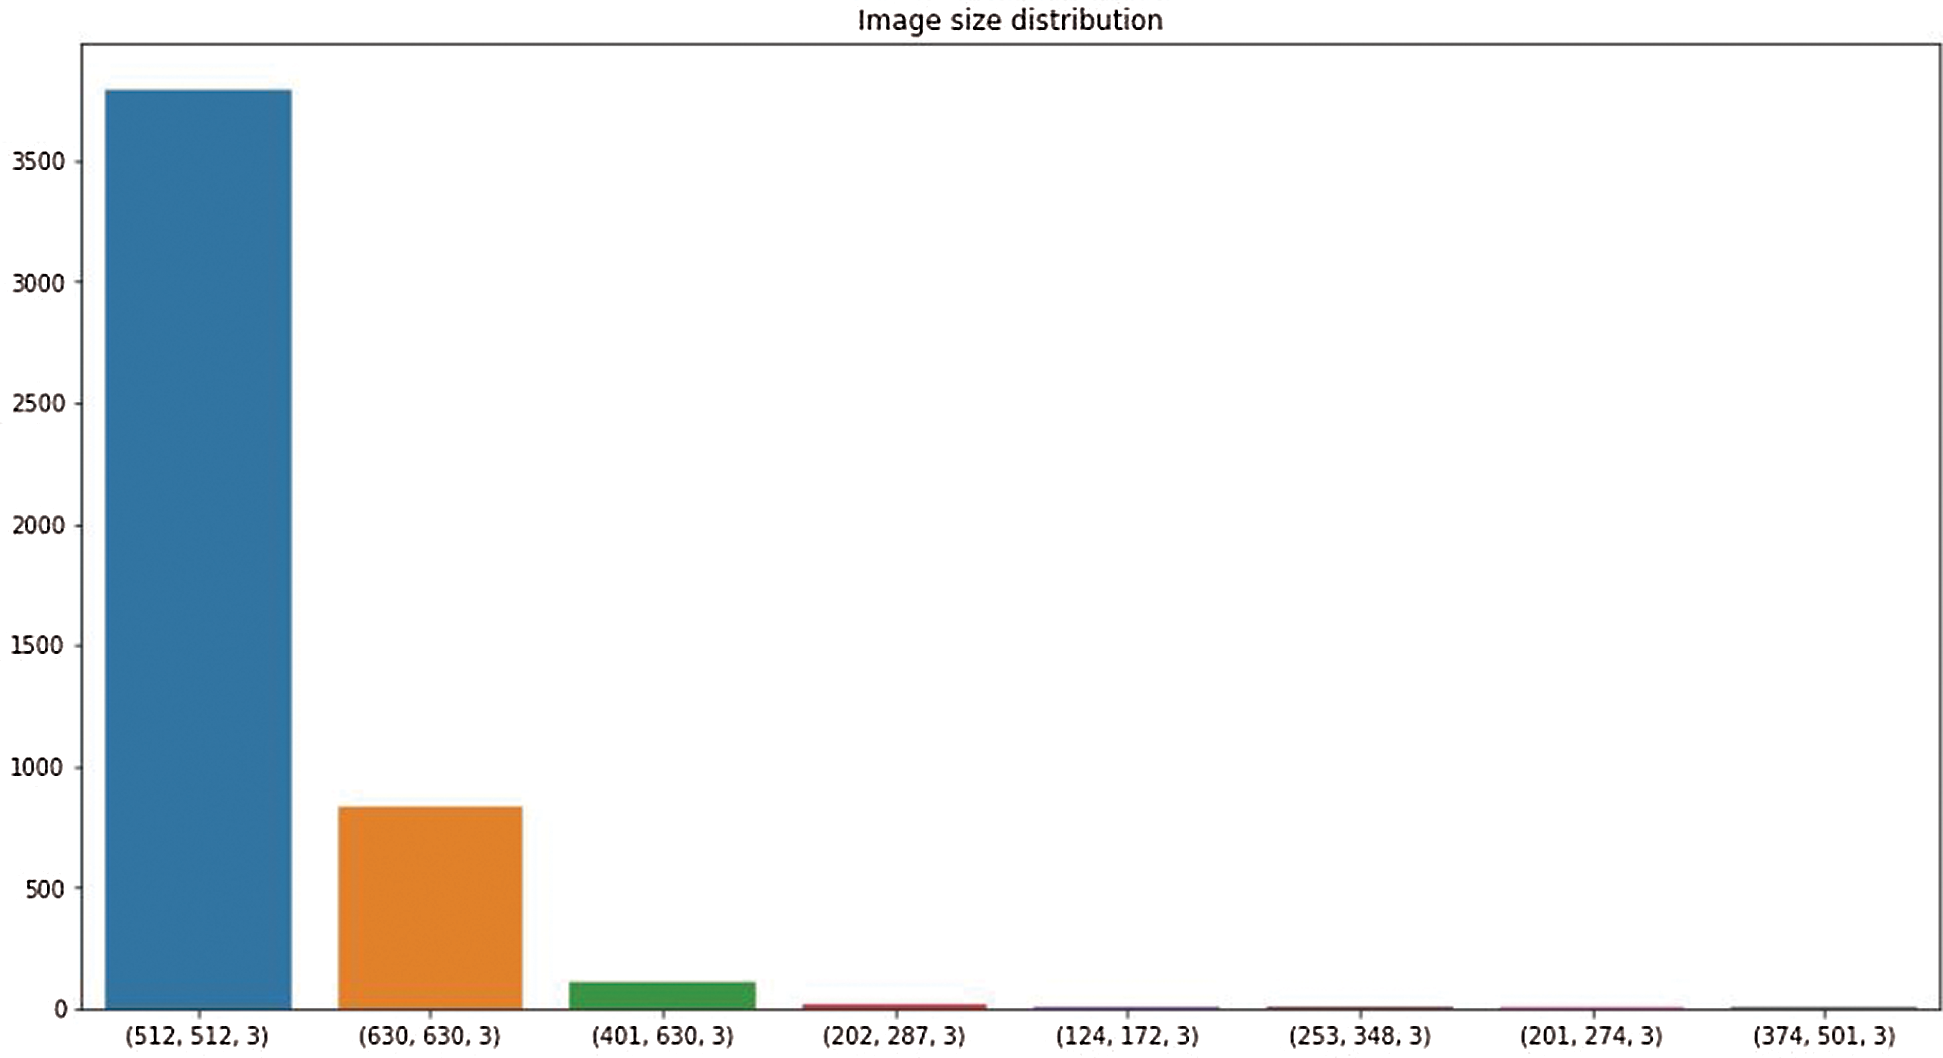
Figure 3: Image size distribution
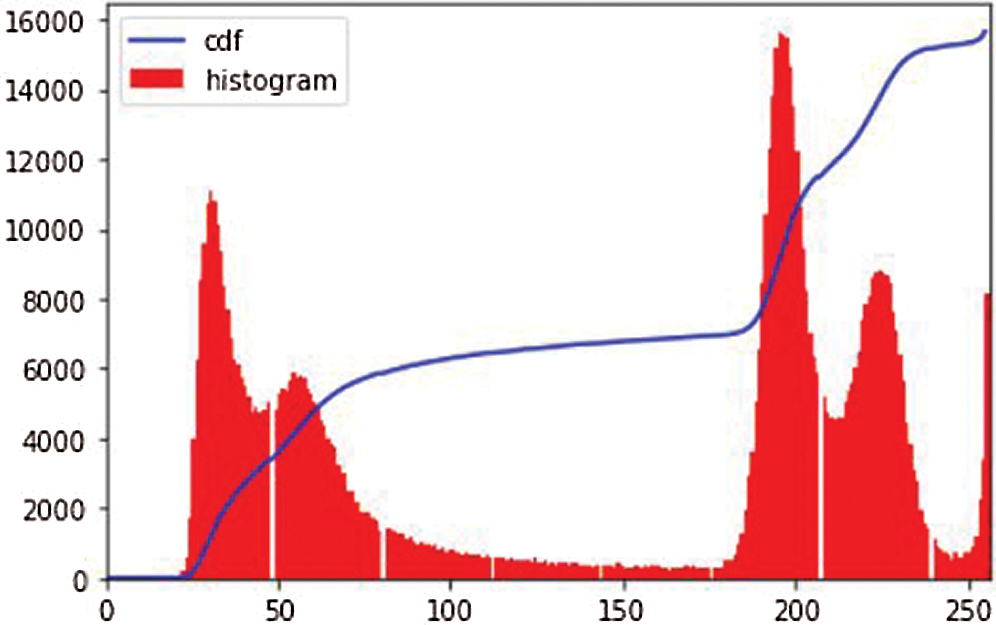
Figure 4: Image histogram of an image
After exploratory data analysis of the CT scans, we noticed that images had different contrasts, noises, focus, and sizes. To improve their quality, we considered three preprocessing steps.
i. Histogram equalization [24]: The image histogram technique graphically interprets the pixel intensity values of an image, showing the frequencies of all values. Fig. 4 shows an image histogram of an image in the dataset. We observe that the image has high contrast in pixel intensity. Histogram equalization (HE) balances the image contrast by considering its histogram. It spreads the values of high pixel intensity or extends the intensity range of the image. It adjusts image intensities to enhance contrast. Consider the image G as an (mr x mc) matrix of pixel intensity values ranging from 0 to I–1. I is the number of probable values of intensity, and it is often 256. Let R represent the normalized histogram of G with a bin of each probable intensity.
Then
The image g with histogram equalization is represented by
where the floor() function rounds the value to the closet integer. It is equivalent to transforming the pixel intensities, k, of f by the function
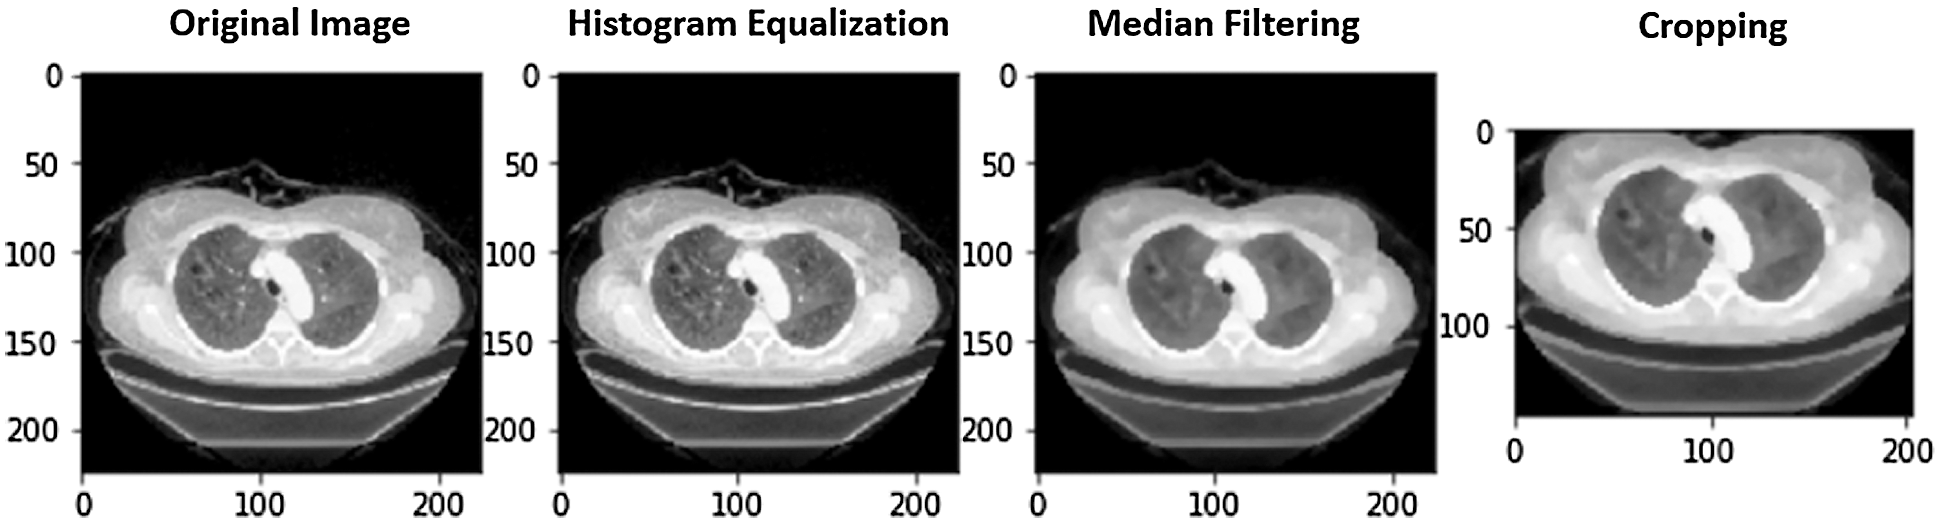
Figure 5: A case of image preprocessing
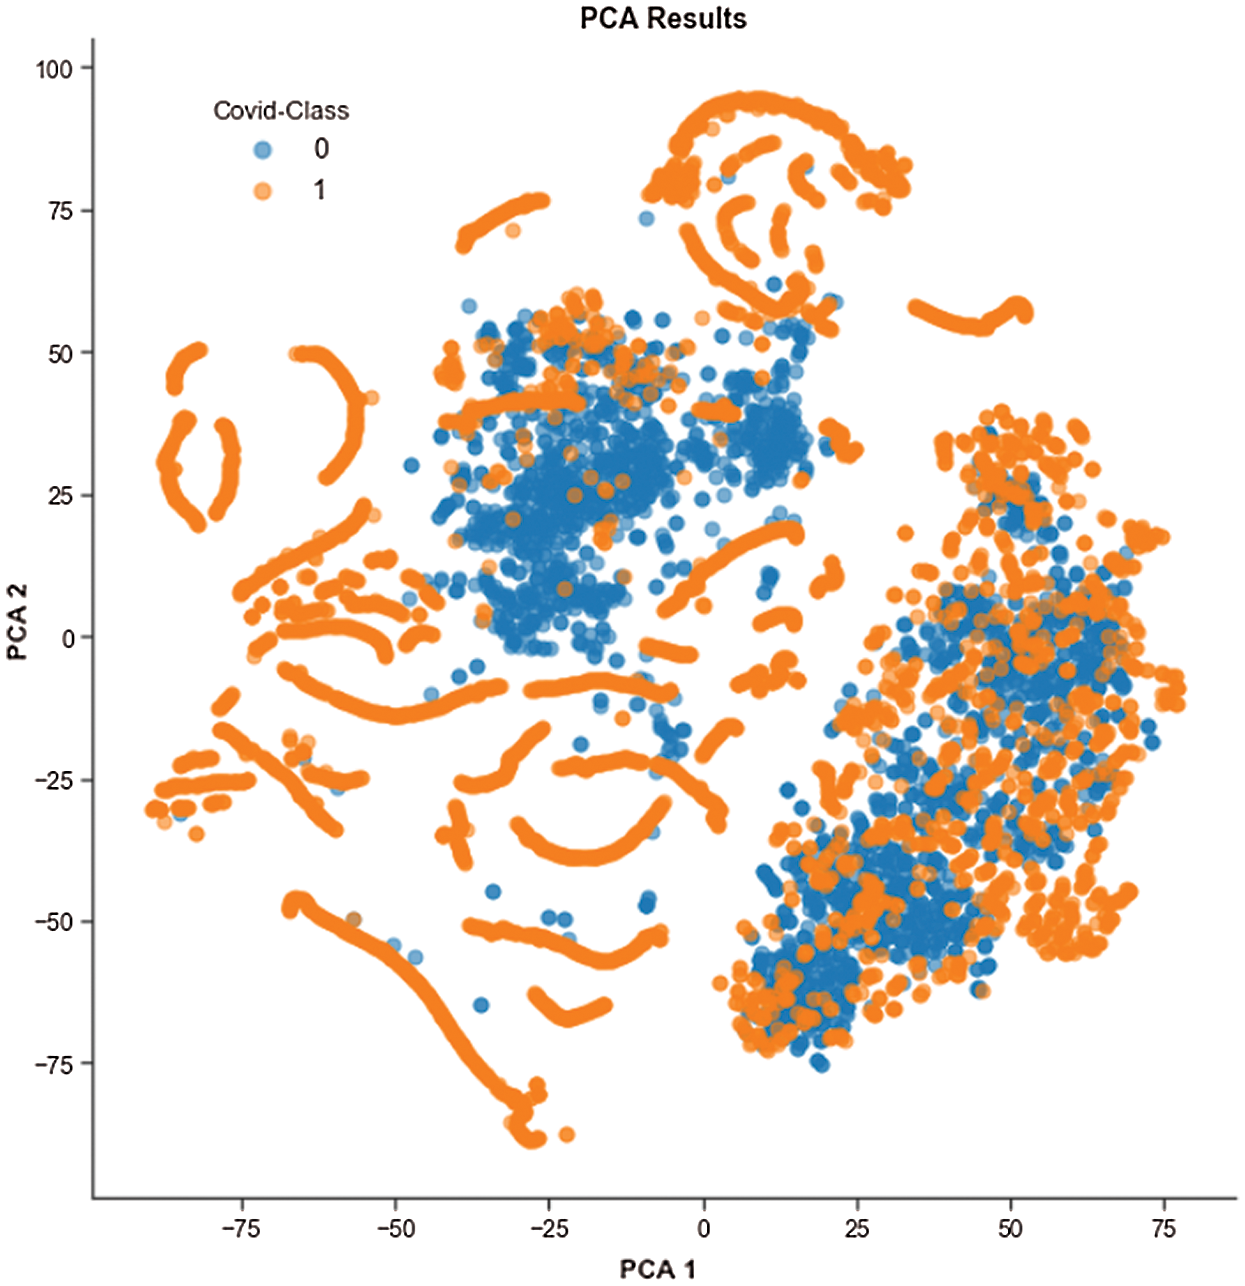
Figure 6: t-SNE visualization of the COVID and Non-COVID classes clustering using PCA
ii. Median filtering [25]: We applied median filtering, a nonlinear method, to filter the noisy areas in images. Here, the central value of an image is changed by the median of all the pixels in the kernel area. This removes noise while processing the edges of an image. The median filter replaces a pixel by the median of all pixels in a neighborhood w,
where w denotes a neighborhood specified by the user, centered around location [m, n] in the image.
iii. Rectangle cropping: Besides noises, images have uncommunicative dark regions. It is vital to eliminate these dark regions for a model to train. If these regions are not removed, then images provide fewer informative features to the model. We used cropping for this purpose. Furthermore, some images are dark and hard to visualize. We transformed these to grayscale for effective visualization. Fig. 5 shows a COVID image and the outcome after applying HE, median filtering, and rectangle cropping.
We performed exploratory data analysis to observe the distribution and clustering nature of the COVID and non-COVID classes from the image features. We used t-distributed stochastic neighbor embedding (t-SNE) to visualize the clustering nature, as shown in Fig. 6, and this demonstrates the difficulty of classification based on features. Because of the high dimensionality of images, we used principal component analysis (PCA) to minimize the dimension to two PCA components. PCA also increases interpretability and reduces information loss.
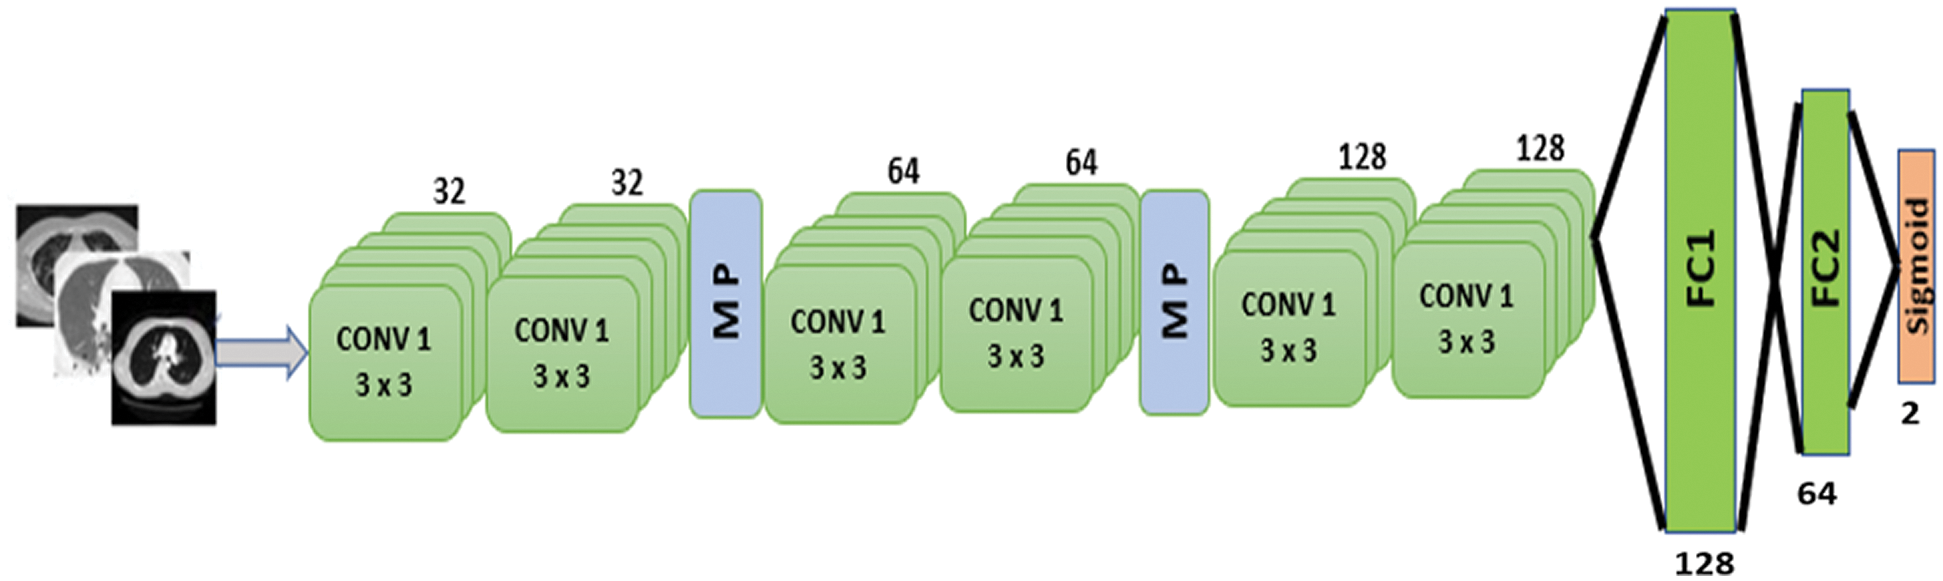
Figure 7: Proposed CNN model
4 Proposed CNN Model and Performance Analysis
The proposed model is depicted in Fig. 7. There are six 2D convolutional layers. The first two CNN layers have 32 filters with a kernel size of 3 × 3. A MaxPooling2D layer is added after each CNN layer. After the second CNN layer output, dropout regularization (0.2) is applied. The next two CNN layers each have 64 filters and a kernel size of 3 × 3. A MaxPooling2D layer and dropout regularization (0.2) are added. The final two CNN layers consist of 128 filters with a kernel size of 3 × 3. A dropout regularization layer is applied before the fully-connected layer. The model applies a ReLU activation function in each CNN layer. The model has two fully-connected layers. The first has 128 neurons, and the second has 64 neurons. Dropout regularization is applied after each fully-connected layer. The model applies the sigmoid activation function at the classification layer due to binary classification. The root mean square propagation (RMSprop) [26] optimizer is used in the model; this minimizes oscillations and dynamically updates the learning rate. The optimizer selects a proper learning rate for each parameter. The equations below formulate the update.
where
where gt is the gradient at time t along wj, st is an exponential average of squares of gradients along wj, and
Tab. 1 shows the parameters during model training.
Table 1: Model training and validation parameters
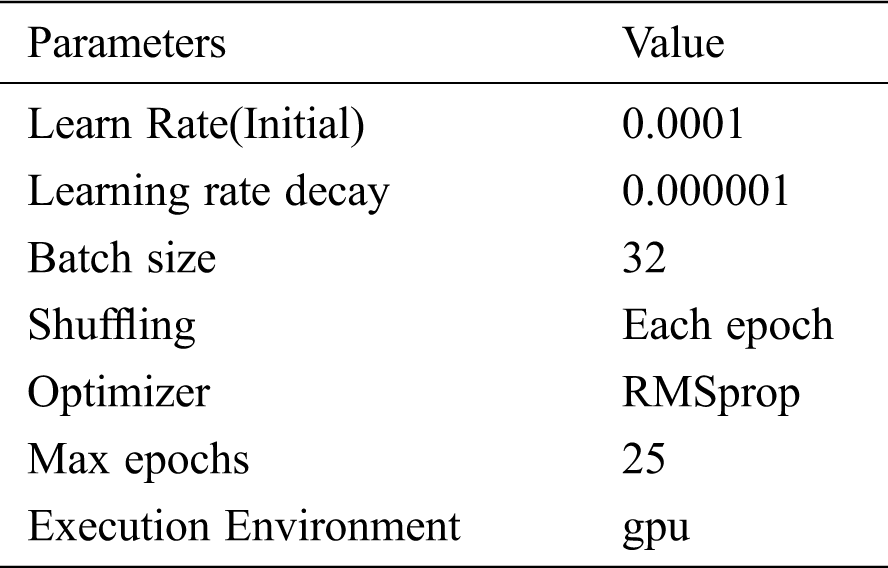
Table 2: Dataset split for the model’s training and testing
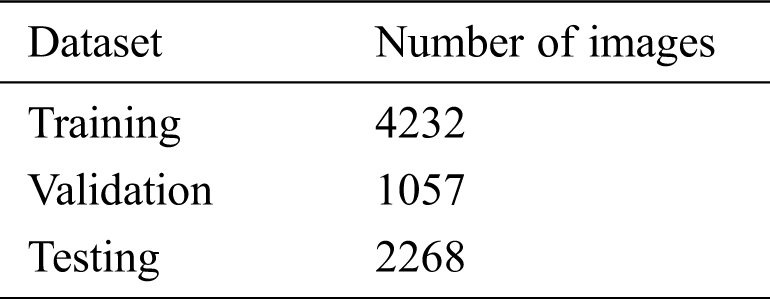
The model is evaluated in three stages: (i) training, (ii) validation, and (iii) testing. The original dataset is split into two subsets, 70% for training, and 30% for testing, and the training set is split into 80% for training and 20% for validation. The number of images in the dataset after the split is shown in Tab. 2. We conducted various performance analyses of the proposed model, including accuracy (training, validation, and testing), precision, recall, F1-score, and ROC-AUC. We generated a confusion matrix to observe the model’s true positive (TP), false positive (FP), true negative (TN), and false negative (FN) scores for classifying COVID and non-COVID cases.
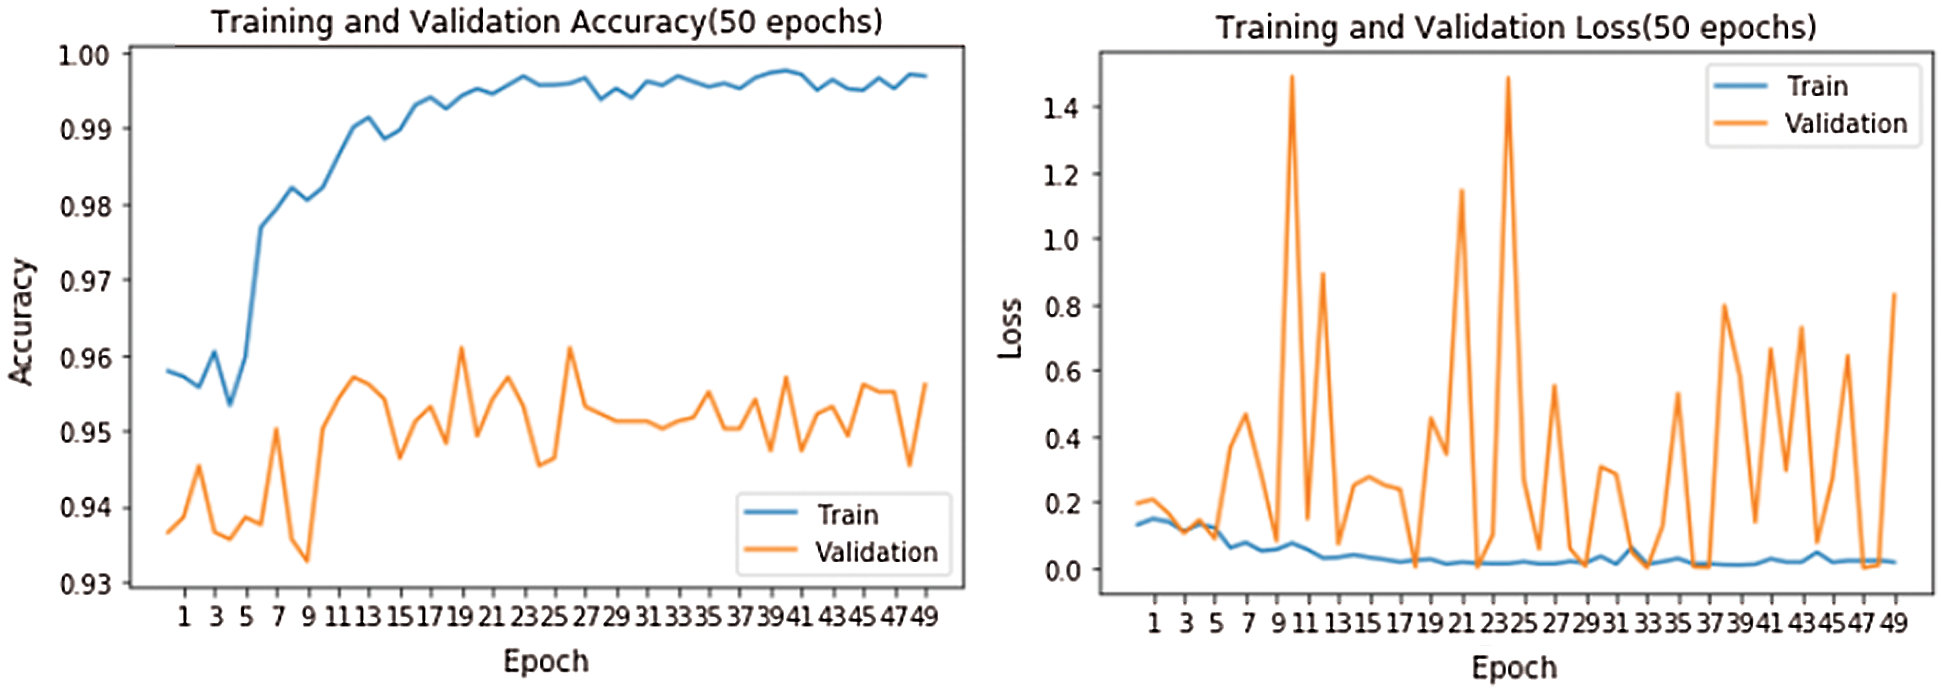
Figure 8: Training and validation accuracy and loss
Fig. 8 shows accuracy and loss while training the model. The model was run for 50 epochs. We used two callback APIs: Early Stopping (EarlyStopping) and Reduce on Loss Plateau Decay (ReduceLROnPlateau) [27]. The parameters and their values used are patience = 3, factor = 0.5, and learning rate (lr) = 0.00001. The factor parameter decreases the learning rate according to
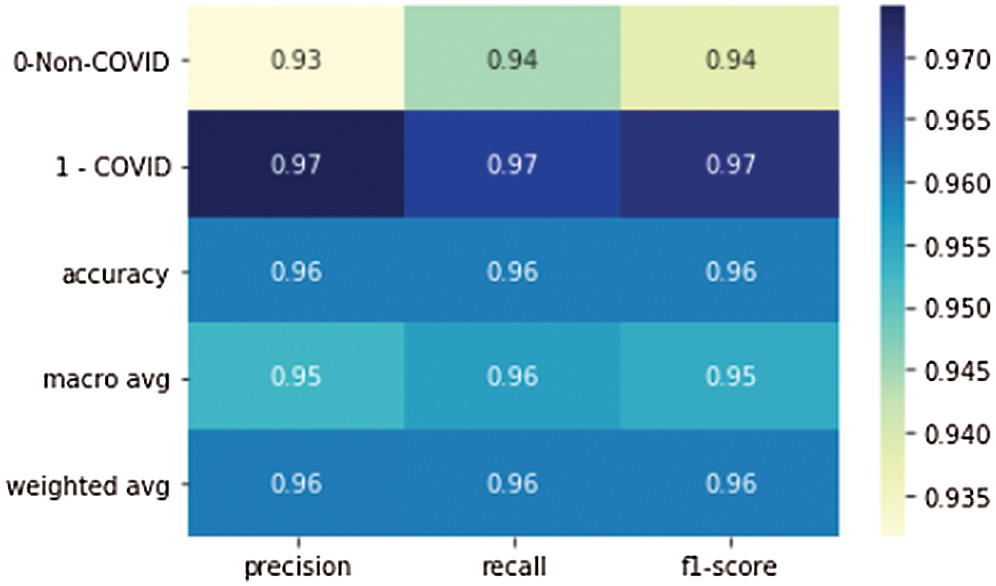
Figure 9: Precision, recall, and F1 scores of the proposed model
Tab. 3 shows the accuracy of the model during the training, validation, and testing phases, which were 99.76%, 96.10%, and 96%, respectively. The results show that the model was not overfitting or underfitting. The model achieved 0.97 precision, 0.96 recall, and a 0.97 F1-score. Fig. 9 shows these scores. The model achieved good scores in the AUC and PRC metrics, at 0.985 and 0.99, respectively. Fig. 10 shows these results. A precision-recall curve (PRC) plots precision (y-axis) and recall (x-axis) for different probability thresholds. All the results are summarized in Tab. 4.
Table 3: Accuracy of the model
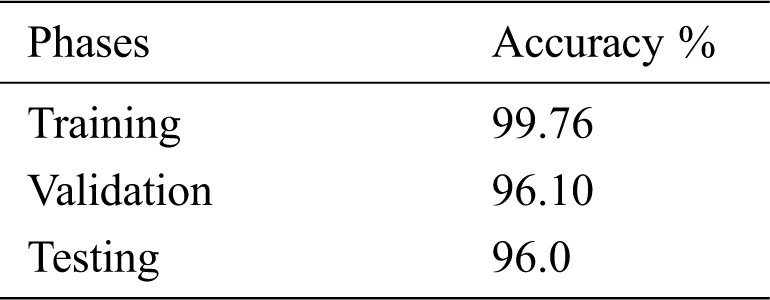
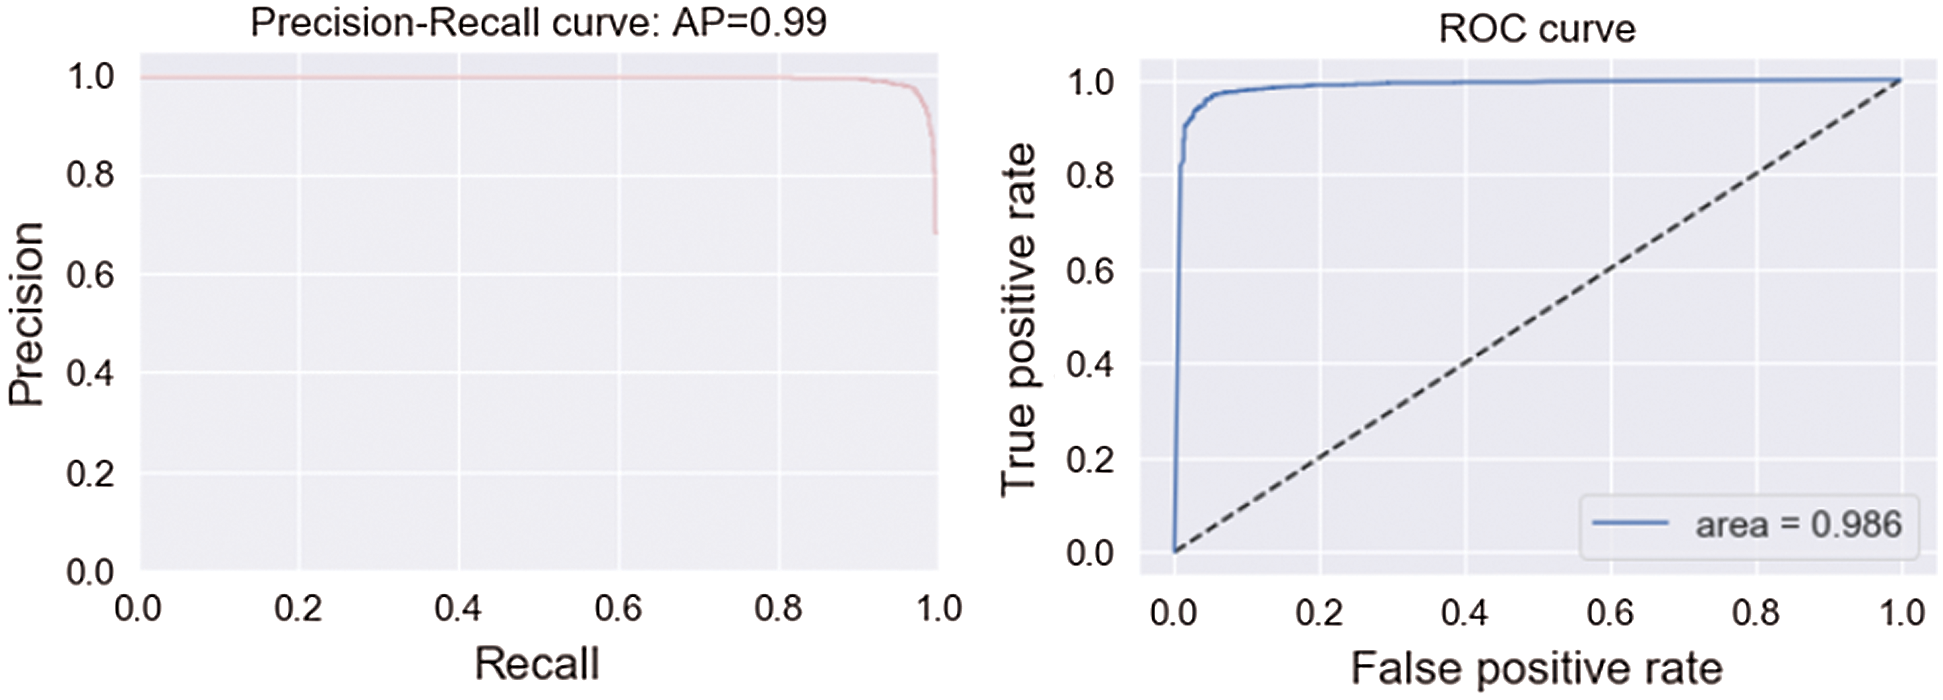
Figure 10: AUC and PRC scores
Fig. 11 demonstrates the confusion matrix values generated by the model on the testdata set, which contained 723 non-COVID images and 1536 COVID images. The proposed CNN model correctly classified 628 non-COVID images, and 50 images were misclassified as COVID. The model correctly classified 1496 COVID cases, and 40 images were misclassified as non-COVID. The results showed that the model performed fairly well at classification.
Table 4: Performance score on testdata of the model
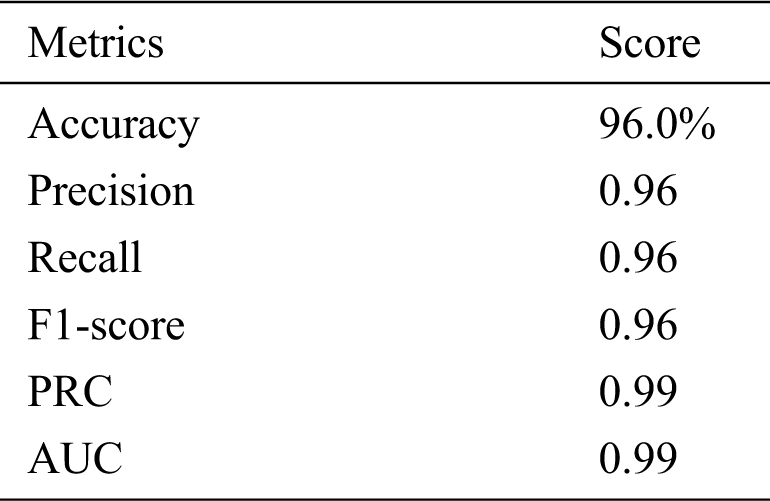
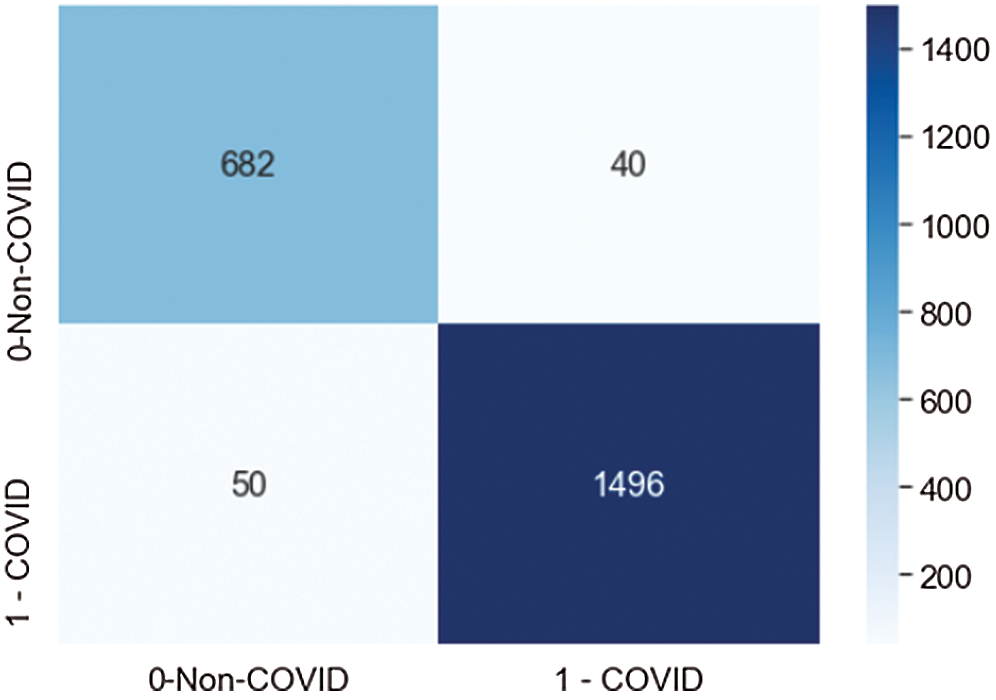
Figure 11: Confusion matrix score of the proposed model
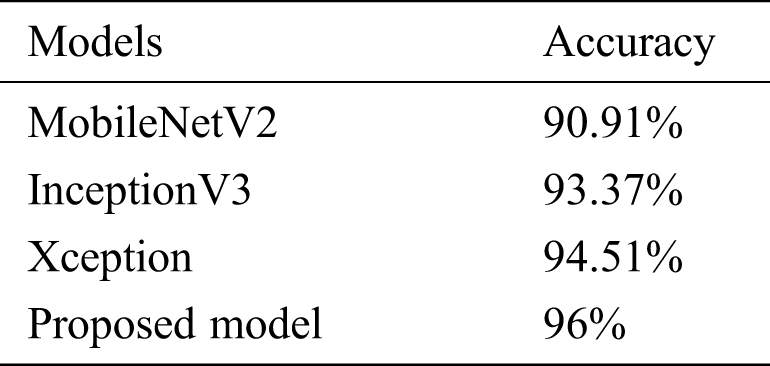
The model’s performance was compared to that of three state-of-the-art pretrained models (MobileNetV2, InceptionV3, and Xception). With an inverted residual structure, MobileNetV2 shows better performance on mobile devices. Between the bottleneck layers, residual connections exist. MobileNetV2 has an initial convolution layer with 32 filters, followed by 19 residual bottleneck layers. The InceptionV3 model has better efficiency in computation. It achieved better performance, employing label smoothing, factorized 7 × 7 convolutions and an auxiliary classifier that broadcasts label features to lower-level layers of the network. Xception has outperformed VGG-16 and ResNet in various classification challenges. The comparative results are shown in Tab. 5.
We presented a custom CNN model to classify COVID and non-COVID patients using CT scan images. The model only consists of three 2D convolutional layers and two fully-connected layers. The model achieved excellent results on different standard metrics and obtained 96% accuracy on a test dataset consisting of 2268 COVID and non-COVID CT images. The model achieved a 0.97 precision score, a 0.96 score on the recall metric, and 0399 on the AUC metric. We compared the proposed model to some pretrained models, and it outperformed them. The future plan is to consider more classification models and engineer important features from more histopathological images to increase the model’s accuracy. We will also employ the model on other publicly available datasets and look for further improvement.
Funding Statement: This research was funded by the Deanship of Scientific Research, Taif University, Ministry of Education, Saudi Arabia, under Grant 1-441-56.
Conflicts of Interest: The authors declare that they have no conflicts of interest to report regarding the present study.
1. Symptoms of Coronavirus, [Online]. Available: https://www.webmd.com/lung/covid-19-symptoms#1. access time as Jan. 2020. [Google Scholar]
2. D. B. Axell-House, R. Lavingia, M. Rafferty, E. S. Amirian and E. Y. Chiao, “The estimation of diagnostic accuracy of tests for COVID-19: A scoping review,” Journal of infection, vol. 81, no. 5, pp. 681–697, 2020. [Google Scholar]
3. F. Pasa, V. Golkov, F. Pfeiffer, D. Cremers and D. Pfeiffer, “Efficient deep network architectures for fast chest x-ray tuberculosis screening and visualization,” Scientific Reports, vol. 9, no. 1, pp. 1689, 2019. [Google Scholar]
4. M. Shorfuzzaman and M. Masud, “On the detection of covid-19 from chest x-ray images using CNN-based transfer learning,” Computers, Materials & Continua, vol. 64, no. 3, pp. 1359–1381, 2020. [Google Scholar]
5. P. Lakhani and B. Sundaram, “Deep learning at chest radiography: Automated classification of pulmonary tuberculosis by using convolutional neural networks,” Radiology, vol. 284, no. 2, pp. 574–582, 2017. [Google Scholar]
6. H. Peng, P. Seyoun, Y. Rongkai, L. Junghoon and C. Linda, “Added value of computer-aided CT image features for early lung cancer diagnosis with small pulmonary nodules: a matched case-control study,” Radiology, vol. 286, no. 1, pp. 286–295, 2018. [Google Scholar]
7. X. Wang, Y. Peng, L. Lu, Z. Lu, M. Bagheri et al., “Chest x-ray8: Hospital scale chest x-ray database and benchmarks on weakly supervised classification and localization of common thorax diseases,” in IEEE Conf. on Computer Vision and Pattern Recognition (CVPRHonolulu, HI, USA, pp. 3462–3471, 2017. [Google Scholar]
8. C. Da, H. Zhang and Y. Sang, “Brain CT image classification with deep neural networks,” in Asia Pacific Sym. on Intelligent and Evolutionary Systems, Singapore, pp. 653–662, 2015. [Google Scholar]
9. N. Yumusak and F. Temurtas, “Chest diseases diagnosis using artificial neural networks,” Expert Systems with Applications, vol. 37, no. 12, pp. 7648–7655, 2010. [Google Scholar]
10. B. Harrison, W. Robin, X. Zeng, B. Hsieh, K. Chang et al., “Artificial intelligence augmentation of radiologist performance in distinguishing covid-19 from pneumonia of other origin at chest CT,” Radiology, vol. 296, no. 3, pp. E156–E165, 2020. [Google Scholar]
11. G. E. Hinton, S. Osindero and Y. W. Teh, “A fast learning algorithm for deep belief nets,” Neural Computation, vol. 18, no. 7, pp. 1527–1554, 2006. [Google Scholar]
12. Y. Bengio, P. Lamblin, D. Popovici and H. Larochelle, “Greedy layer-wise training of deep networks,” in 19th Int. Conf. on Neural Information Processing Systems, Cambridge, MA, USA, pp. 153–160, 2016. [Google Scholar]
13. M. Avendi, A. Kheradvar and H. Jafarkhani, “A combined deep-learning and deformable-model approach to fully automatic segmentation of the left ventricle in cardiac MRI,” Medical Image Analysis, vol. 30, no. 2, pp. 108–119, 2016. [Google Scholar]
14. H. Shin, K. Roberts, L. Lu, D. Demner-Fushman, J. Yao et al., “Learning to read chest x-rays: Recurrent neural cascade model for automated image annotation,” in IEEE Conf. on Computer Vision and Pattern Recognition (CVPRLas Vegas, NV, pp. 2497–2506, 2016. [Google Scholar]
15. S. Albarqouni, C. Baur, F. Achilles, V. Belagiannis, S. Demirci et al., “Aggnet: Deep learning from crowds for mitosis detection in breast cancer histology images,” IEEE Transactions on Medical Imaging, vol. 35, no. 5, pp. 1313–1321, 2016. [Google Scholar]
16. M. Z. Alom, M. M. S. Rahman, M. S. Nasrin, T. M. Taha and V. K. Asari, “Covid MTNet: Covid-19 detection with multi-task deep learning approaches,” arXiv:2004.03747, pp. 1–12,2004. [Google Scholar]
17. H. Runwen, R. Guanqi, S. Xiang, M. Huang, Q. Liang et al., “Automated diagnosis of covid-19 using deep learning and data augmentation on chest CT,” medRxiv DOI 10.1101/2020.04.24.20078998, pp. 1–11, 2020. [Google Scholar]
18. O. Gozes, M. Frid-Adar, H. Greenspan, P. D. Browning, H. Zhang et al., “Rapid ai development cycle for the coronavirus (covid-19) pandemic: Initial results for automated detection patient monitoring using deep learning CT image analysis,” arXiv:2003.05037, pp. 1–22,2003. [Google Scholar]
19. A. Jaiswal, N. Gianchandani, D. Singh, V. Kumar and M. Kaur, “Classification of the COVID-19 infected patients using DenseNet201 based deep transfer learning,” Journal of Biomolecular Structure and Dynamics, vol. 8, no. 1, pp. 1–8, 2020. [Google Scholar]
20. C. Jin, W. Chen, Y. Cao, Z. Xu, Z. Tan et al., “Development and evaluation of an AI system for covid-19 diagnosis,” medRxiv DOI 10.1101/2020.03.20.20039834, pp. 1–39,2020. [Google Scholar]
21. A. Ahuja, B. K. Panigrahi, N. Dey, V. Rajinikanth and T. K. Gandhi, “Deep transfer learning-based automated detection of covid-19 from lung CT scan slices,” Applied Intelligence, vol. 11, pp. 1–15, 2020. [Google Scholar]
22. B. Liu, X. Gao, M. He, F. Lv and G. Yin, “Online covid-19 diagnosis with chest CT images: Lesion-attention deep neural networks,” medRxiv DOI 10.1101/2020.05.11.20097907, pp. 1–12,2020. [Google Scholar]
23. W. Shafai and A. E. Fathi, “Extensive COVID-19 X-Ray and CT Chest Images Dataset,” Mendeley Data [Online]. Available: https://data.mendeley.com/datasets/8h65ywd2jr/3. [Google Scholar]
24. H. Yan, C. Lai, K. Wee, M. Salim, Maheza et al., “Multiobjectives bihistogram equalization for image contrast enhancement,” Complexity, vol. 20, no. 2, pp. 22–36, 2014. [Google Scholar]
25. Median Filter, [Online]. Available: http://fourier.eng.hmc.edu/e161/lectures/smooth_sharpen/node2.html. access time as Jan. 2020. [Google Scholar]
26. G. Hinton, “Root Mean Square Propagation. [Online]. Available:https://www.andreaperlato.com/aipost/root-mean-square-propagation. access time as Jan. 2020. [Google Scholar]
27. ReduceLROnPlateau, [Online]. Available:https://rdrr.io/cran/kerasR/man/ReduceLROnPlateau.html. access time as Jan. 2020. [Google Scholar]
 | This work is licensed under a Creative Commons Attribution 4.0 International License, which permits unrestricted use, distribution, and reproduction in any medium, provided the original work is properly cited. |