DOI:10.32604/iasc.2021.017695
| Intelligent Automation & Soft Computing DOI:10.32604/iasc.2021.017695 | |
| Article |
Spatiotemporal Characteristics of Traffic Accidents in China, 2016–2019
1College of Civil Aviation, Nanjing University of Aeronautics and Astronautics, Nanjing, 211106, China
2Jiangsu Police Institute, Nanjing, 210031, China
3Center for Applied Biomechanics, Department of Mechanical and Aerospace Engineering, University of Virginia, Charlottesville, VA, 22911, USA
*Correspondence Author: Qun Wang. Email: wqun@jspi.edu.cn
Received: 06 February 2021; Accepted: 15 March 2021
Abstract: This study analyzed in-depth investigation reports for 418 traffic accidents with at least five deaths (TALFDs) in China from 2016 to 2019. Statistical analysis methods including hierarchical cluster analysis were employed to examine the distribution characteristics of these accidents. Accidents were found to be concentrated in July and August, and the distribution over the seven days of the week was relatively uniform; only Sunday had a higher number of accidents and deaths. In terms of 24-hour distribution, the one-hour periods with the most accidents and deaths were 8:00–9:00, 10:00–11:00, 14:00–15:00, and 18:00–19:00. Tibet, Qinghai, and Ningxia had the highest death rates per 10,000 vehicles as well as the highest death rates per 100,000 inhabitants in TALFDs. In addition, the provinces with the most accidents and deaths were Sichuan, Henan, and Yunnan. Accidents on ordinary highways accounted for approximately 70% of the total, with the death toll on those roads accounting for approximately 64% of total deaths. Accidents on expressways accounted for approximately a quarter of all traffic accidents while the number of deaths accounted for more than 30% of the total. These results can guide traffic management departments to adopt better planning and management strategies to help reduce the number of traffic accidents and deaths.
Keywords: Traffic accident; spatiotemporal characteristics; hierarchical cluster analysis
The World Health Organization’s (WHO) Global Status Report on Road Safety 2018 noted that the number of traffic-related deaths had continued to rise worldwide. In 2016, the number of deaths from traffic accidents worldwide reached 1.35 million. On average, one person loses his or her life in a traffic accident every 24 seconds, and the number of people injured is as high as 50 million. Traffic-related injuries and deaths are therefore a significant public health concern. In the abovementioned WHO report, it was estimated that the number of deaths from traffic accidents in China in 2016 was 256,180, accounting for approximately 19% of global traffic-related deaths that year [1]. Given this severe traffic-safety situation, China needs to focus on the management and prevention of accidents, strengthen the analysis of accidents, and increase research on accident-prevention measures. In this regard, it is necessary to investigate accidents in a timely manner to effectively and scientifically identify hidden safety hazards and improve overall accident prevention.
Using statistical methods to analyze the spatiotemporal distribution of traffic accidents in Nigeria, Jegede [2] identified six traffic areas that could be considered accident black spots; in particular, March, September, and December were found to have the highest incidence of accidents. Plug et al. [3] studied the spatiotemporal distribution of single-vehicle accidents in Australia, providing useful information to help decision-makers formulate traffic-safety strategies. Singh [4] analyzed the spatiotemporal distribution of accidents at the national, state, and metropolitan levels in India in 2003 and 2013. The most accidents occurred from May to June and from December to January; further, most accidents occurred between 9:00 and 21:00. Additionally, there were huge differences in traffic accident risk according to spatial distribution; specifically, 16 of India’s 35 states and federal territories had risks above the national average. Albayati et al. [5] analyzed the monthly and road-type distribution of accidents in Iraq from 2002 to 2015; October had the highest number of accidents, and accidents on arterial roads accounted for 59% of accidents on all types of roads. Kang et al. [6] analyzed the spatiotemporal characteristics of traffic accidents involving the elderly in Seoul. Accident black spots were found in the hiking and climbing areas of Seoul during the spring and fall. Studying the spatiotemporal characteristics of traffic accidents in highway tunnels in China, Ma et al. [7] and Sun et al. [8] found that most accidents occurred during special holidays (especially the Chinese New Year), and most occurred near the entrances and exits of tunnels. Using correlation analysis to examine accidents on a typical continuous downhill section of an expressway, Ma et al. [9] found that accident, death, and injury rates were the highest between 8:00 and 10:00. Moreover, Ma et al. [10] used big data for traffic accidents in Suzhou to analyze their spatiotemporal distribution characteristics; they found that the incidence of traffic accidents was positively correlated with road grade. Pleerux [11] used accident data for 2012–2017 collected from Thailand’s Road Accident Data Center to identify road-accident patterns and distribution; they found a high density of accidents in three main areas of the Sri Racha district of Chon Buri Province. Ramírez et al. [12] used 2014–2016 data from the traffic police department of Bogota, Colombia, regarding incidents with injuries or fatalities to identify critical zones in the city that required more attention.
Clustering algorithms disseminate objects in a dataset into several groups based on their characteristics [13]. The most-used clustering algorithms include K-means [14], fuzzy C-means [15], two-step [16], and hierarchical clustering [17]. In recent years, cluster analysis methods have been widely used in the field of traffic accident analysis [18–25]. In hierarchical clustering, a dataset is recursively partitioned into successively smaller clusters [26]. Moreover, hierarchical clustering does not require any predefined parameters and is therefore more suitable for handling real-world data than other methods [27].
Although there have been studies of the spatiotemporal characteristics of traffic accidents in various regions of China, data can be difficult to obtain for all of China. In China’s national standard Road Traffic Accident Information Investigation (GA/T 1082-2013) [28], fatal accidents are divided into four levels: general, major, severe, and particularly severe; these correspond to accidents causing 1–2, 3–9, 10–29, and 30 or more deaths, respectively. According to the Regulations for the Handling of Road Traffic Accidents [29], implemented on May 1, 2018, in the event of a traffic accident with at least five deaths (TALFD), the traffic administrative department of the public security bureau (TADPSB) should report it to the local government and to the Traffic Management Bureau of the Ministry of Public Security. In addition, the Provisions on Procedures for Handling Road Traffic Accidents (order no. 146 of the Ministry of Public Security) [30] stipulates that the TADPSB should investigate accidents causing three or more deaths and produce in-depth reports. Accordingly, we collected in-depth investigation reports of TALFDs in China from 2016 to 2019 that had been delivered to the Traffic Management Bureau of the Ministry of Public Security. In this study, statistical analysis methods, including hierarchical cluster analysis, were employed using SPSS software to explore the spatiotemporal characteristics of TALFDs.
Cluster methods are distinguished primarily by their different linkage rules for the formation of clusters. Single linkage, complete linkage, average linkage, and Ward’s method are widely used across various disciplines. Ward’s method eliminates small clusters and produces clusters of comparable sizes corresponding to a homogenized subset of the selected data file, which makes the study of the examined objects more accurate than the other methods [31]. This method was therefore selected for the present study. Squared Euclidean distance (SED) was used for Ward’s method in this study, which is expressed as follows:
where
2.2 Standardization of Variables
Variable standardization is necessary when the values for different variables are in different units. The Z-score is the most frequently used approach for variable standardization, which is carried out as follows:
where
3 Temporal Distribution Characteristics of TALFDs
3.1 Distribution Characteristics by Month
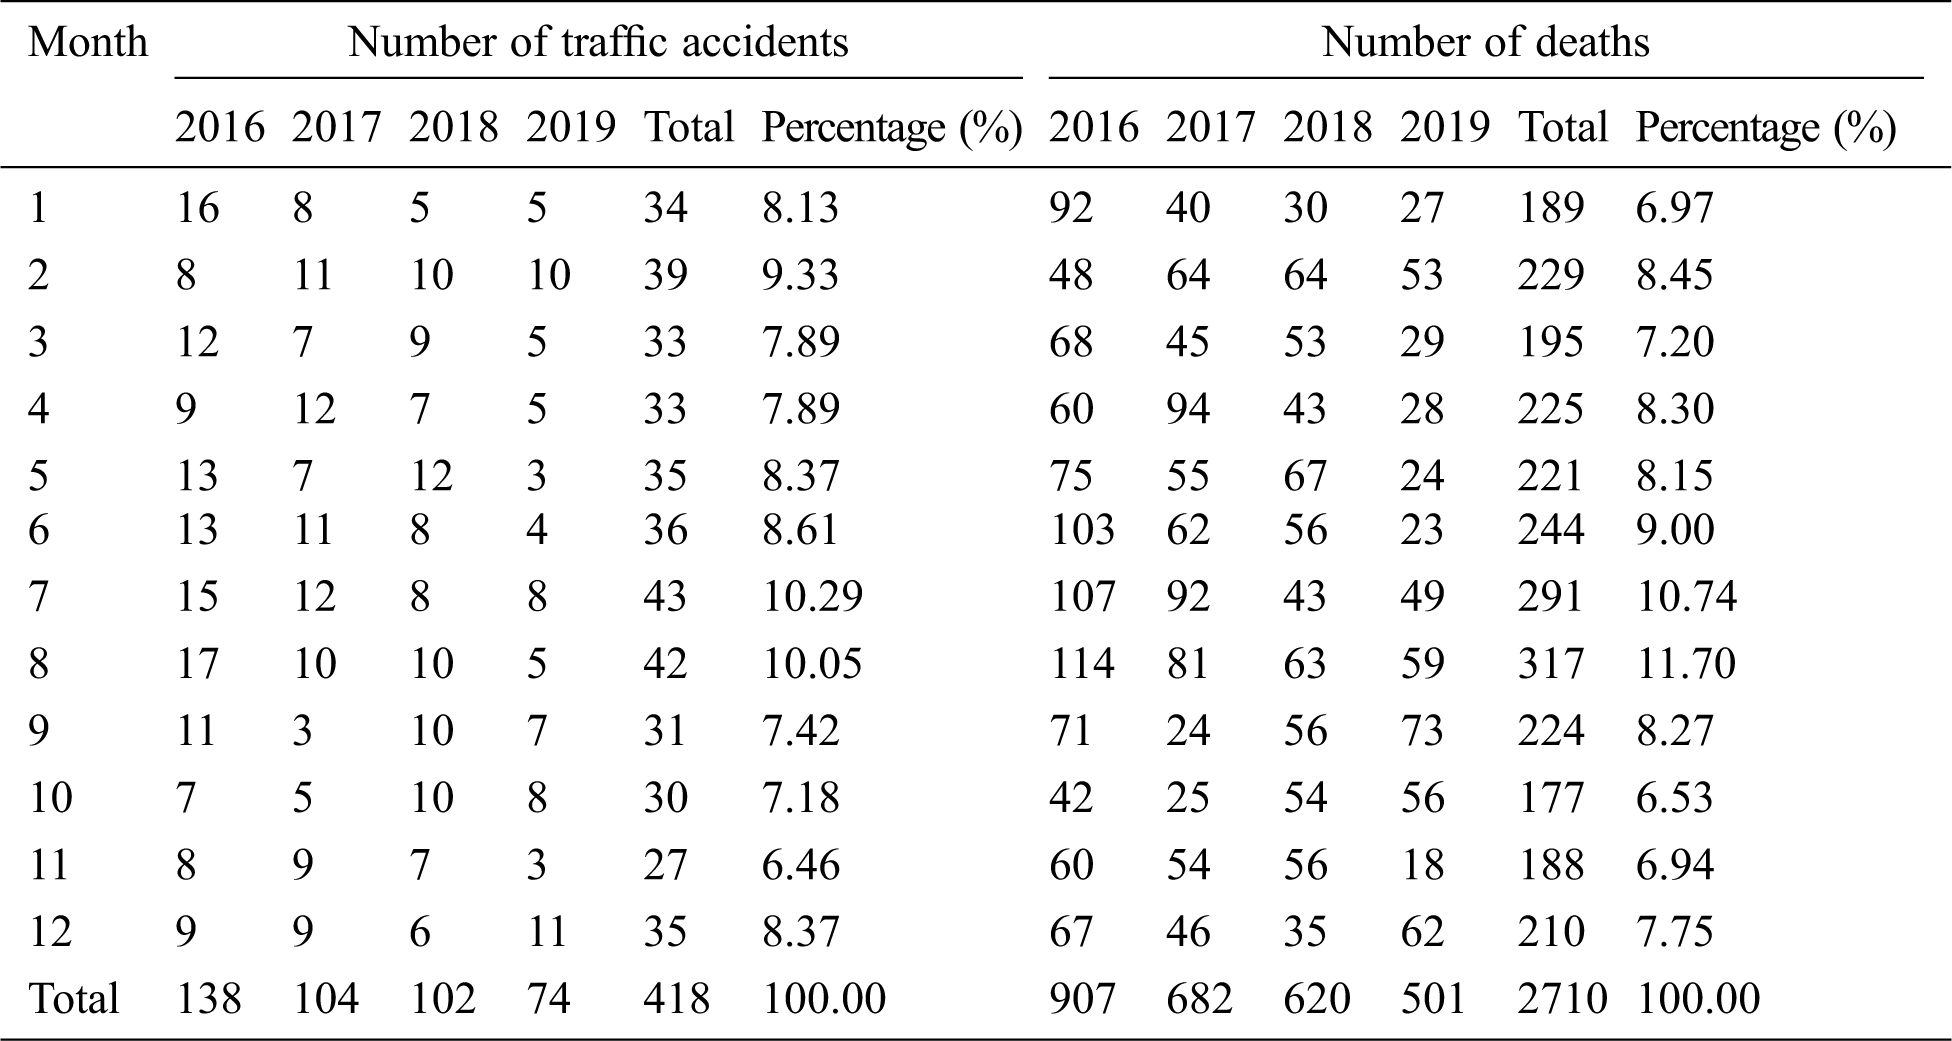
Between 2016 and 2019, there were 418 TALFDs in mainland China, resulting in a total of 2,710 deaths. There were 138 cases and 907 deaths in 2016, 104 cases and 682 deaths in 2017, 102 cases and 620 deaths in 2018, and 74 cases and 501 deaths in 2019. Tab. 1 presents details about the number and monthly distribution of TALFDs from 2016 to 2019. During the study period, the number of TALFDs in China declined, along with the total number of traffic fatalities.
Table 1: Monthly distribution of TALFDs
The figures for traffic accidents and deaths during the study period were entered into SPSS as variables, and Z-scores were used to standardize the variables. Ward’s method was used to sort the samples into classes, and rescaled distance was used to obtain a hierarchical analysis dendrogram (Fig. 1). The clustering results were divided into poor, medium, and relatively good, as shown in Tab. 2. The clustering results suggest that, during the study period, TALFDs in China were poor in July and August. Specifically, the number of accidents in July and August were 1.96 and 1.72 percentage points higher, respectively, than the monthly average of 8.33%; further, the death toll was 2.41 and 3.37 percentage points higher, respectively, than the monthly average of 8.33%. The possible reasons for this are as follows.
First, July and August belong to China’s summer vacation period, which is the peak season for tourism. Self-driving trips, long-distance bus trips, and long-distance tourist bus trips are at their peak. Thus, the risk of accidents is higher than in other months. Flat tires and spontaneous combustion are characteristic accidents that occur frequently in the summer. For example, on July 1, 2016, 26 people were killed and 4 injured in an accident on the Tianjin Jinji Expressway attributed to a punctured tire. The vehicle fell into the Yandong Canal, leading to 26 people drowning. Second, in July and August, it is very hot in most parts of China, and some drivers travel at night to avoid the high temperatures, which increases the risk of accidents due to fatigue. For example, on August 10, 2017, at 23:30, an accident attributed to driver fatigue resulted in 36 deaths and 13 injuries on the Beijing–Kunming Expressway in Ankang, Shaanxi.
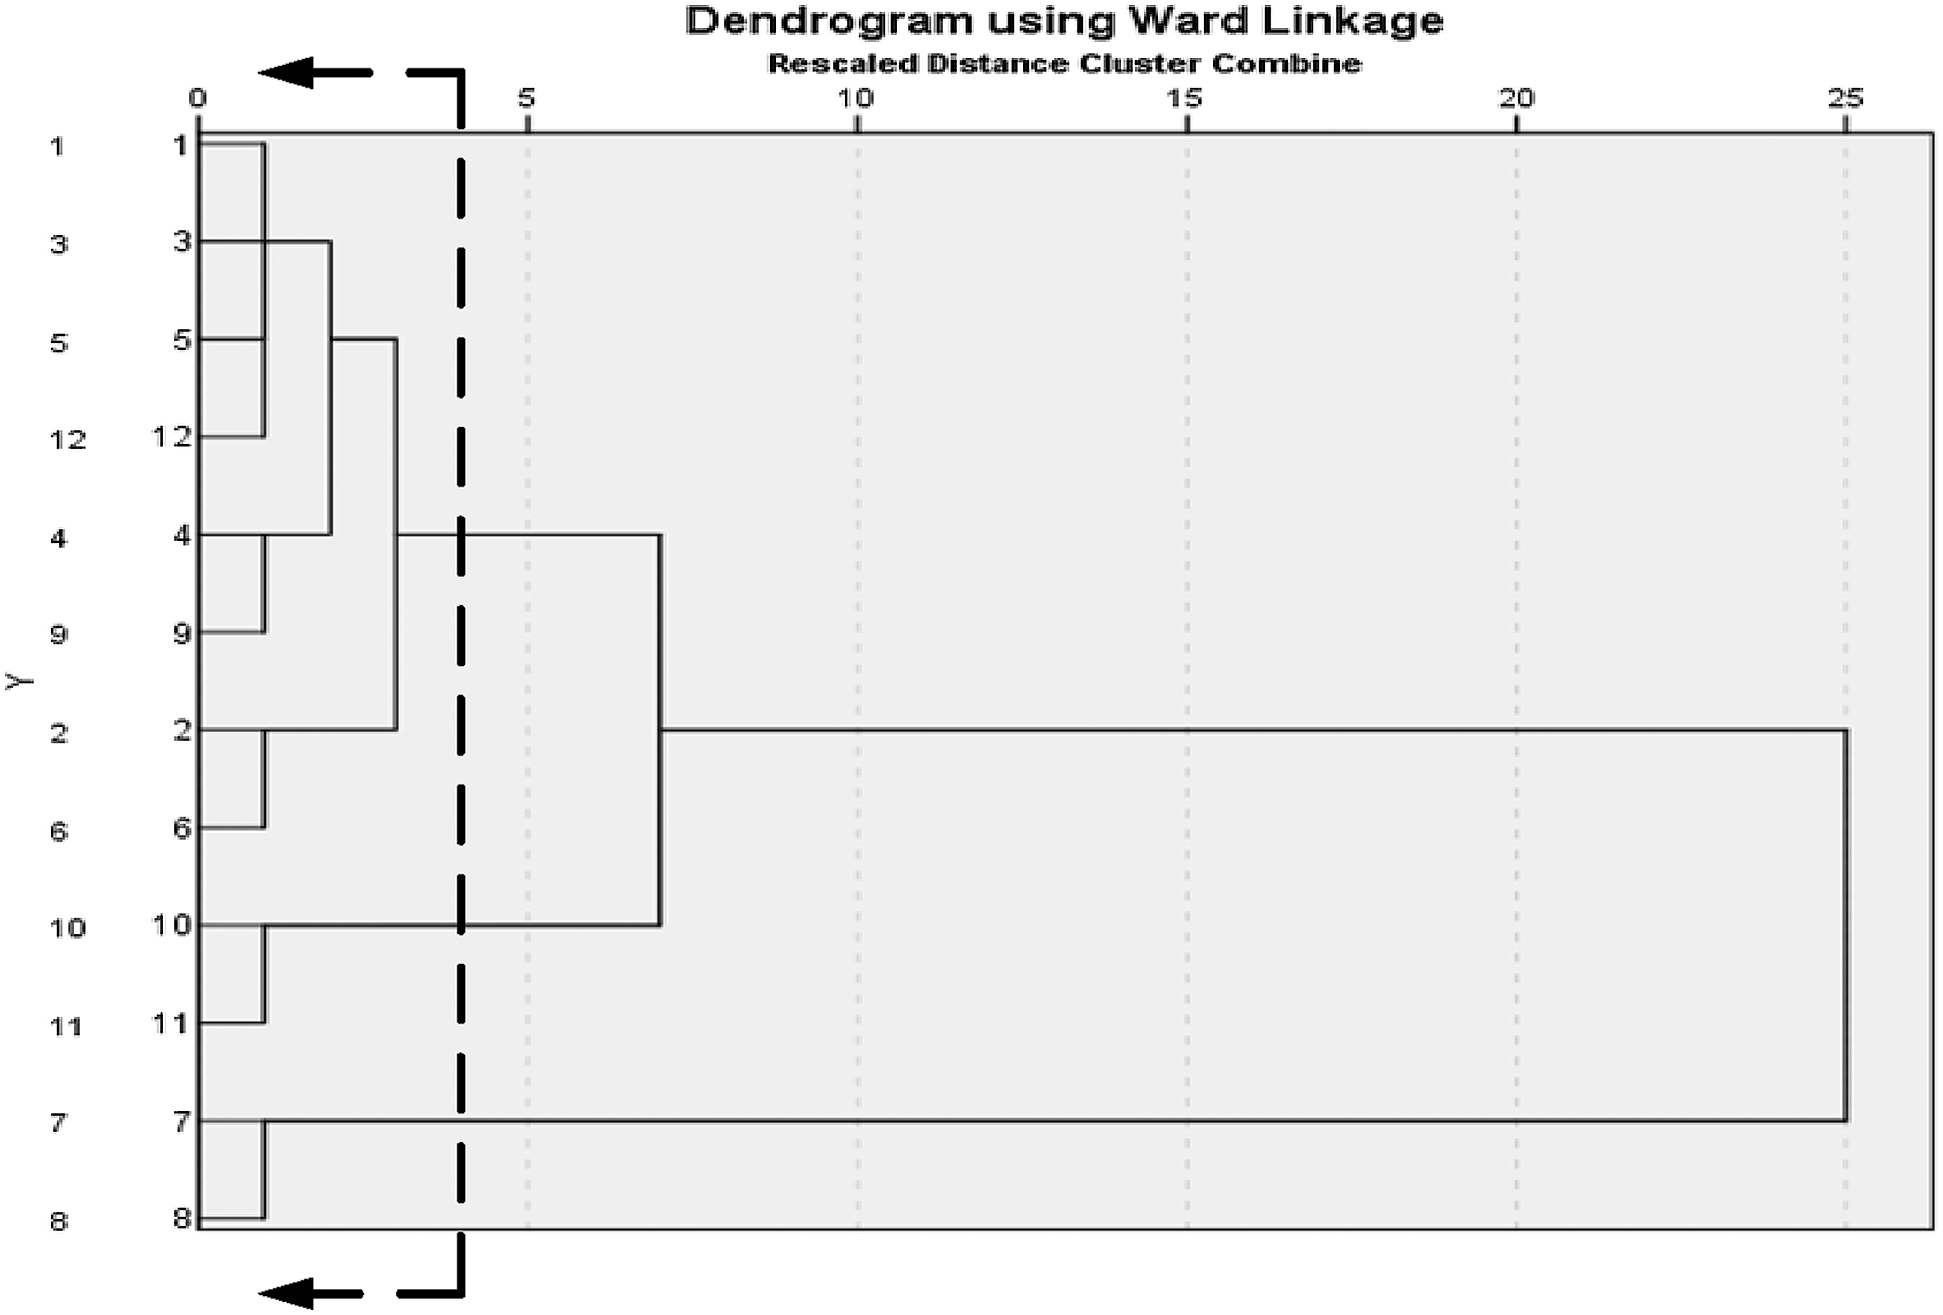
Figure 1: Hierarchical analysis dendrogram of monthly distribution
Table 2: Clustering results for monthly distribution

3.2 Distribution Characteristics by Day of the Week
Fig. 2 shows the percentage of TALFDs and percentage of deaths in China from 2016 to 2019 by day of the week. During the study period, accidents and fatalities remained relatively uniform in terms of distribution by day of the week. Only Sunday had a higher number of accidents and fatalities. Accidents and fatalities were, respectively, 2.46 and 3.31 percentage points higher on Sunday than the weekly average of 14.29%. This could be because Sunday comes at the end of the weekend break, and the total traffic volume is higher than on other days.
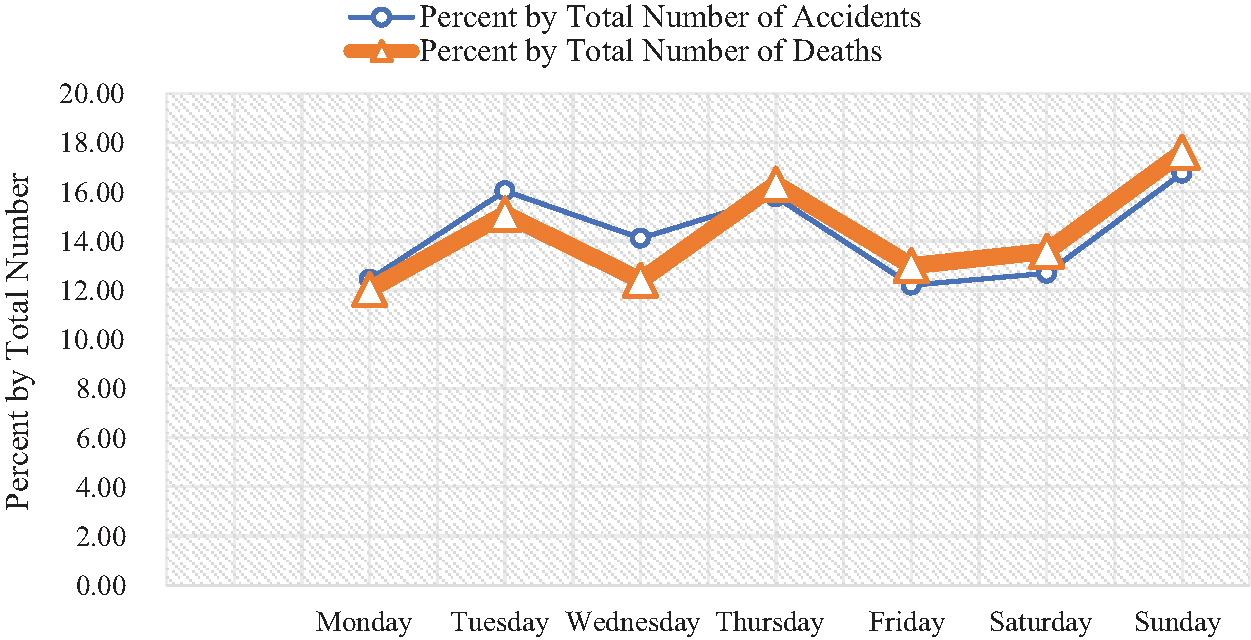
Figure 2: Distribution of TALFDs by day of the week
3.3 Distribution Characteristics by Hour of the Day
Similarly, the figures for TALFDs and deaths during the study period were entered into SPSS as variables, and Z-scores were used to standardize the variables. Ward’s method was used to sort the samples into classes, and rescaled distance was used to obtain a hierarchical analysis dendrogram (Fig. 3). As shown in Tab. 3, the clustering results were divided into relatively good, medium, poor, and worse.
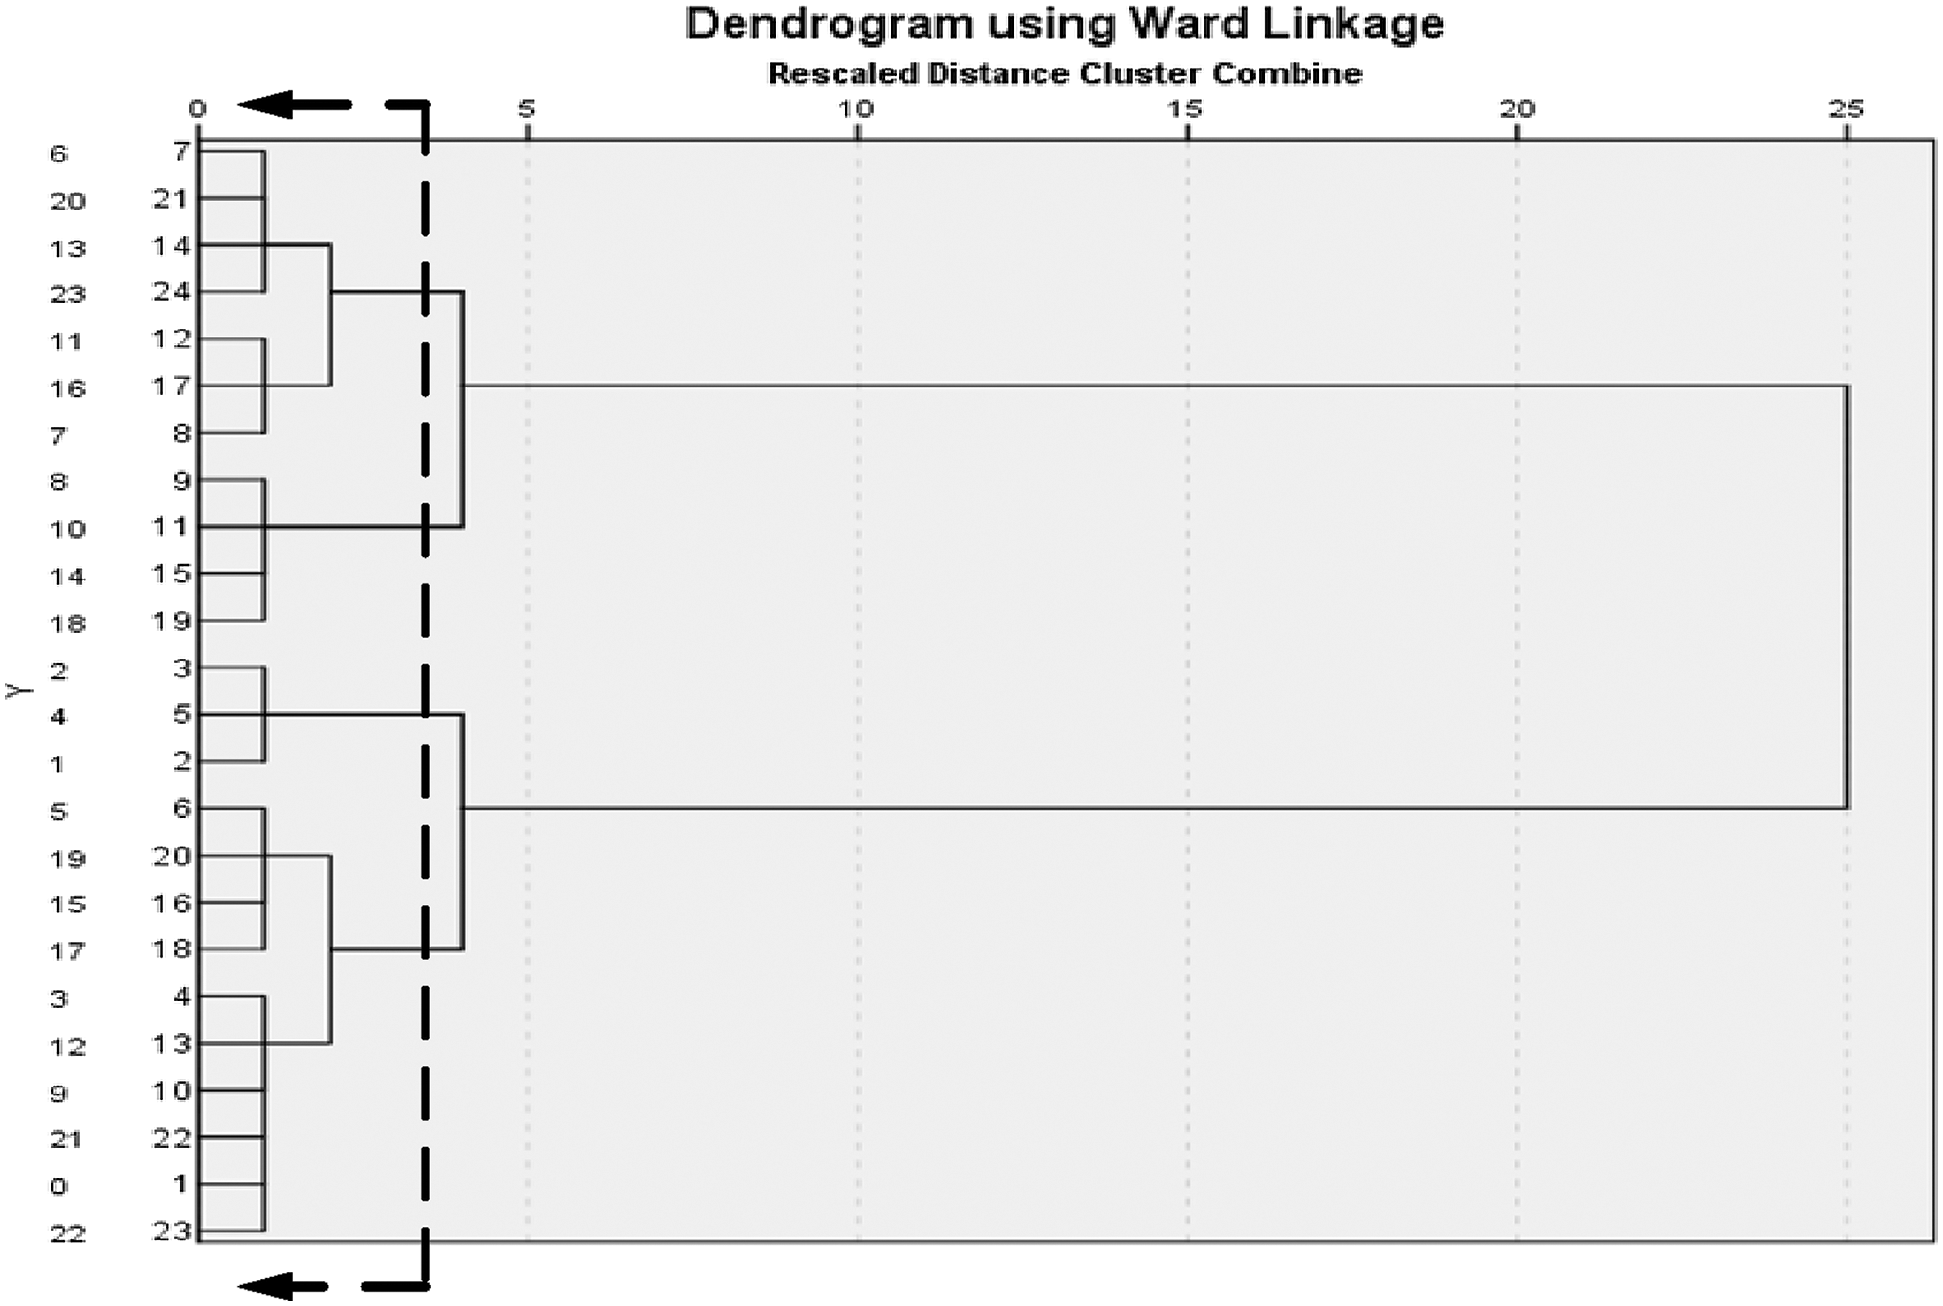
Figure 3: Hierarchical analysis dendrogram of hourly distribution
Table 3: Clustering results for hourly distribution
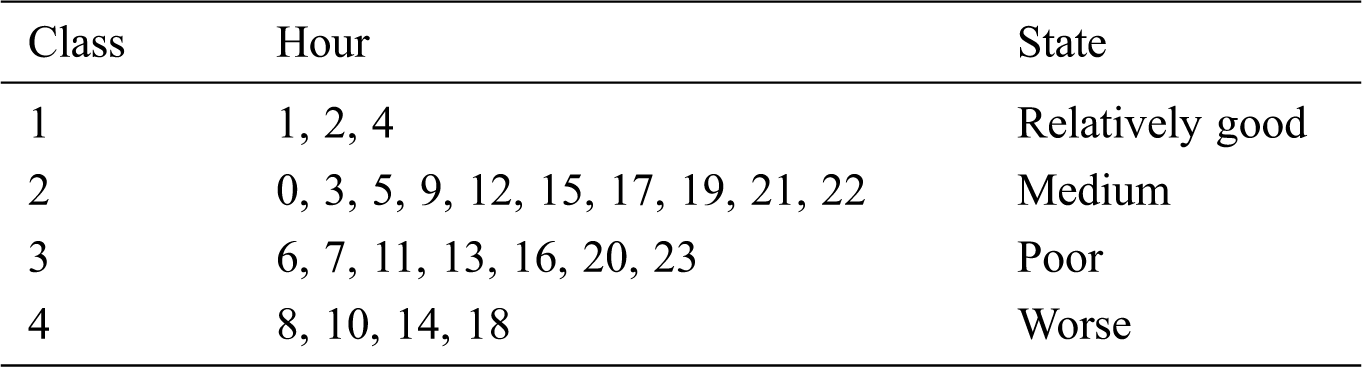
The number of accidents and fatalities was the highest during the four periods of 8:00–9:00, 10:00–11:00, 14:00–15:00, and 18:00–19:00, accounting, respectively, for 5.74% and 6.35%, 5.74% and 6.61%, 6.46% and 5.90%, and 6.70% and 5.76% of TALFDs and fatalities. The reasons are as follows: 8:00–9:00 and 18:00–19:00 are peak travel periods, and the increased travel volume increases safety risks. Meanwhile, 10:00–11:00 and 14:00–15:00 have the highest number of accidents and fatalities, which could be attributable to fatigue setting in around noon.
4 Spatial Distribution Characteristics of TALFDs
4.1 Distribution Characteristics by Region
There are 31 administrative regions in mainland China, including 24 provinces, 5 autonomous regions, and 4 municipalities. These regions significantly differ in terms of socioeconomic development, climate, geography, and road transportation infrastructure. This leads to obvious differences in the traffic-safety situation of each region. It is often customary to divide mainland China into six regions: Northeast, North, East, Northwest, Southwest, and South Central. Conditions within a given region are usually relatively the same. The Northeast includes Heilongjiang, Jilin, and Liaoning (all provinces); the North includes Beijing, Tianjin, Hebei, Shanxi, and Inner Mongolia (two provinces, two municipalities, one autonomous region); the East includes Shanghai, Jiangsu, Zhejiang, Anhui, Fujian, Jiangxi, and Shandong (six provinces, one municipality); the Northwest includes Shaanxi, Gansu, Qinghai, Ningxia, Xinjiang (three provinces, two autonomous regions); the Southwest includes Chongqing, Sichuan, Guizhou, Yunnan, and Tibet (three provinces, one municipality, one autonomous region); and South Central includes Henan, Hubei, Hunan, Guangdong, Guangxi, and Hainan (five provinces, one municipality).
Using population and vehicle ownership data [32] for each region as of the end of 2018, we calculated the death rate per 10,000 vehicles and per 100,000 inhabitants in TALFDs from 2016 to 2019 (Fig. 4). Fig. 4 shows that the four areas with the most fatalities per 10,000 vehicles in TALFDs were Tibet (0.65), Qinghai (0.33), Heilongjiang (0.27), and Ningxia (0.24). The four areas with the most fatalities per 100,000 inhabitants in TALFDs were Tibet (1.10), Qinghai (0.80), Ningxia (0.68), and Yunnan (0.51).

Figure 4: Fatalities per 10,000 vehicles and per 100,000 inhabitants in China’s 31 regions
The total number of TALFDs and deaths, fatalities per 10,000 vehicles, and fatalities per 100,000 inhabitants were entered into SPSS as variables, and Z-scores were used to standardize the variables. Ward’s method was used to sort the samples into classes, and rescaled distance was used to obtain a hierarchical analysis dendrogram (Fig. 5). The clustering results were divided into better, relatively good, medium, poor, and worse, as shown in Tab. 4.

Figure 5: Hierarchical analysis dendrogram of regional distribution
Table 4: Clustering results for regional distribution
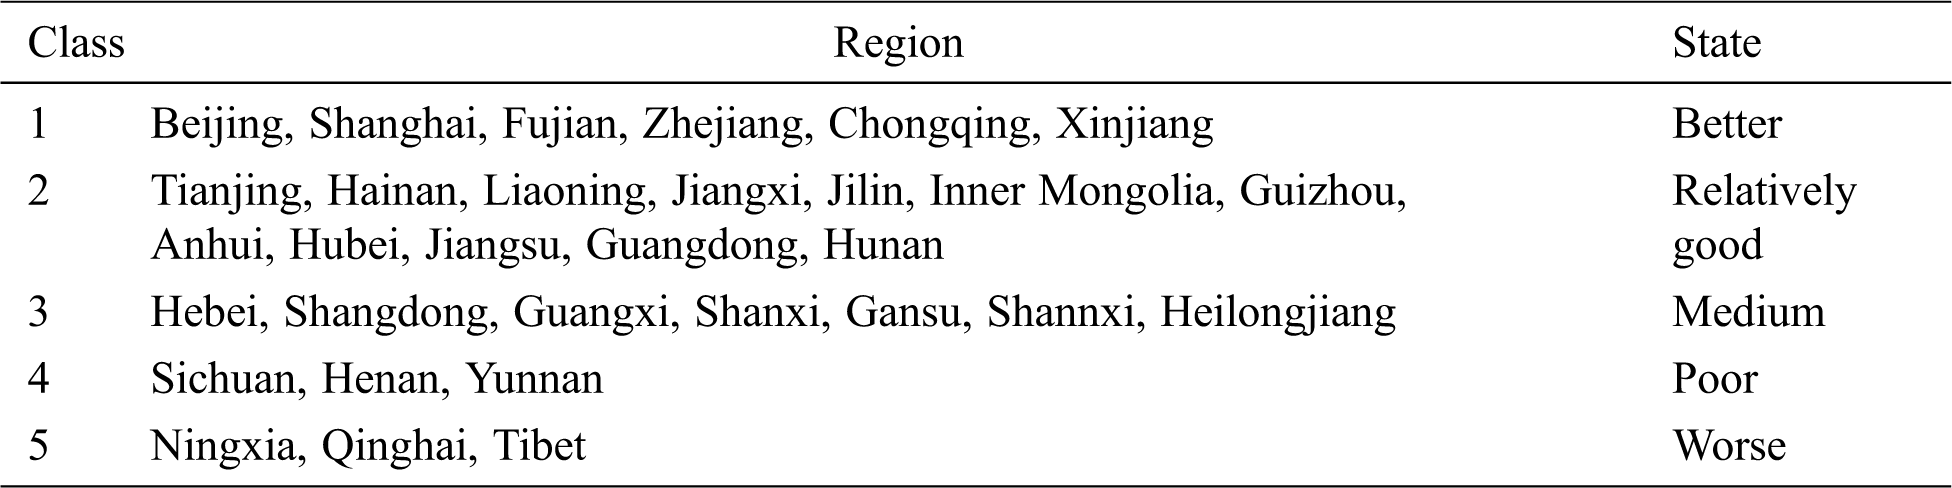
The clustering results indicate that Tibet, Qinghai, and Ningxia were the worse regions for TALFDs during the study period due to high fatality rates per 10,000 vehicles and per 100,000 inhabitants. Meanwhile, Sichuan, Henan, and Yunnan were poor regions for TALFDs because of the high numbers of traffic accidents and deaths. Sichuan and Yunnan are in Southwest China, and some TALFDs in those areas could be related to specific geographical and climatic conditions. For example, in 2016, the “11.15” severe traffic accident in Zhaotong, Yunnan Province, caused 10 deaths. In 2017, the “3.02” severe traffic accident in Lincang, Yunnan Province, caused 10 deaths and 37 injuries. Then, in 2019, the “1.12” major traffic accident in Liangshan Prefecture, Sichuan Province, caused multiple injuries and deaths. All of those accidents involved vehicles falling off of cliffs, which is relatively rare in other regions. Among other regions, Heilongjiang (Northeast), Hebei (North), Shandong (East), Shaanxi (Northwest), Yunnan (Southwest), and Henan (South Central) ranked first in their regions in the number of accidents and deaths. Thus, attention should be paid to accidents in those regions.
4.2 Distribution Characteristics for Different Road Types
The Road Traffic Safety Laws of the People’s Republic of China broadly divide roads into two categories: highways and urban roads. The standard Roadway Marking Rules and National Highway Numbering (GB/T 917–2017) [33], implemented in 2017, classifies highways into five grades: expressway, first-class highway, second-class highway, third-class highway, and fourth-class highway. Among these, highways other than expressways are called ordinary highways. The present study divided roads into three categories: urban roads, expressways, and ordinary highways.
Figs. 6 and 7 show the number of TALFDs and their fatalities by road type during the study period. The number of TALFDs and their fatalities were the highest on ordinary highways, accounting for 70.10% and 64.32% of the total, respectively. TALFDs on expressways accounted for approximately one-quarter of the total, but the death toll exceeded 30%. Urban roads only accounted for approximately 5% of TALFDs and deaths, making urban roads the lowest among the three road types. The reasons for these findings are as follows: At the end of 2018, the total mileage of roads in China was 4,846,500 km, with expressways accounting for 142,600 km [34]. The total mileage of ordinary highways was approximately 33 times that of expressways. Moreover, China’s territory is vast, and road infrastructures and traffic-safety facilities are very different for ordinary highways in different places. Therefore, ordinary highways, especially mountain highways in the Southwest, involve a higher risk of TALFDs. Furthermore, expressway TALFDs accounted for a quarter of TALFDs but 30% of fatalities. This is because expressway traffic density is high, driving speeds are fast, and multivehicle crashes are prone to occur under severe weather conditions. During the study period, three traffic accidents involving more than 30 deaths occurred across the country: the 2016 “6.26” particularly severe traffic accident on Yifeng Expressway in Chenzhou, Hunan; the 2017 “8.10” particularly severe traffic accident on the Beijing–Kunming Expressway in Ankang, Shaanxi; and the 2019 “9.28” particularly severe traffic accident on the Changchun–Shenzhen Expressway in Wuxi, Jiangsu. All occurred on expressways. On urban roads, TALFDs and their fatalities only accounted for approximately 5%, which is not a high proportion. Although the traffic volume on urban roads is large, the speed limit is generally low, traffic safety facilities are abundant, and traffic management measures are more stringent than for highways. Therefore, compared to expressways and ordinary highways, the risk of TALFDs is lower on urban roads.

Figure 6: Percentage distribution of the number of TALFDs on different types of roadways

Figure 7: Percentage distribution of deaths from TALFDs on different types of roadways
From 2016 to 2019, the number of TALFDs and their related fatalities showed a steady year-by-year decline in China. This study analyzed the spatiotemporal distribution characteristics of TALFDs in China from 2016 to 2019. The main conclusions are as follows:
(1) Regarding time distribution, a high number of accidents occurred in July and August—1.96 and 1.72 percentage points higher, respectively, than the monthly average. The death toll during those months was 2.41 and 3.37 percentage points higher, respectively, than the monthly average. The distribution of accidents by day of the week was relatively uniform. Only Sunday had a higher number of accidents and deaths—2.46 and 3.31 percentage points higher, respectively, than the weekly average. Regarding the time of day, accidents and fatalities were the highest during the one-hour periods of 8:00–9:00, 10:00–11:00, 14:00–15:00, and 18:00–19:00.
(2) Regarding spatial distribution, Tibet, Qinghai, and Ningxia had the highest death rates per 10,000 vehicles and per 100,000 inhabitants in TALFDs. However, the number of accidents and the number of deaths were the highest in Sichuan, Henan, and Yunnan. In terms of road type, accidents on ordinary highways accounted for approximately 70% of the total while deaths accounted for approximately 64%. Accidents on expressways accounted for approximately one-fourth of the total, but the death toll exceeded 30%. Additionally, urban roads only accounted for approximately 5% of accidents and fatalities.
This study examined the spatiotemporal distribution characteristics of 418 TALFDs in China from 2016 to 2019. The findings can help improve the effectiveness and scientific nature of accident-prevention work. It should be noted that the time span of the study object is short, and the data sample size is small. Therefore, a long-term follow-up study should be undertaken in the future. In addition, GIS technology has been a popular tool for the visualization of accident data and hotspot analysis in recent years. In future research, analysis methods based on GIS should be employed to describe the spatiotemporal characteristics of TALFDs.
Acknowledgement: We thank LetPub (www.letpub.com) for its linguistic assistance during the preparation of this manuscript.
Funding Statement: This work was supported by the Fifth 333 High-Level Talents Project of Jiangsu Province (grant no. BRA2017443) and the Key Research Base of Jiangsu University, Philosophy and Social Science (grant no. 2018ZDJD-B007).
Conflicts of Interest: The authors declare that they have no conflicts of interest to report regarding the present review.
1. World Health Organization [WHO]. Global status report on road safety 2018. Geneva: World Health Organization, 2018[Online]. Available:https://www.who.int/violence_injury_prevention/road_safety_status/2018/en. [Google Scholar]
2. F. J. Jegede, “Spatio-temporal analysis of road traffic accidents in Oyo State,” Nigeria Accident Analysis & Prevention, vol. 20, no. 3, pp. 227–243, 1988. [Google Scholar]
3. C. Plug, J. H. Xia and C. Caulfield, “Spatial and temporal visualisation techniques for crash analysis,” Accident Analysis & Prevention, vol. 43, no. 6, pp. 1937–1946, 2011. [Google Scholar]
4. S. K. Singh, “Road traffic accidents in India: Issues and challenges,” Transportation Research Procedia, vol. 25, no. 9, pp. 4708–4719, 2017. [Google Scholar]
5. A. H. Albayati and R. H. Lateif, “Statistical analysis of mortality and morbidity due to traffic accidents in Iraq,” Journal of Engineering, vol. 24, no. 1, pp. 20–40, 2018. [Google Scholar]
6. Y. Kang, N. Cho and S. Son, “Spatiotemporal characteristics of elderly population’s traffic accidents in Seoul using space-time cube and space-time kernel density estimation,” PLoS One, vol. 13, no. 5, pp. e0196845, 2018. [Google Scholar]
7. Z. L. Ma, C. F. Shao and S. R. Zhang, “Characteristics of traffic accidents in Chinese freeway tunnels,” Tunnelling and Underground Space Technology, vol. 24, no. 3, pp. 350–355, 2009. [Google Scholar]
8. H. Sun, Q. Wang, P. Zhang, Y. J. Zhong and X. B. Yue, “Spatialtemporal characteristics of tunnel traffic accidents in China from 2001 to present,” Advances in Civil Engineering, vol. 2019, no. 6, pp. 1–12, 2019. [Google Scholar]
9. Z. L. Ma, H. L. Zhang and X. W. Tan, “Temporal-spatial distribution characteristics of traffic accidents on freeway continuous downgrade segment,” China Safety Science Journal, vol. 24, no. 5, pp. 85–91, 2014 (In Chinese). [Google Scholar]
10. J. Ma, L. Y. Zhang, X. Huang, S. Lu and J. Ge, “Quantitative study and analysis of the mechanism of the road traffic accidents based on traffic accidents big data in Suzhou, ” in 19th COTA Int. Conf. of Transportation Professionals. Nanjing, China, 4493–4503, 2019. [Google Scholar]
11. N. Pleerux, “Geographic information system-based analysis to identify the spatiotemporal patterns of road accidents in Sri Racha, Chon Buri, Thailand,” Current Applied Science and Technology, vol. 20, no. 1, pp. 59–70, 2020. [Google Scholar]
12. A. F. Ramírez and C. Valencia, “Spatiotemporal correlation study of traffic accidents with fatalities and injuries in Bogota (Colombia),” Accident Analysis & Prevention, vol. 149, pp. 1–18, 2021. [Google Scholar]
13. N. Parvathavarthini, N. Karthikeyani Visalakshi, S. Shanthi and M. Madhan Mohan, “An improved crow search based intuitionistic fuzzy clustering algorithm for healthcare applications,” Intelligent Automation & Soft Computing, vol. 26, no. 2, pp. 253–260, 2020. [Google Scholar]
14. X. Tang, M. Zhang, P. Yu, W. Liu, N. Cao et al., “A nonuniform clustering routing algorithm based on an improved k-means algorithm,” Computers Materials & Continua, vol. 64, no. 3, pp. 1725–1739, 2020. [Google Scholar]
15. R. Xing and C. Li, “Fuzzy c-means algorithm automatically determining optimal number of clusters,” Computers Materials & Continua, vol. 60, no. 2, pp. 767–780, 2019. [Google Scholar]
16. W. Li, M. Zhou and H. Dong, “Classifications of stations in urban rail transit based on the two-step cluster,” Intelligent Automation & Soft Computing, vol. 26, no. 3, pp. 531–538, 2020. [Google Scholar]
17. G. Guo, K. Yu, H. Wang, S. Lin, Y. Xu et al., “Quantum hierarchical agglomerative clustering based on one dimension discrete quantum walk with single-point phase defects,” Computers Materials & Continua, vol. 65, no. 2, pp. 1397–1409, 2020. [Google Scholar]
18. V. Prasannakumar, H. Vijith, R. Charutha and N. Geetha, “Spatio-temporal clustering of road accidents: GIS based analysis and assessment,” Procedia-Social and Behavioral Sciences, vol. 21, no. 1, pp. 317–325, 2011. [Google Scholar]
19. D. J. Dai, “Identifying clusters and risk factors of injuries in pedestrian-vehicle crashes in a GIS environment,” Journal of Transport Geography, vol. 24, pp. 206–214, 2012. [Google Scholar]
20. M. Bíl, R. Andrášik and Z. Janoška, “Identification of hazardous road locations of traffic accidents by means of kernel density estimation and cluster significance evaluation,” Accident Analysis & Prevention, vol. 55, pp. 265–273, 2013. [Google Scholar]
21. H. Yu, P. Liu, J. Chen and H. Wang, “Comparative analysis of the spatial analysis methods for hotspot identification,” Accident Analysis & Prevention, vol. 66, no. 2083, pp. 80–88, 2014. [Google Scholar]
22. G. Yalcin and H. S. Duzgun, “Spatial analysis of two-wheeled vehicles traffic crashes: Osmaniye in Turkey,” KSCE Journal of Civil Engineering, vol. 19, no. 7, pp. 2225–2232, 2015. [Google Scholar]
23. Y. X. Fan, X. Y. Zhu, B. She, W. Guo and T. Guo, “Network-constrained spatio-temporal clustering analysis of traffic collisions in Jianghan District of Wuhan, China,” PLoS One, vol. 13, no. 4, pp. e0195093, 2018. [Google Scholar]
24. Z. Y. Cheng, Z. S. Zu and J. Lu, “Traffic crash evolution characteristic analysis and spatiotemporal hotspot identification of urban road intersections,” Sustainability, vol. 11, no. 1, pp. 1–17, 2019. [Google Scholar]
25. S. Leonardi, N. Distefano and G. Pulvirenti, “Identification of road safety measures by elderly pedestrians based on K-means clustering and hierarchical cluster analysis,” Archives of Transport, vol. 56, no. 4, pp. 107–118, 2020. [Google Scholar]
26. V. C. Addad, V. Kanade, F. M. Trenn and C. Mathieu, “Hierarchical clustering: Objective functions and algorithms,” Journal of the ACM, vol. 66, no. 4, pp. 26.1–26.42, 2019. [Google Scholar]
27. A. Bouguettaya, Q. Yu, X. Liu, X. M. Zhou and A. Song, “Efficient agglomerative hierarchical clustering,” Expert Systems with Applications, vol. 42, no. 5, pp. 2785–2797, 2015. [Google Scholar]
28. The Ministry of Public Security of the People's Republic of China. Road traffic accident information investigating (GA/T1082-2013). Beijing: The Ministry of Public Security of the People's Republic of China, 2013(In Chinese). [Google Scholar]
29. Traffic Management Bureau of the Public Security Ministry. Specifications for road traffic accident handling. Beijing: Traffic Management Bureau of the Public Security Ministry, 2018(In Chinese). [Google Scholar]
30. The Ministry of Public Security of the People's Republic of China. The procedural regulations for handling road traffic accidents. No. 146 Decree of the Ministry of Public Security of the People's Republic of China. Beijing: The Ministry of Public Security of the People's Republic of China, 2017 (In Chinese). [Google Scholar]
31. I. Majerova and J. Nevima, “The measurement of human development using the Ward method of cluster analysis,” Journal of International Studies, vol. 10, no. 2, pp. 239–257, 2017. [Google Scholar]
32. China's National Bureau of Statistics. China Statistical Year Book 2019. Beijing, China: China Statistical Press, 2019[Online]. Available:http://www.stats.gov.cn/tjsj/ndsj/2019/indexeh.htm. [Google Scholar]
33. General Administration of Quality Supervision, Inspection and Quarantine of the People's Republic of China and Standardization Administration of the People's Republic of China. Mark rules of highway route and number of national trunk highway (GB/T 917-2017). Beijing, China: Standards Press of China, 2017 (In Chinese). [Google Scholar]
34. Ministry of Transport of the People’s Republic of China. Statistical Communique on Development of Transport Sector in 2018 [Online]. Available:http://xxgk.mot.gov.cn/jigou/zhghs/201904/t20190412_3186720.html. [Google Scholar]
 | This work is licensed under a Creative Commons Attribution 4.0 International License, which permits unrestricted use, distribution, and reproduction in any medium, provided the original work is properly cited. |