DOI:10.32604/iasc.2021.01010
| Intelligent Automation & Soft Computing DOI:10.32604/iasc.2021.01010 | |
| Article |
A Pregnancy Prediction System based on Uterine Peristalsis from Ultrasonic Images
1National Institute of Technology (KOSEN), Maizuru College, Maizuru, 625-8511, Japan
2Reproduction Clinic Osaka, Osaka, 530-0011, Japan
3University of Hyogo, Kobe, 650-0047, Japan
*Corresponding Author: Kentaro Mori. Email: k.mori@maizuru-ct.ac.jp
Received: 04 December 2019; Accepted: 03 July 2020
Abstract: In infertility treatment, it is required to improve a success rate of the treatment. A purpose of this study is to develop a prediction system for pregnancy outcomes using ultrasonic images. In infertility treatment, it is typical to evaluate the endometrial shape by using ultrasonic images. The convolutional neural network (CNN) system developed in the current study predicted pregnancy outcome by velocity information. The velocity information has a movement feature of uterine. It is known that a uterine movement is deep related to infertility. Experiments compared the velocity-based and shape-based systems. The shape-based systems predict the optimal uterine features for pregnancy success based on endometrial shape by inputting original ultrasonic images to CNN model. The current findings revealed that the velocity-based system provided similar accuracy to the shape-based systems. However, the output of the velocity-based system, the area under curve (AUC) for the receiver operating characteristic (ROC) curve, provided a higher value than the shape-based systems. The AUC values of the shape-based and velocity-based systems were 0.65, and 0.72, respectively. These results showed that the analysis of the velocity of uterine movements was effective for pregnancy outcome prediction. Previous clinical evaluation did not target the uterine movement but only the endometrial shape. Therefore, this study has revealed a new treatment approach for infertility.
Keywords: Convolutional neural network (CNN); Infertility; Pregnancy prediction; Ultrasonic image; Uterine peristalsis
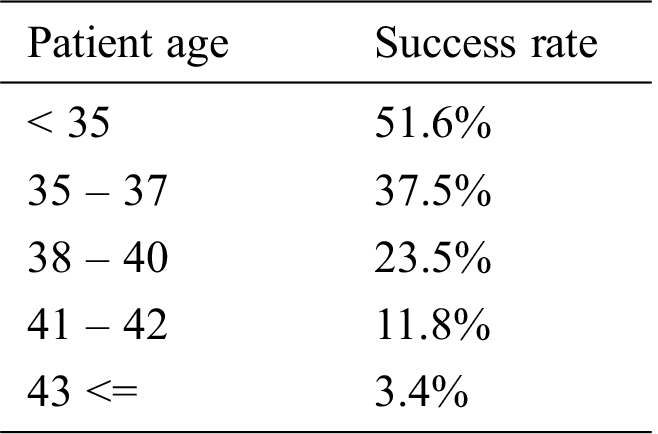
Infertility is defined by the World Health Organization (WHO) as follows: A disease of the reproductive system defined by the failure to achieve a clinical pregnancy after 12 months or more of regular unprotected sexual intercourse [1]. Assisted Reproductive Technology (ART), including In Vitro Fertilization (IVF) and Intra Cytoplasmic Sperm Injection (ICSI), is an infertility treatment method. A pregnancy rate by ART is higher than conventional infertility treatment methods. However, it is not enough success rates. Centers for Disease Control and Prevention (CDC) has reported ART success rates in the U.S [2]. Tab. 1 shows the reported ART success rates. These rates show a percentage of intended retrievals resulting in live births. We confirm that the highest rate is 51.6%, and the rate falls below 5% when the age is over 43 years. These success rates are not enough high. In infertility treatment, it is required to improve a success rate for infertility treatment.
Ultrasonic images of B-mode are often used at infertility treatment. It is known that an endometrial shape displayed on the ultrasonic image is changed with a menstrual cycle [3–5]. Before ovulation, the endometrium has a leaf-like shape as shown in Fig. 1a. This shape is called a leaf pattern. After ovulation, the endometrium has a uniform shape as shown in Fig. 1b. This shape is called a homogenous pattern. A physician evaluates a state for pregnancy based on the endometrial shapes. It is considered that a leaf pattern has a high pregnancy rate and homogenous pattern has a low pregnancy rate. This knowledge is based on relationships between the endometrial shapes and a menstrual cycle. The endometrial shapes in the ultrasonic image are evaluated by physician’s visual observation. However, it is not easy to correctly evaluate the endometrial shapes from the ultrasonic image. In many cases, the treatment fails even if the physician determines a leaf pattern, and the treatment succeeds even if the physician determines a homogenous pattern. In order to correctly evaluate the endometrial shapes, we have proposed an evaluation system for a pregnancy based on a Local Binary Pattern (LBP) feature [6]. A LBP is feature values showing local shape information for an image [7,8]. The proposed system predicts success or failure of a pregnancy from the ultrasonic image based on the endometrium shape information. We confirmed that the system had 70% accuracy. However, it is difficult to improve the accuracy because endometrial shapes displayed on the ultrasonic image are not stable due to the angle of incidence of ultrasonic wave. Furthermore, the proposed method was affected by a uterine direction. In this paper, the authors aligned the uterine direction by rotating images manually. This was subjective. Thus, it is not easy to develop an automated aligning uterine direction method because endometrium has large individual difference for the shapes and sizes. These are serious problems of the proposed system. Therefore, we will develop a prediction system for a pregnancy without LBP from a new viewpoint in order to improve the prediction accuracy.
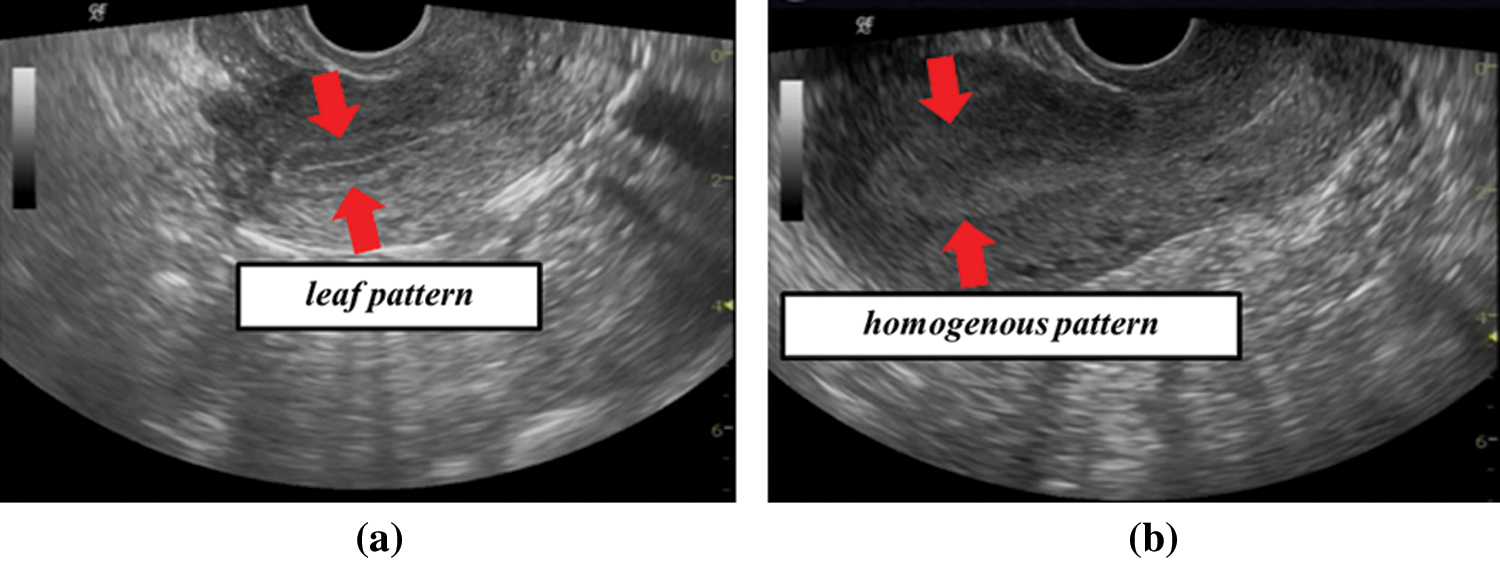
Figure 1: Examples of ultrasonic images (a) leaf pattern (b) homogenous pattern
It is known that uterus has movements called uterine peristalsis that assists in the transport of sperms, and a direction and frequency of the peristalsis change in each menstrual cycle [9–12]. Uterine peristalsis is mainly observed by using Cine magnetic resonance imaging (Cine MRI) images but it can be possible to observe it by using the ultrasonic images. Therefore, menstrual cycle information can be predicted by analyzing uterine peristalsis from the ultrasonic images. A leaf pattern occurs before ovulation and homogenous pattern occurs after ovulation. A frequency of peristalsis decreases from an ovulation phase to luteal phase. Therefore, it is considered that the movement features at leaf pattern and homogenous pattern are different. A pregnancy can be predicted without depending on the endometrium shapes by analyzing the movement.
The images shown in Figs. 1a and 1b are obtained by inserting an ultrasonic probe into vagina. The image is affected by camera shake because the probe is controlled by physician’s hand. Therefore, it is not easy to extract uterine peristalsis from the ultrasonic images. We showed that movement velocity of uterine peristalsis was 0.68 mm/sec [13]. It is possible to extract only uterine peristalsis from the ultrasonic images by analyzing velocity information.
A convolutional neural network (CNN) is a class of deep neural network that is composed of convolution and pooling layer. A CNN is very popular in image analysis field. A background of the popularity is that AlexNet [14], VGGNet [15], and Residual Networks (ResNet) [16] obtained high performance. A CNN has been also used in field of medical image analysis, because it has high recognition accuracy for various images. For example, there are lung pattern classification [17], breast ultrasound lesions detection [18], blood cell image classification by combining CNN and recursive neural network [19], and feature extraction of tumor image proposed [20].
In this paper, we develop a pregnancy prediction system based on a CNN. We compare effects of shape with velocity on the prediction system by developing two type systems. The shape-based system, that is conventional theory, predicts a pregnancy by using original ultrasonic images. The velocity-based system, that is new theory, predicts a pregnancy by using images generated from velocity. We evaluate the new one by comparing the two systems.
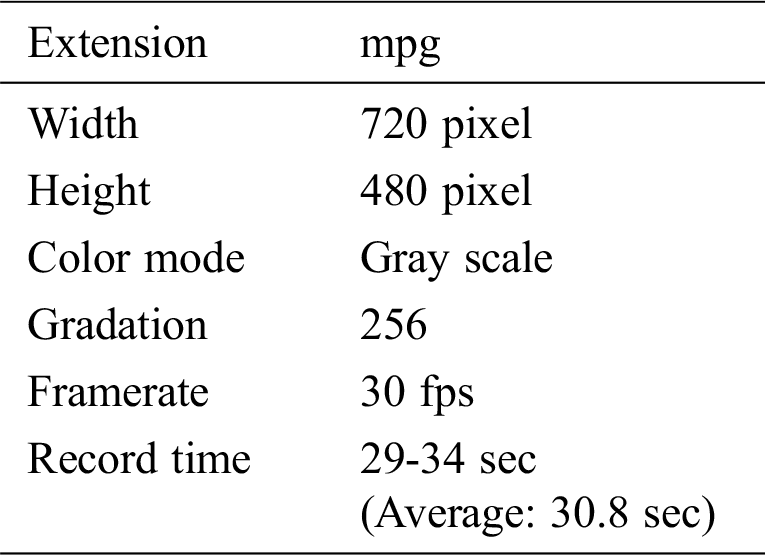
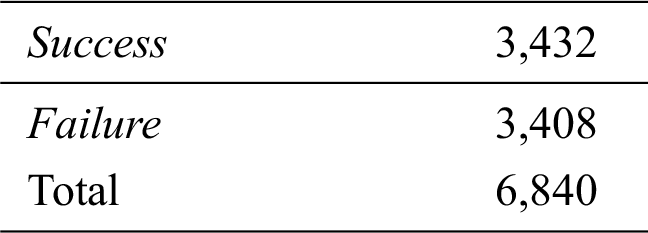
In this paper, an analysis target is ultrasonic B-mode images of female infertility patients taken in Reproduction Clinic Osaka. We have 38 type images as dataset. These images have information of a leaf or homogenous pattern that is classified by a physician. Furthermore, it has information of success or failure of a pregnancy. Tab. 2 shows the number of subjects. Since the ultrasonic images are taken in time series for each patient the dataset is movie files. Tab. 3 shows a detail of the movie files.
Table 2: The number of subjects
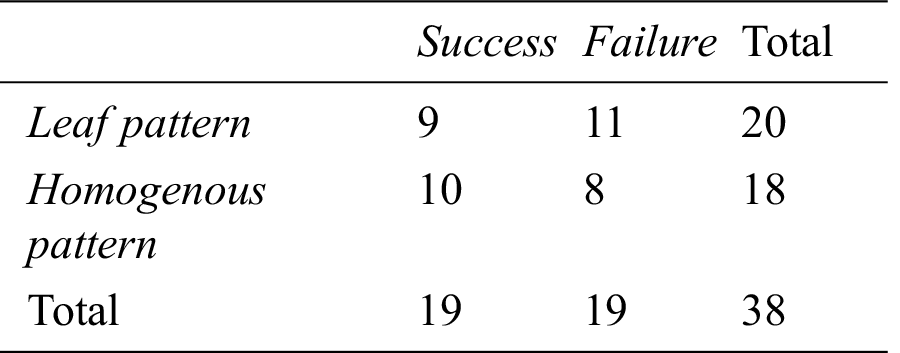
Table 3: Detail of movie files
In this section, we develop a prediction system by the ultrasonic images as a pre-experiment. It is generally thought that endometrial shapes affect a pregnancy. Therefore, we develop a system that evaluates an endometrial shape from the ultrasonic image by a CNN. Prediction accuracy for a pregnancy is evaluated by using the developed system.
An averaging filter of 5 × 5 pixels is applied to the ultrasonic images as preprocessing. An average image is generated every second from the movie file by calculating an average for a time axis. 30 images are generated from 30 second movie by this process. An endometrial region is extracted from the average image by using a mask image. The mask image has been manually generated in advance. Fig. 2 shows original image, mask image, extracted image by the mask, and resized image. This mask works to extract endometrium region from ultrasonic images. Since an endometrial shape and direction have individual differences, the extracted region size is different from each other. Rotation processes every 60 degrees are applied to the extracted images. The obtained image is saved in 224 × 224 pixels. Fig. 2d shows the saved image of 224 × 224 pixel size. Fig. 3 shows example of the saved images. A vertical axis in Fig. 3 shows time of movie file, and horizontal axis shows rotated images. Tab. 4 shows the number of the saved images.
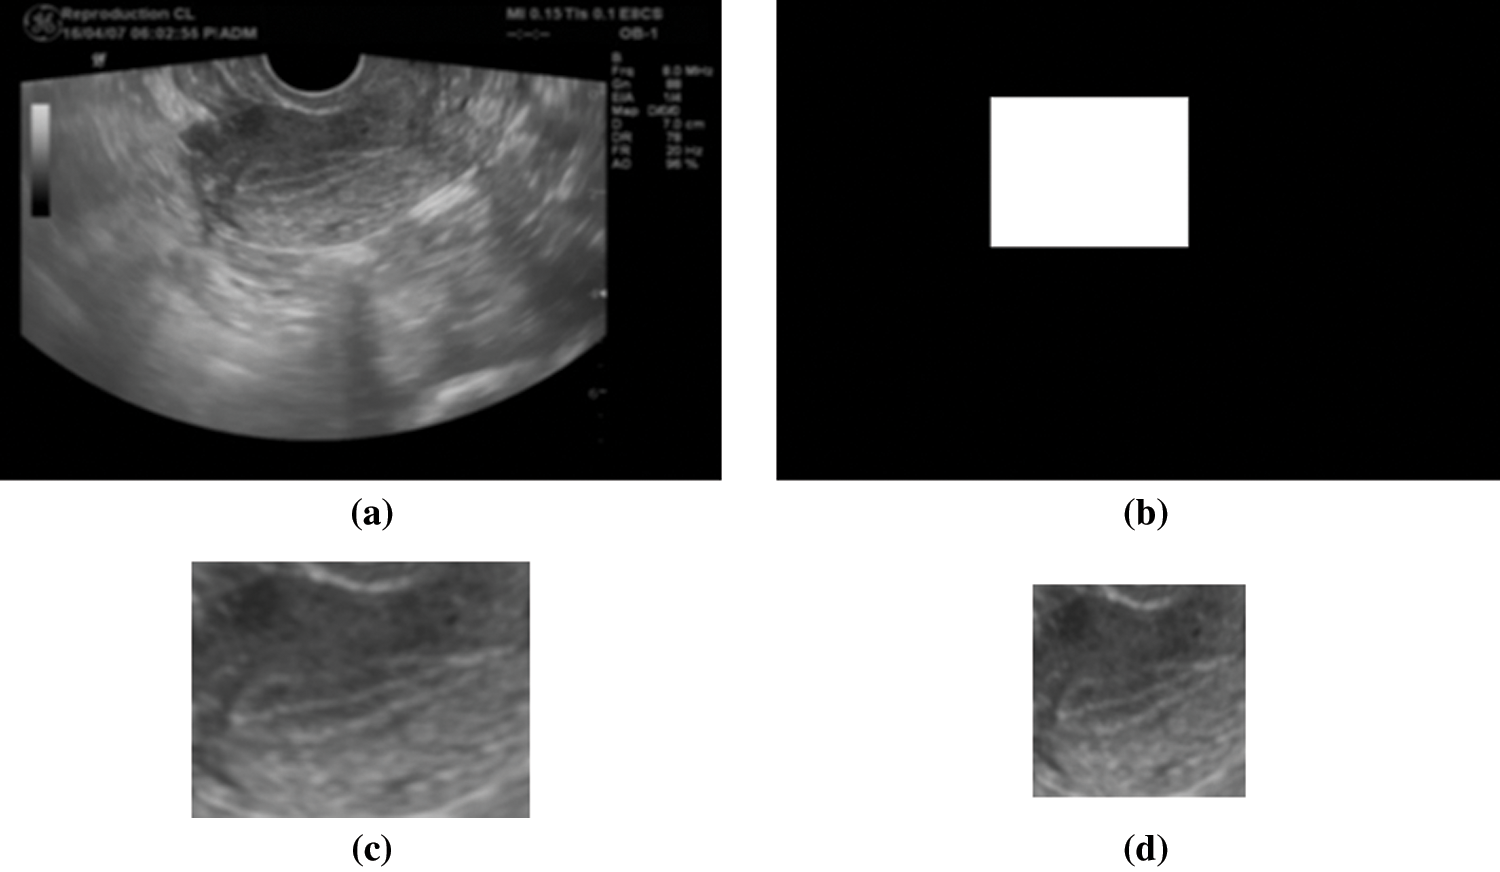
Figure 2: Examples of images in the mask process (a) original image (b) mask image (c) extracted image (d) resized image
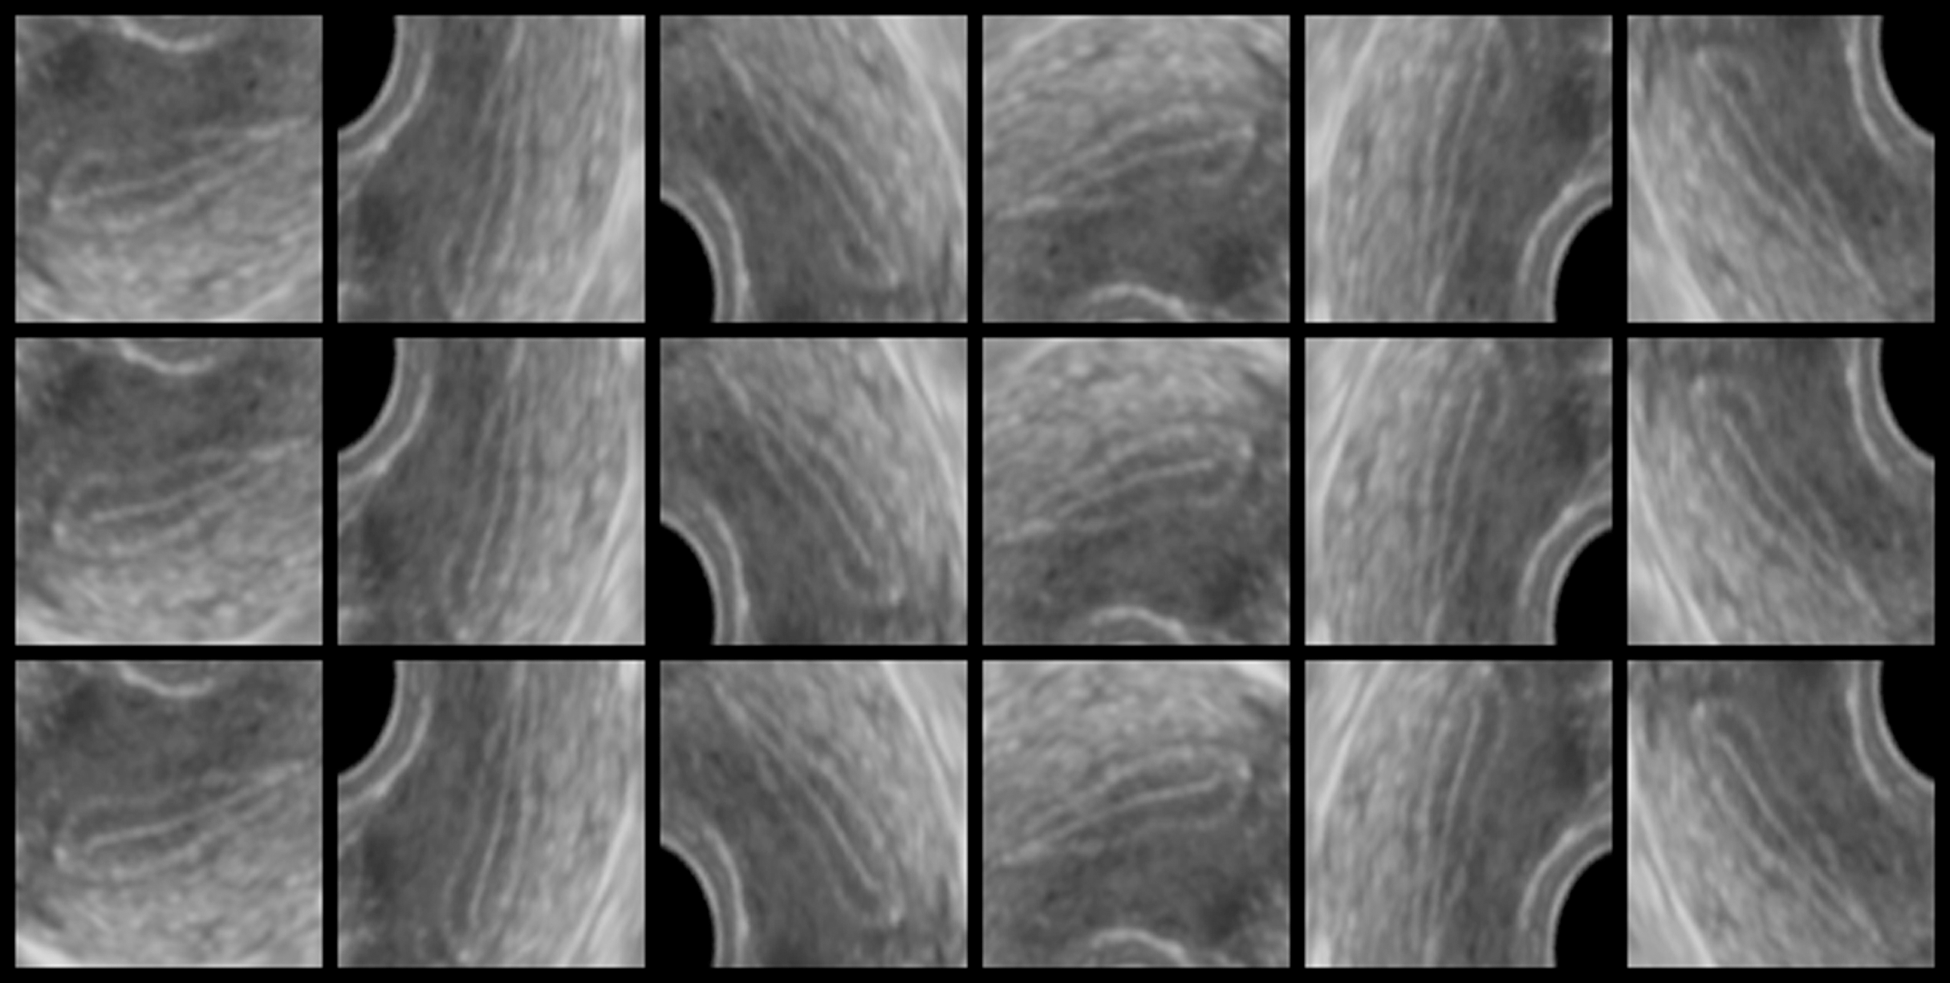
Figure 3: Example of the saved original images
Table 4: The number of the saved images
A learning process of a CNN is conducted by using the saved images. In this paper, we use VGGNet with 16 layers (VGG16) [15]. They published the model trained on ImageNet. We perform transfer learning by using the trained model. Architecture of the model in this system is shown in Fig. 4. Success or failure of a pregnancy is predicted by the learned model. In this paper, we evaluate the system by k-fold cross validation with k = 3. We divide 38 patients’ images into three. Tab. 5 shows the divided result. Both subject’s number of 1 to 9 in the success and the number of 1 to 11 in the failure are patients classified into leaf pattern by physician. Both subject’s number of 10 to 19 in the success and the number 12 to 19 in the failure are patients classified into homogenous pattern. One group’s images are extracted from the dataset as validation data. The model employs the remaining two groups’ images as training data. Images that has not been rotated in the validation data are employed as test data. One patient has about 30 test images of time series. The model performs learning for 100 epochs. A pregnancy prediction for test data is performed by using the model that is learned for 100 epochs. k-fold cross validation repeats learning while changing groups of validation data until all groups become validation data. Therefore, we obtain three learning curves and prediction results for all the patient’s data. In the training and prediction process, labels of the images are set according to the success (1) or failure (0) for each patient. The successful subject’s images are set label of success (1) independent of time series. The failed subject’s images are set label of failures (0) independent of time series.
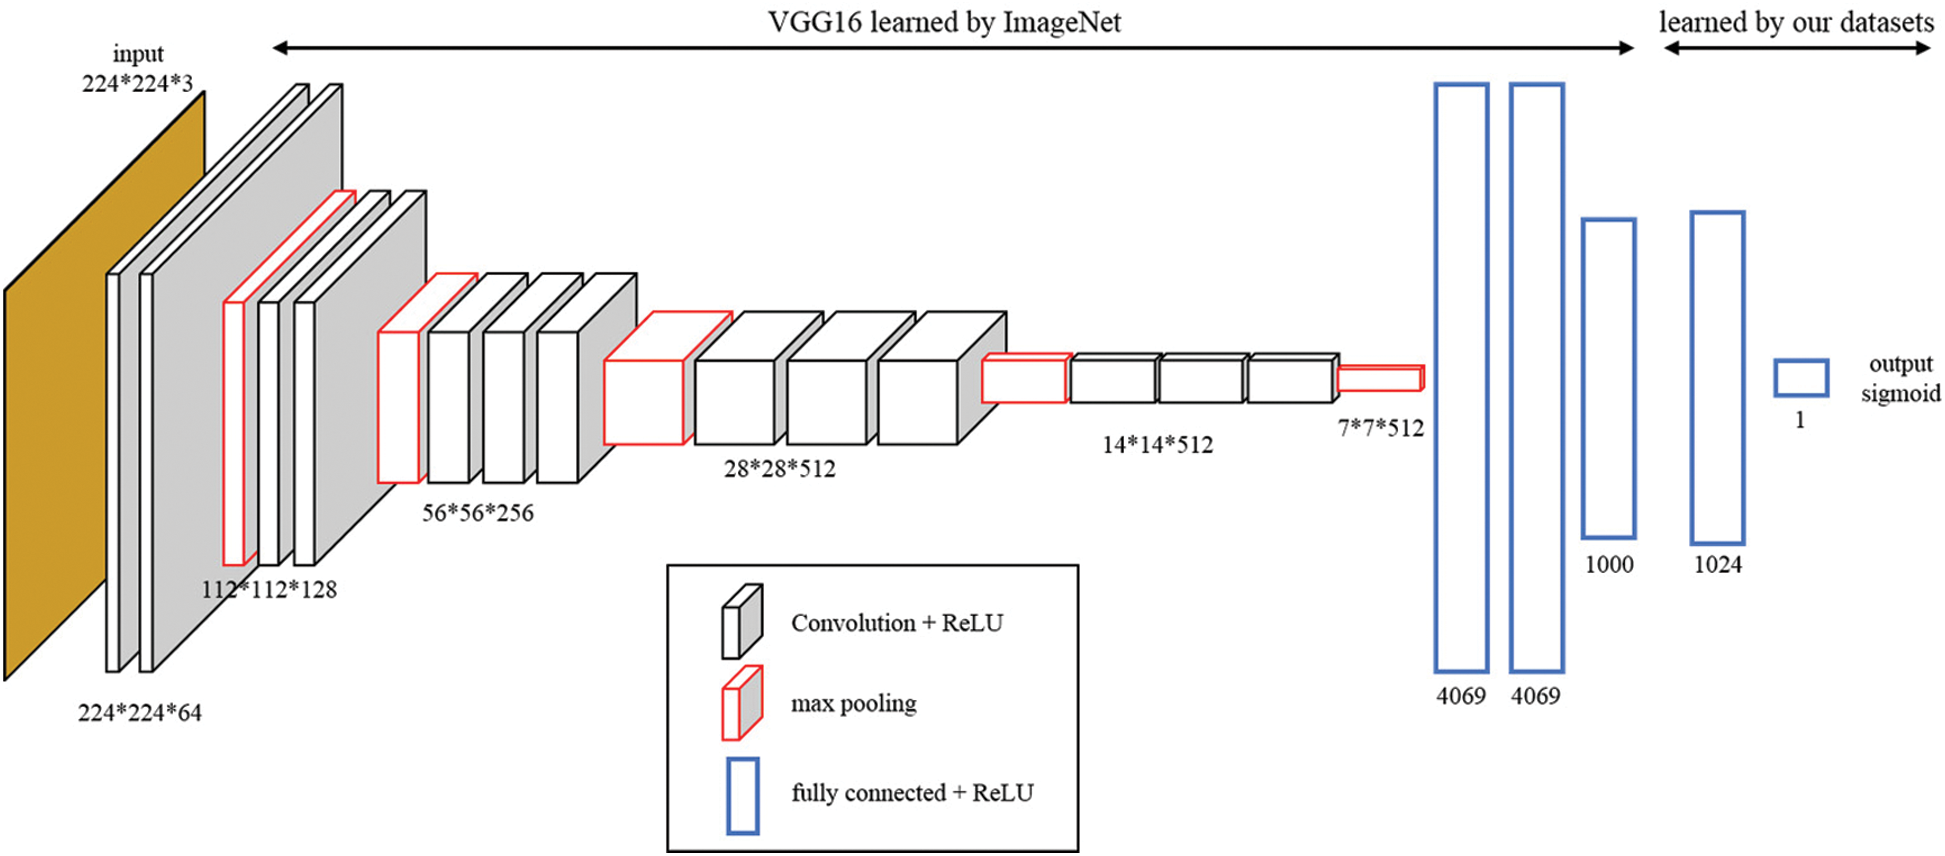
Figure 4: Convolution Neural Network (CNN) architecture
Table 5: The subjects for each group in the dataset
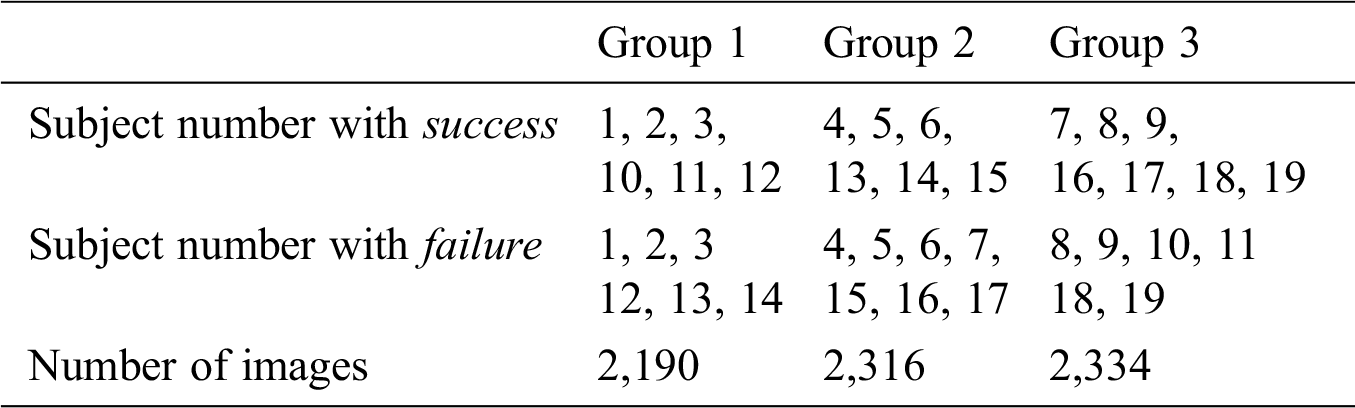
Fig. 5 shows a learning curves showing accuracy for each epoch. Solid and broken lines in Fig. 5 show average values of training and validation accuracy, respectively. A region of translucent shows maximum and minimum value for three learning curves. We confirm that the training accuracy is increased with epoch, but the validation accuracy does not improve from around 0.56.
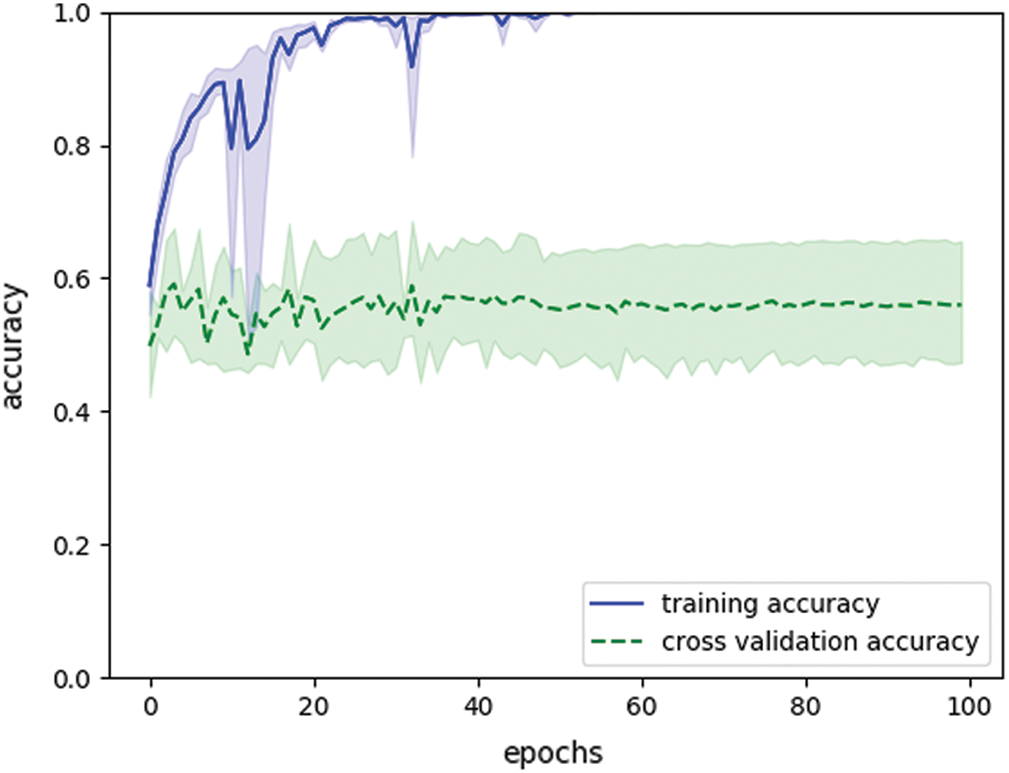
Figure 5: Learning curves showing accuracy in shape-based system (final training accuracy: 1.0, final validation accuracy: 0.56)
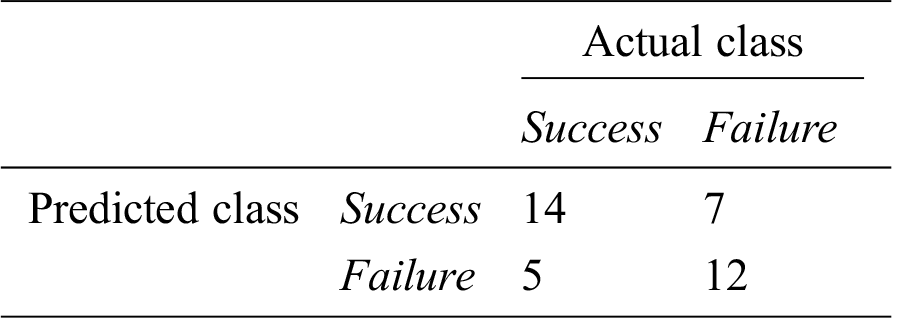
We analyze prediction accuracy for a pregnancy based on a prediction rates for each patient. Prediction results for test data can be treated as time series data for each patient. Fig. 6 shows examples of the time series data. Figs. 6a and 6b show the time series data of success subject 4 and failure subject 6, respectively. We use average for this time series data as a feature value for the subject. Tabs. 6 and 7 show the feature values of successful and failed subjects, respectively. Fig. 7 shows a box plot and a histogram for the feature values. Figs. 7a and 7b do not show significant difference in the feature values for a pregnancy. As a result of performing a t-test for the feature values, p value is 0.092. These feature values do not have significant difference. Fig. 8 shows receiver operating characteristic (ROC) curve for the feature values. In the ROC curve, area under the curve (AUC) is 0.65. This AUC value shows that is not good model. If cut off value is left upper point in the ROC curve, false positive rate, true positive rate, and threshold value are 0.37, 0.74, and 0.36, respectively. When the threshold value is set 0.36, we have accuracy of 0.68. Tab. 8 shows a prediction result when the threshold value is set 0.36.
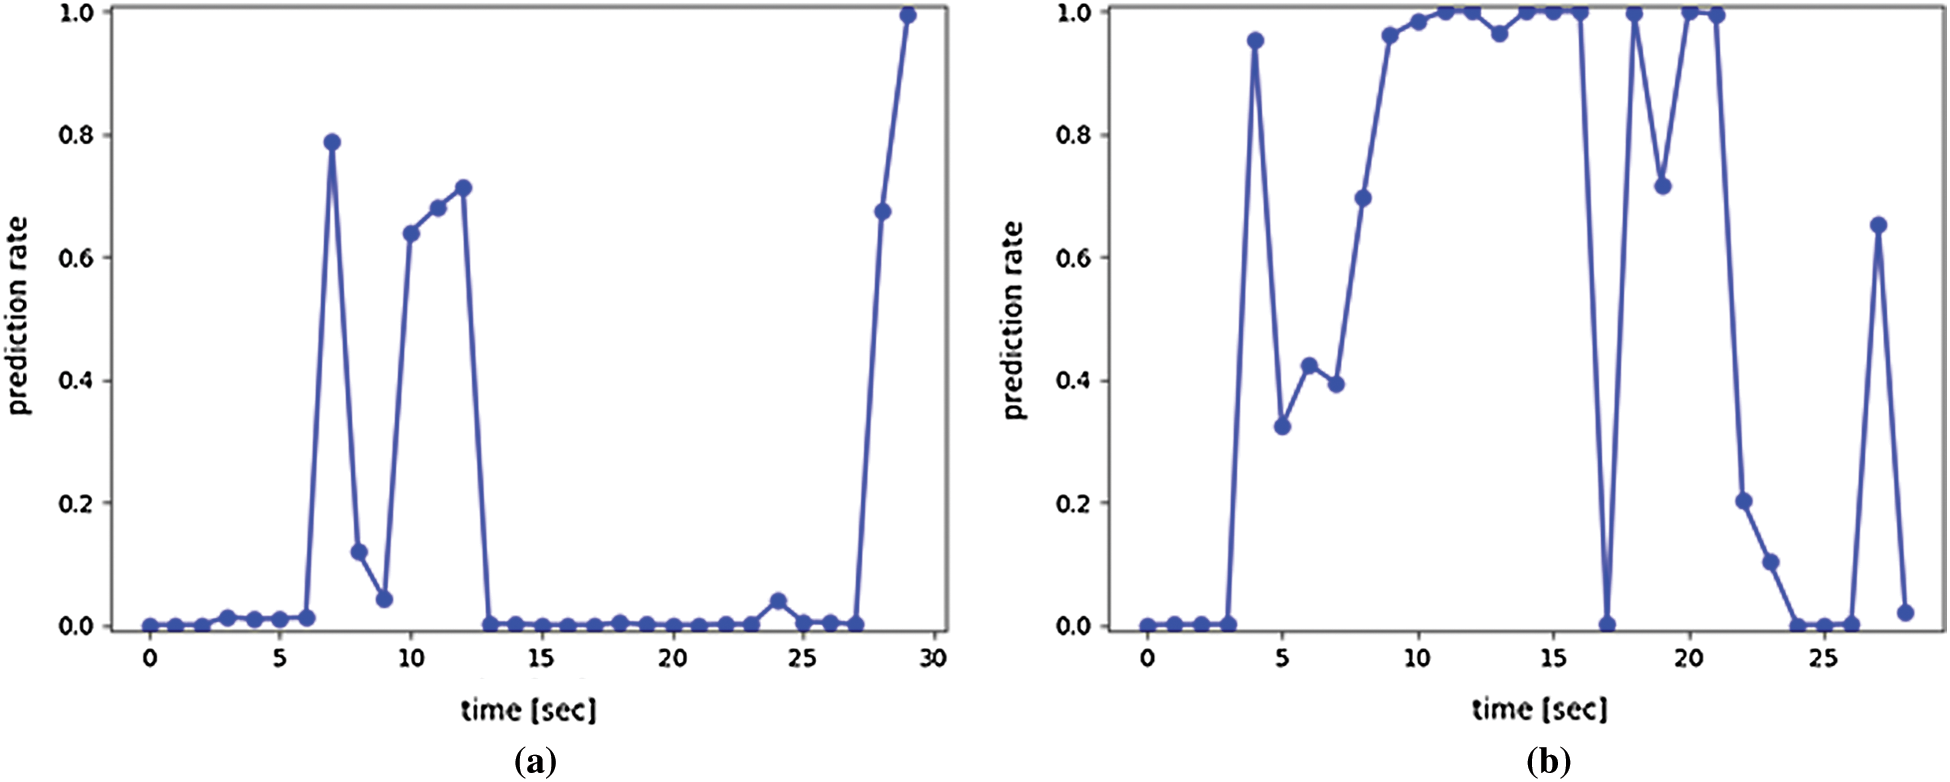
Figure 6: Examples of time series prediction results (Success = pregnancy. Failure = no pregnancy.) (a) Success subject 4 (b) Failure subject 6
Table 6: Feature values for subjects with pregnancy (successful)
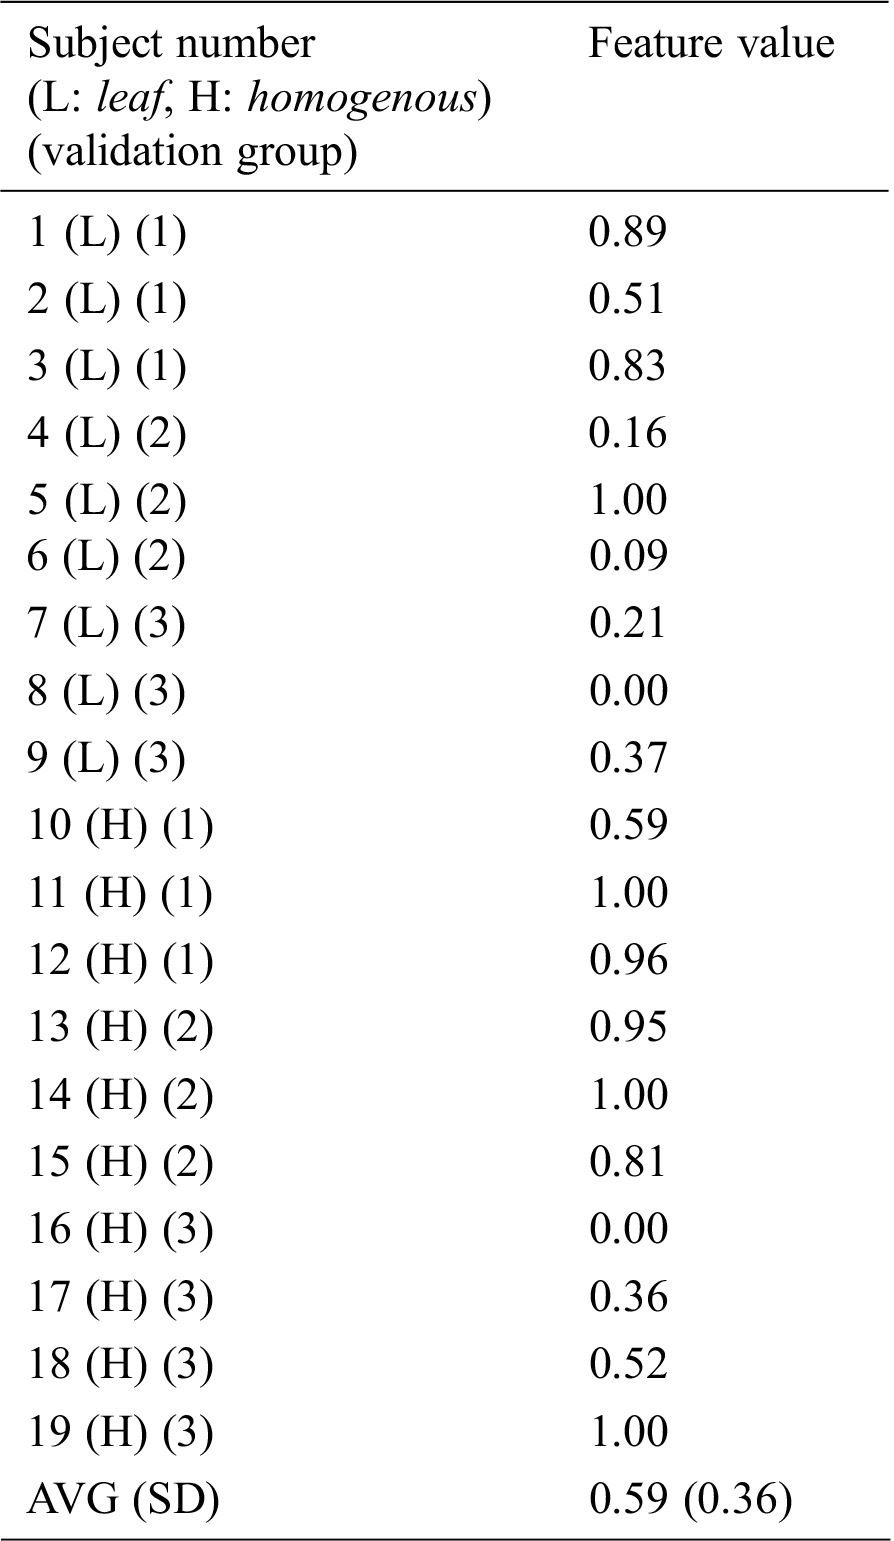
Table 7: Feature values for subjects with no pregnancy (failure)
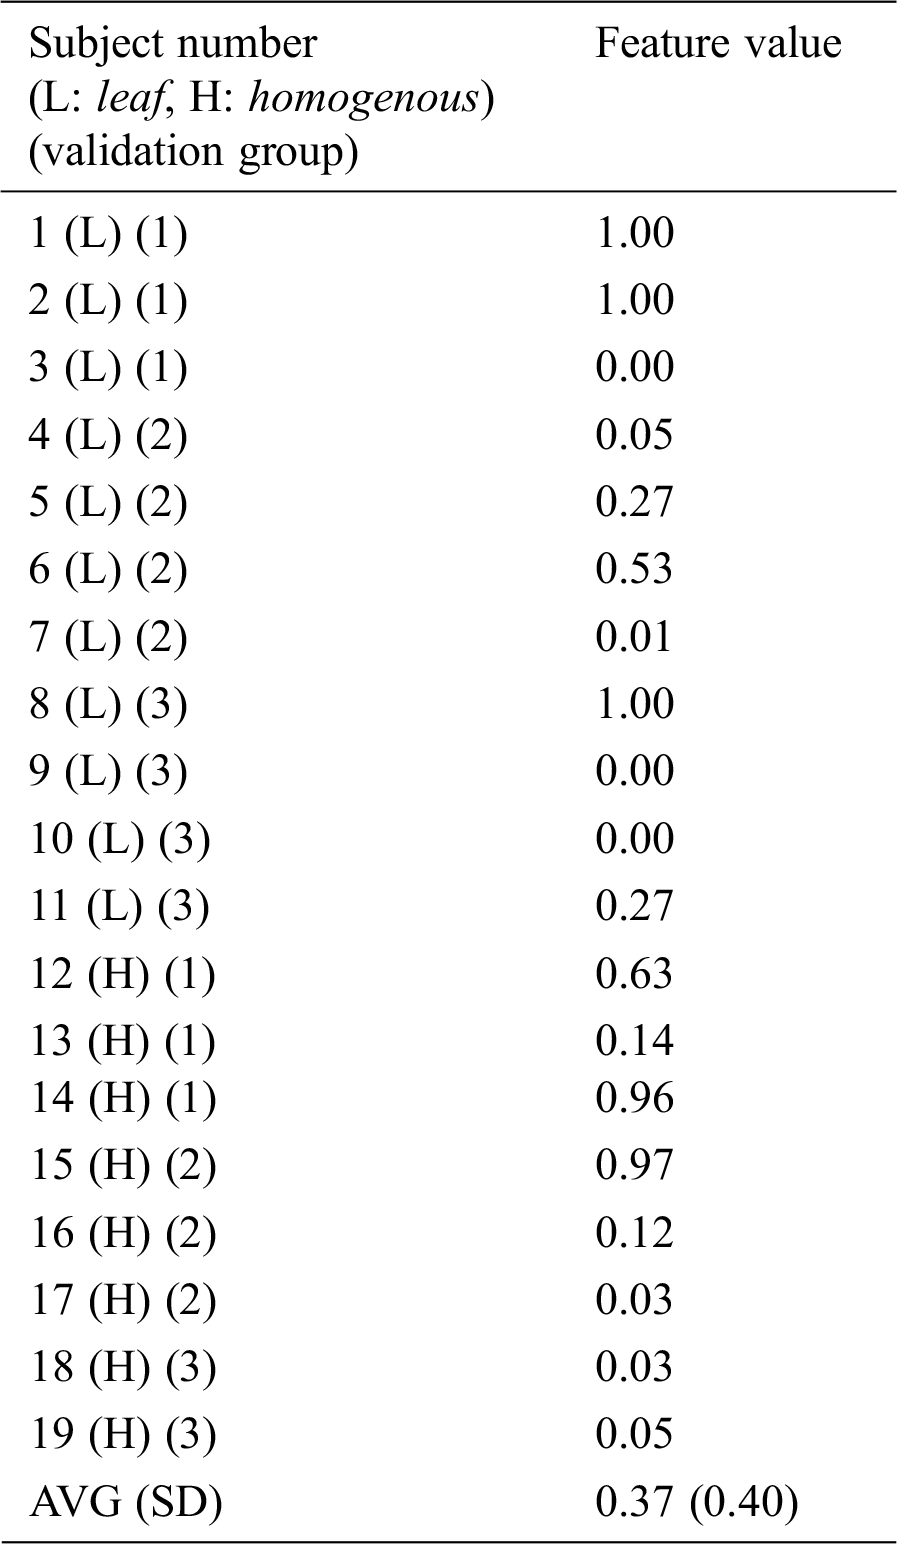
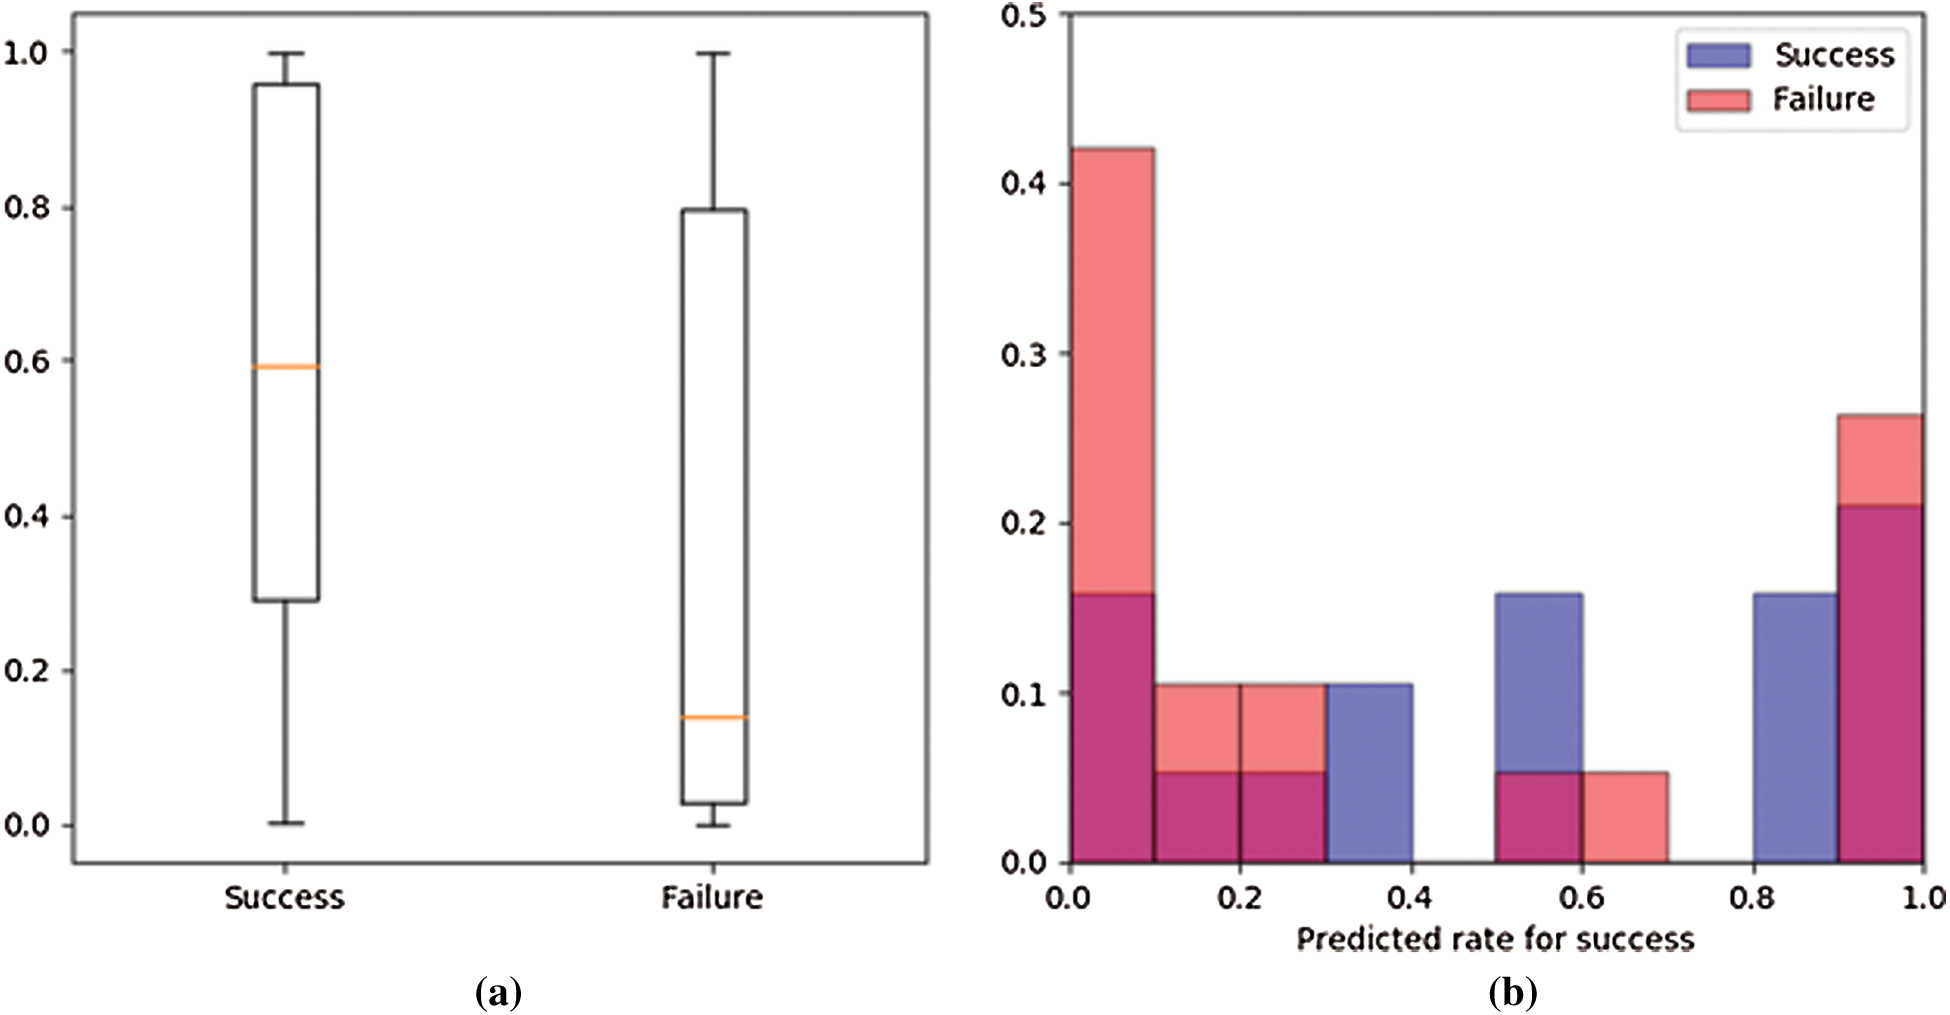
Figure 7: Plotted feature values (Success = pregnancy. Failure = no pregnancy) (a) Box plot (b) Histogram
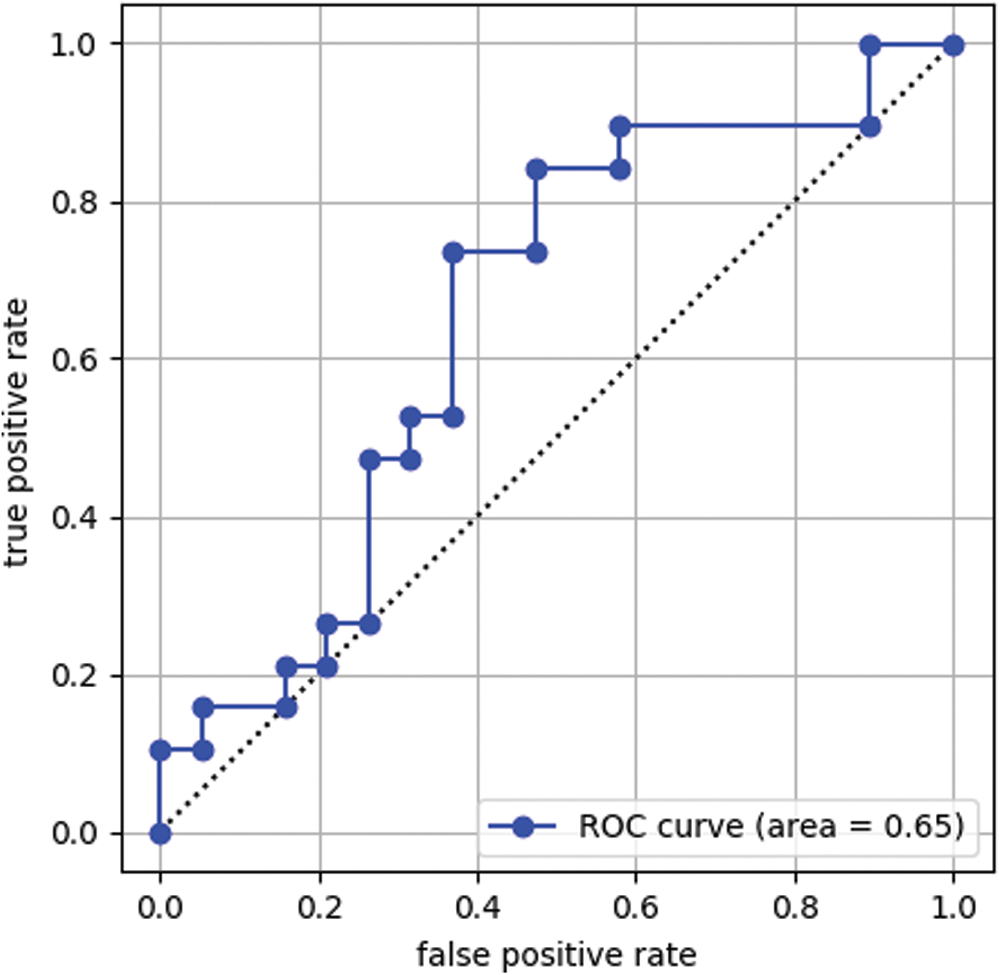
Figure 8: Receiver operating characteristic (ROC) curve
Table 8: Prediction results of the conventional method using the threshold process
In this section, we develop a system that predicts a pregnancy based on uterine movement. The previous study showed that velocity of uterine movement was constant speed of 0.68 mm/sec [13]. We develop a system that predicts a pregnancy by extracting movement of specific speed from the ultrasonic images based on the velocity feature. In the proposed method, first step is to make velocity images. The velocity images are generated from movement velocity for each pixel calculated by an optical flow. Next, learning of a CNN model is performed. Finally, we analyze prediction accuracy for a pregnancy by using the learned model.
An averaging filter of 5 × 5 pixels is applied to the ultrasonic images as preprocessing. An average image is generated every second from the movie file by calculating an average for a time axis. 30 images are generated from 30 second movie by this process. An endometrial region is extracted from the average image by using a mask image. The mask image is as same as Section 3. Since an endometrial shape and direction have individual differences the extracted region size is different from each other. Rotation processes every 60 degrees is applied to the extracted images. The obtained image is saved in 224 × 224 pixels. Each pixel’s movement distance for one second is calculated as speed per second by applying an optical flow to the saved images. The calculated speeds are normalized to generate input images for a CNN. Speed statistics for the dataset are calculated to set a standard of normalization. The speed information is calculated for 19 successful subjects’ images. The fastest speed value in one image is recorded. A histogram for the obtained speed value is shown in Fig. 9. An average value of the calculated speed is 0.78 mm/sec and a standard deviation is 0.38 mm/sec. The calculated average value is generally consistent with 0.68 mm/sec show in previous study [13]. A normalized filter shown in Fig. 10 is generated based on the average and standard deviation. A velocity image is generated from the velocity information by using this filter. Fig. 11 shows an example of the velocity images. A vertical axis in Fig. 11 shows time of movie file, and horizontal axis shows rotated images. The number of the saved images is as same as Tab. 4.
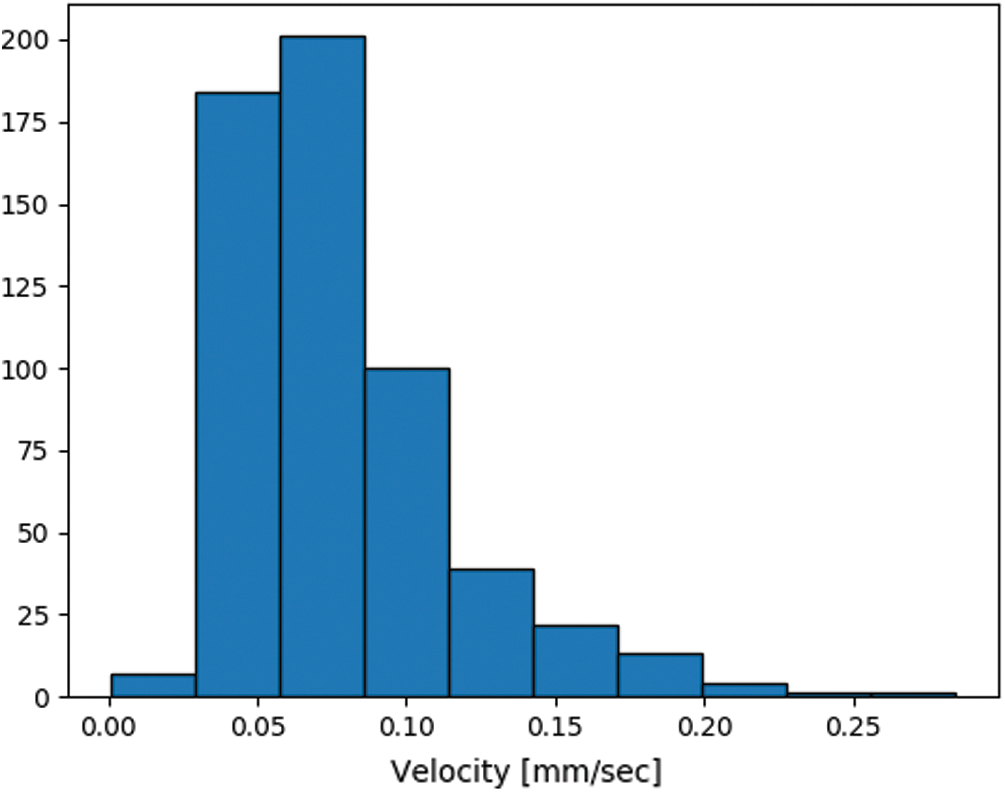
Figure 9: Histogram of the speed values
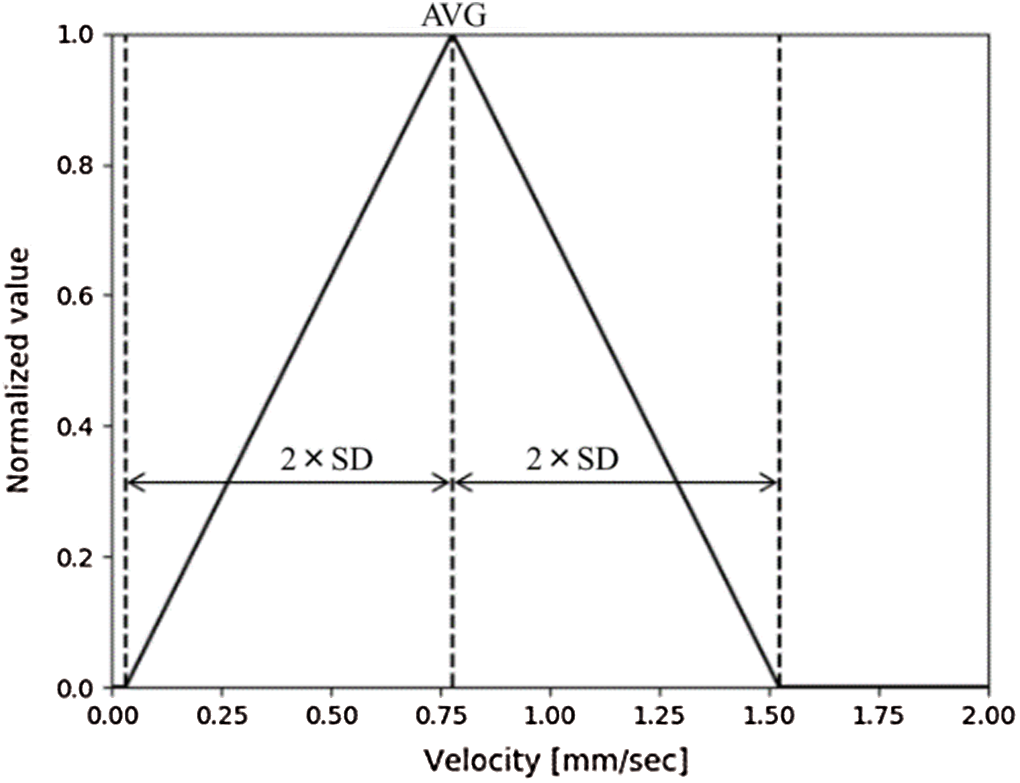
Figure 10: Normalization filter for the velocity information
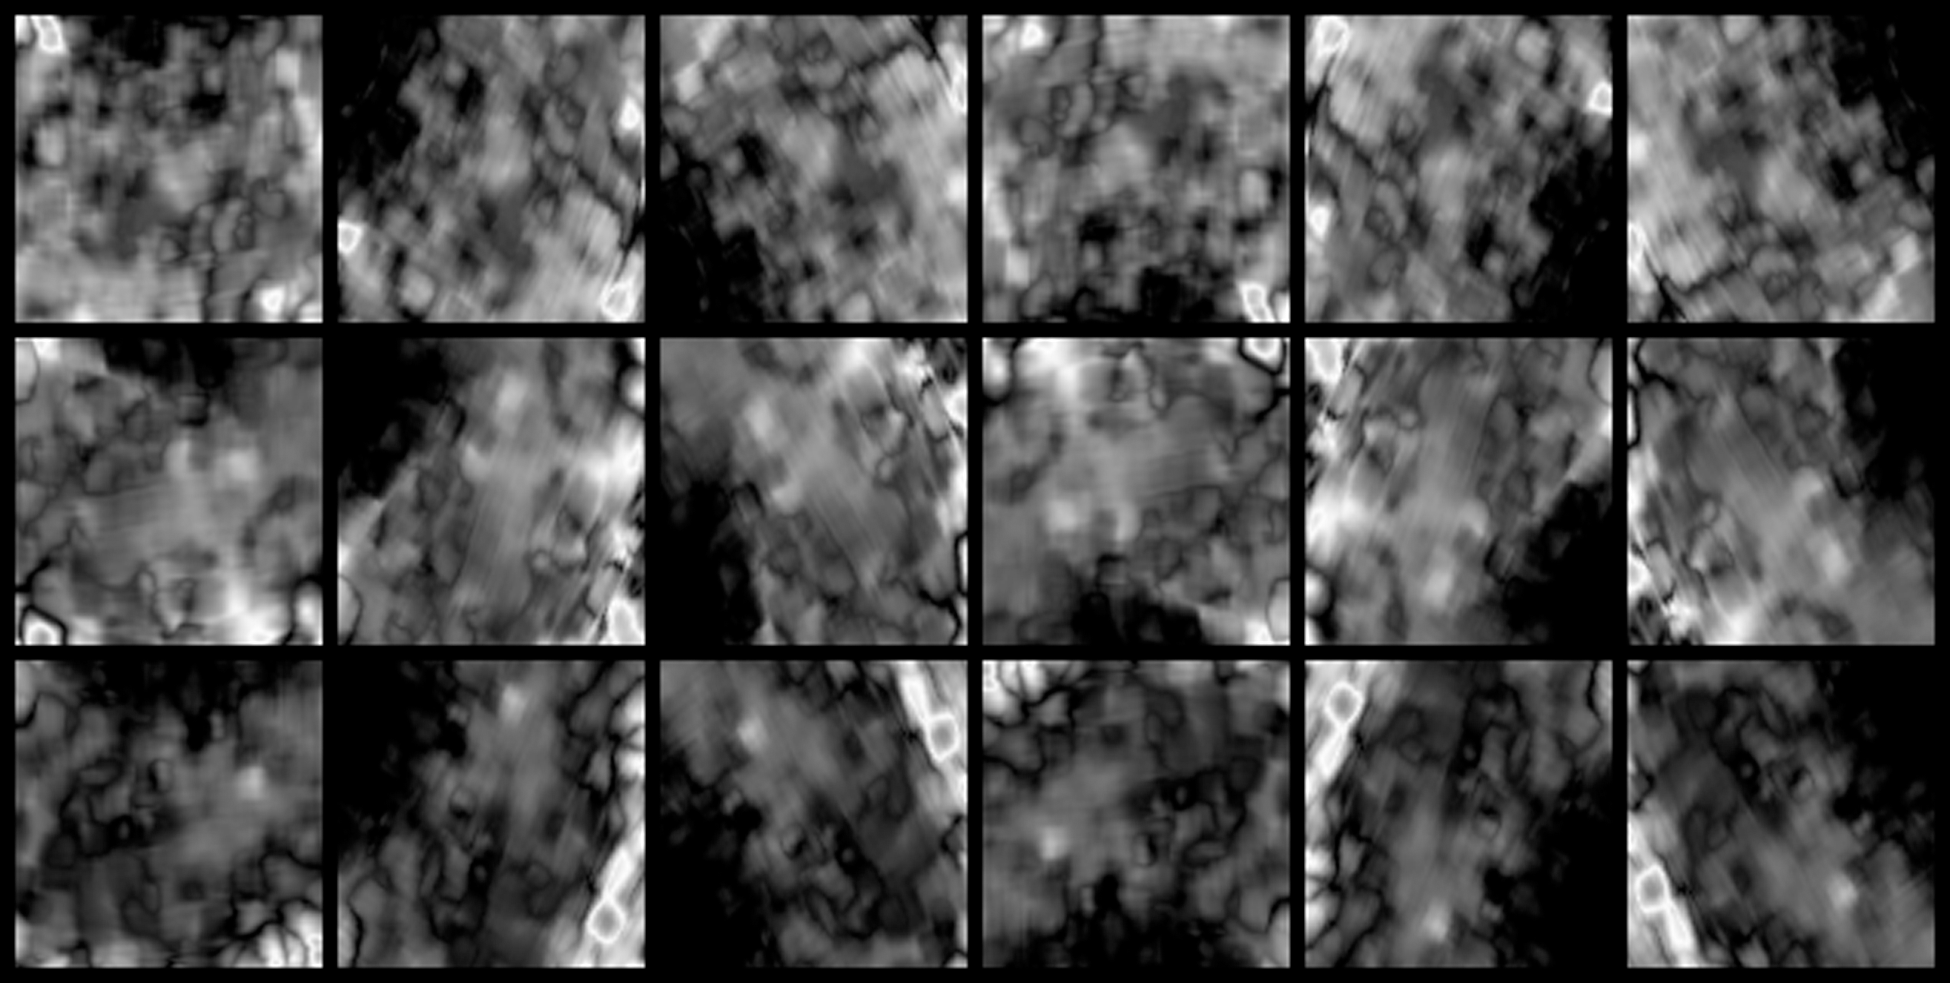
Figure 11: Example of the saved velocity images
The architecture of a CNN model in this system is shown in Fig. 4, as in Section 3. Except for the input image, learning step of the model is performed under the same conditions as in Section 3. Input images replace ultrasonic images to velocity images.
Fig. 12 shows a learning curve showing accuracy for each epoch. Solid and broken lines in Fig. 12 show average values of training and validation accuracy, respectively. A region of translucent shows maximum and minimum value for three learning curves. We confirm that the training accuracy is increased with epoch, but the validation accuracy does not improve from around 0.61 by Fig. 12. Fig. 13 compares validation accuracy of pre-experiment by original image with this experiment by velocity image. We confirm that the validation accuracy for velocity images is little higher than original images.
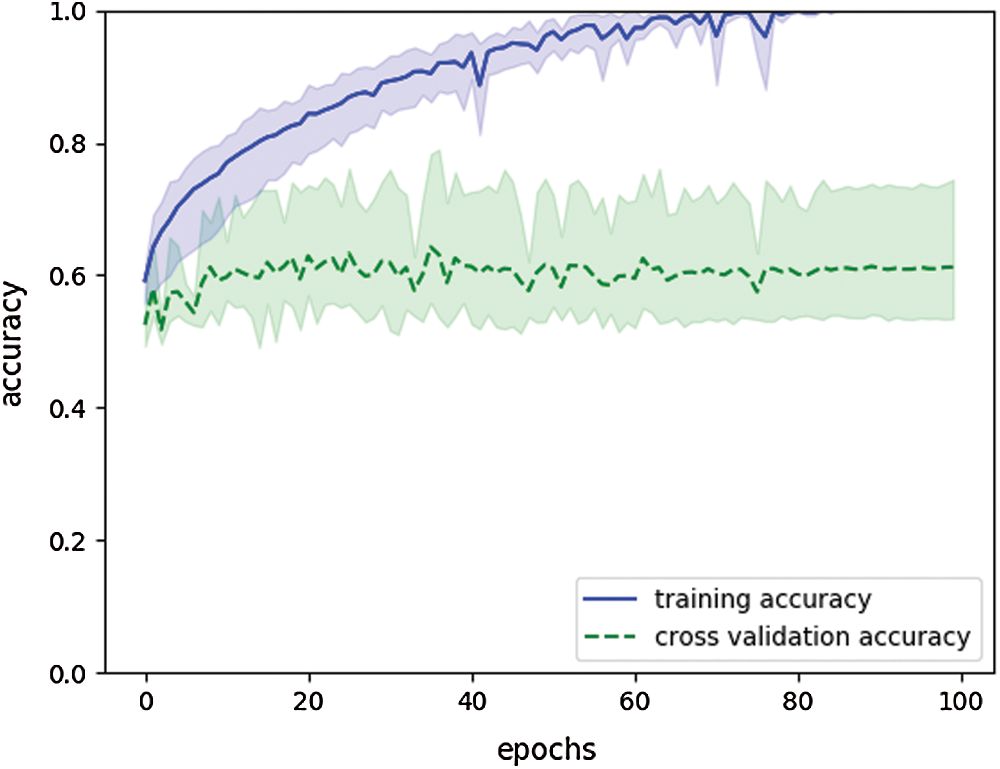
Figure 12: Learning curve showing accuracy in velocity-based system. (final training accuracy: 1.0, final validation accuracy: 0.61)
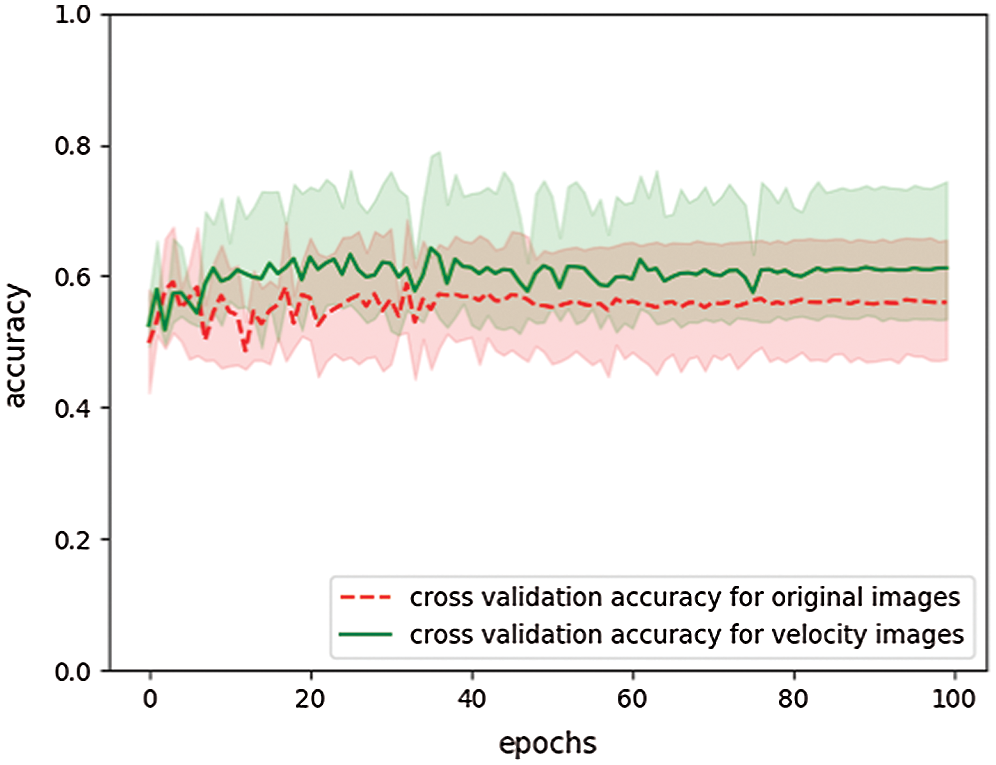
Figure 13: Comparing validation accuracy for original and velocity images
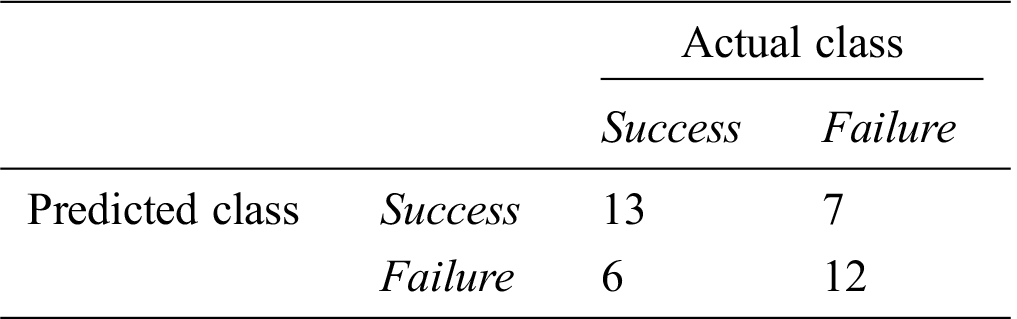
We analyze prediction accuracy for a pregnancy based on a prediction rate for each patient. Prediction results for test data can be treated as time series data for each patient. Fig. 14 shows examples of the time series data. Figs. 14a and 14b show the time series data of success subject 4 and failure subject 6, respectively. Fig. 15 compares Fig. 6 with Fig. 14. We confirm that prediction rates are improved by velocity images. We use average for this time series data as a feature value for a subject. Tabs. 9 and 10 show the feature values of successful and failed subjects, respectively. In Tabs. 9 and 10, feature value 1 shows pre-experiment’s scores obtained by ultrasonic images and feature value 2 shows the experiment’s scores obtained by velocity images. Figs. 16a and 16b show a box plot and a histogram for the feature values. Figs. 16a and 16b show significant difference in the feature values for a pregnancy at the p = 0.05 level, since p value was 0.026 on a result of performing a t-test for the feature values. Fig. 17 shows ROC curve for these feature values. In the ROC curve, AUC is 0.72. Fig. 18 compares ROC curves in pre-experiment by original image and this experiment by velocity image. In Fig. 18, AUC value for velocity images is higher than original images. This result shows that the model of velocity images is better than the model of original images. If cut off value is left upper point in the ROC curve, false positive rate, true positive rate, and threshold value are 0.37, 0.68, and 0.38, respectively. When the threshold value is set 0.38, we have the best accuracy of 0.66. Tab. 11 shows a prediction result when the threshold value is set 0.38. This accuracy is lower than the model of original images. However, we confirm that velocity images generate better model than original images because the velocity-based model has 0.72 AUC value.
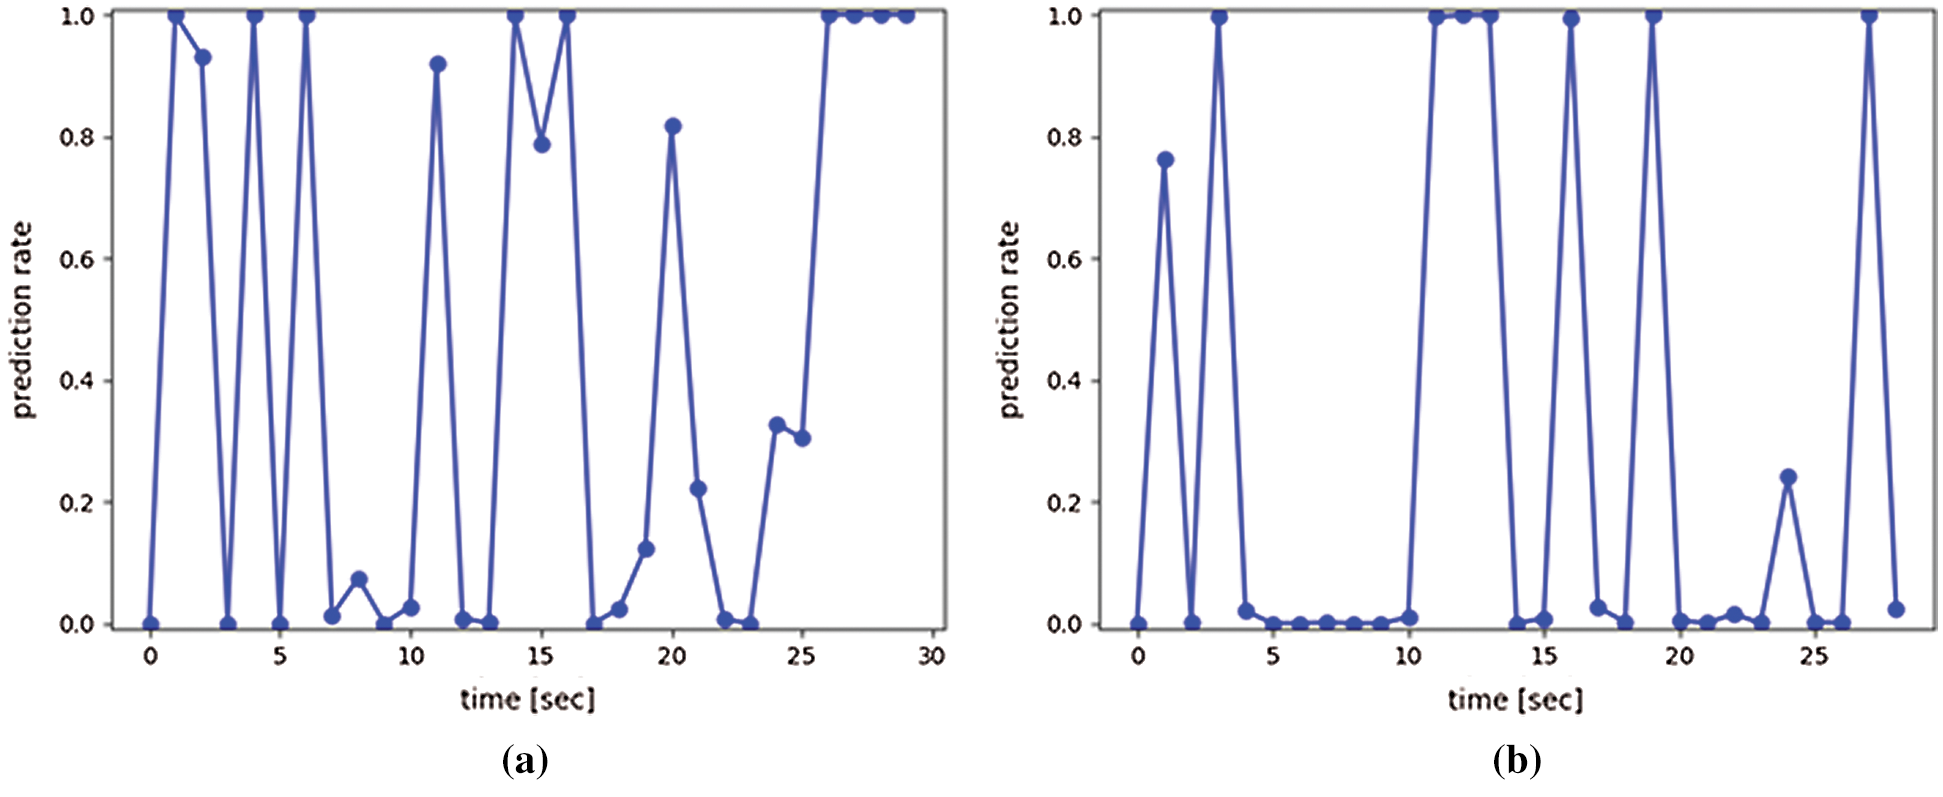
Figure 14: Examples of time series prediction results (Success = pregnancy. Failure = no pregnancy) (a) Success subject 4 (b) Failure subject 6
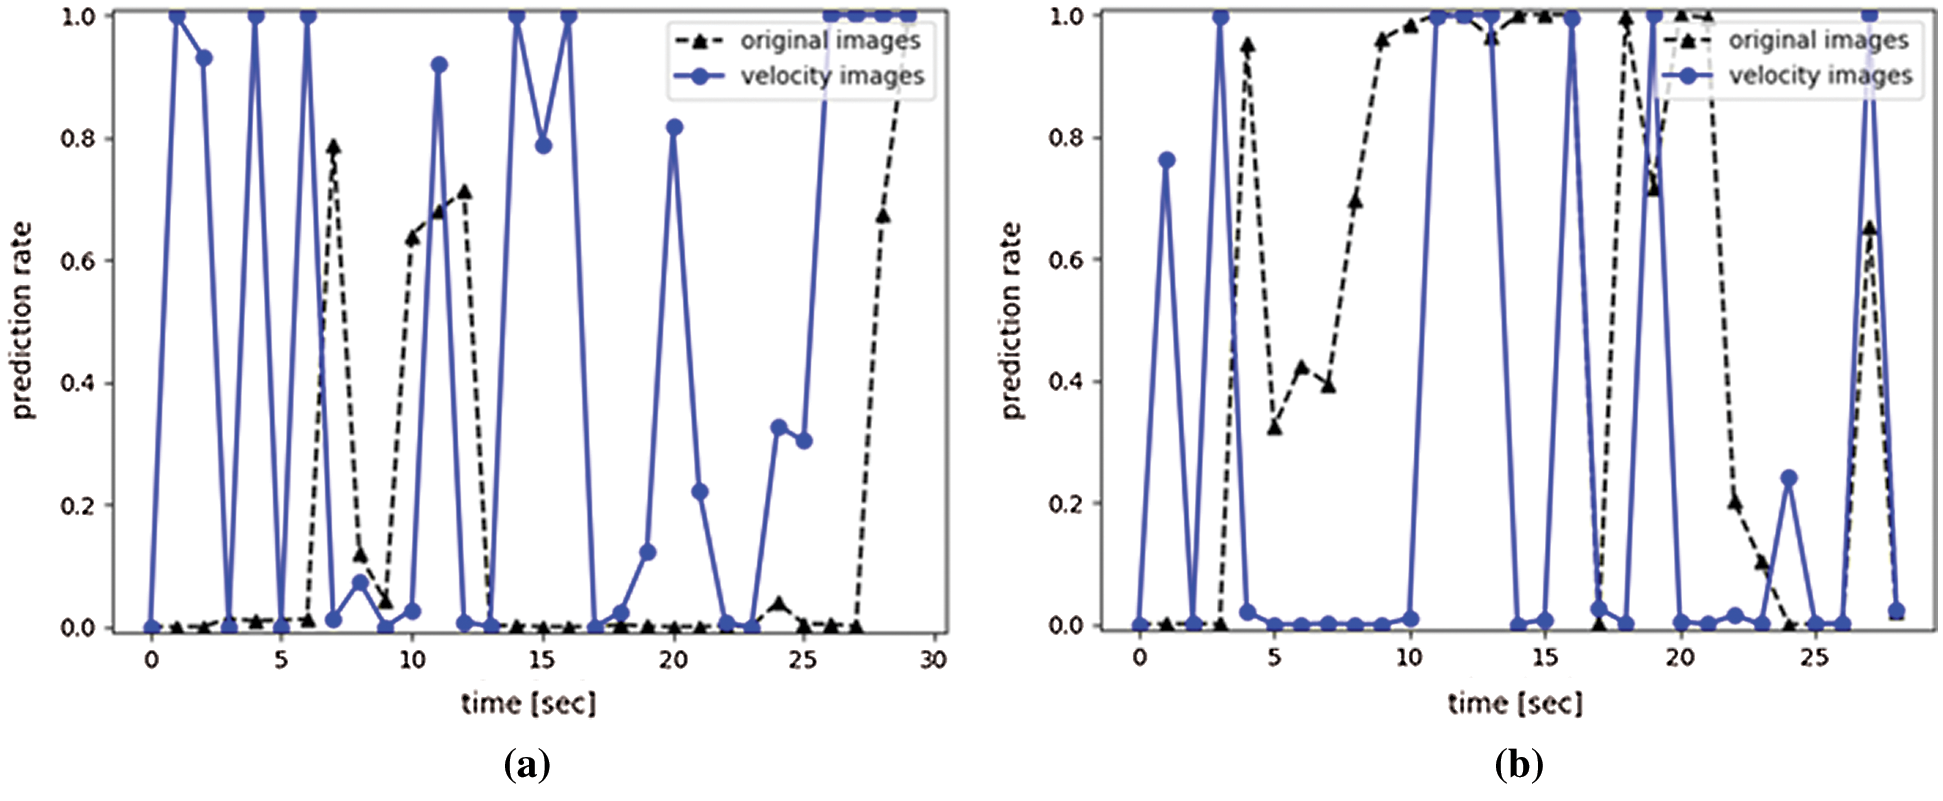
Figure 15: Comparison of the time series prediction results (Success = pregnancy. Failure = no pregnancy.) (a) Success subject 4 (b) Failure subject 6
Table 9: Feature values for subjects with pregnancy (success)
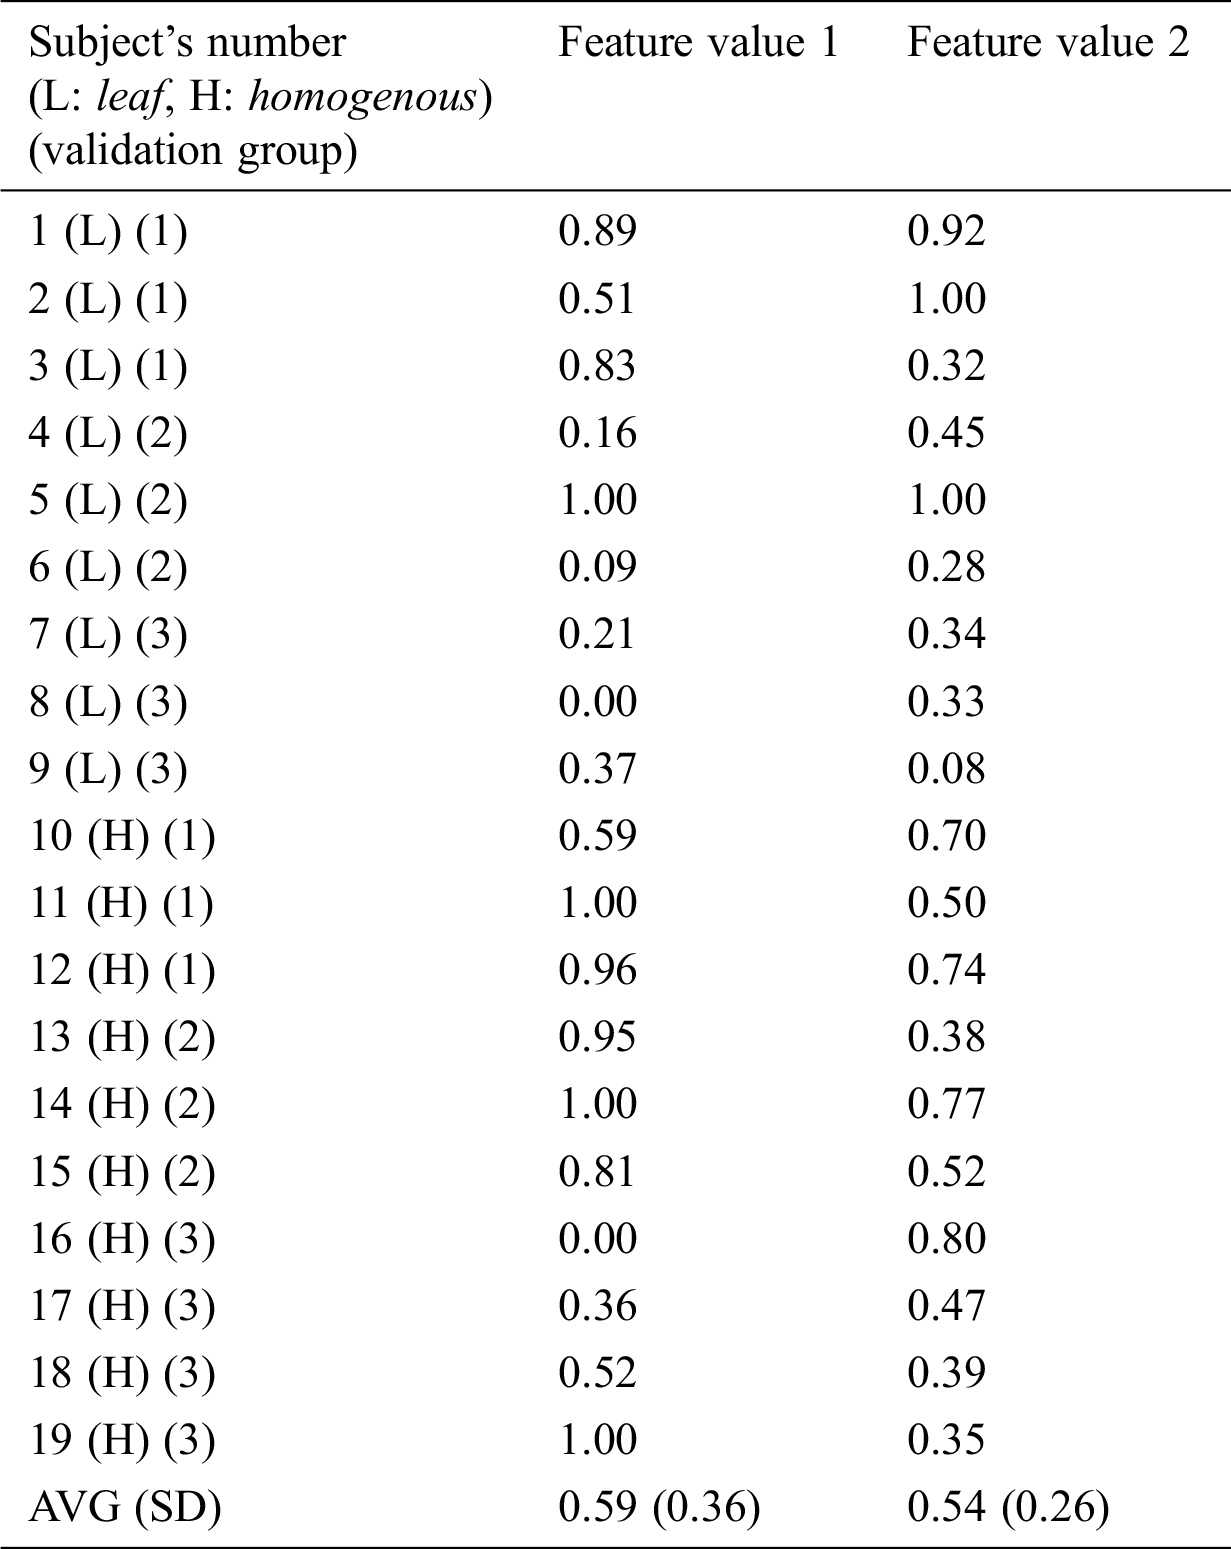
Table 10: Feature values for subjects with no pregnancy (failure)
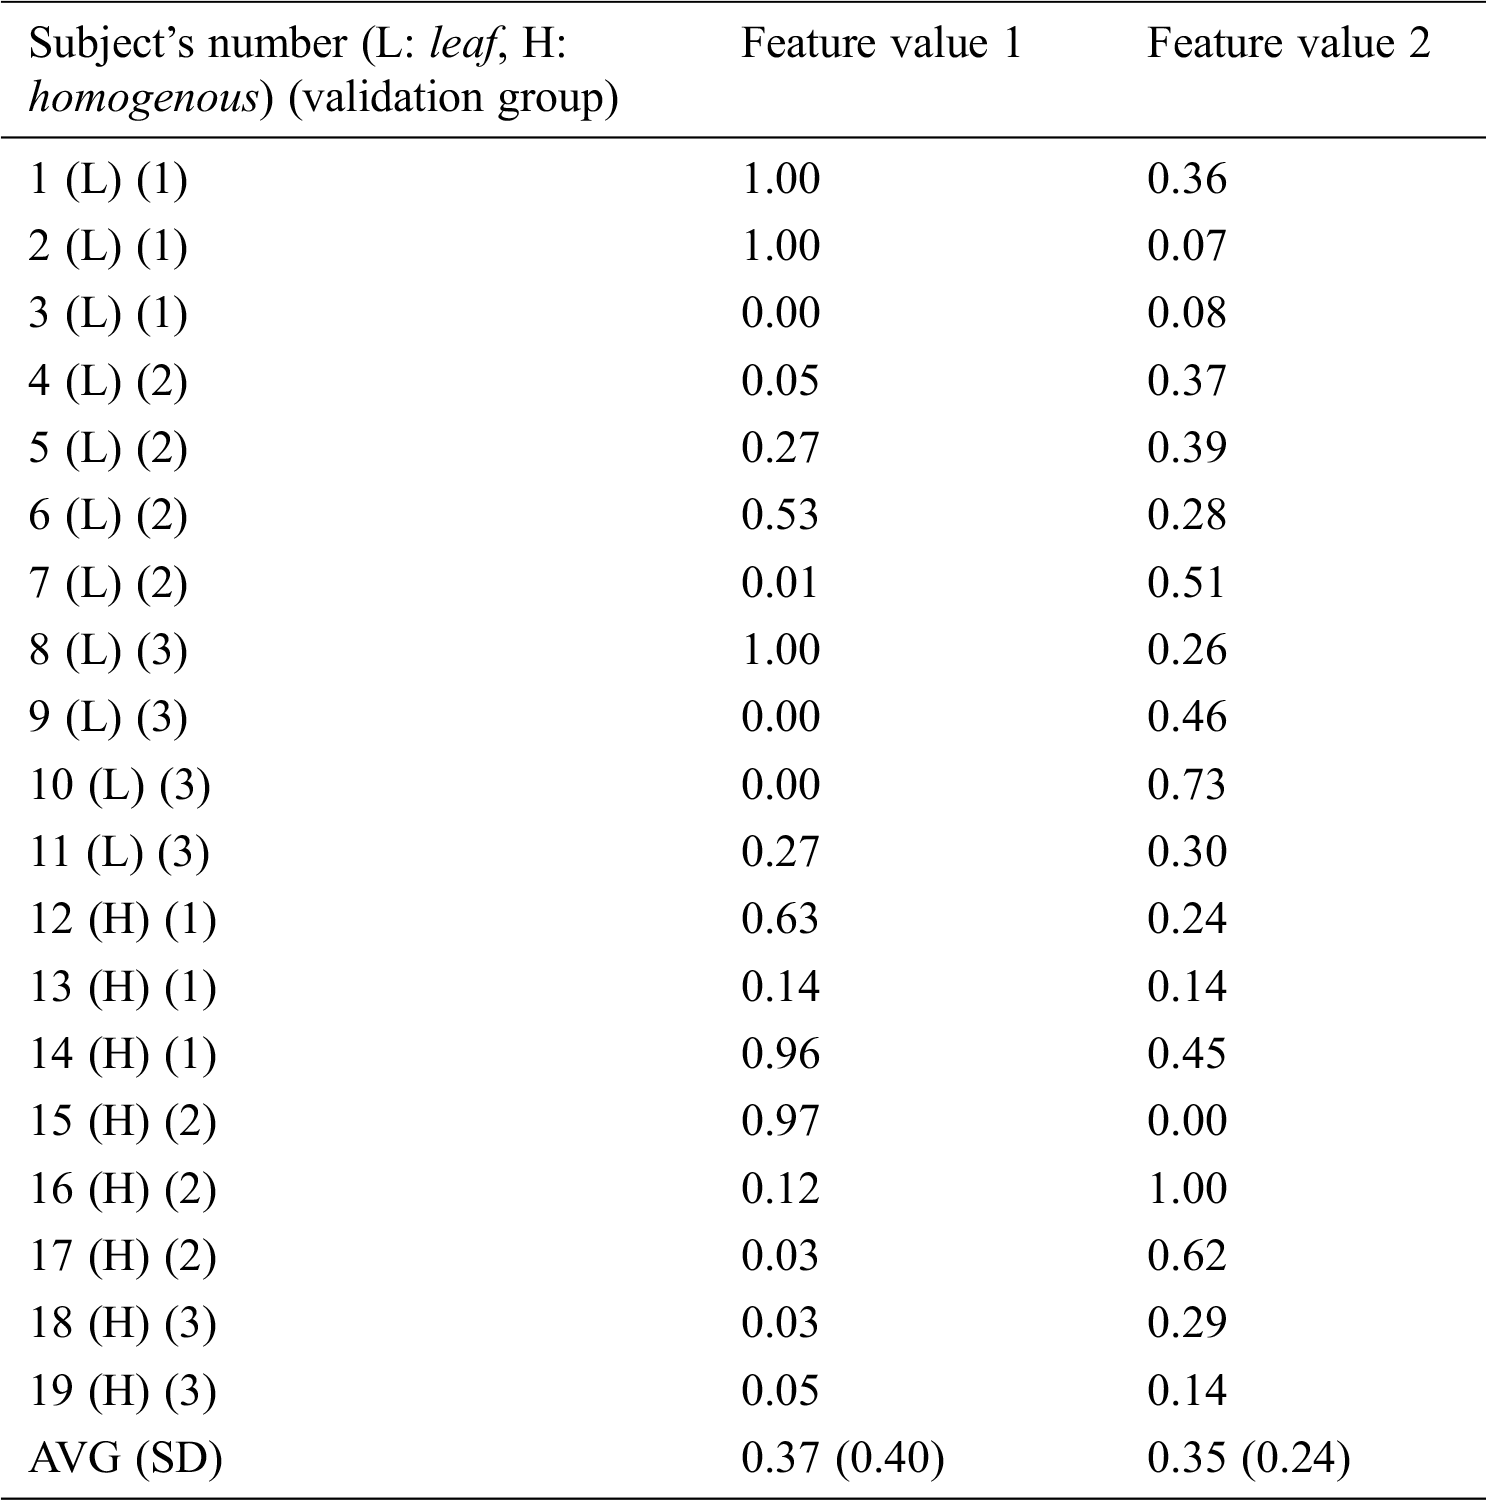
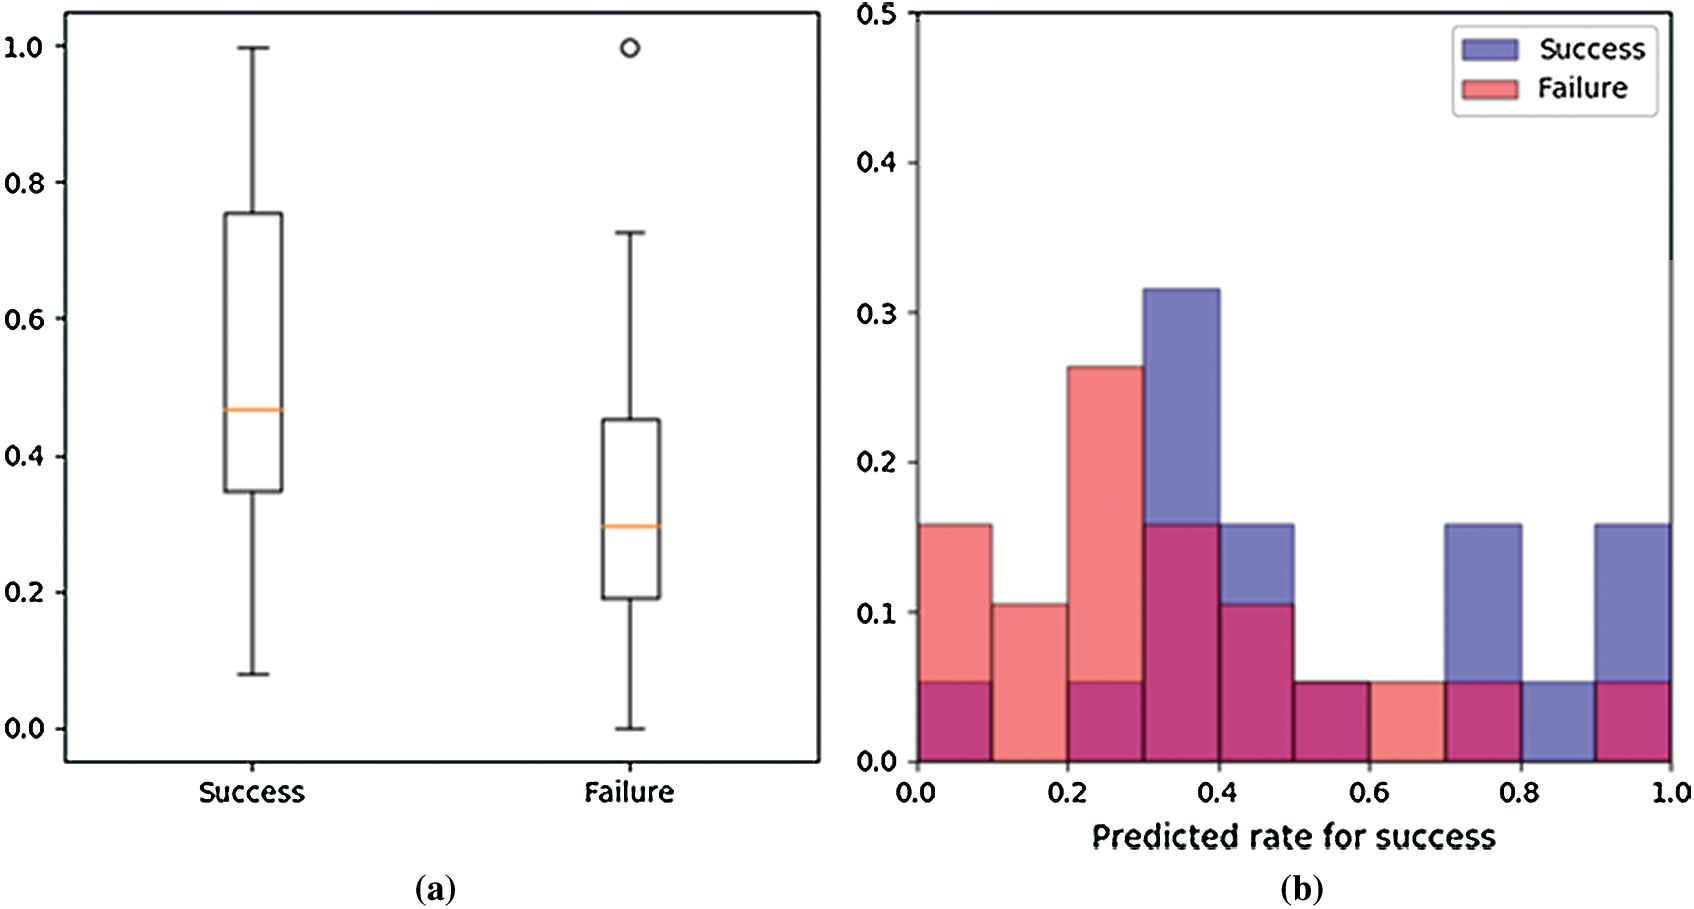
Figure 16: Plotted feature values (Success = pregnancy. Failure = no pregnancy) (a) Box plot (b) Histogram
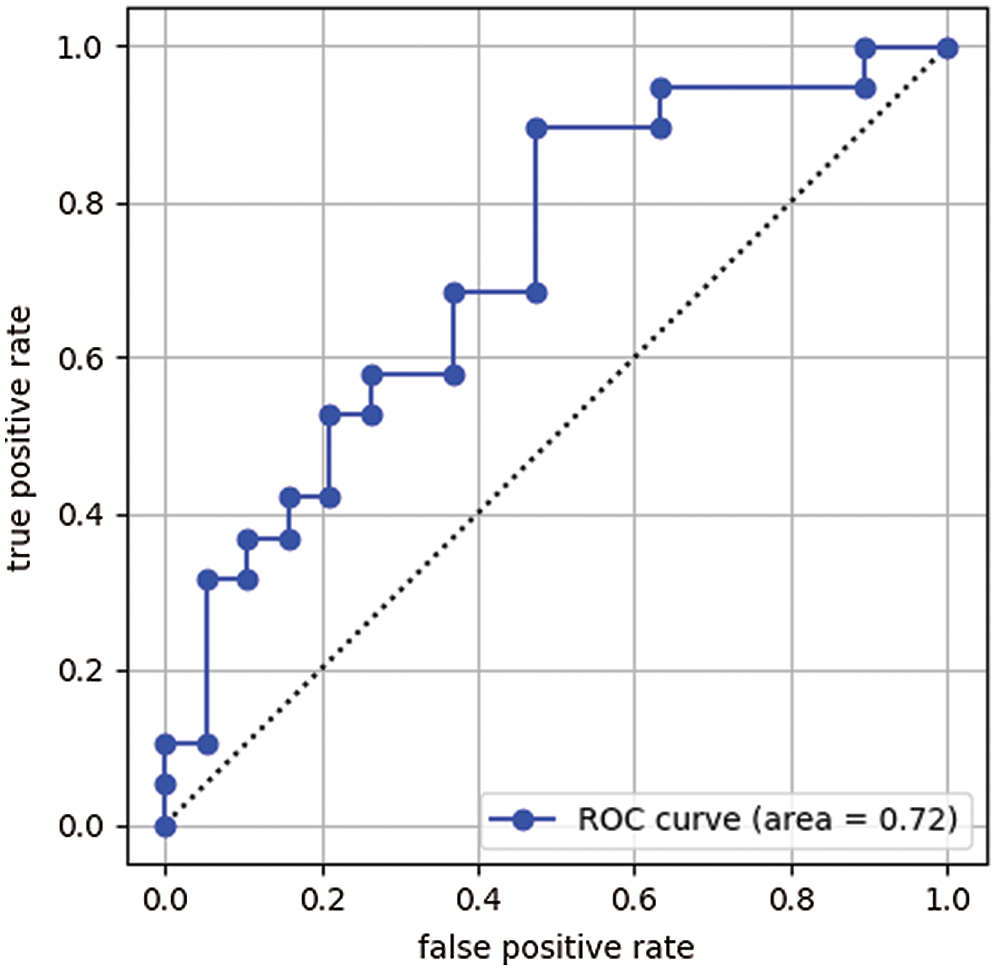
Figure 17: Receiver operating characteristic (ROC) curve
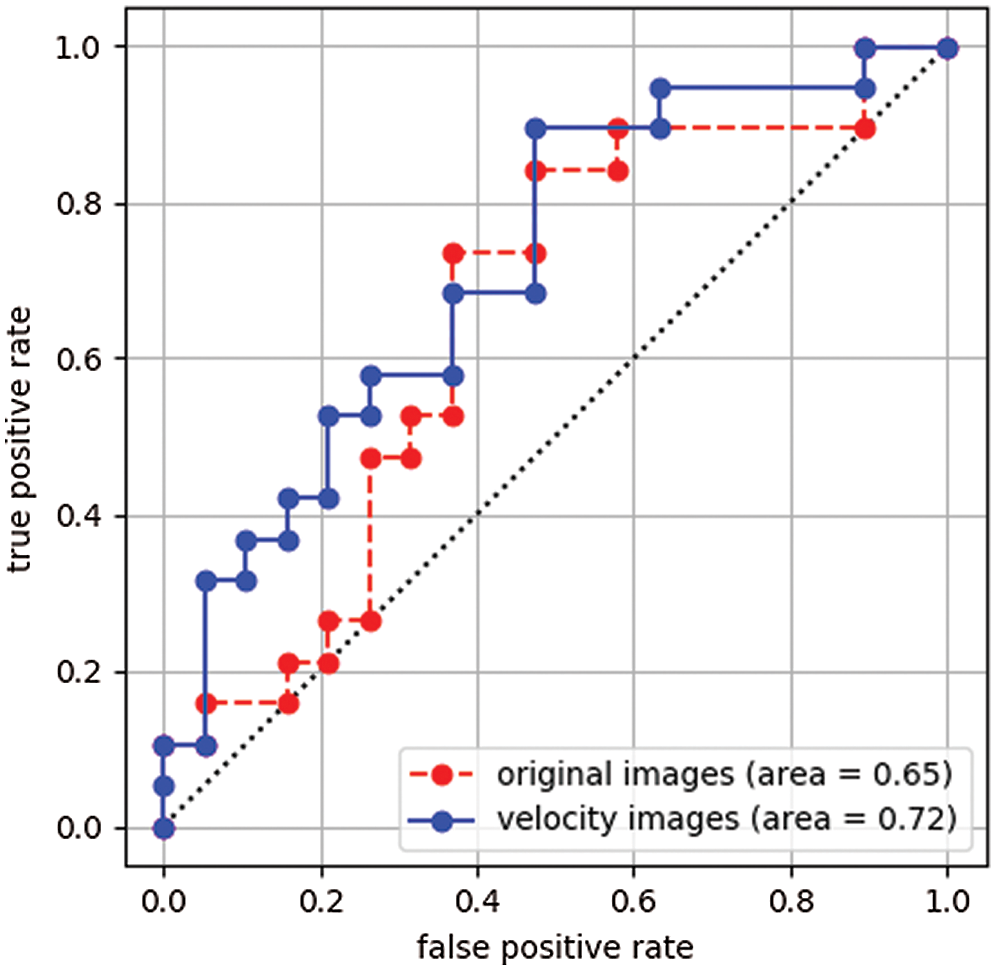
Figure 18: Comparison of the receiver operating characteristic (ROC) curves
Table 11: Prediction results of the proposed using the threshold process
In this paper, we developed a system to predict success or failure of a pregnancy from a uterine ultrasonic B-mode image. This system predicts a pregnancy based on uterine movement. In diagnosis by a physician, it is general to predict a pregnancy based on an endometrial shape. However, there is a problem that is not easy to evaluate correctly an endometrial shape by visual observation. The developed system uses information of endometrial movement as new feature to predict a pregnancy. The uterine movement is mainly analyzed by using a Cine MRI image because this image can analyze the uterine movement more easily than the ultrasonic image. It is known that the uterine movement affects a pregnancy. However, a diagnosis with a feature of the uterine movement had not been performing in the ultrasonic image. In this paper, we consider that it will be possible to analyze the uterine movement from the ultrasonic image by extracting the movement with the speed of 0.68 mm/sec. We confirmed that it is effective for pregnancy prediction to analyze movement information using velocity images. The area under the receiver operating characteristic curves of the velocity-based system was 0.72. Since the receiver operating characteristic curves of the shape-based system was 0.65, we presented that the velocity-based system is more effective for pregnancy prediction. In the future, we will analyze impacts of image size and CNN architecture to improve prediction accuracy.
The velocity-based system would be applied for many studies. For example, it may predict menstrual cycle from ultrasonic images by the velocity-based system.
Acknowledgement: The authors are highly thankful and grateful for support of this research article.
Funding Statement: This research was supported by the Tateisi Science and Technology Foundation (2197012).
Conflicts of Interest: The authors declare that they have no conflicts of interest to report regarding the present study.
1. World Health Organization, Infertility definitions and terminology. Retrieved from, 2020. https://www.who.int/reproductivehealth/topics/infertility/multiple-definitions/en/. [Google Scholar]
2. Centers for Disease Control and Prevention, Assisted reproductive technology fertility clinic success rates report. Retrieved from, 2017. https://www.cdc.gov/art/artdata/index.html. [Google Scholar]
3. A. C. Fleischer, D. E. Pittaway, L. A. Beard, G. A. Thieme, A. L. Bundy et al., “Sonographic depiction of endometrial changes occurring with ovulation induction,” Journal of Ultrasound in Medicine, vol. 3, no. 8, pp. 341–346, 1984. [Google Scholar]
4. A. C. Fleischer, C. M. Herbert, G. A. Sacks, A. C. Wentz, S. S. Entman et al., “Sonography of the endometrium during conception and nonconception cycles of in vitro fertilization and embryo transfer,” Fertility and Sterility, vol. 46, no. 3, pp. 442–447, 1986. [Google Scholar]
5. T. S. Forrest, M. K. Elyaderani, M. I. Muilenburg, C. Bewtra, W. T. Kable et al., “Cyclic endometrial changes: US assessment with histologic correlation,” Radiology, vol. 167, no. 1, pp. 233–237, 1988. [Google Scholar]
6. K. Mori, K. Kitaya, T. Ishikawa and Y. Hata, “Analysis of Endometrium Form by Using LBP for Female Infertility,” in Proc. ICMLC 2018, 2018. [Google Scholar]
7. T. Ojala, M. Pietikainen and D. Harwood, “Performance evaluation of texture measures with classification based on Kullback discrimination of distributions,” in Proc. ICPR 1994, pp. 582–585, 1994. [Google Scholar]
8. T. Ojala, M. Pietikainen and D. Harwood, “A comparative study of texture measures with classification based on feature distributions,” Pattern Recognition, vol. 29, no. 1, pp. 51–59, 1996. [Google Scholar]
9. K. D. Vries, E. A. Lyons, G. Ballard, C. S. Levi and D. J. Lindsay, “Contractions of the inner third of the myometrium,” American Journal of Obstetrics and Gynecology, vol. 162, no. 3, pp. 679–682, 1990. [Google Scholar]
10. E. A. Lyons, P. J. Taylor, X. H. Zheng, G. Ballard, C. S. Levi et al., “Characterization of subendometrial myometrial contractions throughout the menstrual cycle in normal fertile women,” Fertility and Sterility, vol. 55, no. 4, pp. 771–774, 1991. [Google Scholar]
11. G. Kunz, D. Beil, H. Deininger, L. Wildt and G. Leyendecker, “The dynamics of rapid sperm transport through the female genital tract: Evidence from vaginal sonography of uterine peristalsis and hysterosalpingoscintigraphy,” Human Reproduction, vol. 11, no. 3, pp. 627–632, 1996. [Google Scholar]
12. K. Nakai, K. Togashi, T. Yamaoka, T. Fujiwara, H. Ueda et al., “Imaging using ultrafast sequence,” Journal of Magnetic Resonance Imaging, vol. 18, no. 6, pp. 726–733, 2003. [Google Scholar]
13. K. Mori, Y. Tokunaga, T. Sakumoto, A. Nakashima, I. Komesu et al., “A uterine motion classification in MRI data for female infertility,” Current Medical Imaging, vol. 16, no. 5, pp. 479–490, 2020. [Google Scholar]
14. A. Krizhevsky, I. Sutskever and G. E. Hinton, “ImageNet Classification with Deep Convolutional Neural Networks,” in Proc. NIPS 2012, 2012. [Google Scholar]
15. K. Simonyan and A. Zisserman, “Very Deep Convolutional Networks for Large-Scale Image Recognition,” in Proc. ICLR 2015, 2015. [Google Scholar]
16. K. He, X. Zhang, S. Ren and J. Sun, “Deep Residual Learning for Image Recognition,” in Proc. CVPR 2016, 2016. [Google Scholar]
17. M. Anthimopoulos, S. Christodoulidis, L. Ebner, A. Christe and S. Mougiakakou, “Lung pattern classification for interstitial lung diseases using a deep convolutional neural network,” IEEE Transactions on Medical Imaging, vol. 35, no. 5, pp. 1207–1216, 2016. [Google Scholar]
18. M. H. Yap, G. Pons, J. Marti, S. Ganau, M. Sentis et al., “Automated breast ultrasound lesions detection using convolutional neural networks,” IEEE Journal of Biomedical and Health Informatics, vol. 22, no. 4, pp. 1218–1226, 2018. [Google Scholar]
19. G. Liang, H. Hong, W. Xie and L. Zheng, “Combining convolutional neural network with recursive neural network for blood cell image classification,” IEEE Access, vol. 6, pp. 36188–36197, 2018. [Google Scholar]
20. A. Yang, X. Yang, W. Wu, H. Liu and Y. Zhuansun, “Research on feature extraction of tumor image based on convolutional neural network,” IEEE Access, vol. 7, pp. 24204–24213, 2019. [Google Scholar]
 | This work is licensed under a Creative Commons Attribution 4.0 International License, which permits unrestricted use, distribution, and reproduction in any medium, provided the original work is properly cited. |