DOI:10.32604/iasc.2021.015913
| Intelligent Automation & Soft Computing DOI:10.32604/iasc.2021.015913 | |
| Article |
Smartphone Security Using Swipe Behavior-based Authentication
1Department of Computer and Communication Technology, Universiti Tunku Abdul Rahman, Kampar, 31900, Malaysia
2Department of Computer Science, College of Computers and Information Technology, Taif University, Taif, 21944, Saudi Arabia
3School of Computer Science and Engineering (SCE), Taylor’s University, Subang Jaya, 47500, Malaysia
4Vanderbilt University, Nashville, TN, 37240-0002, USA
*Corresponding Author: N. Z. Jhanjhi. Email: noorzaman.jhanjhi@taylors.edu.my
Received: 13 December 2020; Accepted: 08 April 2021
Abstract: Most smartphone users prefer easy and convenient authentication without remembering complicated passwords or drawing intricate patterns. Preferably, after one-time authentication, there is no verification of the user’s authenticity. Therefore, security and privacy against unauthorized users is a crucial research area. Behavioral authentication is an emerging security technique that is gaining attention for its uniqueness and transparency. In this paper, a behavior-based authentication system is built using swipe movements to continuously authenticate the user after one-time traditional authentication. The key feature is the selection of an optimal feature set for the swipe movement. Five machine learning classifiers are used, of which random forest is selected based on the best values of accuracy and F-measure. A real-time system is developed by shifting all of the computational power to a cloud server to overcome the smartphone’s computational limitations. The system is tested on three smartphones, and it is found that a minimum of seven swipes is sufficient to check user authenticity. In our experiments, the proposed feature set performs better than a state-of-the-art feature set.
Keywords: Smartphone security; behavioral biometrics; mobile security; feature set selection; swipe behavior
The modern smartphone has become an essential part of every person’s life, from waking until going to bed. It was estimated that 80% of internet access was from mobile phones in 2019 [1,2]. Security concerns have grown with the increasing ubiquity of smartphone usage because a smartphone contains social media applications, personal files, and banking and business information. During use, a smartphone’s built-in sensors, such as the touchscreen, accelerometer, gyroscope, microphone, camera, and light sensor, can be used to obtain identity information [3–11]. Continuous authentication is inconvenient in scenarios such as when the user’s face is not in front of the camera [12]. Continuous authentication with these sensors is not optimal because the user must repeatedly face the camera or continue talking. Moreover, such authentication requires significant memory and computational power due to the audiovisual data. The accelerometer and gyroscope are suitable for motion-specific activities [10], such as picking up the phone to receive a call or while walking or running. However, these techniques are unsuitable when the smartphone is not moving [13]. The touchscreen is highly reliable for continuous authentication because touch gestures contain identity-rich behavioral features [13,14]. The swipe movements’ traces are similar for a given user and different from other users [15]. Swipe gesture-based identification can potentially authenticate users while requiring no additional activities.
A suitable touch dynamic feature set is needed to improve the continuous authentication system used for any interface containing swipe movements. A real-time system must be developed and implemented. This study has three objectives: (1) identify all possible features for swipe movement and apply them to find the best-suited classifiers; (2) use step forward feature selection (SFFS) to select the best-performing subset of features according to the F-measure and accuracy; (3) develop an Android application that works in a real-time scenario to evaluate the proposed solution. Identifying the optimal and most suitable features of a swipe-based authentication system and their real-time implementation and evaluation are significant contributions of this study. To overcome the limited computational capabilities of a mobile device [16–18], the intensive computation of machine learning algorithms has been shifted to a cloud server [18,19].
The rest of this paper is organized as follows. Section 2 discusses related work. The system is described and explained in Section 3. Section 4 presents the results and discussion.
Swipe behavior-based authentication can be used to unlock an application, that is, one-time authentication, and for continuous authentication after unlocking it. One-time authentication can be used at the entry point using a pattern lock [20] and using a swipe to unlock the screen [21,22]. In this method, user behavior is observed along with the correct movement. One-time authentication has the limitation of single-point–based authentication. Once a person successfully enters the system, there is no further validation check. A person who has a username and password or other entry credentials may not be the right user, as these can be copied, stolen, or hacked. An additional security layer of behavioral authentication can be added by considering the time it takes to enter the password [23]. It has been postulated that an intruder would not be authenticated due to the difference in the time taken to type the password. However, this fails to consider the possibility that an intruder might type the password at the same speed. To ask the user to repeatedly enter a password or scan a finger does not seem feasible. Behavioral biometrics using optimal features can address these challenges through continuous authentication.
Behavioral biometrics can be used to continuously validate the user’s identification by gauging mobile usage behavior. Every person uses a mobile device differently [24] and has different body measurements. Therefore, every person interacts with a mobile differently due to different touch sizes and finger sizes. These differences can be used for continuous authentication. The swipe is the most used gesture on a smartphone touchscreen [25], in vertical (up, down) and horizontal (left, right) directions. The swipe gesture has features such as length, absolute length, starting and ending coordinates, pressure, area, and direction, which vary among users. The literature has not sufficiently addressed swipe gesture features for continuous authentication. However, some studies have shown that swipe gestures can improve continuous authentication effectiveness on a mobile phone [26,27].
Horizontal and vertical strokes have been used to acquire the user’s behavioral data. A study identified the two most discriminative features from experiments: (1) the finger area and finger pressure by measuring in the middle of the swipe, and (2) the absolute length between two endpoints [26]. An application was developed, and data were collected on eight different mobile phones and tablets. The study achieved more than 95% accuracy using k-nearest neighbor (KNN) and random forest (RF) classifiers. The data were collected using two interfaces, namely, vertical and horizontal strokes.
Likewise, 15 swipe features related to coordinates, distance, orientation, and direction were extracted to continuously authenticate the user [27]. In this study, every swipe gesture was checked for authentication, and a trust level was built. If the trust level dropped to a specific threshold, the user was rejected. This authentication seems reasonable in theory, but computationally, it is costly due to successive classification operations. The time consumed to authenticate the user depends on the phone’s computational power.
In another study, nine swipe modality features related to time, distance, area, pressure, velocity, acceleration, and the magnetometer were extracted for the user’s continuous authentication from one swipe event [28]. This study used the swipe movement as a single movement, whereas a swipe is four-directional. The direction of movement cannot be ignored because directions have different features. For example, in swipe-up and swipe-down movements, the finger moves up and down, respectively. Both cases have different starting and ending positions, pressures, and touch areas. The proposed solution was not evaluated using real-time applications. Horizontal swipe features were extracted using a specific area, the swipe button was at a specific place, and the swipe movement was limited to a specific area. Another study examined features related to duration, velocity, acceleration, pressure, and area [29]. Like the previous study, no system was developed for real-time evaluation of the proposed solution.
Both the above studies used features related to the accelerometer and gyroscope, which are suitable only for motion-specific activities [30], such as picking up the phone or receiving a call while walking or running, to measure distances. These features are not useful when the device is not moving [13,31–33].
Table 1: Comparative analysis of existing touch dynamic authentication methods
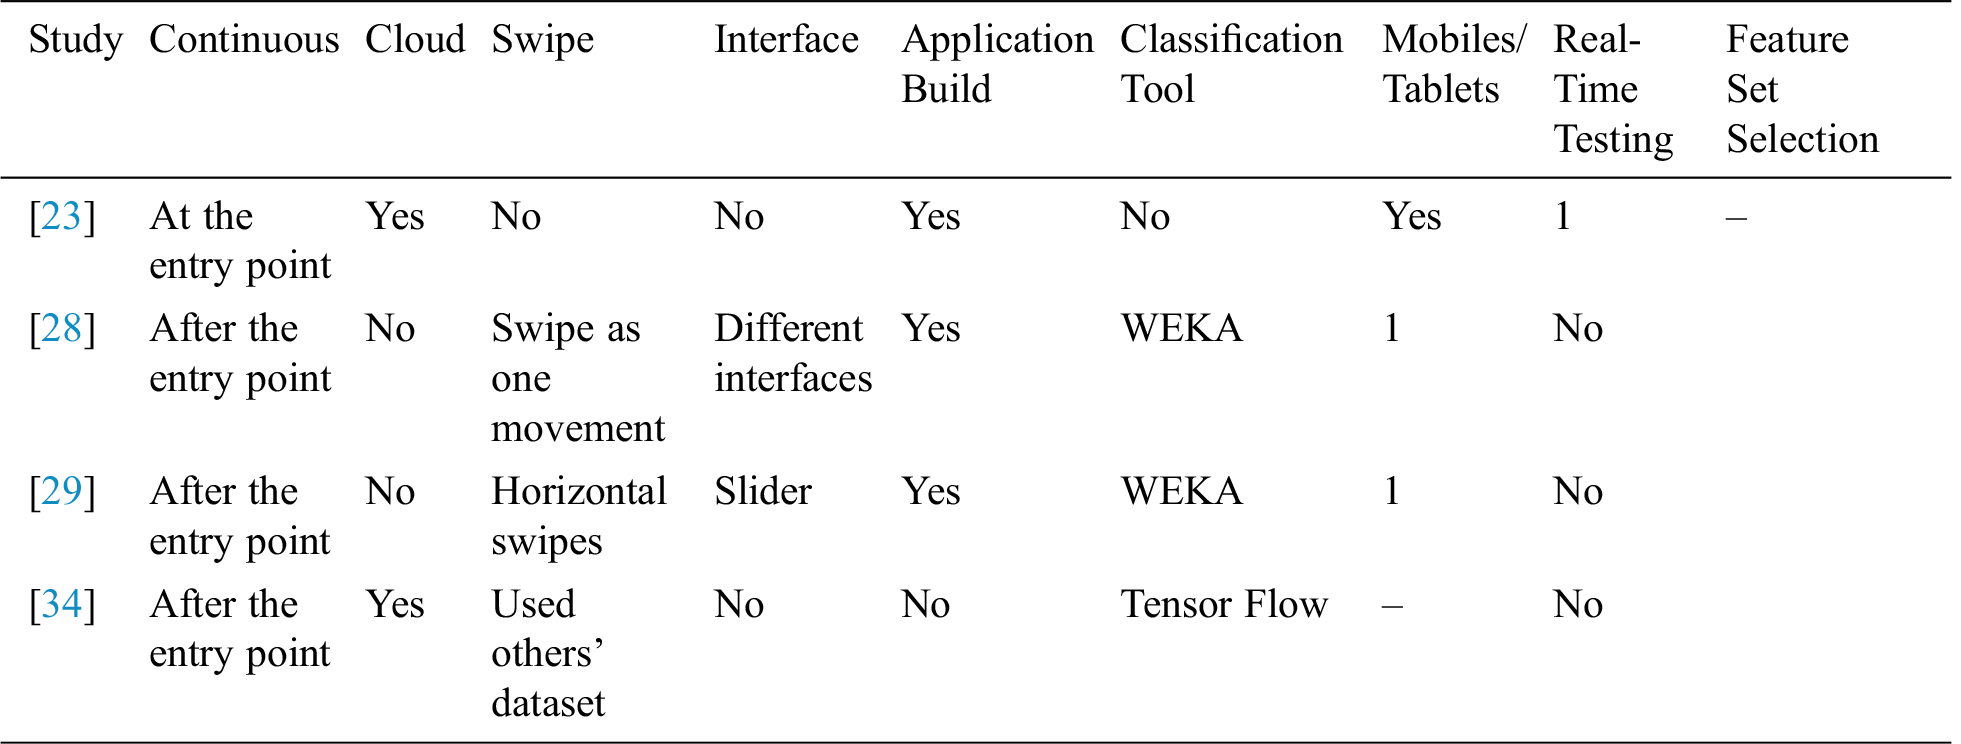
Considering the solutions mentioned above and their limitations, Tab. 1 shows that existing feature sets are incapable of providing an optimal and effective solution for continuous authentication using swipe gestures. Optimal swipe feature set selection (FSS) and real-time evaluation are their main limitations.
3 Description of Proposed Model
The proposed model, as depicted in Fig. 1, has the three stages of data acquisition, classifier and feature set selection, and implementation and evaluation. All possible swipe-touch movement features at the first stage were identified from the literature and Android documentation. An application was developed to acquire data from different users for preliminary analysis. In the second stage, preprocessing removed outliers from the data, and features were extracted from the raw data. The best-suited classifier was selected using these features. Next was feature set selection, where different combinations of features were tested, and the best-performing feature set was selected. A real-time evaluation was done in the third stage, using the classifier and the feature set derived from the second stage. The real-time system was developed by offloading the heavy processing load of machine learning from the mobile device to a cloud server. The system was trained and tested using data of both legitimate users and imposters. A trained model was built using the training data; testing data were used to evaluate the trained model, and results were generated.
The work was done in two phases. The first phase had the two stages of classifier and feature set selection; in the second phase, a real-time system was built for evaluation.
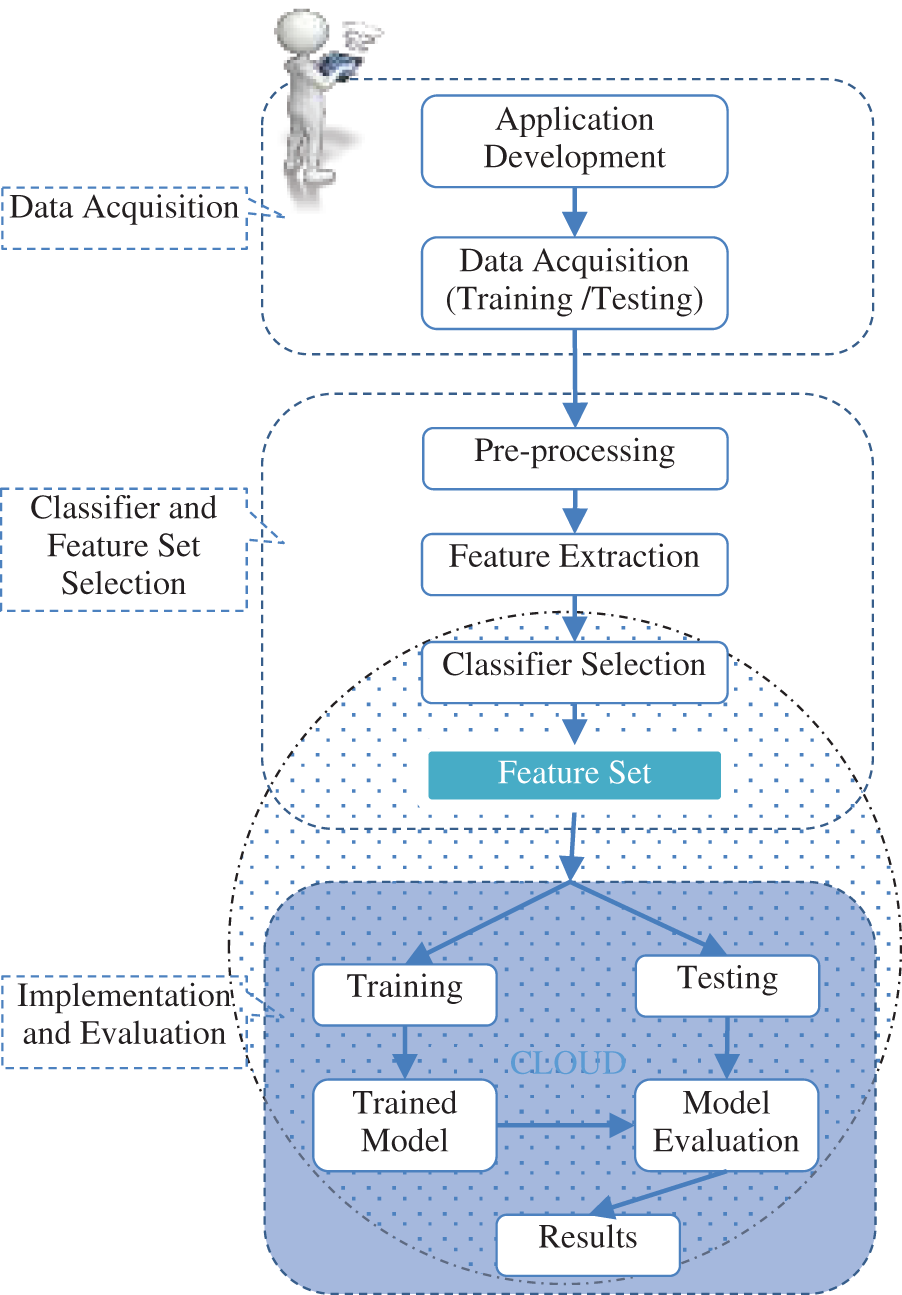
Figure 1: Proposed model
3.1.1 Feature Identification and App Development
All possible features related to touch events, especially swipe movements, were identified from the literature and Android documentation. Initially, 16 features were used: start-pressure, end-pressure, average-pressure, start-finger-area, end-finger-area, average-finger-area, start-x-position, end-x-position, start-y-position, end-y-position, swipe-angle (direction), swipe-duration, average-speed, rectangular-area-under-swipe, length, and absolute-length of swipe. A swipe is a four-directional movement, so feature level fusion was performed to make a generic model for all directions. An Android application was developed to collect behavioral data transparently. The user would be unaware of the authentication procedure; his/her movements would be recorded and verified continuously in the background while using the application naturally.
Three smartphones were used for data collection: (1) Samsung Galaxy J7 Pro: 5.5-inch screen, Android 7.0, Octa-core processor, 1.6 GHz, 3 GB RAM; (2) Samsung Galaxy J7 Prime: 5.5-inch screen, Android 6.0.1, Octa-core processor, 1.6 GHz, 3 GB RAM; (3) Xiaomi Redmi 1S: 4.7-inch screen, Android 4.4.4, Quad-core Max processor, 1.6 GHz, 1 GB RAM. Only the Samsung Galaxy J7 Pro was used for classifier and feature selection. All three mobiles were used for evaluation. Data were initially collected from 54 participants (23 females and 31 males), and we collected complete data from 45 participants (20 females and 25 males) at the end of the day. Most were undergraduate students; others were postgraduate students and faculty members. All participants were experienced mobile users of ages 19 to 43. The purpose of data collection was explained to them, and instructions were given about application usage. A consent form was signed before data collection.
An application was built to collect data in the background. A participant’s touch behavioral data were collected when using the application. Swiping finger movements were collected in the up, down, left, and right directions. Diagonal up and down movements were treated as up and down, respectively, and diagonal left or right movements were treated similarly as left and right. Data collection occurred in a controlled environment in which a participant was required to perform a specific number of moves in each direction. Data were collected three times during the day; namely, morning, afternoon, and evening, to ensure data consistency. Subject to the participants’ availability, the data collection gap was around two to three days at different times. Each time, a user had to perform around 400 swipe movements (100 in each direction). Users could provide data in any posture, such as sitting, standing, or walking.
3.1.3 Data Preprocessing and Feature Extraction
The raw data might contain errors or outliers, so preprocessing was necessary. The raw data were directly obtained from the smartphone memory and shifted to the computer for preliminary analysis. For example, some outliers were detected, for example, touch features equal to zero or missing or values out of the normal range because of an inappropriate touch event. In these cases, the length and absolute length values would be out of range as not belonging to a swipe movement, so it was necessary to delete the whole vector. Outliers were manually deleted in the first phase and handled directly from the second phase’s mobile device. Some features, such as starting and ending coordinates, pressure, and area values, were taken directly from the raw data. Others, such as direction, absolute length, and rectangular area under the swipe, were derived later from the raw data.
WEKA (version 3.8) was used for preliminary data analysis because of its graphical user interface (GUI). WEKA can tune many classifiers at a time, and metrics such as confusion matrix, accuracy, and F1-measure were obtained. After finalizing the classifier, a Python application was developed for classification in the second phase. The next step was to select the best-performing machine learning classifier. Five classifiers were chosen based on a previous study [35]: (1) support vector machine (SVM), (sequential minimal optimization (SMO) in WEKA); (2) neural network (multi-layer perceptron (MLP) in WEKA); (3) KNN (IbK in WEKA); (4) decision tree (DT) (J48 in WEKA); and (5) RF. SMO and MLP are found in the functions category in WEKA, IbK in the lazy category, and J48 and RF in the trees category. Data were collected from 45 participants. Only one of the 45 users was legitimate, so there was a need to handle imbalanced data. To do this, stratified k-fold cross-validation was used for each classifier using evaluation metrics such as accuracy, false-positive rate (FPR), precision, recall, and F1-measure [36–38]. The data proportions of imposters and legitimate users were set to 80% and 20%, respectively.
Stratified k-fold cross-validation has an equal proportion of imbalanced classes in each fold [36,38], and all folds are used for both training and testing. WEKA uses stratified cross-validation by default [39]. The data were fed to each classifier one by one using stratified k-fold cross-validation to obtain the evaluation metrics. These metrics are important in different scenarios, so we considered all of them. Accuracy works better on a balanced dataset in which all classes have equal weight but does not perform well with imbalanced data. For example, if the partitions of legitimate and imposter data are 10% and 90%, respectively, then the output is biased toward the imposter data. The false-positive rate shows the ratio of negative instances that are predicted positive (we desire to minimize this). Precision works well when rejecting a legitimate user is acceptable but to accept an imposter is not. Recall works well when accepting an imposter is acceptable but rejecting a legitimate user is not. Ideally, both precision and recall are high and closer to 100%. In this scenario, instead of looking at two values, a single-value FM is used. FM is the harmonic mean between precision and recall. FM should ideally also be close to 100%. In our study, FM was the most significant value for making decisions. The classifiers were tested with different combinations of true and false data proportions, as explained in Section 4.1.
3.1.5 Feature Set Selection Method
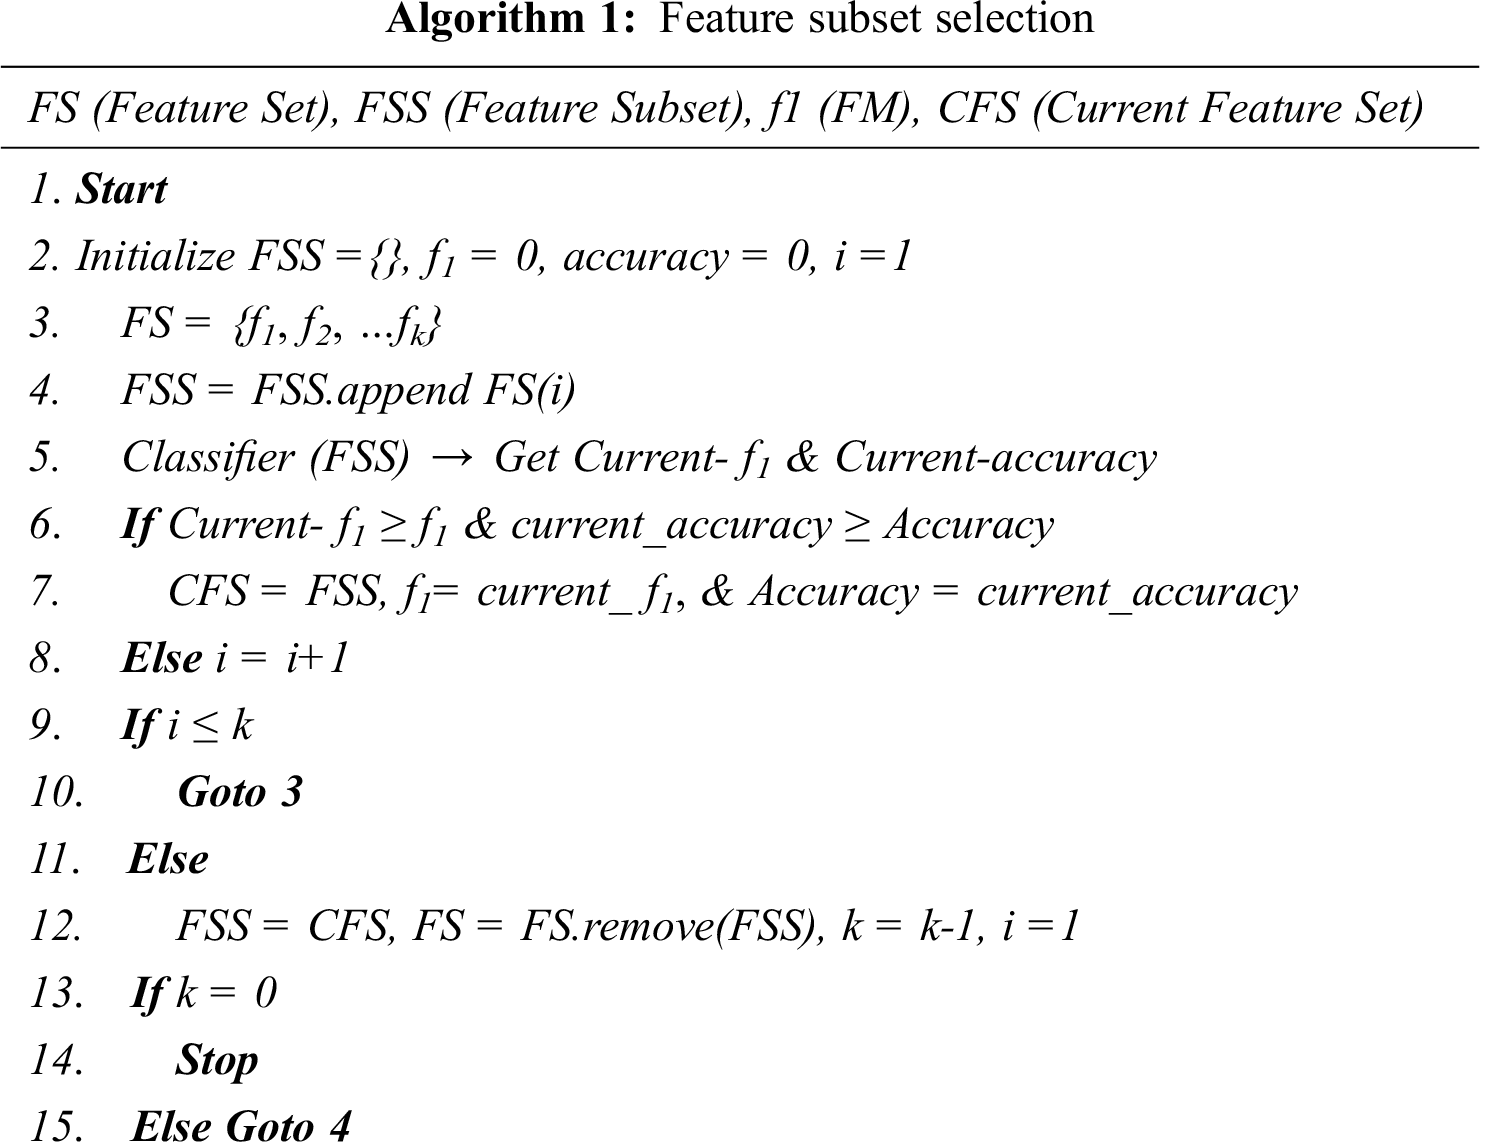
We used SFFS for feature subset selection for two reasons: first, it can be used with any selected classifier; second, each added feature’s impact can be checked. The subset of best-performing features was selected by starting with the null feature and adding individual features using this method. The first feature was selected in the first cycle; this was tested with the remaining features in the second cycle, and the best-performing combination was selected for the next cycle. This process continued until the best-performing feature set was selected. The process is shown in Algorithm 1.
A Python application was developed for data collection, analysis, classification, and finalization of the second phase’s decision score. The application worked in the background and collected behavioral data without disturbing the user’s routine activities. After preprocessing and feature extraction, the data were shifted to the server for classification, as shown in Fig. 2. For the first-time usage, the system was trained by providing multiple input values from the training data, and in the testing phase, the user’s authenticity was continuously checked. A training model was built in the training phase for use in authenticating the user in the testing phase. Based on the similarity score, further action could be taken.
For real-time testing, the Android application was modified to send and receive data between the smartphone and the cloud server. All preprocessing and feature extraction occurred on the smartphone. The selected classifier and feature set from Phase 1 were developed in the Python program and put on the server. The mobile device data came in training and testing modes, for which the files train.csv and test.csv, respectively, were created on the server. Data came to the server in the JSON format, which was converted to the CSV format. The train.csv file was built once at training time, and test.csv was recreated each time new data were tested.
After login to the application, data were collected from users for the training phase on Samsung Galaxy J7 Pro, Galaxy J7 Prime, and Xiaomi Redmi 1S mobile devices. Data were collected from 45 users, each providing approximately 400 samples taken at different times. One user was set as a legitimate user and the others as imposters. The implementation process can be seen in Algorithm 2.
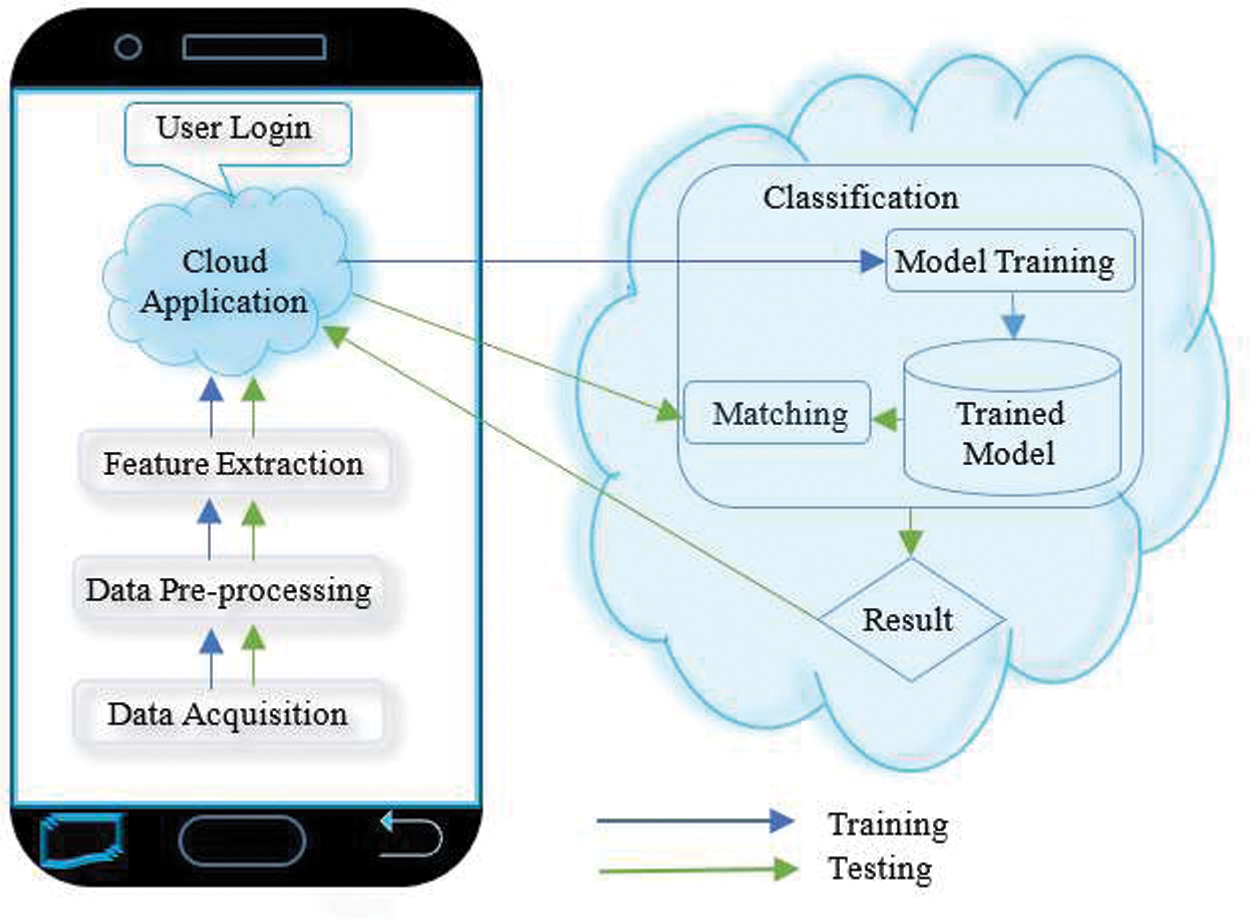
Figure 2: Implementation
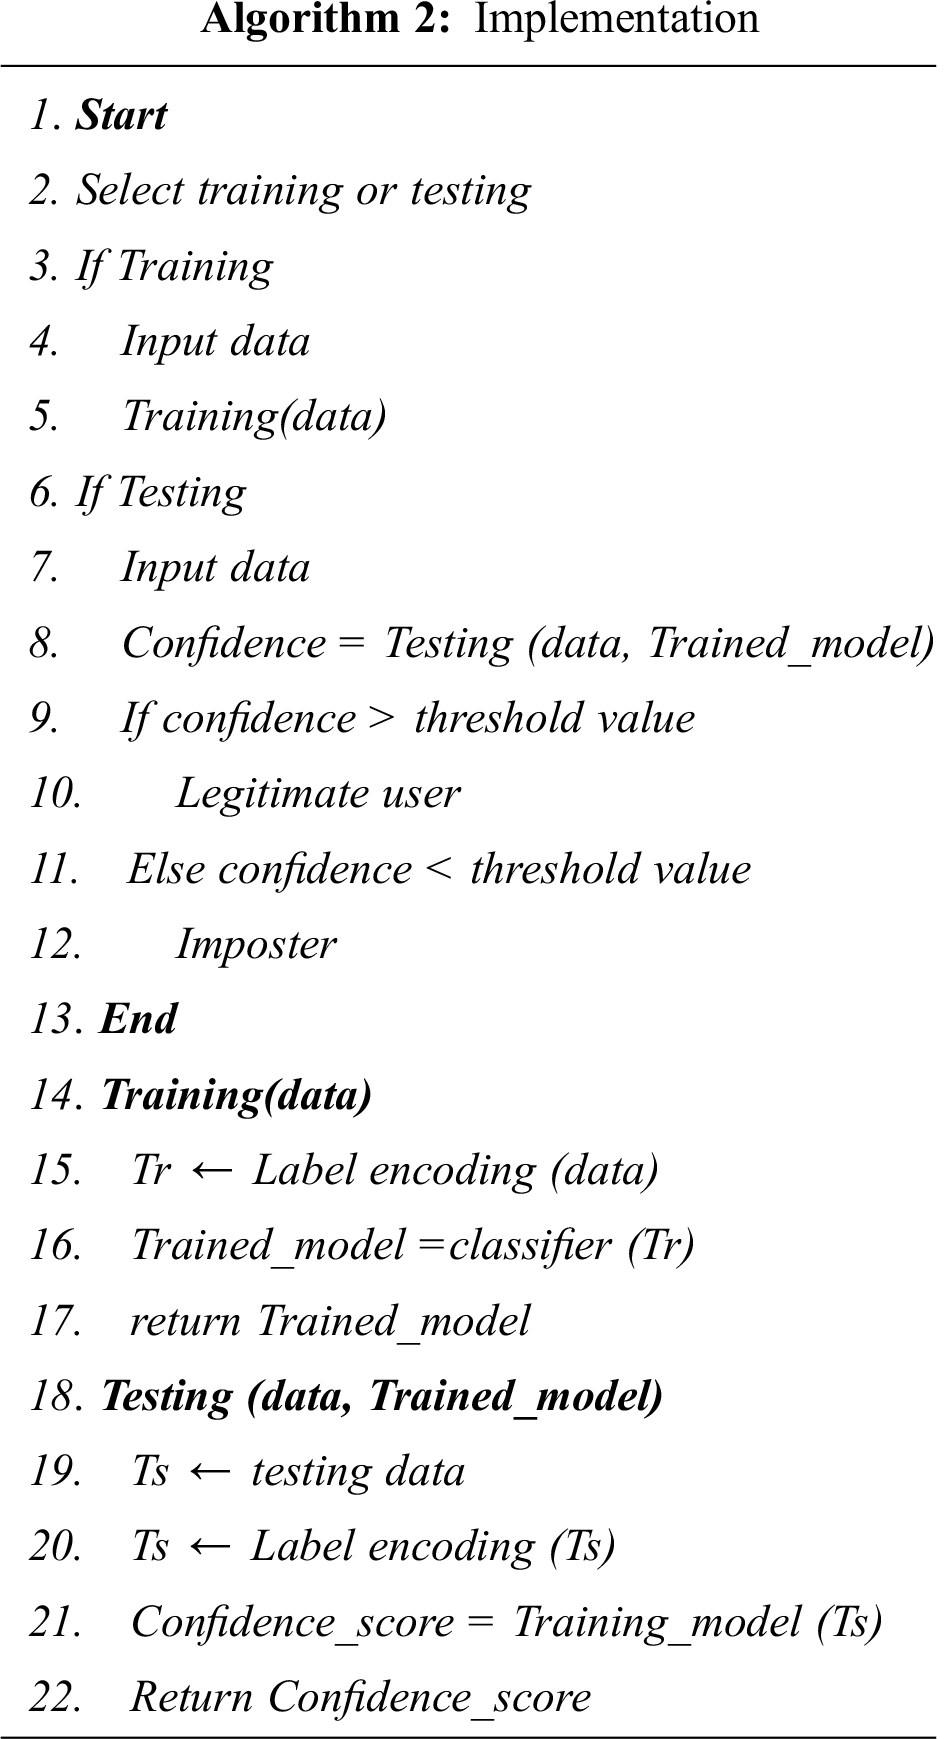
The system had to first be trained; system training was selected, and data were collected from the user and sent to the training function. Data were categorized as swipe-up, swipe-down, swipe-left, or swipe-up. Label encoding converted it to a machine-readable form. These data were fed to the classifier, and a model was trained and saved on the server for use in testing phases. Once the system was trained, it was tested by inputting a specific number of swipes. The swipe selection method is explained in Section 4.3. In the testing phase, user data were collected and sent to the testing function. As in the training phase, label encoding was performed. Data were then tested against the trained model to generate a confidence score. A user was accepted if the confidence score exceeded a threshold value and rejected otherwise.
Experiments were performed for both legitimate users and imposters, as follows, to evaluate the system.
Data were collected from 45 participants, of which 44 were taken as imposters and one as a legitimate user. The volume of imposter data was much greater than that of the legitimate user. The imposter data were decreased, and the legitimate user data were increased in different ratios. The first dataset had a proportion of 85% imposter data and 15% legitimate user data; the second had 80% and 20%, and the third had 75% and 25%. We tested these three proportions to assess their impact on classifier selection. The datasets were fed to the RF, J48, MLP, SMO, and Ibk classifiers (all with default parameters) and assessed on the accuracy, FPR, precision, recall, and FM. We focused on FM, as the data were unbalanced. From the results shown in Fig. 3, it can be seen that in all cases, RF performed best on all metrics, especially FM. For further evaluations and experiments, RF (with n_estimators = 150 and random_state = 15325) was used with data in proportions of 20% legitimate users and 80% imposters.
The SFFS method was used for feature set selection, as explained in Algorithm 1. In the first iteration, the feature st-Y was selected as an individual feature based on performance. The end-pressure feature was discarded because another feature, start-pressure, gave the same result. In the second iteration, all combinations of st-Y and a second feature were evaluated, and end-Y was selected. This process continued until set11, where the values of FM and accuracy were the highest, and no further improvement could be seen after adding the remaining features in the set, as shown in Tab. 2.
Table 2: Feature set selection
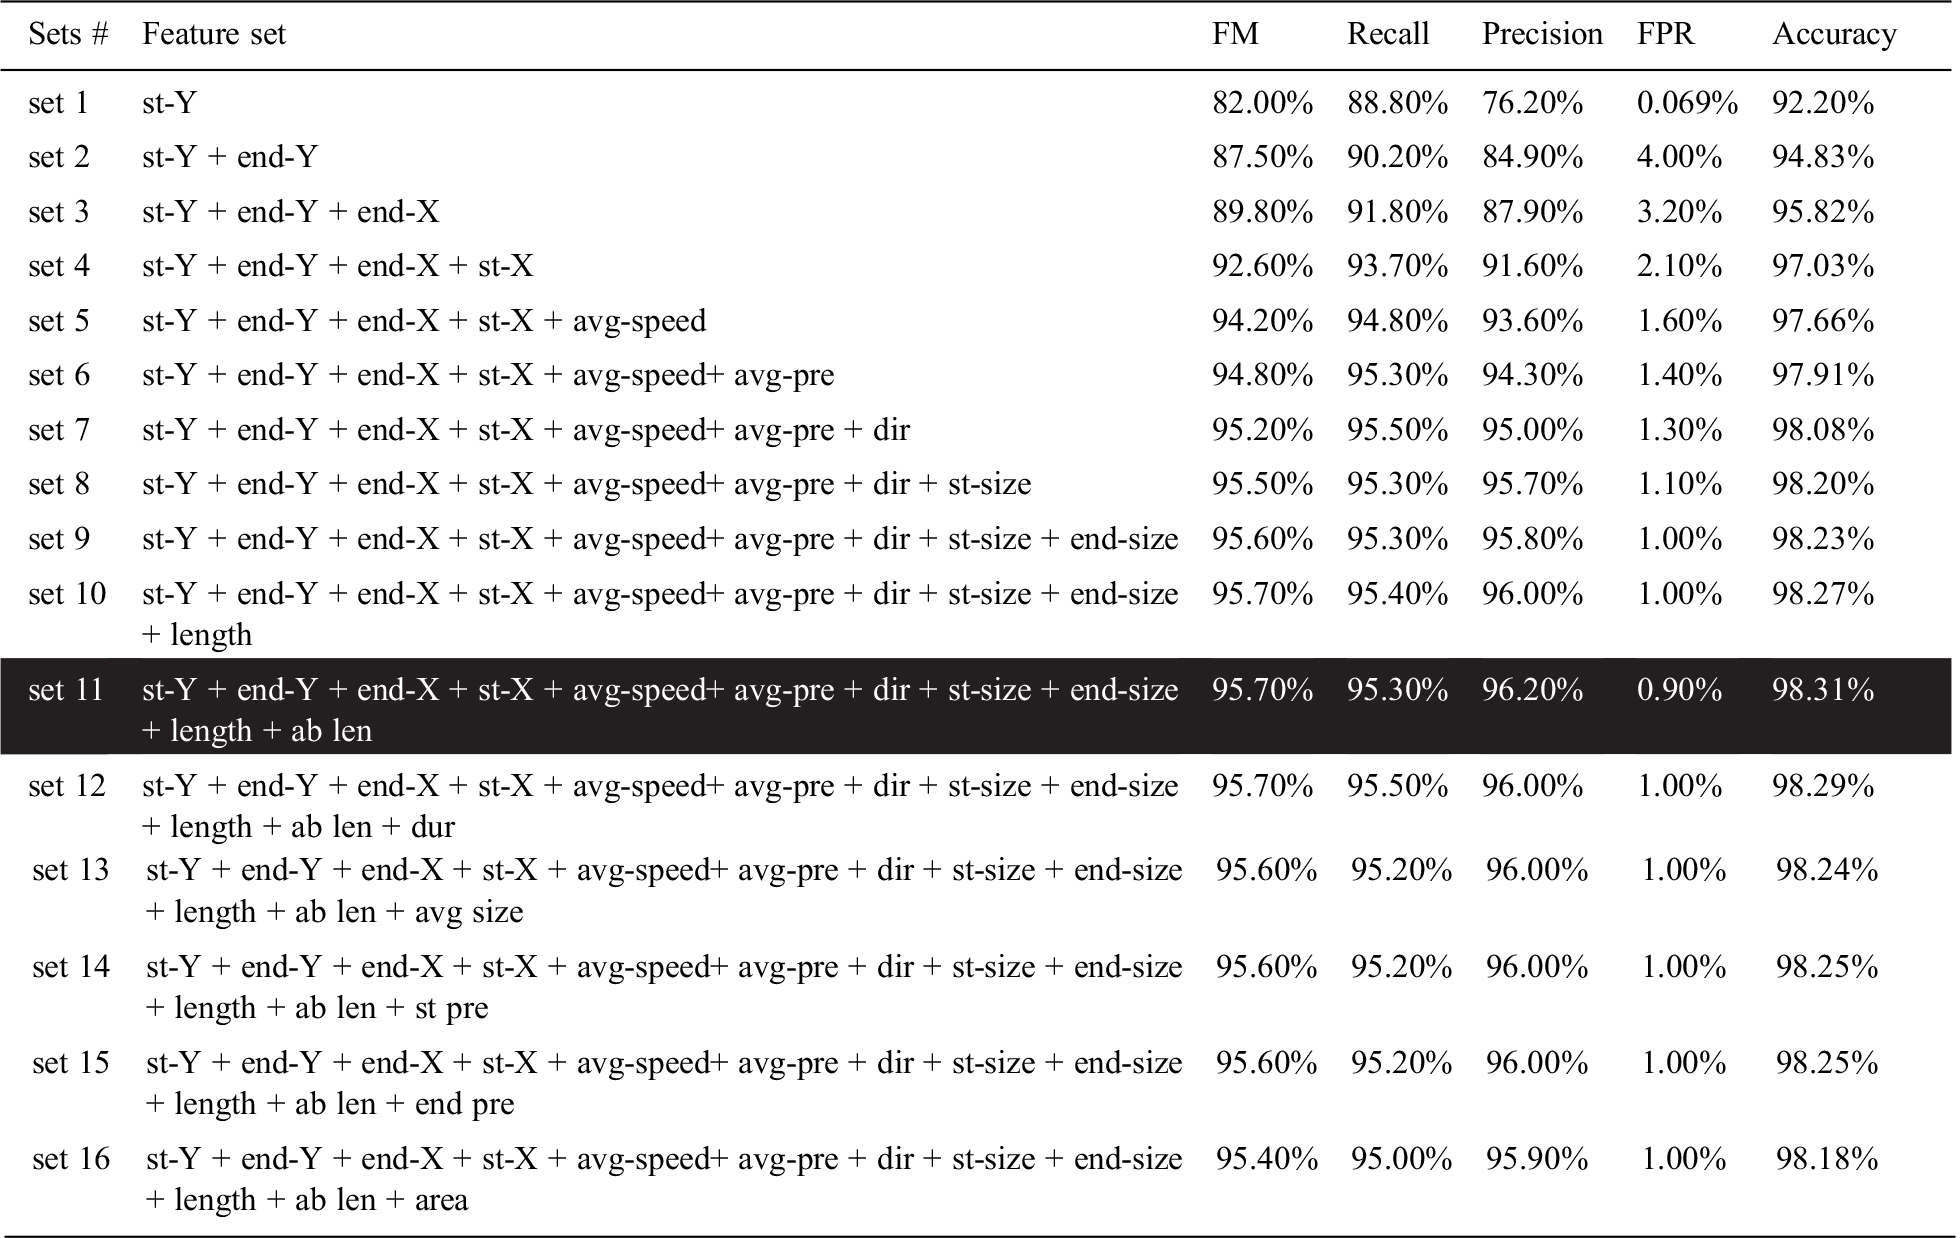
Accordingly, the features of duration, avg size, start-pressure, end-pressure, and rectangular area under swipe were removed from the feature set. Features were discarded for different reasons: swipe-duration was not significantly distinguishing for most users; start-pressure and end-pressure produced constant values, avg-size gave the same values as avg-pressure; and area showed poor performance.
4.3 Selection of Number of Swipes
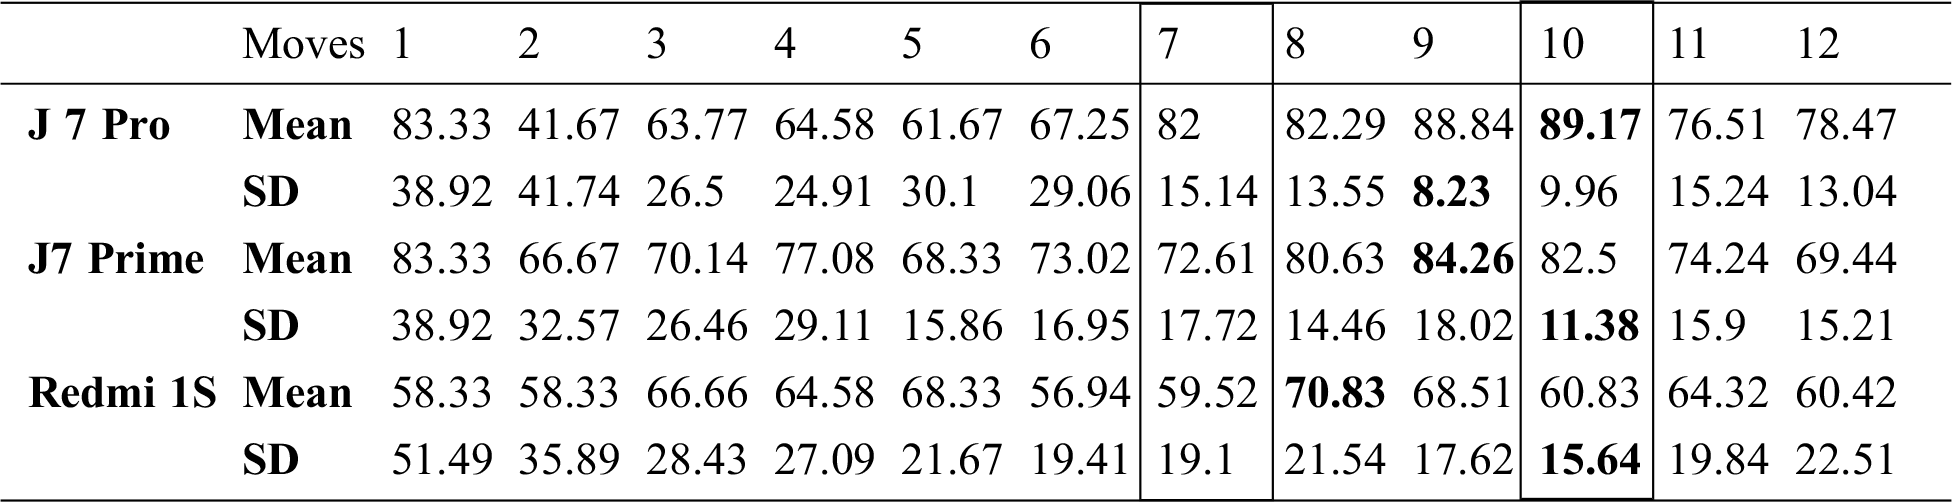
It was necessary to determine a sufficient number of swipe movements to detect a user in real-time evaluation. For this purpose, 144 experiments were performed on each smartphone, consisting of 12 replications for each set of moves from 1 move to 12 moves. Their mean and standard deviation were calculated for all numbers of moves, as shown in Tab. 3. The number of swipes was selected based on a higher mean and lower standard deviation. The latter implies that results do not vary much. The highest means and lowest standard deviations are highlighted for each smartphone in Tab. 3. All are in the range of 8 to 10, and the lowest possible number of moves is 7, so we used 7 and 10 moves in experiments.
Table 3: Number of swipes selection
For the evaluation, smartphones were given to legitimate users and imposters to perform experiments. Fig. 3 shows the accuracy of the legitimate user in experiments on all three mobiles for 10 swipes.
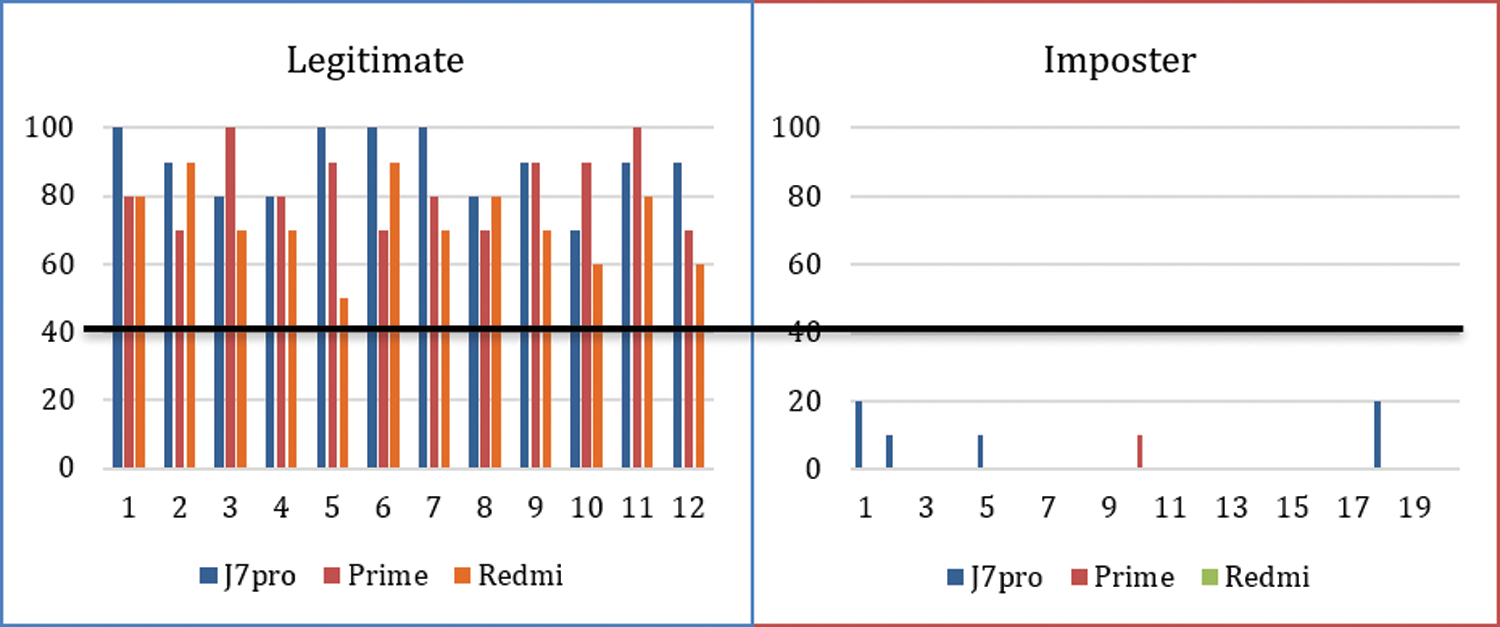
Figure 3: Evaluation with ten swipes
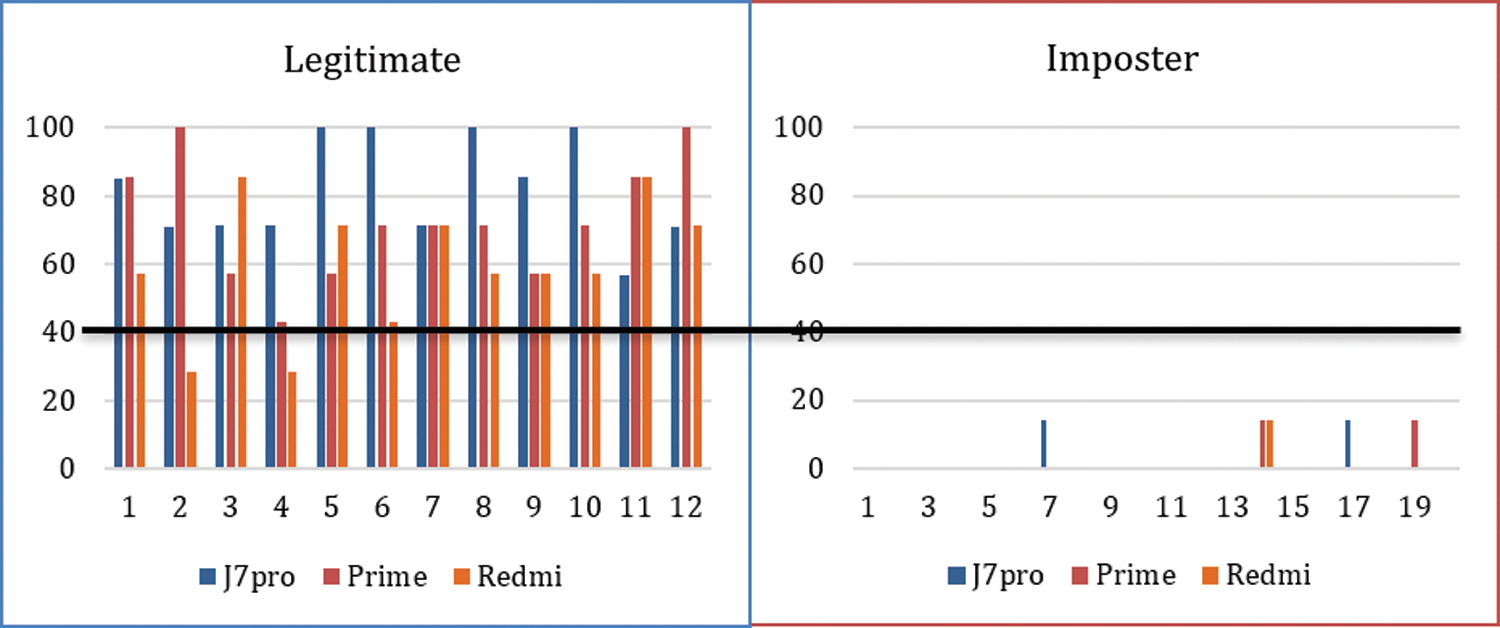
Figure 4: Evaluation with seven swipes
Smartphones were also given to imposters to execute a specific number of moves. Fig. 4 shows the accuracy of 20 legitimate users on all three mobiles for 7 swipes. In both cases, if the threshold value was set to 40, then for 10 swipes, no legitimate user was rejected, and no imposter was accepted. In the case of 7 swipes, for the threshold value 40, only two legitimate Redmi mobile users were rejected, and no imposter was accepted. The threshold can be adjusted according to the sensitivity of the system.
4.5 Comparison with Related Work
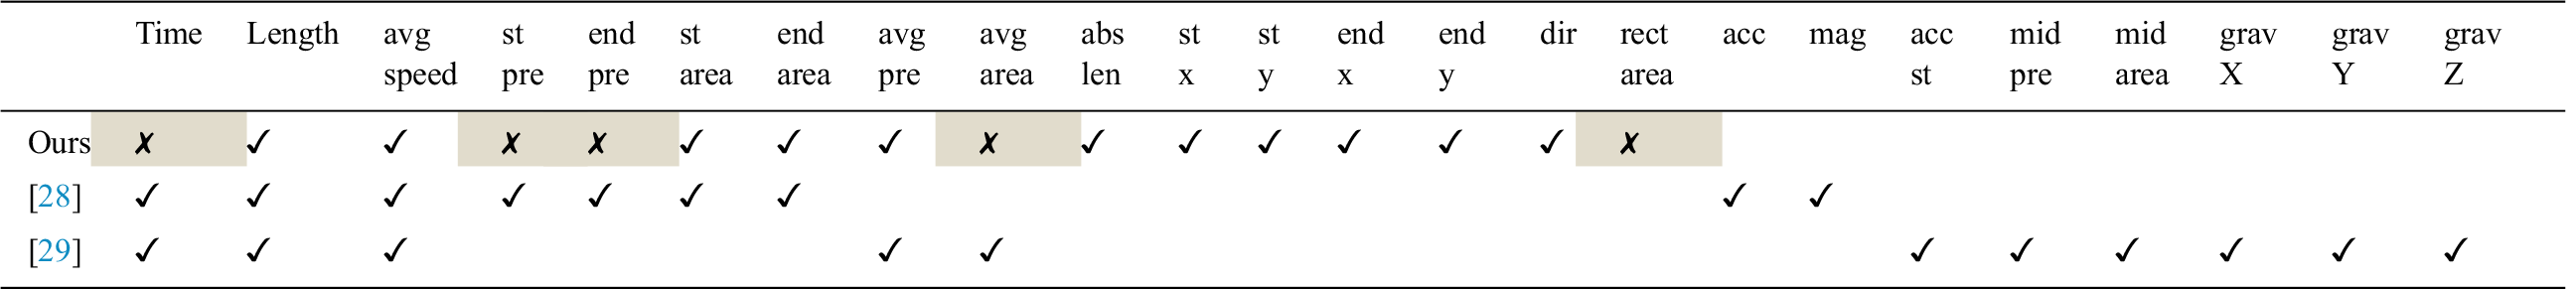
The comparison of sensor-based smartphone authentication is limited by the lack of an accredited common dataset and evaluation methodology [40]. Researchers build models by different approaches using various data splitting methods, making a fair comparison difficult. We relied on two studies [28,29]. Tab. 4 shows the features used in our study and the other researchers, where the symbols ✓ and ✗ (denote) features were selected and dropped, respectively, during feature selection.
Table 4: Comparison of features
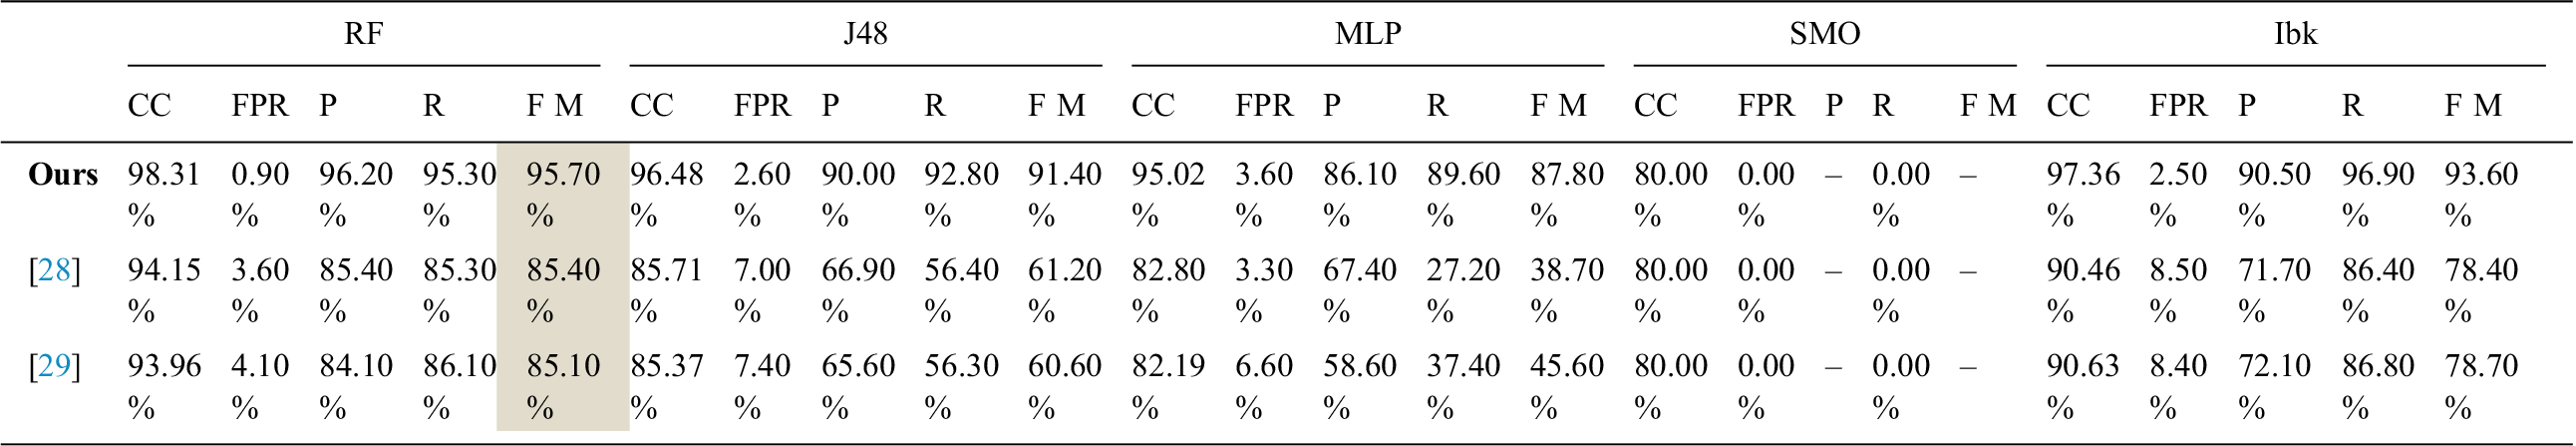
Tab. 5 compares the results of our work and the related studies, where comparisons are based on our dataset and the features used by the cited researchers. Our feature set performed best for each of the classifiers, and the RF classifier achieved the highest score for swipe movement [28]. Our feature set gave F-measure and accuracy values of 95.70% and 98.31%, respectively, which are much better than the compared studies for the RF classifier.
In our study, features related to the accelerometer and gyroscope were not used; these are suitable for motion-specific activities such as picking up the phone, walking, running, or measuring distance but not for touch events [13,31–33,41–45]. Features like duration, start-pressure, end-pressure, avg-size, and area (the rectangular area under the swipe) were discarded because they did not enhance performance. It was found that duration values are not adequate to distinguish users because they may be the same for different users. The start pressure and end pressure were giving constant values, so they were discarded. The values obtained from avg-size and avg-pressure were precisely the same, so one was removed. One more feature, area (rectangular area under swipe), was discarded because it did not improve the results, as shown in Tab. 2.
Table 5: Feature and classifier comparison, CC (Correctly Classified), FPR (False Positive Rate), P (Precision), R (Recall), FM (f-measure)
We explored swipe behavior-based authentication, which works in the background on a smartphone without requiring the user’s attention. Several studies have examined swipe behavior authentication, but the features used are still lacking. For example, accelerometer and gyroscope readings are not applicable in the case of touch biometrics. These motion-based sensors can be used only when constant body motion is involved. Some features related to pressure are not applicable because they obtain fixed values. From our experiments, we found the RF classifier to perform better for swipe movements. The selected feature set performed better than current approaches in terms of FM and accuracy. A real-time system was developed, and a range of swipes was selected for evaluation after multiple experiments. Experiments were performed only for 7 and 10 moves. For the threshold value of 40, no imposter was successfully authenticated. We plan to include other touch gestures like tap, double-tap, and pinch by making generic and specific interfaces and comparing the differences among their results. The system currently uses a two-class classifier, which requires data collection from both legitimate users and the imposter; this can be improved with a one-class classifier, in which case imposter data will be unnecessary.
Acknowledgement: We thank LetPub (www.letpub.com) for its linguistic assistance during the preparation of this manuscript.
Funding Statement: Taif University Researchers Supporting Project (no. TURSP-2020/36), Taif University, Taif, Saudi Arabia.
Conflicts of Interest: The authors declare that they have no conflict of interest to report regarding the present study.
1. J. Karaian, “The mobile internet is the internet,” Quartz, 2017. [Online]. Available:https://qz.com/1116469/we-now-spend-70-of-time-online-on-our-phones/ (Accessed: 11 Apr 2020). [Google Scholar]
2. S. Ann and A. Schwartz, “70% of internet traffic comes from mobile phones | CIO Dive,” 2017. [Online]. Available: https://www.ciodive.com/news/70-of-internet-traffic-comes-from-mobile-phones/510120/ (Accessed: 11 Apr 2020). [Google Scholar]
3. Y. Li, H. Hu and G. Zhou, “Using data augmentation in continuous authentication on smartphones,” IEEE Internet of Things Journal, vol. 6, no. 1, pp. 628–640, 2019. [Google Scholar]
4. H. G. Kayacik, M. Just, L. Baillie, D. Aspinall and N. Micallef, “Data driven authentication: On the effectiveness of user behaviour modelling with mobile device sensors,” in Proc. of the Third Workshop on Mobile Security Technologies (MoST) 2014, San Jose, CA, USA,Report number: MoST/2014/01, 2014. [Google Scholar]
5. W. H. Lee and R. B. Lee, “Multi-sensor authentication to improve smartphone security,” in 2015 Int. Conf. on Information Systems Security and Privacy (ICISSP). Portugal, pp. 1–11, 2015. [Google Scholar]
6. R. Wang and D. Tao, “Context-aware implicit authentication of smartphone users based on multi-sensor behavior,” IEEE Access, vol. 7, pp. 119654–119667, 2019. [Google Scholar]
7. T. Zhu, Z. Qu, H. Xu, J. Zhang, Z. Shao et al., “RiskCog: Unobtrusive real-time user authentication on mobile devices in the wild,” IEEE Transactions on Mobile Computing, vol. 19, no. 2, pp. 466–483, 2020. [Google Scholar]
8. M. A. Alawami, W. Aiken and H. Kim, “LightLock: User identification system using light intensity readings on smartphones,” IEEE Sensors Journal, vol. 20, no. 5, pp. 2710–2721, 2020. [Google Scholar]
9. Z. Sitova, J. Sendenka, Q. Yang, G. Peng, G. Zhou et al., “HMOG: New behavioral biometric features for continuous authentication of smartphone users,” IEEE Transactions on Information Forensics and Security, vol. 11, no. 5, pp. 877–892, 2016. [Google Scholar]
10. Z. Qin, L. Hu, N. Zhang, D. Chen, K. Zhang et al., “Learning-aided user identification using smartphone sensors for smart homes,” IEEE Internet of Things Journal, vol. 6, no. 5, pp. 7760–7772, 2019. [Google Scholar]
11. K. Tornai and W. J. Scheirer, “Gesture-based user identity verification as an open set problem for smartphones,” in 2019 Int. Conf. on Biometrics, ICB 2019. Crete, Greece, 2019. [Google Scholar]
12. M. Baloul, E. Cherrier and C. Rosenberger, “Challenge-based speaker recognition for mobile authentication,” in Proc. of the Int. Conf. of the Biometrics Special Interest Group, BIOSIG 2012, Darmstadt, Germany, pp. 1–7, 2012. [Google Scholar]
13. N. Sae-Bae, K. Ahmed, K. Isbister and N. Memon, “Biometric-rich gestures: A novel approach to authentication on multi-touch devices,” in SIGCHI Conf. on Human Factors in Computing Systems, Austin, TX, USA, pp. 977, 2012. [Google Scholar]
14. M. Frank, R. Biedert, E. Ma, I. Martinovic and D. Song, “Touchalytics: On the applicability of touchscreen input as a behavioral biometric for continuous authentication,” IEEE Transactions on Information Forensics and Security, vol. 8, no. 1, pp. 136–148, 2013. [Google Scholar]
15. X. Zhao, T. Feng, W. Shi and A. K. Ioannis, “Mobile user authentication using statistical touch dynamics images,” IEEE Transactions on Information Forensics and Security, vol. 9, no. 11, pp. 1780–1789, 2014. [Google Scholar]
16. T. Neal and D. Woodard, “Surveying biometric authentication for mobile device security,” Journal of Pattern Recognition Research, vol. 11, no. 1, pp. 74–110, 2016. [Google Scholar]
17. T. H. Noor, S. Zeadally, A. Alfazi and Q. Z. Sheng, “Mobile cloud computing: Challenges and future research directions,” Journal of Network and Computer Applications, vol. 115, no. 2, pp. 70–85, 2018. [Google Scholar]
18. G. Fenu and M. Marras, “Controlling user access to cloud-connected mobile applications by means of biometrics,” IEEE Cloud Computing, vol. 5, no. 4, pp. 47–57, 2018. [Google Scholar]
19. Y. Karaca, M. Moonis, Y. D. Zhang and C. Gezgez, “Mobile cloud computing based stroke healthcare system,” International Journal of Information Management, vol. 45, no. 5, pp. 250–261, 2019. [Google Scholar]
20. Y. Ku, L. H. Park, S. Shin and T. Kwon, “Draw it as shown: behavioral pattern lock for mobile user authentication,” IEEE Access, vol. 7, pp. 69363–69378, 2019. [Google Scholar]
21. W. Li, J. Tan, W. Meng, Y. Wang and J. Li, “SwipeVLock: A supervised unlocking mechanism based on swipe behavior on smartphones,” in Lecture Notes in Computer Science (including subseries Lecture Notes in Artificial Intelligence and Lecture Notes in Bioinformatics). Vol. 11806. Cham, Switzerland: Springer, LNCS, pp. 140–153, 2019. [Google Scholar]
22. A. Buriro, B. Crispo, F.Del Frari, J. Klardie and K. Wrona, “ITSME: Multi-modal and unobtrusive behavioural user authentication for smartphones,” in Lecture Notes in Computer Science (including subseries Lecture Notes in Artificial Intelligence and Lecture Notes in Bioinformatics). Vol. 9551. Cham, Switzerland: Springer, pp. 45–61, 2016. [Google Scholar]
23. M. Babaeizadeh, M. Bakhtiari and M. A. Maarof, “Keystroke dynamic authentication in mobile cloud computing,” International Journal of Computer Applications, vol. 90, no. 1, pp. 975–8887, 2014. [Google Scholar]
24. A. Alzubaidi, S. Roy and J. Kalita, “A data reduction scheme for active authentication of legitimate smartphone owner using informative apps ranking,” Digital Communications and Networks, vol. 5, no. 4, pp. 205–213, 2019. [Google Scholar]
25. J. Fierrez, A. Pozo, M. Martinez-Diaz, J. Galbally and A. Morales, “Benchmarking touchscreen biometrics for mobile authentication,” IEEE Transactions on Information Forensics and Security, vol. 13, no. 11, pp. 2720–2733, 2018. [Google Scholar]
26. M. Antal, L. Z. Szabó and Z. Bokor, “Identity information revealed from mobile touch gestures,” Studia Universitatis Babes-Bolyai, Informatica, vol. 59, pp. 5–14, 2014. [Google Scholar]
27. S. Mondal and P. Bours, “Swipe gesture based continuous authentication for mobile devices,” in Int. Conf. on Biometrics (ICB’152015. Phuket, Thailand, pp. 458–465, 2015. [Google Scholar]
28. A. N. Putri, Y. D. W. Asnar and S. Akbar, “A continuous fusion authentication for android based on keystroke dynamics and touch gesture,” in Proc. of 2016 Int. Conf. on Data and Software Engineering, ICoDSE 2016, Denpasar, Indonesia, pp. 1–6, 2017. [Google Scholar]
29. M. Antal and L. Z. Szabó, “Biometric authentication based on touchscreen swipe patterns,” Procedia Technology, vol. 22, no. 1, pp. 862–869, 2016. [Google Scholar]
30. C. Shen, Y. Li, Y. Chen, X. Guan and R. A. Maxion, “Performance analysis of multi-motion sensor behavior for active smartphone authentication,” IEEE Transactions on Information Forensics and Security, vol. 11, no. 3, pp. 498–513, 2017. [Google Scholar]
31. S. Ha and S. Choi, “Convolutional neural networks for human activity recognition using multiple accelerometer and gyroscope sensors,” in Proc. of the Int. Joint Conf. on Neural Networks, Vancouver, Canada, pp. 381–388, 2016. [Google Scholar]
32. H. P. Gupta, H. S. Chudgar, S. Mukherjee, T. Dutta and K. Sharma, “A continuous hand gestures recognition technique for human-machine interaction using accelerometer and gyroscope sensors,” IEEE Sensors Journal, vol. 16, no. 16, pp. 6425–6432, 2016. [Google Scholar]
33. A. Jain and V. Kanhangad, “Human activity classification in smartphones using accelerometer and gyroscope sensors,” IEEE Sensors Journal, vol. 18, no. 3, pp. 1169–1177, 2018. [Google Scholar]
34. D. J. Gunn, K. Roy and K. Bryant, “Simulated cloud authentication based on touch dynamics with SVM,” in 2018 IEEE Sym. Series on Computational Intelligence (SSCIBangalore, India, pp. 639–644, 2018. [Google Scholar]
35. A. B. A. Ali, V. Ponnusamay and A. Sangodiah, “User behaviour-based mobile authentication system,” in Advances in Intelligent Systems and Computing. Vol. 924. Singapore, Springer, pp. 461–472, 2019. [Google Scholar]
36. J. Brownlee, “How to fix k-fold cross-validation for imbalanced classification,” 2020. [Online]. Available: https://machinelearningmastery.com/cross-validation-for-imbalanced-classification/ (Accessed: 15 Jul 2020). [Google Scholar]
37. J. Brownlee, “A gentle introduction to k-fold cross-validation,” 2019. [Online]. Available: https://machinelearningmastery.com/k-fold-cross-validation/ [Google Scholar]
38. H. He and Y. Ma, “Foundations of imbalanced learning,” in Imbalanced Learning: Foundations, Algorithms and Applications, Wiley-IEEE Press, pp. 14.[Online]. Available:https://www.wiley.com/en-us/Imbalanced+Learning%3A+Foundations%2C+Algorithms%2C+and+Applications-p-9781118074626 [Google Scholar]
39. Waikato, “Machine learning with Weka, data mining with weka,” 2015. [Online]. Available: https://www.cs.waikato.ac.nz/ml/weka/mooc/dataminingwithweka/transcripts/Transcript2-5.txt (Accessed: 07 Mar 2020). [Google Scholar]
40. G. Muhammad, M. Masud, S. Amin, R. Alrobaea and M. F. Alhamid, “Automatic seizure detection in a mobile multimedia framework,” IEEE Access, vol. 6, no. 1, pp. 45372–45383, 2018. [Google Scholar]
41. S. Wang, J. Yuan and J. Wen, “Adaptive phone orientation method for continuous authentication based on mobile motion sensors,” in Proc.—Int. Conf. on Tools with Artificial Intelligence, ICTAI, Portland, OR, USA, pp. 1623–1627, 2019. [Google Scholar]
42. M. Masud, G. Muhammad, M. S. Hossain, H. Alhumyani and S. S. Alshamrani, “Light deep model for pulmonary nodule detection from CT scan images for mobile devices,” Wireless Communications and Mobile Computing, vol. 2020, pp. 1–8, 2020. [Google Scholar]
43. M. Abuhamad, T. Abuhmed, D. Mohaisen and D. Nyang, “AUToSen: Deep-learning-based implicit continuous authentication using smartphone sensors,” IEEE Internet of Things Journal, vol. 7, no. 6, pp. 5008–5020, 2020. [Google Scholar]
44. N. Zaman and F. A. Almusalli, “Review: Smartphones power consumption & energy saving techniques,” in 2017 Int. Conf. on Innovations in Electrical Engineering and Computational Technologies (ICIEECTKarachi, Pakistan, pp. 1–7, 2017. [Google Scholar]
45. N. Z. Jhanjhi, F. A. Almusalli, S. N. Brohi and A. Abdullah, “Middleware power saving scheme for mobile applications,” in 2018 Fourth Int. Conf. on Advances in Computing, Communication & Automation (ICACCASubang Jaya, Malaysia, pp. 1–6, 2018. [Google Scholar]
 | This work is licensed under a Creative Commons Attribution 4.0 International License, which permits unrestricted use, distribution, and reproduction in any medium, provided the original work is properly cited. |