DOI:10.32604/iasc.2021.016805
| Intelligent Automation & Soft Computing DOI:10.32604/iasc.2021.016805 | |
| Article |
Forecast of LSTM-XGBoost in Stock Price Based on Bayesian Optimization
1Macau University of Science and Technology, Taipa, 999078, Macau
2Guangdong University of Science and Technology, Dongguan, 523083, China
3Guangdong University of Technology, Guangzhou, 510006, China
4Ankang Vocational Technical College, Ankang, 725000, China
*Corresponding Author: Tian Liwei. Email: 656453927@qq.com
Received: 12 January 2021; Accepted: 14 April 2021
Abstract: The prediction of the “ups and downs” of stock market prices is one of the important undertakings of the financial market. Since accurate prediction helps foster considerable economic benefits, stock market prediction has attracted significant interest by both investors and researchers. Efforts into building an accurate, stable and effective model to predict stock prices’ movements have been proliferating at a fast pace, to meet such a challenge. Firstly, this paper uses a correlation analysis to analyze the attributes of a stock dataset, processing missing values, determining the data attributes to be retained data, then divide it in a training set and a testing set. Then, the LSTM model is subsequently used to predict the retained attributes after the analysis and retention of prediction results to construct a new testing set. At the same time, the Bo-XGBoost model based on XGBoost is used to train the original training set. It uses Bayesian calculation to optimize the parameters which are proved to be difficult to find the best solution in the XGBoost model. Finally, the LSTM-BO-XGBoost model proposed in this paper is applied to “ES=F”, “YM=F”, “CL=F”, “^TNX”, “^N225”, “NQ=F”, “AAPL”, “GC= F”, “JPY=X” and “SI=F” rates with 10 stocks in the forecast and evaluated by four evaluation indexes: root mean square error (RMSE), average absolute error (MAE), accuracy rate, and F1-score. It is found that the LSTM-BO-XGBoost model proposed in this paper performs better than LSTM in stock price prediction. In order to further evaluate the performance of the algorithm, the LSTM-BO-XGBoost mode is compared with the single LSTM network model and RNN network model, the LSTM-BO-XGBoost hybrid model. The results show that the LSTM-BO-XGBoost mode has high performance, stability and feasibility than the others.
Keywords: LSTM; XGBoost; Bayesian optimization; stock price fluctuation forecast; time series data
The accurate prediction of the rise and fall of prices is one of the prominent issues associated with stock markets, which can bring substantial economic benefits. Thus, it has become the most important issue for investors and researchers alike. At the same time, the research about the construction of associated models that are accurate, stable and effective at the same time has therefore becomes a hot topic.
Since stock price prediction is feasible and has been verified by McQueen et al. [1]. using the Markov chain in 1991, many scholars have begun to construct models to predict the rise and fall of stocks. In the following decades, scholars mostly used a single model to predict stock prices. As the single model has certain limitations in solving complex stock time series forecasting problems, many researchers have focused on combined models or using hybrid models to solve the problem of single models with good results. Therefore, the combination of different forecasting models has attracted researches from many fields, especially financial time series forecasting. To date, different stock price prediction technologies have been developed. Among them, time series predictions, such as integrated learning, autoregressive integrated moving average (ARIMA), support vector machine (SVM), BP neural networks and long and short-term memory neural networks (LSTM) are widely used in the construction of stock price prediction models [2–6].
In 2005, Pai et al. [7] proposed a hybrid method using the ARIMA and SVM models to predict stock prices. Therein, actual stock price datasets were selected to test the prediction accuracy of the proposed model, and the results of the calculation test were excellent. In 2009, Tsai et al. [8] combined neural networks with decision trees to establish a stock price prediction model. Experimental results showed that the prediction accuracy of the hybrid model was significantly higher than that of the single ANN and DT model. In 2011, Yeh [9] developed a two-stage multi-core learning algorithm by combining sequence minimum optimization and gradient projection methods. Through this algorithm, the advantages of different hyperparameter settings could be integrated and the overall performance of the system could be improved. Experiments showed that this method was superior to other methods. In 2013, Kazem et al. [10] proposed a stock market price prediction model based on chaotic mapping, firefly algorithm and support vector regression (SVR). Experiments demonstrated that the model had certain advantages. Based on the research of the above scholars, it is not difficult to see that most of the previous model predictions have concentrated on single or mixed models such as ARIMA, SVM and artificial neural networks. Since 2017, Selvin et al. [11] have used three different deep learning architectures to predict the prices of NSE listed companies, and many scholars have focused on long and short-term memory neural network (LSTM) stock predictions. In 2018, Kim et al. [12] proposed a new hybrid long-term short-term memory (LSTM) model to predict stock price fluctuations. Experimental results proved that the GEW-LSTM model was better than E-DFN (a model combining EGARCH and DFN and the best of existing models) model in comparing various indicators. In the same year, Wang et al. [13] established a BP neural network model and an LSTM model. Consequently, experimental comparisons found the prediction results of the LSTM model to be more accurate. Through the comparative study of stock price time series trend prediction methods, Li et al. [14] established that the performance of deep learning models MLP, RNN, and LSTM was better than other models in terms of accuracy indication. In 2019, Ning et al. [15] proposed the hybrid network model LSTM-Adaboost, and experimental results showed that the stock price prediction accuracy of this model had been improved. Torralba et al. [16] proposed a deep learning LSTM trend prediction model for stock prices for stock price prediction in the same year. In 2020, Qiu et al. [17] used wavelet transform to denoise historical stock data based on LSTM and attention mechanism, extract and train its features, and establish a stock price prediction model. Experimental results proved that the coefficient of determination of the attention-based LSTM model was higher than 0.94, and the mean square error of the model was lower than 0.05. Li [18] proposed a closing price prediction method based on feature selection (FS) and long short-term memory (LSTM) algorithms. The empirical results indicated that, compared with the LSTM model, the FS-LSTM combined model improved the accuracy of prediction and reduced the error between the true value and the predicted value in the stock price prediction. Doshi et al. [19] proposed a data-driven method to optimize the choice of window length and multi-step prediction length. The performance of this model for certain evaluation indicators was shown to be improved. Lee et al. [20] used long-term short-term memory (LSTM) to build a deep network stock estimation model, and conducted experiments on the open data of the Taiwan Stock Exchange from 2019/01 to 2019/10. Experimental results demonstrated that the LSTM model achieved an average accuracy of 75% on the TWSE 0050 ETF.
In this paper, we propose an LSTM and Bayesian optimized XGBoost hybrid model (LSTM-BO-XGBoost) based on correlation analysis to solve the problem of stock price fluctuation prediction. The proposed LSTM-BO-XGBoost hybrid model first uses correlation analysis to analyze the attributes of the stock dataset after missing value processing. Considering the analysis results, the retained data attributes are determined, and the training set and the testing set are divided. The LSTM model is then used to predict the retained attributes after analysis, and retain the prediction results to construct a new testing set. At the same time, the XGBoost model is used to train the original training set. Since the XGBoost model has many parameters and it is difficult to find the best solution, this paper uses Bayesian calculation to optimize the parameters of the XGBoost model to construct the BO-XGBoost model. Finally, the BO-XGBoost model is used to predict the new testing set. The LSTM-BO-XGBoost prediction model is employed to predict the stock price and compared with the LSTM-XGBoost hybrid model, a single LSTM network model, and the RNN network model.The results show that the better approximation ability and generalization ability of the proposed model can fit the rise and fall of stocks well and improve the prediction performance of a single LSTM model or a single XGBoost model in predicting stock prices. The stability and feasibility of the LSTM-BO-XGBoost prediction model are further assessed on 10 stock datasets.
In this section, we introduce the Long and Short-Term Memory Neural Network (LSTM), the XGBoost Model, and the Bayesian Optimization.
2.1 Long and Short-Term Memory Neural Network (LSTM)
The Long Short-Term Memory Networks (LSTM), as a special type of RNN, were proposed by Hochreiter and Schmidhuber in 1997 and improved by Alex Graves in 2012, which enhancement has been widely promoted. As a variant of Recurrent Neural Network (RNN) [21], LSTM as a more popular neural network is a good solution to the problem that RNN cannot handle long-distance dependence. The hidden layer of the original RNN has two states, including a state that is very sensitive to short-term input data and a cell state that stores long-term data changes. The LSTM has three inputs: the current input value of the network, the previous output value, and the unit state; it also includes a tanh activation layer. The specific structure of LSTM is shown in Fig. 1.

Figure 1: LSTM structure diagram
The LSTM includes input gate, forgetting gate and output gate. The forgetting gate calculates the value of ft by σ function, as shown in Eq. (1).
where ft represents the forgetting rate, σ is the Sigmoid activation function, Wf represents the weight of f1, ht-1 is the output value of the previous time, and bf is the offset of ft .
After determining the forgetting rate ft, the input gate defines the information to be updated through the sigmoid layer, and tanh function generates a new vector Ĉt, as shown in Eqs. (2) and (3).
In the above Formulas, it is the forgetting rate, Wi, WC and bi, bC are the weight and bias of each layer, respectively, and tanh is the activation function
where Ct is the unit state value of the current hidden layer, and Ct-1 is the unit state value of the previous hidden layer.
The cell state is processed by tanh function to get a value between [–1,1], which is multiplied by the output of sigmoid layer, and the result is the final output.
where ot is the forgetting rate, Wo and bo are the weight and bias of the output gate, respectively, and ht represents the output of the hidden layer.
Extreme Gradient Boosting (XGBoost) is a machine learning tool based on massively parallel Gradient Boosting as an enhanced version of the GB method, which is an algorithm based on residual optimization designed to achieve high efficiency, flexibility and portability [22]. XGBoost provides parallel boosting trees and establishes K regression trees, so that the predicted value of the tree group is close to the true value. It has strong generalization ability, and can quickly and accurately solve many scientific data problems. XGBoost is an improved algorithm of GBDT, and its core is the value of optimizing the objective function. The objective function optimization process is detailed below.
The objective function of XGBoost can be expressed as Eq. (7):
If Taylor expansion is used to approximate the objective function, the original objective function can be written as Eq. (8):
Eq. (10) is defined as,
and introduced into Eq. (9) to obtain Eq. (11),
where
According to the optimal results of Eqs. (10) and (11), the optimal decision tree node is found, and the calculation and prediction are subsequently carried out. Fig. 2 shows the use of objective function to evaluate the performance of the decision tree.

Figure 2: Application of objective function to evaluate decision tree performance
Since hyperparameter selection in machine learning has always been a challenging task, most of the hyperparameters were manually adjusted in the past. In order to solve this problem, the means to find the optimal parameters of the model has also become a hot topic for many scholars. Bayesian optimization (BOian Optimization, BO) is an efficient method for the global optimization of black box functions with noisy output. Since Bayesian optimization can find a better hyperparameter combination in a shorter period of time, it is highly popular among scholars. When BO performs parameter optimization, two components are used: surrogate model and acquisition function. The purpose of the surrogate model is to approximate the current objective function, and the acquisition function is the next most important when the best possible input is found for the current data. The specific BO parameter optimization framework is shown in Tab. 1 [23]. In each iteration of Bayesian optimization, firstly the acquisition function is maximized under the “prior” of the proxy model. Then the new evaluation points are passed into the system as input and new outputs are obtained to update the probabilistic proxy model.

In this paper, the LSTM-BO-XGBoost model which is combination of correlation analysis, LSTM, and Bayesian optimization of the XGBoost is proposed to solve the problem of stock price fluctuation prediction. Firstly, the proposed LSTM-BO-XGBoost hybrid model analyzes the “Open”, “High”, “Low”, “Close”, “Volume”, “Adj Close” data features, and the time information is added to the stock dataset after processing the missing values. Next, the correlation between the obtained information and the stock fluctuations is analyzed, the reserved stock attributes are determined as “Open”, “High”, “Low”, “Close” and “Adj Close” according to the analysis results, and the training and testing set are split. The LSTM model is then used to train the attributes of the resulting training set, then executed to make the respective predictions and retaining the prediction results to construct a new testing set. At the same time, the original training set is trained by using the parameters of the XGBoost model. Due to the high number of parameters in the XGBoost model, finding the optimal solution is a difficult task. In order to solve this problem, this paper uses the Bayesian optimization algorithm to optimize the hyperparameters of the XGBoost model and to construct the BO-XGBoost model. Finally, the BO-XGBoost model is used to predict with the new testing set. The specific flow chart of the model is shown in Fig. 3.

Figure 3: Construction of LSTM-XGBoost model
The construction process of LSTM-Bo-XGBoost model is as follows:
1. Acquisition of historical data of stock indexes and processing of missing values;
2. The “Date” attribute in the data set is decomposed into three attributes, “Year”, “Month” and “Weekday”, which are referred to as the time component;
3. Analyze the correlation between the six attributes of “Open”, “High”, “Low”, “Close”, “Volume”, and “Adj Close” in the stock data set, as well as the time information after conversion and the stock rise and fall;
4. The analyzed data were sorted out to remove the attributes with Low correlation with the rise and fall of the stock, and finally the five attributes of “Open”, “High”, “Low”, “Close” and “Adj Close” were retained.
5. The LSTM method in the Keras package is adopted to implement the LSTM model. The attributes of “Open”, “High”, “Low”, “Close” and “Adj Close” in the stock historical data set are trained respectively to construct the LSTM stock price prediction model, in which units = 128 and batch_size = 64 in the LSTM model;
6. The LSTM stock price prediction model is used to predict the attributes of “Open”, “High”, “Low”, “Close” and “Adj Close”;
7. The predicted results of “Open”, “High”, “Low”, “Close” and “Adj Close” were reorganized to construct the “text” test set.
8. XGBRegressor method in Sklearn package is adopted to realize XGBoost algorithm and build XGBoost stock price prediction model;
9. The parameters of XGBoost model were optimized by using Bayesian optimization algorithm. The attributes of “Open”, “High”, “Low”, “Close” and “Adj Close” in the stock historical data set were trained to build the BO-XGBoost stock price prediction model.
10. The BO-XGBoost stock price prediction model is used to forecast the reconstructed data set “text” after the LSTM prediction;
11. Compare the difference between the real value and the predicted value, and judge the performance of LSTM-BO-XGBoost model in predicting the rise and fall of stocks.
The experiment is carried out using Intel i7 3.1GHz dual-core 4-thread CPU and Windows 8 operating system. The simulation platform is pycharm, and the python language is used for programming with the sklearn, pandas, numpy, keras, matplotlib, bayes_opt and other packages. The experimental dataset is downloaded from https://finance.yahoo.com, randomly select 10 stocks from January 2002 to August 2020, which are “ES=F”, “YM=F”, “CL=F”, “^TNX”, “^N225”, “NQ=F”, “AAPL”, “GC=F”, “JPY=X” and “SI=F”, and get “Open”, “High”, “Low”, “Close”, “Volume”, “Adj Close” and “Date time series” data from them. Among them, 80% of the data in each stock data are used as the training set, and 20% of the data are used as the testing set. The fluctuations of the 10 stock datasets are shown in Fig. 4.


Figure 4: Variations (“ups and downs”) of 10 stocks
Root mean square error (RMSE), mean absolute error (MAE), determination coefficient R2 and Accuracy are used to evaluate the performance of the stock prediction model.
(1) Root Mean Square Error (RMSE) is the Square of the deviation between the observed value and the true value to judge the degree of fit of the model. The smaller the value, the better the prediction performance of the model. The calculation formula is shown in Eq. (12).
where y is the predicted true value and ŷ is the predicted value.
(2) Mean absolute error (MAE), also called the average absolute deviation, can well reflect the actual situation of the error between the predicted value and the true value. The calculation formula is shown in Eq. (13).
(3) Accuracy, which indicates the percentage of the number of correct predictions to the total number of samples in the prediction results. For a given stock test data set, the ratio of the number of samples correctly classified by the fluctuation classifier to the total number of samples.
TP and FP are the correct and incorrect numbers of predicting the stock price rise, and TN and FN are the correct and incorrect numbers of predicting the stock price fall.
(4) f1-score is a comprehensive evaluation index of the equilibrium accuracy (pre) and recall rate (recall) of the classification problem. The maximum is 1 and the minimum is 0.
Firstly, the correlation analysis among the attributes of “Open”, “High”, “Low”, “Close”, “Volume”, “Adj Close”, “converted time information” and “stock ups and downs” in the data set of 10 stocks and the stock ups and downs was conducted. Then, the attributes with little correlation are deleted respectively through the display of heat map. The heat chart of correlation analysis of 10 stocks are shown in Fig. 5.

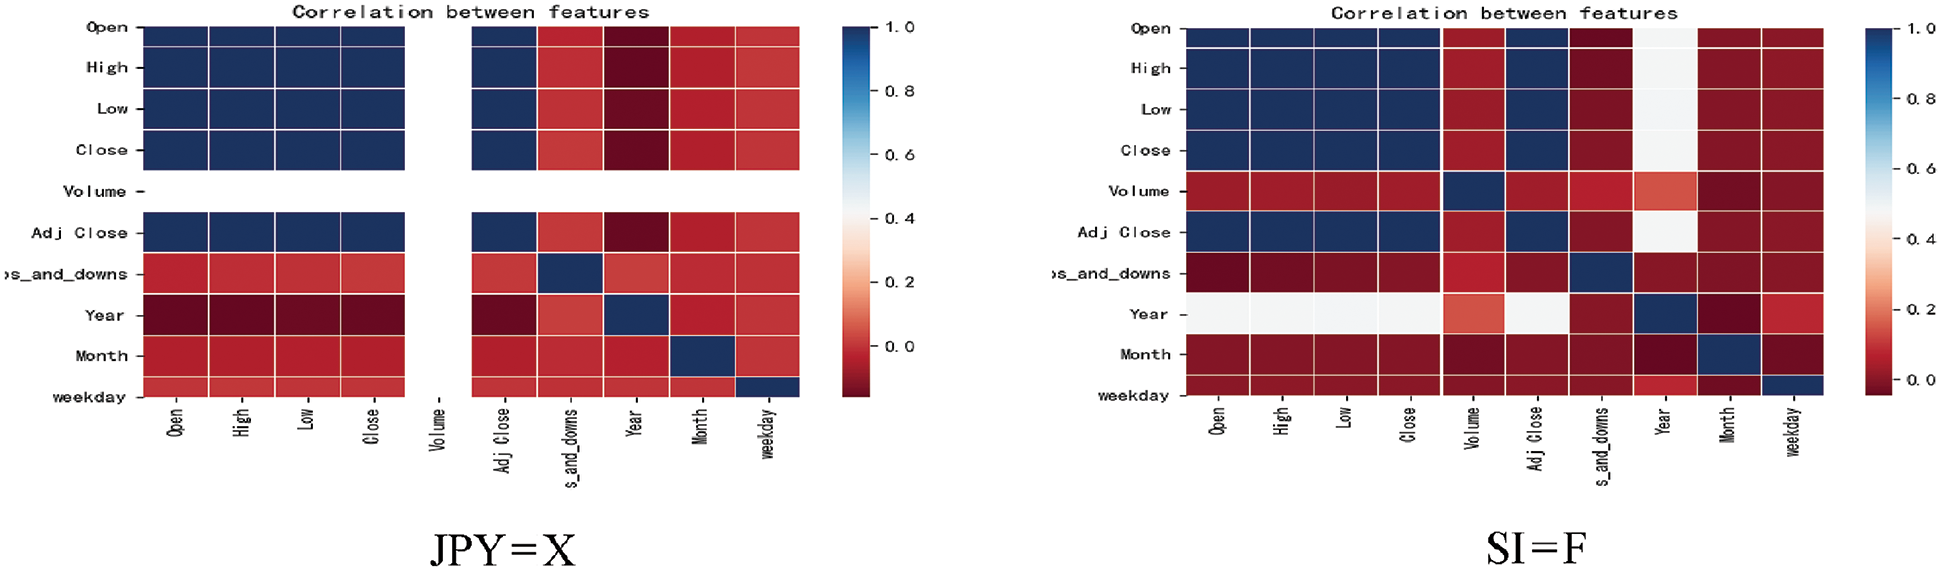
Figure 5: Heat chart of correlation analysis of 10 stocks
It is clearly seen in Fig. 5, that the attributes of “Year”, “Month” and “weekday” in the 10 stocks have the lowest correlation with the attribute of “ups_and_downs” in most of the stocks. Therefore, the three attributes of “Year”, “Month” and “weekday” are removed. Due to the inhibitory effect of “Volume” attribute on the model in the process of model training, the “Volume” attribute was also removed in this paper, and five attributes of “Open”, “High”, “Low”, “Close” and “Adj Close” were retained for the final data training and prediction.
After the prediction attributes of each stock are determined, LSTM model is used to train and predict each attribute. The sliding window of the five attributes of “Open”, “High”, “Low”, “Close” and “adj. Close” is set to 1, which corresponds to single-step prediction, and the epochs is set to 1, and the batch_size is set to 64. The XGBoost parameters are optimized by the Bayesian algorithm with five-fold cross-validation and cv=5. In the case of 25 iterations of the Bayesian algorithm, the BO-XGBoost model is built by finding the optimal solutions of nine parameters of XGBoost model, including “n_estimators”, “max_depth”, “learning_rate”, “min_child_weight”, “reg_alpha”, “reg_lambda”, “colsample_bytree”, “min_child_sample” and “n_jobs”. The training set of the BO-XGBoost model uses data from the top 80% of the 10 stocks. The BO-XGBoost trained model was saved, and the prediction results of each attribute of the LSTM model were integrated with the time attribute to form the test training set. The BO-XGBoost trained model is used to predict the new test set, and the final prediction results of the stock rise and fall are obtained. Taking the stock rise and fall prediction of “ES=F” as an example, the experimental comparison data of the LSTM-BO-XGBoost model, LSTM-XGBoost model, LSTM and RNN models in the evaluation indexes RMSE, MAE, Accuracy and f1_score are shown in Fig. 6 and Tab. 2.

Figure 6: Comparison of RMSE, MAE, Accuracy and f1_score of each model

Fig. 6 and Tab. 2 respectively show the average values of RMSE, MAE, Accuracy and f1_score of four models of LSTM-BO-XGBoost, LSTM-XGBoost, LSTM and RNN after 30 times of training. It is clear from Tab. 2 that the Accuracy and f1_score of the LSTM-BO-XGBoost model are 8% and 20% higher, respectively, than those of the single LSTM model.
Through the experimental comparison of 10 stock rise and fall predictions, “ES=F”, “YM=F”, “CL=F”, “TNX”, “N225”, “NQ=F”, “AAPL”, “GC=F”, “JPY=X” and “SI=F”, it is not difficult to find that the LSTM-BO-XGBoost model is more stable and efficient than the LSTM-XGBoost model, the single LSTM model and the RNN model which performs well in stock price prediction. Then it is verified that the LSTM-BO-XGBoost model proposed in this paper has certain feasibility and stability in predicting the trend of stock rise and fall.
In this paper, a hybrid model (LSTM-BO-XGBoost) based on the correlation analysis of LSTM and XGBoost enhanced by Bayesian optimization was proposed to solve the challenge of stock price forecast. The resulting LSTM-BO-XGBoost hybrid model firstly uses correlation analysis to assess the attributes of the stock data set after missing value processing. The reserved data attributes are determined based on the analysis results, and the training set and testing set are divided. At the same time, the XGBoost model is used to train the original training set. Since there are many parameters in the XGBoost model, it makes it difficult to find the optimal solution. Therefore, this paper uses Bayesian algorithm to optimize these parameters and construct the BO-XGBoost model. Finally, the BO-XGBoost model is used to predict the new testing set. The proposeed LSTM-BO-XGBoost forecasting model is used to forecast stock prices, and compared with the LSTM-XGBoost mixed model, single LSTM network model and RNN network model.The results show that the proposed model has better approximation ability and generalization ability in the stock price forecast, can fit the rise and fall of the stocks well, and improve the single LSTM model or single XGBoost prediction performance of boost model in predicting stock prices. The performance of the model is verified by the experimental comparison of different models in predicting variations in “ES=F”, “YM=F”, “CL=F”, “^TNX”, “^N225”, “NQ=F”, “AAPL”, “GC=F”, “JPY=X” and “SI=F” rates, and is evaluated by four indexs including root mean square error RMSE, average absolute error MAE, accuracy and f1_score for 10 stocks. It is found that the LSTM-BO-XGBoost model has more stable and good performance in the prediction of 10 stocks than the others.The overall prediction performance, however, needs to be further improved. As a number of stocks have a certain noise impact, this should be considered on stock price variations at a later stage of research to improve the performance of the model for stock price prediction. This model and its future improvements may constitute a valuable reference for people to master the prediction of rise and fall of stock prices.
Funding Statement: This paper is funded by the following fund projects: General Social Development Project in Dongguan City in 2020: Research on the Blockchain Fragmentation Mechanism Based on Merkel Tree (No. 2020507154401), the author is supported by Tian L.W., website: http://dgstb.dg.gov.cn/xxgk/ztzl/kjglhxmjfxxgk/kjjhgl/lxxx/content/post_3193977.html. Cultivation Plan for Major Scientific Research Achievements of Universities: Research on the Blockchain Fragmentation Mechanism Based on Merkel Tree (GKY-2019CQYJ-13), supported by Tian L.W., website: http://ky.gdust.cn/readArticle.aspx?aid=840. Guangdong Province Basic and Applied Basic Research Fund Project: Research on Differential Evolution Algorithm Based on Adaptability Landscape and Reinforcement Learning and Its Application in Intelligent Manufacturing Optimization (NO.2020A1515010784), the author is Li K.S., the participant is Tian L.W., website: http://www.gdust.edu.cn/jsjx/jsjx/20200414/4100.html.
Conflicts of Interest: The authors declare that they have no conflicts of interest to report regarding the present study.
1. G. Mcqueen and S. Thorley, “Are stock returns predictable? A test using Markov Chains,” Journal of Finance, vol. 46, no. 1, pp. 239–263, 1991. [Google Scholar]
2. B. Gu, W. Xiong and Z. Bai, “Human action recognition based on supervised class-specific dictionary learning with deep convolutional neural network features,” Computers Materials & Continua, vol. 63, no. 1, pp. 243–262, 2020. [Google Scholar]
3. Y. Cai, Z. Y. Song, G. Sun, J. Wang, Z. Y. Guo et al., “On visualization analysis of stock data,” Journal on Big Data, vol. 1, no. 3, pp. 135–144, 2019. [Google Scholar]
4. A. Zhang, B. Li, W. Wang, S. Wan and W. Chen, “MII: A novel text classification model combining deep active learning with BERT,” Computers Materials & Continua, vol. 63, no. 3, pp. 1499–1514, 2020. [Google Scholar]
5. R. U. Maheswari and R. Umamaheswari, “Wind turbine drivetrain expert fault detection system: Multivariate empirical mode decomposition based multi-sensor fusion with Bayesian learning classification,” Intelligent Automation & Soft Computing, vol. 26, no. 3, pp. 479–488, 2020. [Google Scholar]
6. O. B. Sezer and A. M. Ozbayoglu, “Financial trading model with stock bar chart image time series with deep convolutional neural networks,” Intelligent Automation & Soft Computing, vol. 26, no. 2, pp. 323–334, 2020. [Google Scholar]
7. P. F. Pai and C. S. Lin, “A hybrid ARIMA and support vector machines model in stock price forecasting,” Omega, vol. 33, no. 6, pp. 497–505, 2005. [Google Scholar]
8. C. F. Tsai and S. P. Wang, “Stock price forecasting by hybrid machine learning techniques,” Lecture Notes in Engineering & Computer Science, vol. 1, no. 755, pp. 60–65, 2009. [Google Scholar]
9. C. Y. Yeh, C. W. Huang and S. J. Lee, “A multiple-kernel support vector regression approach for stock market price forecasting,” Expert Systems with Applications, vol. 38, no. 3, pp. 2177–2186, 2011. [Google Scholar]
10. A. Kazem, E. Sharifi and F. K. Hussain, “Support vector regression with chaos-based firefly algorithm for stock market price forecasting,” Applied Soft Computing Journal, vol. 13, no. 2, pp. 947–958, 2013. [Google Scholar]
11. S. Selvin, R. Vinayakumar and E. A. Gopalakrishnan, “Stock price prediction using LSTM, RNN and CNN-sliding window model,” in Proc. ICAC, 2017. [Google Scholar]
12. H. Y. Kim and C. H. Won, “Forecasting the volatility of stock price index: A hybrid model integrating LSTM with multiple GARCH-type models,” Expert Systems with Applications, vol. 103, no. 8, pp. 25–37, 2018. [Google Scholar]
13. Y. F. Wang, Y. Liu and M. Wang, “LSTM model optimization on stock price forecasting,” in Proc. DCABES, IEEE Computer Society, 2018. [Google Scholar]
14. W. Li and J. Liao, “A comparative study on trend forecasting approach for stock price time series,” in Proc. ASID, IEEE, 2018. [Google Scholar]
15. Y. B. Ning and Y. J. Zhang, “LSTM-Adaboost’s stock price forecasting model,” Journal of University of Science and Technology, vol. 42, no. 5, pp. 383–388, 2019. [Google Scholar]
16. E. M. Torralba, “Development of a deep learning-LSTM trend prediction model of stock prices,” in Proc. of the 2019 Int. Conf. on Management Science and Industrial Engineering, MSIT, 2019. [Google Scholar]
17. J. Y. Qiu, B. Wang and C. Zhou, “Forecasting stock prices with long-short term memory neural network based on attention mechanism,” PLoS One, vol. 15, no. 1, pp. 117365–117376, 2020. [Google Scholar]
18. H. Li, J. Hua and J. Li, “Stock forecasting model FS-LSTM based on the 5G internet of things,” Wireless Communications and Mobile Computing, vol. 2020, no. 6, pp. 1–7, 2020. [Google Scholar]
19. A. Doshi, A. Issa and P. Sachdeva, “Deep stock predictions,” ArXiv, abs/2006.04992, 2020. [Google Scholar]
20. M. C. Lee, J. S. Liao and S. C. Yeh, “Forecasting the short-term price trend of Taiwan stocks with deep neural network,” in 2020 the 11th Int. Conf. on E-Education, E-Business, IC4E, 2020. [Google Scholar]
21. Y. Miao, M. Gowayyed and F. Metze, “EESEN: End-to-end speech recognition using deep RNN models and WFST-based decoding,” in ASRU. IEEE, pp. 167–174, 2015. [Google Scholar]
22. T. Chen, H. Tong and M. Benesty, “XGBoost: Extreme Gradient Boosting,” R package version 0.4-2, vol. 1, no. 4, pp. 1–3, 2016. [Google Scholar]
23. B. Shahriari, K. Swersky, Z. Y. Wang, R. PAdams and N. D. Freitas, “Taking the human out of the loop: A review of BOian optimization,” in Proc. IEEE 104, pp. 148–175, 2016. [Google Scholar]
 | This work is licensed under a Creative Commons Attribution 4.0 International License, which permits unrestricted use, distribution, and reproduction in any medium, provided the original work is properly cited. |