DOI:10.32604/iasc.2021.016749
| Intelligent Automation & Soft Computing DOI:10.32604/iasc.2021.016749 | |
| Article |
A Multi-Task Network for Cardiac Magnetic Resonance Image Segmentation and Classification
1Chengdu Institute of Computer Application, University of Chinese Academy of Sciences, Chengdu, 610041, China
2School of Computer Science, Chengdu University of Information Technology, Chengdu, 610225, China
3BMSc, Department of Cardiology, West China Hospital, Sichuan University, Chengdu, 610041, China
4University of Chinese Academy of Sciences, Beijing, 100049, China
5Department of Experimental Rheumatology, Nijmegen, 6525GA, Netherlands
*Corresponding Author: Zhe Cui. Email: cuizhe@casit.com.cn
Received: 10 January 2021; Accepted: 25 February 2021
Abstract: Cardiomyopathy is a group of diseases that affect the heart and can cause serious health problems. Segmentation and classification are important for automating the clinical diagnosis and treatment planning for cardiomyopathy. However, this automation is difficult because of the poor quality of cardiac magnetic resonance (CMR) imaging data and varying dimensions caused by movement of the ventricle. To address these problems, a deep multi-task framework based on a convolutional neural network (CNN) is proposed to segment the left ventricle (LV) myocardium and classify cardiopathy simultaneously. The proposed model consists of a longitudinal encoder–decoder structure that obtains high- and low-level features at the same time. The encoder employs a feature pyramid module (FPM) and dense atrous convolution (DAC) to extract features from images with variable scales for classification. Meanwhile, the decoder leverages the subpixel layer to recover spatial information caused by downsampling in the encoder for segmentation. The approach was verified using 654 magnetic resonance images. It achieved a Dice similarity coefficient (DSC) metric of 82.14% on segmentation and a classification accuracy of 95.72%, with an area under the receiver operating characteristic curve (AUC) of 97.88%. The proposed method can aid in the segmentation of cardiac magnetic images and improve the classification accuracy of cardiopathy.
Keywords: Multi-task; cardiac magnetic resonance imaging; convolutional neural networks; image classification; semantic segmentation
Cardiomyopathy is a type of heart disease [1] that seriously threatens health and life. Radiologists use data from cardiac native T1 mapping magnetic resonance images. With the development of cardiac magnetic resonance (CMR) imaging technology, the diagnostic accuracy of heart-related diseases has improved significantly. T1 mapping is a CMR imaging technique that shows advanced clinical promise, especially in the context of diffuse fibrosis, with the potential to provide a quantitative evaluation of diffuse myocardial fibrosis [2].
Radiologists are often required to draw outlines of the epicardium, endocardium, and blood pool manually to measure the myocardial extracellular volume in clinical practice. Because this is time-consuming and error-prone manual work, a fully automatic method is proposed for producing precise segmentation masks and accurate classification predictions.
However, several challenges for automatic segmentation and classification remain: poor image quality, ambiguous boundaries, image deformation, and varying image dimensions. Numerous methods have been proposed to address these problems. Li et al. [3] provided an efficient boundary point and outlier detection method for the study of the disease characteristics. Liu et al. [4] proposed an approach to find regions of interest automatically, which is useful as a preliminary step for segmenting organs in medical image processing. Fu et al. [5] proposed a noise-resistant superpixel segmentation method for hyperspectral image segmentation. Wu et al. [6] proposed an optimized soft spatial pyramid matching method to reduce feature ambiguity to solve the image classification problem.
Machine learning has led to remarkable achievements in a wide variety of fields [7–9]. In particular, convolutional neural networks (CNNs) are a popular machine-learning method that advances the development of computer vision in the areas of semantic segmentation [10–13], image classification [14], and object detection [11,15,16].
Here, a multi-task CNN is proposed to segment the left ventricle (LV) myocardium and classify it at the same time using CMR image datasets. Specifically, the network consists of two main parts: an encoder and a decoder. In the encoder, feature pyramid modules (FPMs) are built that assemble a set of convolutions with different dilation rates to perform multi-scale feature extraction. This enables the classifier to utilize multi-scale high-level semantic information for better predictions. The decoder uses a combination of low- and high-level features to refine the segmentation results along the object boundaries. Additionally, subpixel layers are employed to upsample the segmentation mask back to the original resolution. The key contributions are as follows.
A multi-task CNN is proposed for segmenting and classifying CMR image datasets simultaneously.
• A reusable FPM was built for multi-scale feature extraction.
• An encoder–decoder structure was employed for boundary recovery.
The encoder–decoder structure addresses the loss of spatial details caused by downsampling and upsampling. In general, the purpose of the encoder is to progressively reduce the feature maps and capture higher-level features, while the decoder is used to recover spatial details gradually to produce sharper segmentation masks. This structure has been adopted in many computer vision networks, including U-Net [12] and SegNet [17]. U-Net has two parts: a contracting path similar to an encoder for capturing context by means of a compact feature map and a symmetric expanding path similar to a decoder to make precise localization possible. The decoder recovers spatial information despite the downsampling performed by the encoder.
Atrous convolution [13,18] adds another attribute to standard convolutions, called the “dilation rate,” which is a zero padding between the values in a regular kernel. A 3 × 3 kernel atrous convolution (also called “dilated convolution”) with a rate of 2 has a receptive field (RF) of the same size as a 5 × 5 regular kernel but with only nine parameters. The atrous convolution determines the variable intensity by controlling the rate and uses a small kernel size to capture large-range context information without increasing the parameter count or number of computations. It has been adopted in many modern semantic segmentation models to enlarge the receptive field and produce denser predictions. DeepLab V3 [13] uses atrous convolutions in serial or parallel to capture multi-scale information by adopting variable dilation rates. The latter resolves the problem of multi-scale object segmentation and makes significant improvements over previous DeepLab versions without DenseCRF postprocessing.
Spatial pyramid pooling [18,19] uses a set of atrous convolutions with different rates or other spatial pooling methods [20] to encode image features from coarser to finer levels. Multiple spatial bins crop multiple scale features further. For example, DeepLab V3 [13] uses four parallel atrous convolutions with different dilation rates, called “atrous spatial pyramid pooling” (ASPP). ASPP with different dilation rates effectively captures multi-scale information. As the rates increase, the field of view becomes larger, and the number of valid filter weight parameters decreases. However, in the extreme case when the rate value is close to the size of the input features, the filter cannot capture the information for the entire image, and only the center filter weight dominates, just as with a simple 1 × 1 filter. DeepLab V3 uses global average pooling on the last feature map.
2.4 Depthwise Separable Convolution
By dividing the traditional convolutional layer into depthwise and pointwise convolutions, depthwise separable convolution [14,21] reduces the computational cost and number of parameters without any decrease in network performance. This has been adopted and verified by many recent neural networks. The Xception [14] network is based entirely on depthwise separable convolution layers, assuming that the mapping of cross-channel correspondences and spatial correlations in the feature maps of the CNN can be completely decoupled.
Inspired by deconvolution, unpooling, and dilated convolution operations in some advanced models [12,14,22,23] for reconstructing spatial detail information and generating high-resolution semantic score maps, in this study, the encoder–decoder structure was adopted as the base architecture. As shown in Fig. 1, the encoder is primarily responsible for semantic information extraction, whereas the decoder is mainly responsible for spatial information recovery.
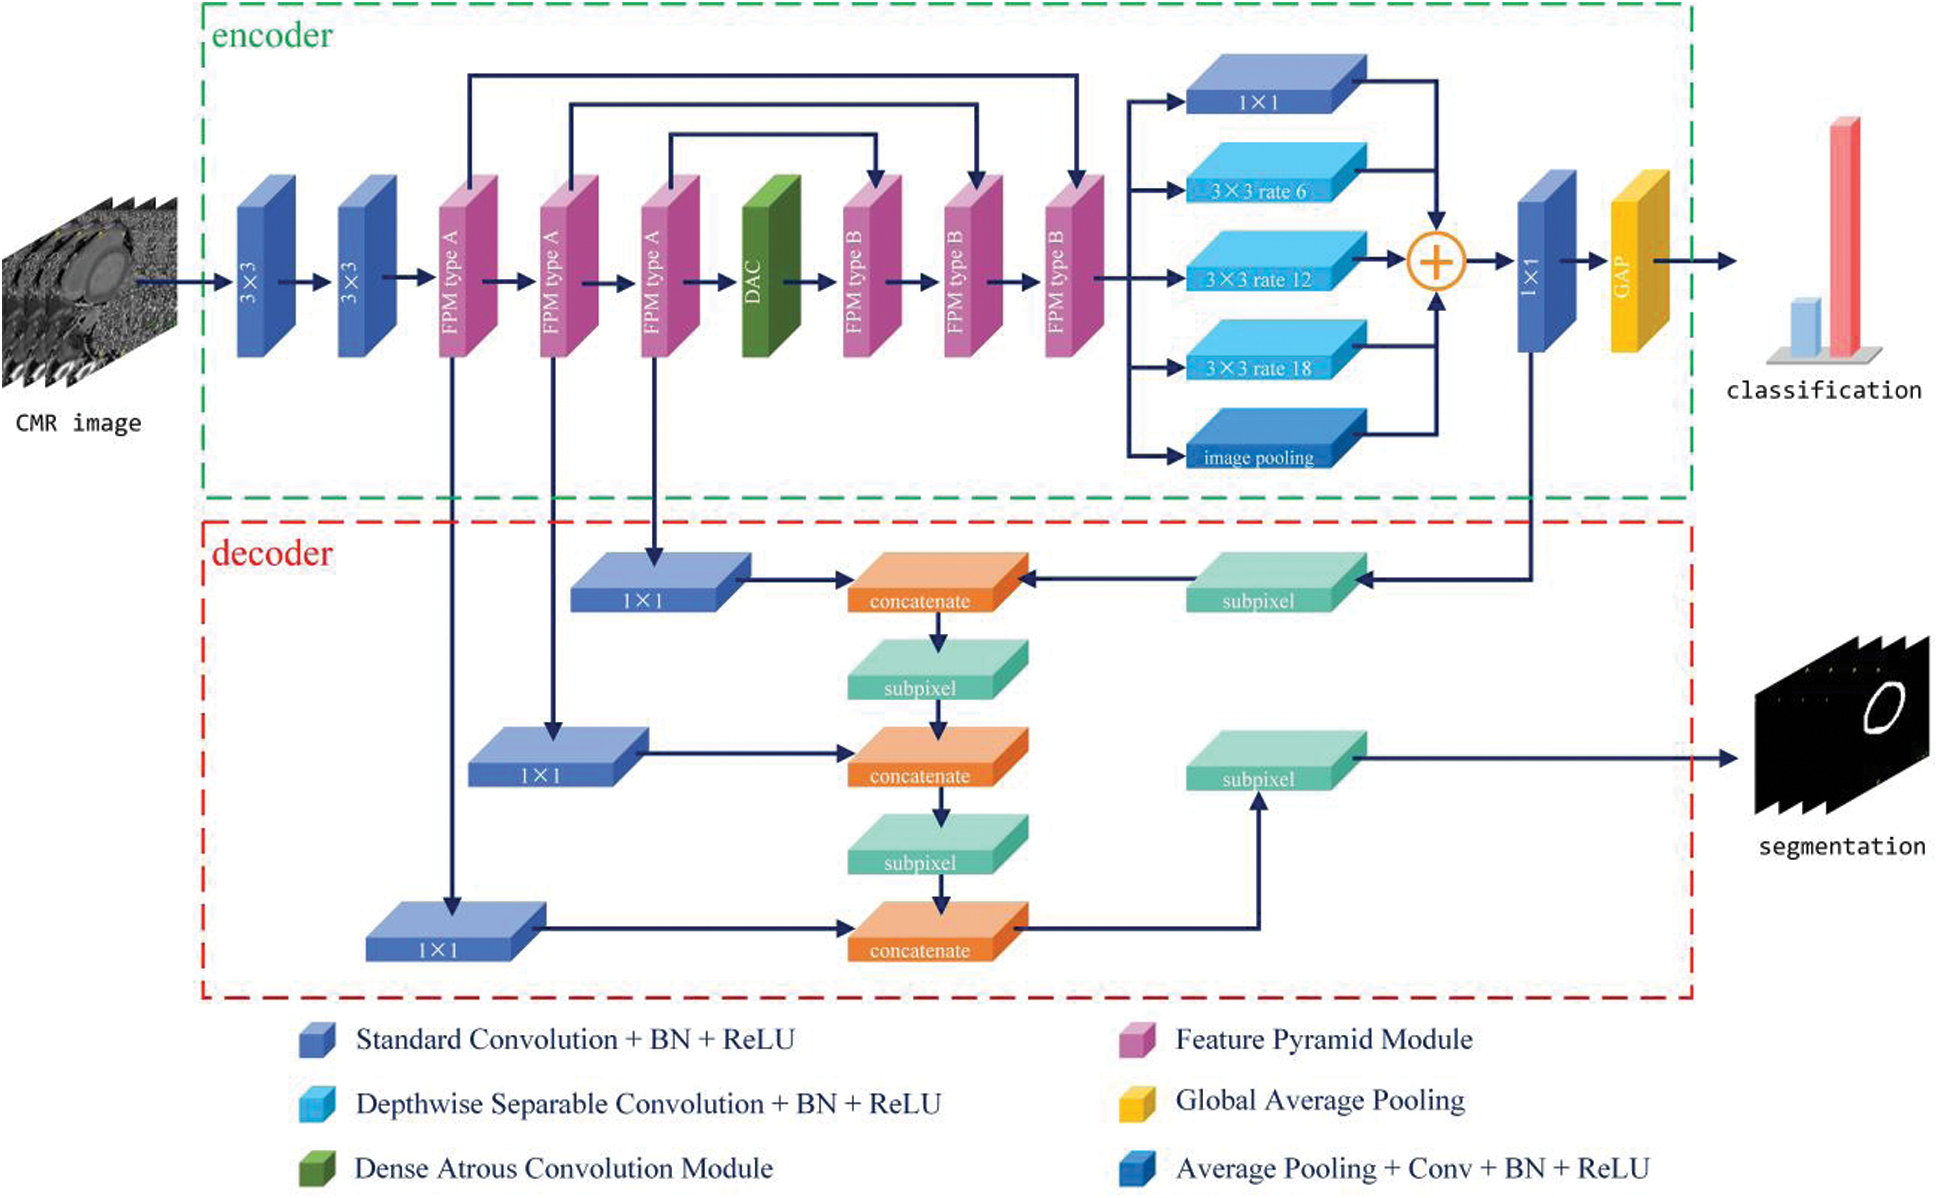
Figure 1: Schematic view of the proposed network architecture
Reducing the number of high-level semantic features benefits classification. High-level abstract features result in the model becoming resistant to small transformations, distortions, and translations in the input image. Stacking more convolution and pooling layers yields a deeper network capable of finding more abstract features. For this reason, network depth is of crucial importance in neural network design, but deeper networks increase the training difficulty. The decreasing gradients worsen performance while having nothing to do with overfitting [24]. To solve these problems, the FPM was designed as shown in Fig. 2. There are two types. Basic type A is inspired by residual connections, whereas extent type B uses more dilated convolution layers to capture richer semantic features. The residual connection connects the feature map reduced channels by means of a standard 1 × 1 convolution, and the feature map is extracted using serial atrous convolution for better results.
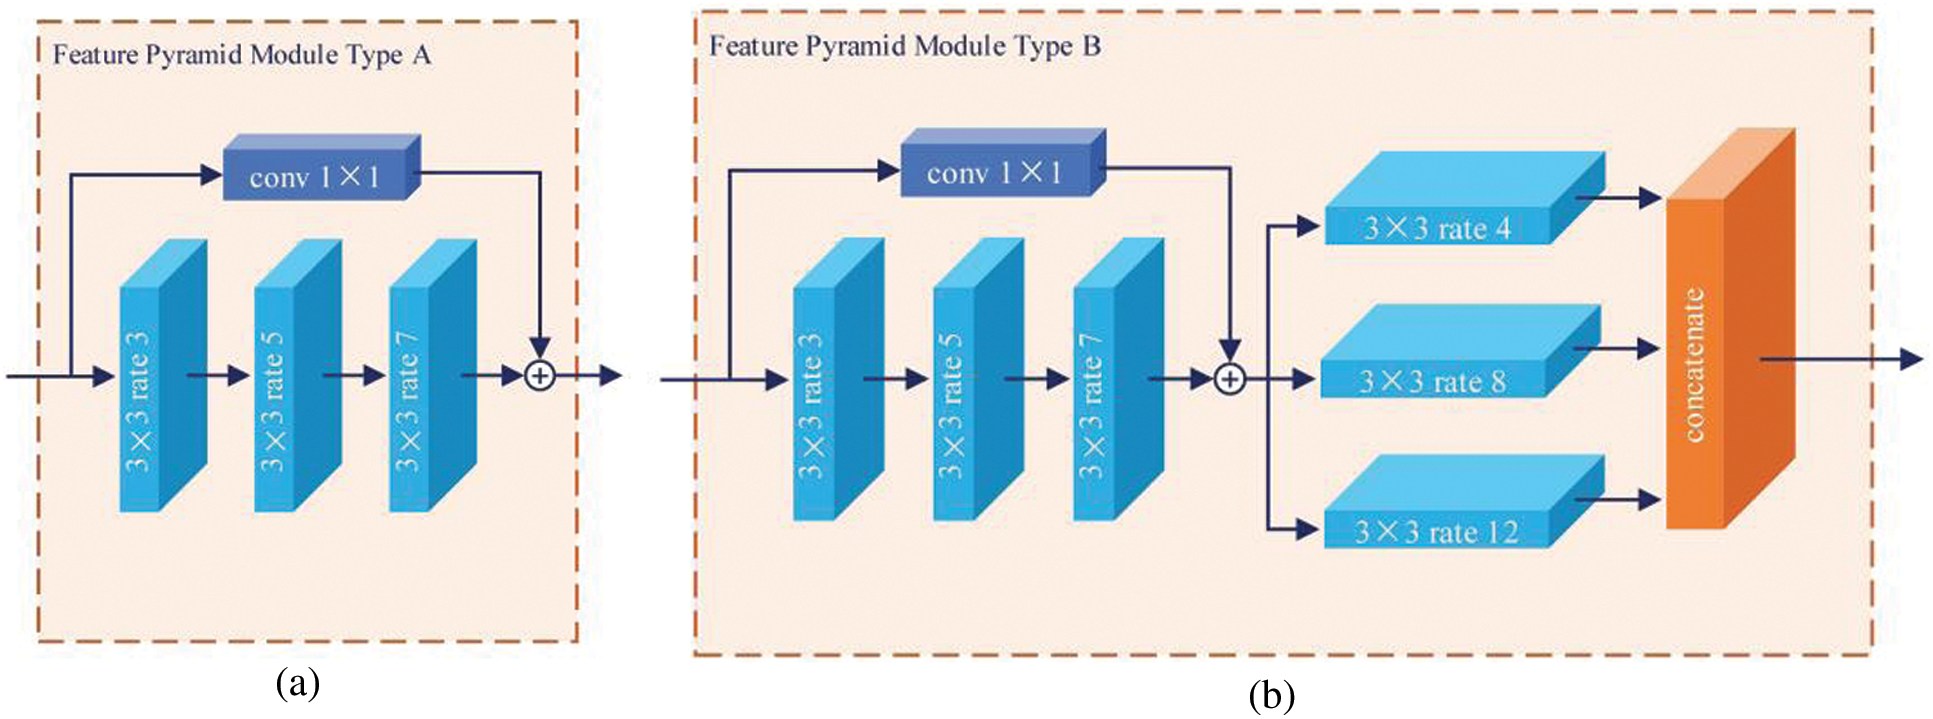
Figure 2: Two types of proposed FPM. There are serial and parallel atrous convolutional layers with different dilation rates, r = [3,5,7] and r = [4,8,12], respectively. The light blue block represents the atrous convolution. The navy blue block represents the standard 1 × 1 convolution for channel reduction, and
To obtain fewer high-level semantic features, pooling layers and convolution strides were applied repeatedly. The classifier uses abstract feature representations for classification. To produce a dense feature map, a series of serial atrous convolution layers was adopted to enlarge the field of view by controlling the dilation rate r. For an atrous convolutional layer with dilation rate r and kernel size k, the RF size can be calculated using Eq. (1):
One can acquire an even larger receptive field by stacking more convolutional layers. The receptive field of two stacked convolutional layers, with receptive field sizes of RF1 and RF2, can be calculated using Eq. (2):
In this study, atrous convolutions were chosen with different rates in different layers. The varying scales of objects are another challenge for conventional CNNs. The image pyramid extracts multi-scale feature maps by scale inputting, and the encoder–decoder structure fuses multi-scale features between the encoder and decoder. Inspired by spatial pyramid pooling and ASPP in other studies [13,14,19], in this study, a set of serial and parallel atrous convolutional layers was implemented for multi-scale feature extraction. A set of parallel atrous convolutional layers with dilation rates r = [6,12,18] and a set of serial atrous convolutional layers with dilation rates r = [3,5,7] were employed. The combination of serial and parallel atrous convolutional layers with different dilation rates captures multi-scale information without multi-scale input.
The use of serial and parallel atrous convolutional layers also provides several benefits in the form of denser feature maps, extraction of multi-scale features, and use of input images of arbitrary size.
Studies have shown that classification tasks should be resistant to transformations, such as shifts, varying scales, and rotation. Generally, most modern methods [14,24] make repeated use of pooling and convolution layers to obtain abstract semantic information. Conversely, segmentation tasks should be sensitive to transformation. The application in this study requires pixel-wise classification while retaining spatial and location information to produce semantic labels corresponding to the original image, even if the image has been shifted, rotated, or rescaled. Thus, there is a conflict between classification and segmentation tasks. To solve this problem, the encoder–decoder structure was designed as shown in Fig. 1, where the encoder and decoder perform the classification and segmentation tasks separately and synchronously.
As shown in Fig. 1, the encoder employs FPMs to encode the feature maps progressively and obtain higher semantic information. Motivated by the shortcut and skip connection mechanisms in ResNet [24] and U-Net [12], in this study, the ordinal feature map and the output feature map of the FPM type A were concatenated as input for the following FPM type B (mentioned previously). To encode the high-level features and multiple receptive fields, a dense atrous convolution (DAC) block [25] was used in the middle of the encoder. The DAC block uses four atrous convolution layer branches with dilation rate of [1,3,5] and adds the original and other features, similar to ResNet. The classifier uses the aggregated highly abstract semantic features from the end of the encoder to obtain accurate classification results.
The decoder uses skip connections, such as U-Net, to remedy the loss of detailed spatial information caused by the consecutive convolutional layers with stride and pooling operations. Features from the first three FPM blocks and the last convolutional layers are gradually fused and sampled to recover sharper object boundaries and spatial information. To increase the reduced size of the feature maps, subpixel layers [26] are used, rather than simple bilinear interpolation. In the model, the feature maps are gradually upscaled by a factor of 2 using each subpixel layer to recover the resolution from a convolution layer with a stride of 2. Finally, a high-resolution segmentation mask is rebuilt according to the original image.
An ineluctable difficulty during the segmentation of medical images is that classes are often unbalanced, having many more background pixels than the target object. In cardiac images, the myocardium tissue is expected to occupy a small and narrow area of the entire image. A model can achieve a higher accuracy by separating pixels as the majority class. Thus, a loss function that is not affected by the unbalanced nature of the classes should be used. In this work, the Jaccard (JACC) distance loss function [27] was employed, rather than the common cross-entropy (CE) loss. The JACC index, also known as “intersection over union,” is a statistic used to assess segmentation performance when ground truth is available. The JACC distance loss function is expressed as
where Y is the ground truth label map, and
For classification, the CE loss is generally employed. The CE loss can be defined as
where yi and pi are the ground truth label and model prediction score for each class i in C, respectively.
However, this scenario is a binary classification problem, making the binary CE (BCE) loss more appropriate. The BCE loss is a special case of the CE loss, where
where it is assumed that there are two classes, C1 and C2. Here,
Finally, a weighted summation is made of the segmentation task and classification losses as the total loss of the multi-task model.
where
To verify the effectiveness of the proposed method, the proposed model was applied to the segmentation of the cardiac LV myocardium and classification of cardiopathy. Then, the methods were compared using a single segmentation task and a single classification task on the same datasets.
4.1 Cardiac Magnetic Resonance Datasets
The data for the experiments were collected from one hospital and consisted of 654 2D short-axis cine native T1 mapping magnetic resonance (MR) images. The pixel spacings of the MR images ranged from 1.172 × 1.172 × 1.0 mm to 1.406 × 1.406 × 1.0 mm with original dimensions of 256 × 218 × 1 pixels. The segmentation ground truth labels of the left ventricle were provided by an experienced cardiologist defining contours manually. For classification, the categories of healthy and diseased were considered with disease classification information diagnosed by a professional cardiologist. The datasets consisted of 577 healthy and 77 diseased images.
In the experiments, k-fold cross validation was employed to evaluate the performance and compare methods using k = 5. The average (mean) score was calculated for each fold as the final score. The network was implemented using Keras with a TensorFlow back end. Batch normalization [28] and rectified linear unit activation were applied to each convolution. The RMSprop optimizer was used with a learning rate of 0.003. The cost functions of segmentation and classification were the JACC distance and binary cross-entropy with loss weights of 0.9 and 0.1, respectively. To enhance the generalization ability of the network and increase the size of datasets [29], data augmentation, including image transformation and methods based on generative adversarial networks (GANs) [30], was employed. Because of the high time costs of GAN-based methods, a simple but efficient real-time data augmentation method was applied during the training stage, rotating and shifting images randomly in each iteration. Model training and testing were performed on an NVIDIA Tesla M40 GPU over a span of 40 epochs.
To make an impartial quantitative evaluation of the effectiveness of the proposed method, the Dice similarity coefficient (DSC) and JACC similarity coefficient were adopted as evaluation indices [31]. The DSC is defined as
The JACC index is defined as
where Y and
For binary classification tasks, one can define the discrimination evaluation based on a confusion matrix, as shown in Tab. 1. From the confusion matrix, TP and TN are defined as the number of positive and negative samples that were correctly classified, i.e., true positives and true negatives. In addition, FP and FN are defined as the number of positive and negative samples incorrectly classified, i.e., false positives and false negatives.
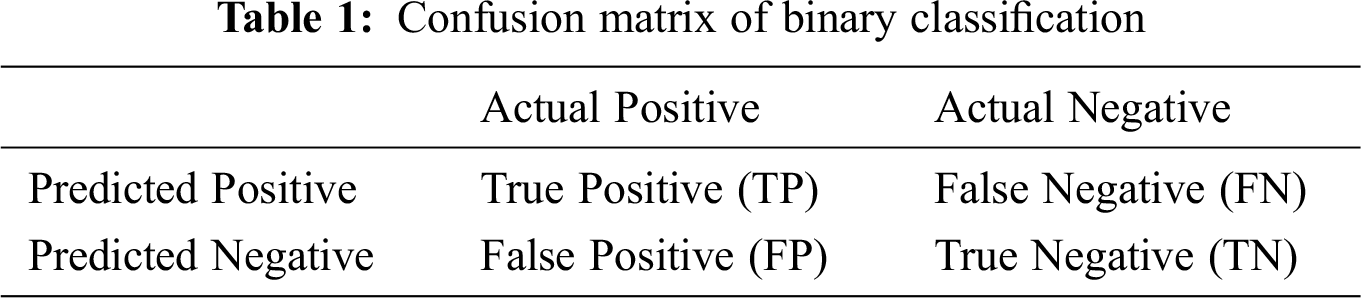
The confusion matrix is not a measure in itself, but most evaluation metrics rely on it. Accuracy is the most common classification metric and is defined as
However, the accuracy metric is misleading owing to unbalanced class data. Thus, sensitivity (or recall) and specificity were also used to evaluate the classifier. Sensitivity expresses the proportion of correctly classified positive samples:
Specificity is a measure of the proportion of negative samples that are correctly classified:
5.1 Study of Multi-Task Loss Weights
Experiments were conducted to investigate the effectiveness of various values of the multi-task loss weights. To determine the best loss weights, different segmentation and classification loss weight combinations were tested. The results are shown in Fig. 3, with the two lines representing the effect of the loss weights on the segmentation and classification results. Multi-task learning improves segmentation and classification performance. When performing a single task, with a segmentation loss weight of 1.0 and classification loss weight of 0.0 (or vice versa), the Dice value is lower than with the multitask implementation. However, as the weights increase, the score does not always increase. Thus, it is necessary to find a balance between segmentation and classification tasks. It was determined that the best performance was achieved with a segmentation loss weight of 0.9 and a classification loss weight of 0.1.
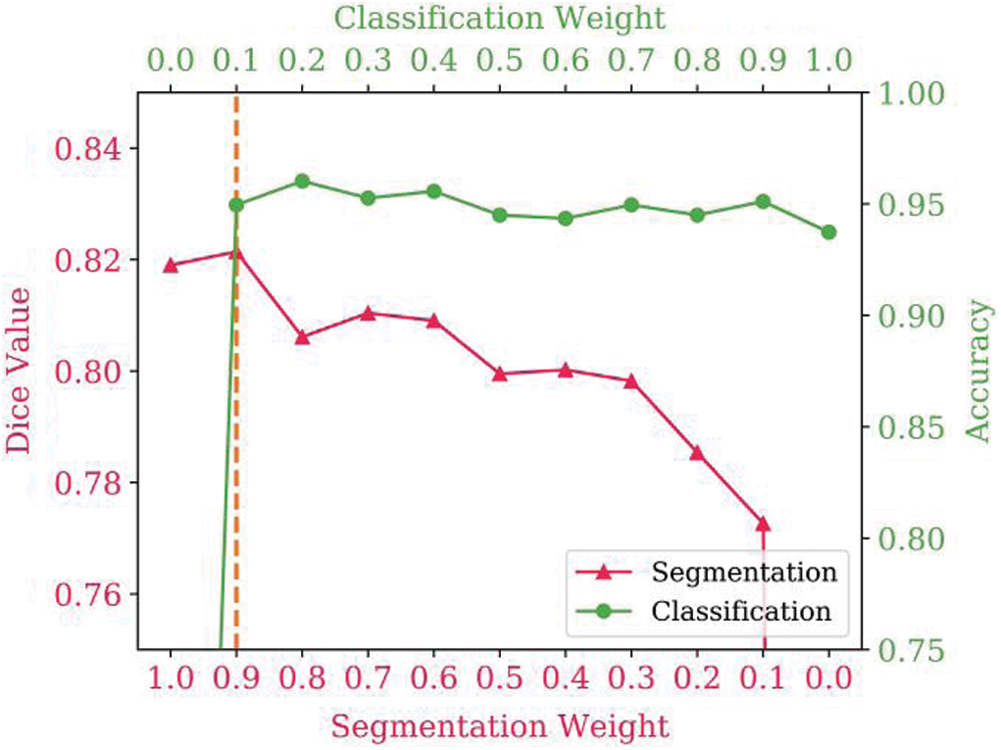
Figure 3: Influence of the multi-task loss weights on segmentation and classification performance
5.2 Feature Pyramid Module Design Choices
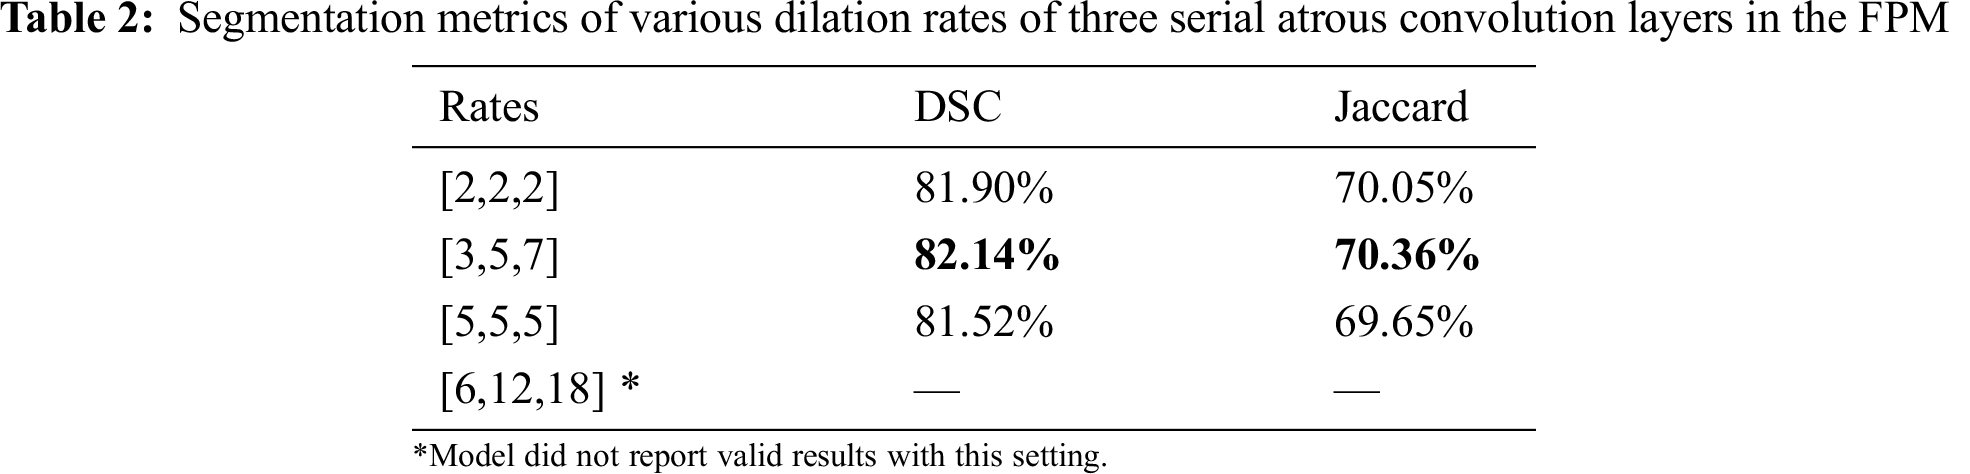
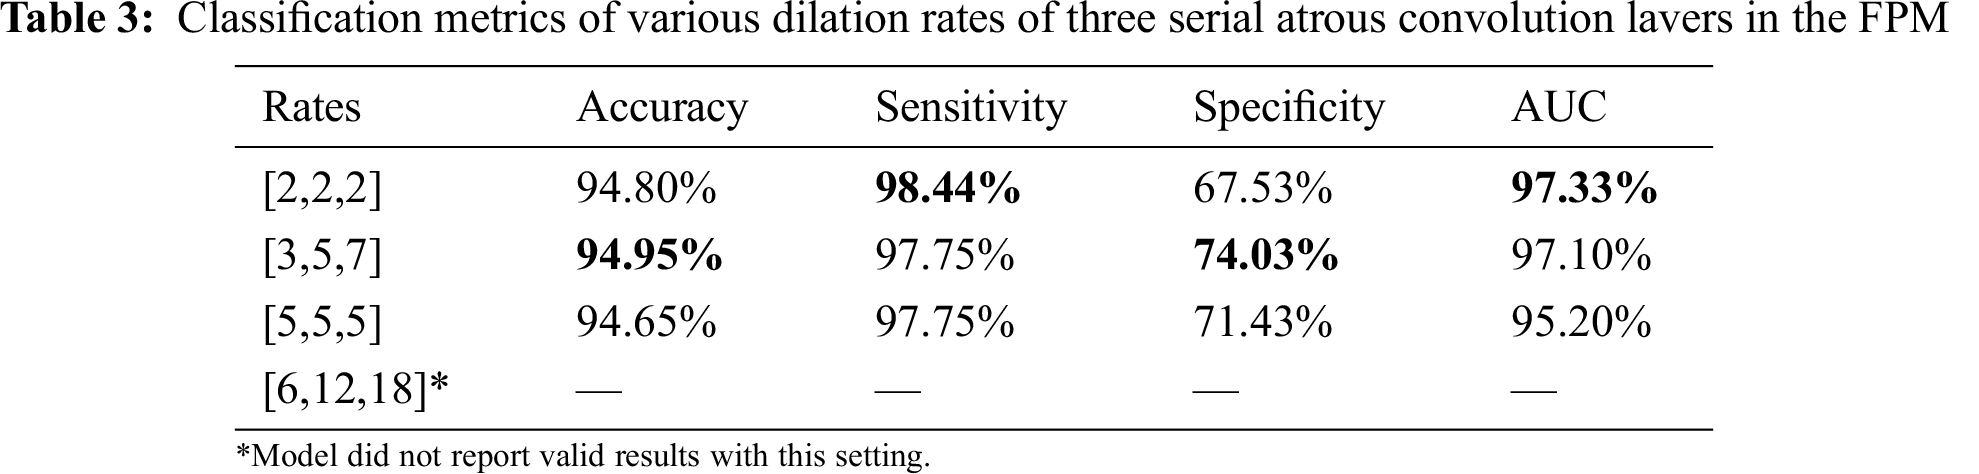
Serial and parallel atrous convolution layers were designed with various dilation rates in the FPM. To find the best parameter configuration for the dilation rates, other parameters were held constant while the dilation rates were varied. The findings are presented in Tabs. 2 and 3. Increasing the dilation rates to [3,5,7] yielded better performance, but increasing them further led to poorer results. The model produced no invalid results with larger dilation rates of [6,12,18]. Thus, dilation rates of [3,5,7] were adopted for the three serial atrous convolution layers in the FPM.
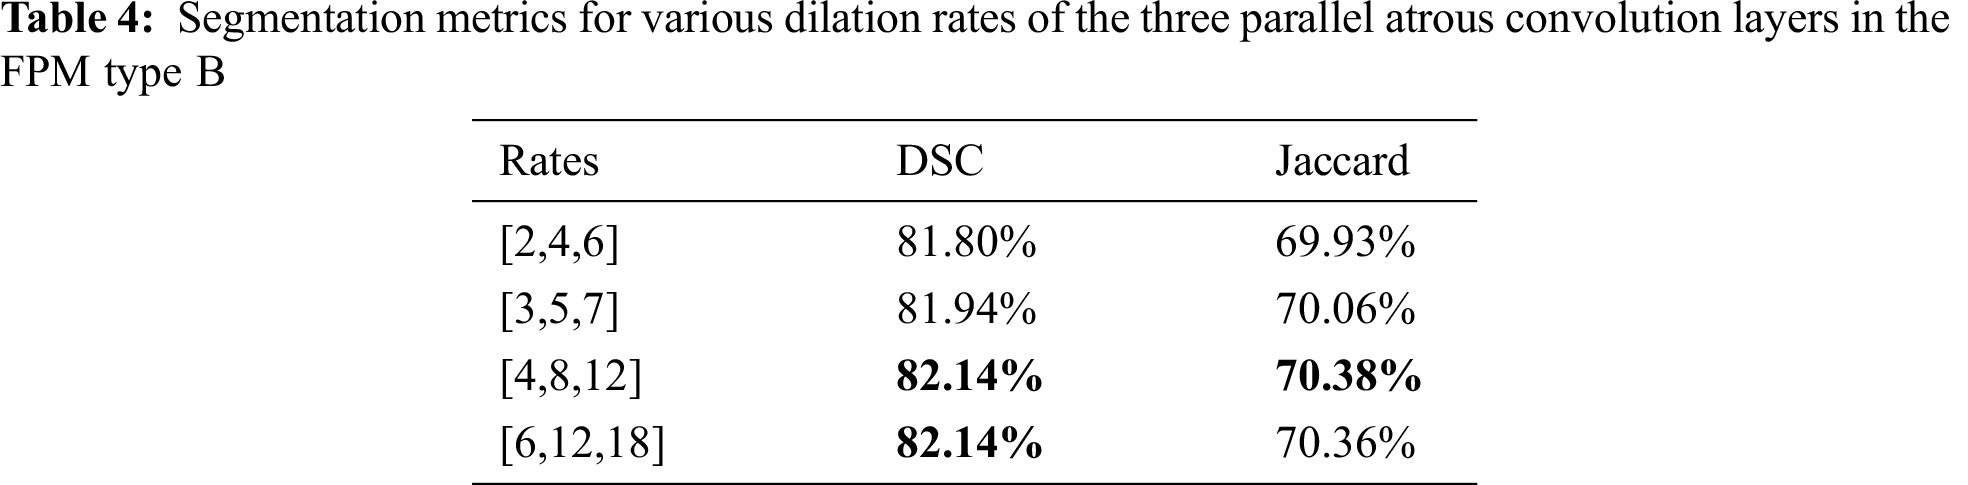
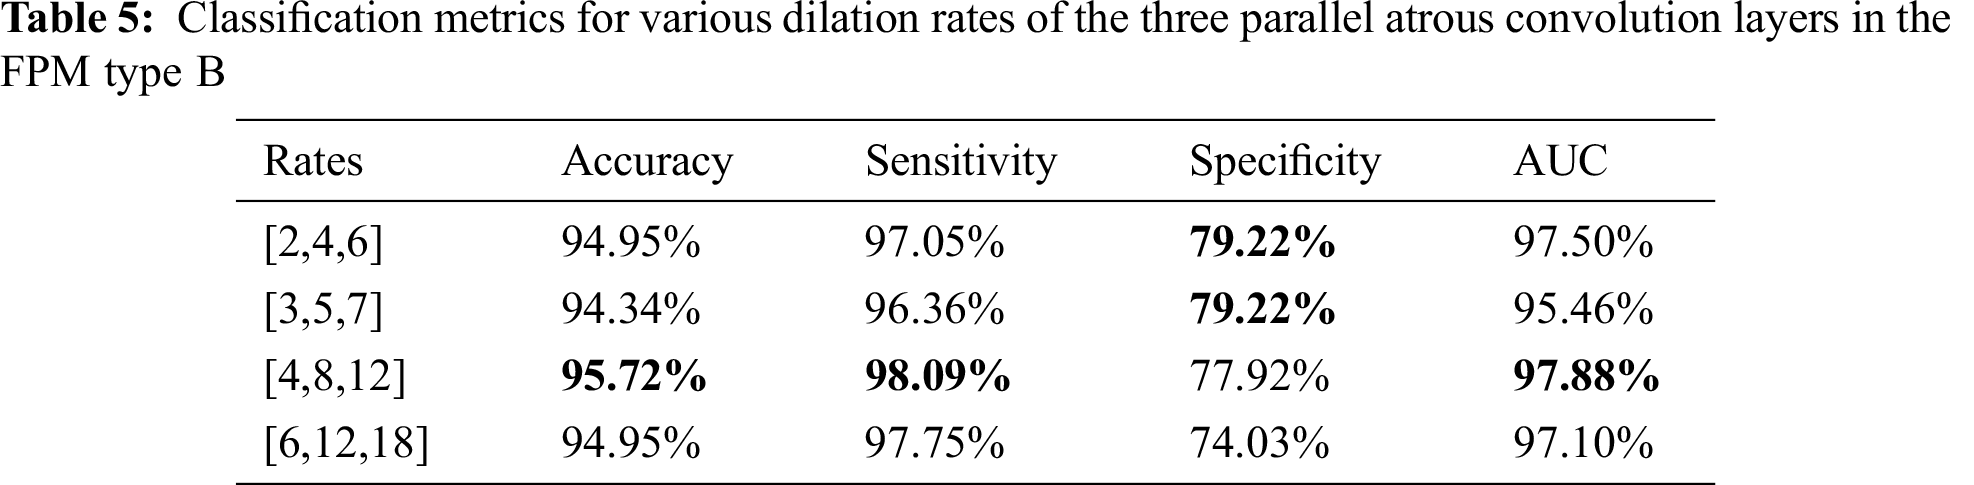
The dilation rate configuration was also explored for the three parallel atrous convolution layers in FPM type B. The results are presented in Tabs. 4 and 5. The variable-controlling approach was adopted in the experiments, first holding constant the best settings of the serial atrous convolution layers with dilation rates of [3,5,7] and then fine tuning the dilation rates of the three parallel atrous convolution layers. Tabs. 4 and 5 show that the model produced the best results with dilation rates of [4,8,12]. Increasing the rates further yielded no additional performance improvement.
Considering the balance of segmentation and classification performance, the dilation rates of the three serial atrous convolution layers were chosen as [3,5,7], and dilation rates of the three parallel atrous convolution layers of [4,8,12] were selected for use as the final parameter settings. These settings provided the best segmentation DSC of 82.14% and the best classification accuracy of 95.72%.
5.3 Validation of Proposed Method
Three examples of qualitative segmentation results are shown in Fig. 4. The segmentation results were closer to the manual ground truth and outperformed the segmentation results generated the state-of-the-art algorithm single segmentation methods of U-Net [12] and Deeplab V3+ [32]. The proposed methods were also compared with U-Net and Deeplab V3+ according to the DSC and JACC measurements. The quantitative evaluation results of segmentation are presented in Tab. 6. The proposed method achieved a mean DSC value of 82.14%, better than the U-Net DSC of 79.16% and Deeplab V3+ DSC of 82.05%.
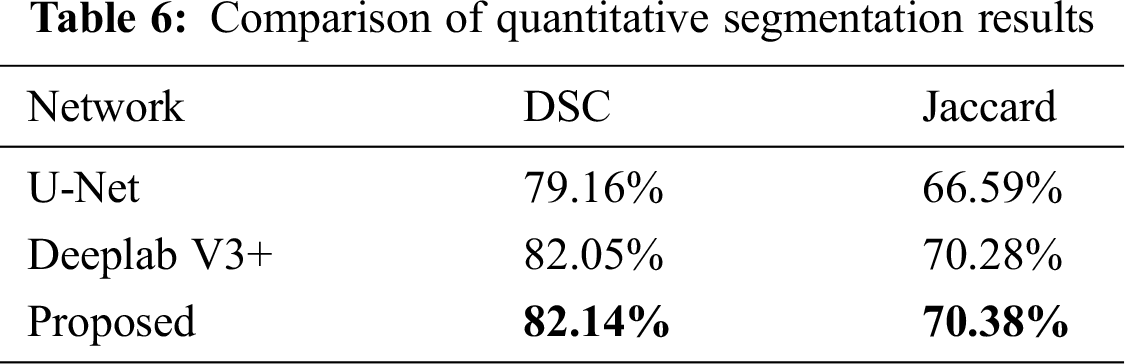
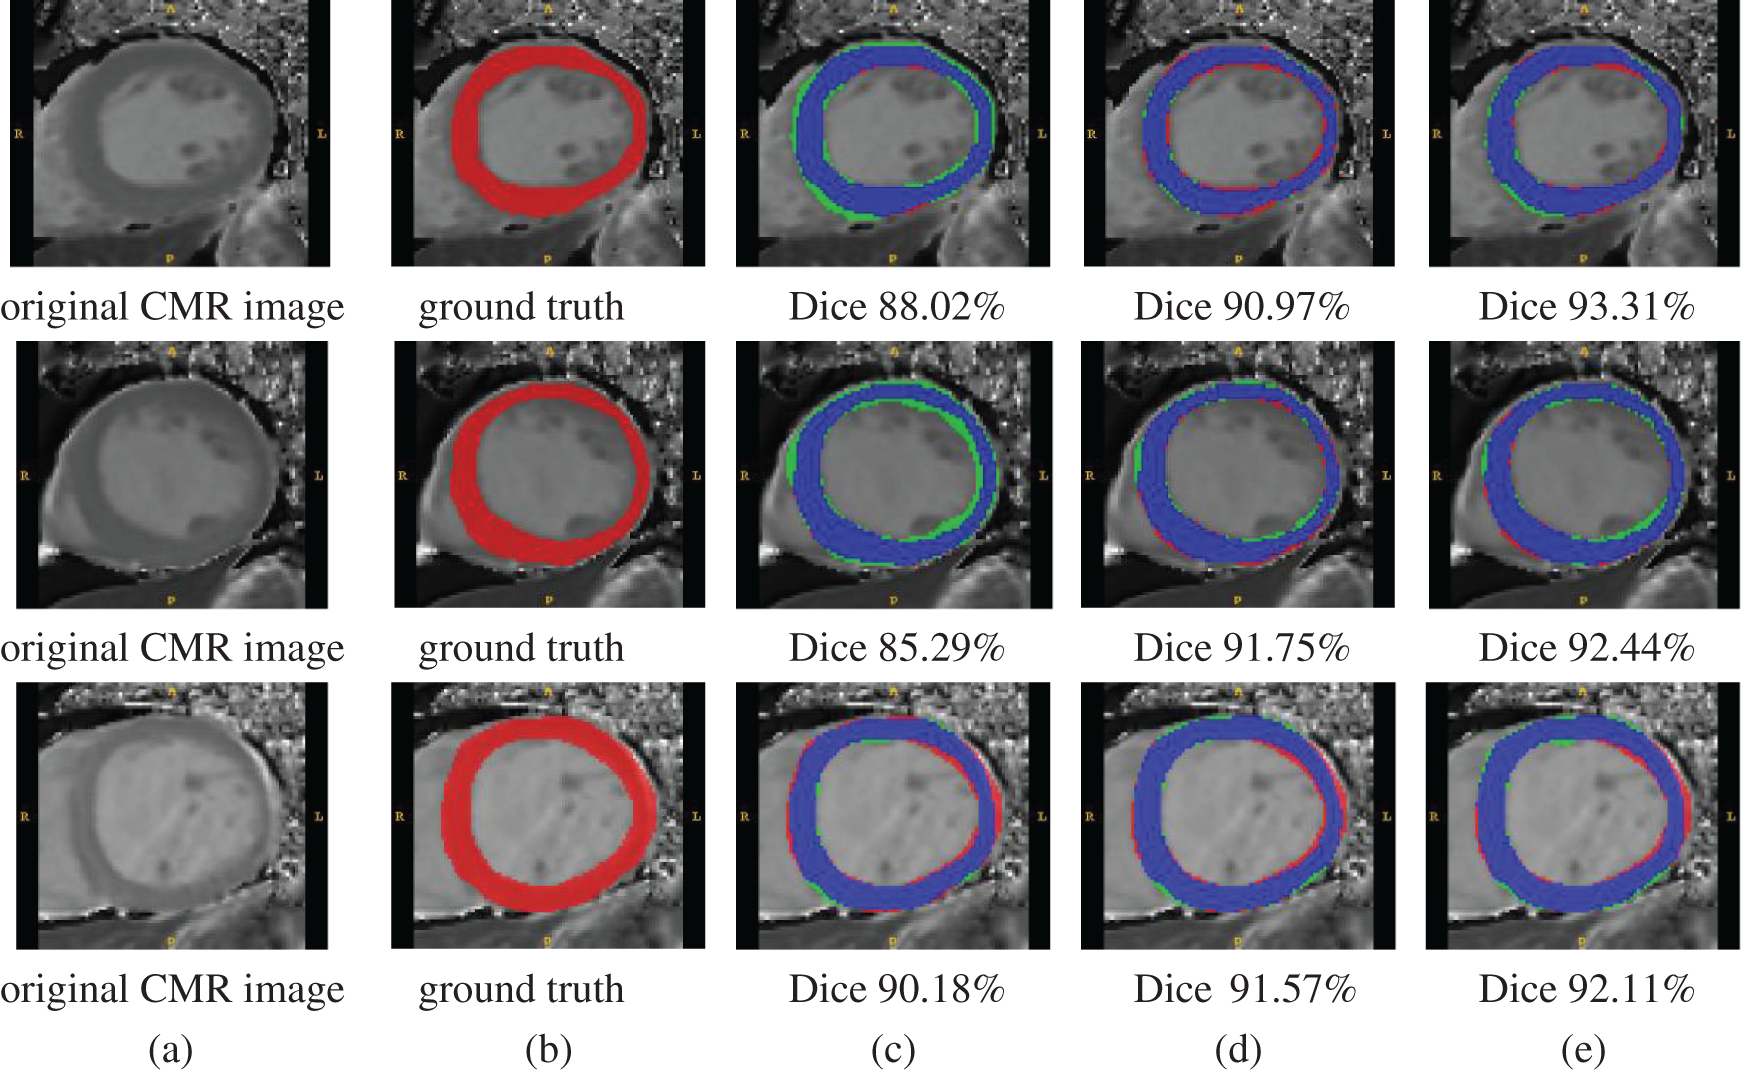
Figure 4: Qualitative segmentation comparison examples. Columns from left to right: (a) original MR images, (b) ground truth, (c) segmentation results with U-Net, (d) segmentation results with Deeplab V3+, and (e) segmentation results with the proposed method. Color representation of (c)–(e) is as follows — blue: correct pixels; red: unidentified pixels; and green: misidentified pixels
The accuracy, sensitivity, specificity, and area under the receiver operating characteristic curve (AUC) were also compared with some modern single classification networks to assess the classification performance. The quantitative evaluation results of the classification are presented in Tab. 7. The proposed method achieved a mean accuracy value of 0.855 compared with 0.741 for ResNet50 and 0.849 for Xception.
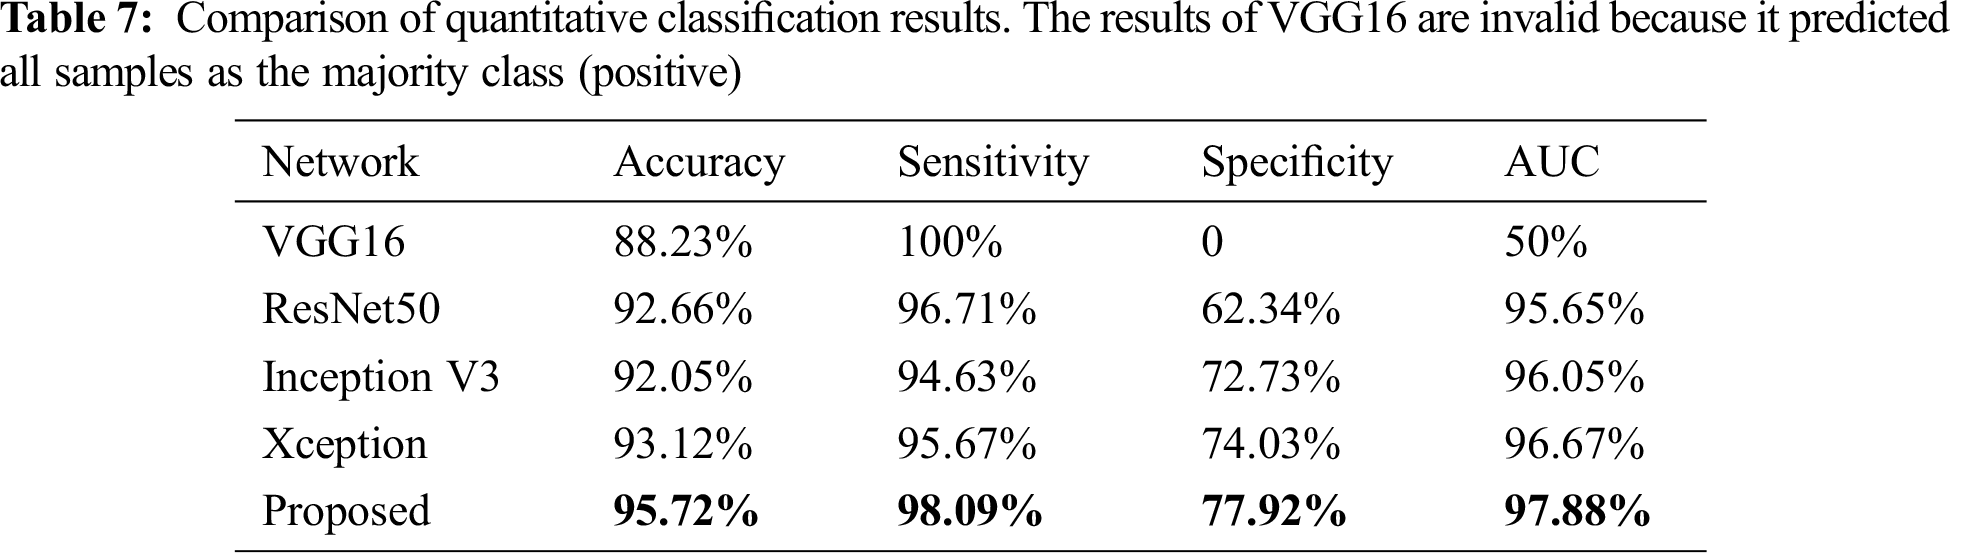
Fig. 5 shows the calculated peak signal-to-noise ratio (PSNR) [33] values for all 654 images, which ranged from 24.151 to 28.622. The PSNR values are mainly concentrated around 27.259. This shows that the automatic segmentation results are quite close to the segmentation label, and the method has excellent robustness.
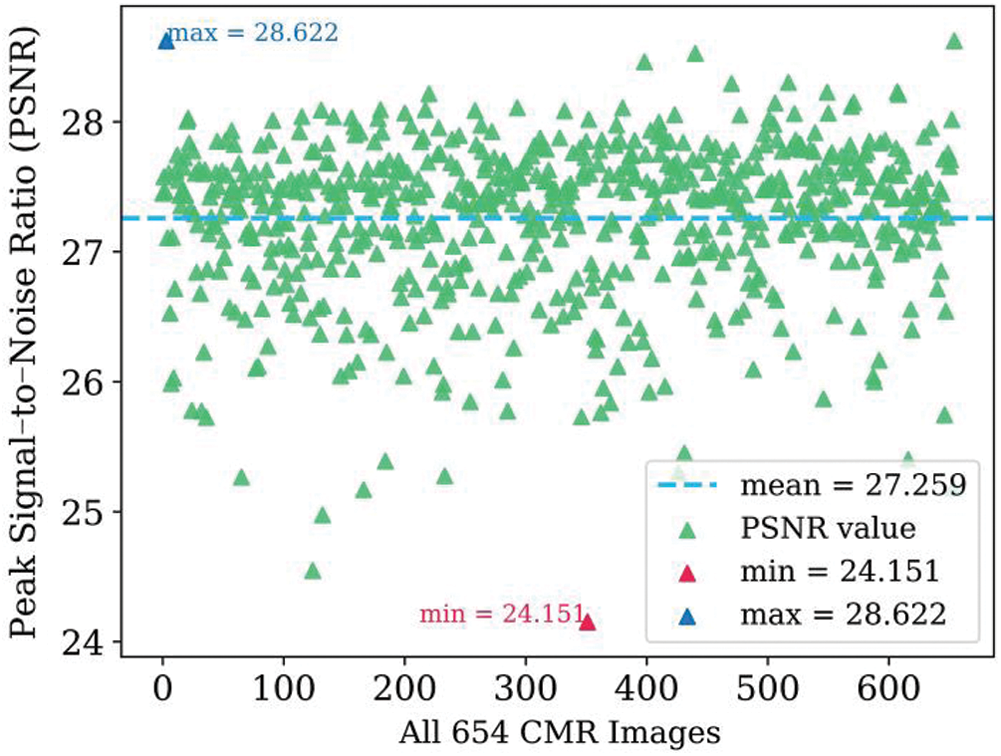
Figure 5: Scatter diagram of PSNR values for the 654 dataset images
The qualitative and quantitative results demonstrated that the proposed multi-task network achieved good performance in terms of segmentation and classification.
In this work, an effective method for segmenting cardiac LV myocardium images and classifying cardiac disease simultaneously was proposed. The method employs a multi-task model consisting of an encoder and a decoder. The encoder is primarily responsible for extracting abstract semantic features for classification. The decoder fuses high- and low-level features and leverages the subpixel layer to recover full spatial information for segmentation. The FPM and DAC blocks were also introduced into the network structure to capture more high-level features and multiscale information without multiscale input. The experimental results for the CMR image dataset proved the practicability and effectiveness of the method.
Acknowledgement: The authors would like to thank all participants for their valuable discussions regarding the content of this article.
Funding Statement: This work was supported by the Sichuan Science and Technology Program (Grant No. 2019JDRC0077, 2020YFG0009, 2019ZDZX0005, and 2019JDJQ0002), and the 1.3.5 Project for discipline of excellence, West China Hospital, Sichuan University (ZYJC18013 and Z2018A08).
Conflicts of Interest: The authors declare that they have no conflicts of interest to report regarding this study.
1. J. L. Jefferies and J. A. Towbin, “Dilated cardiomyopathy,” Lancet, vol. 375, no. 9716, pp. 752–762, 2010. DOI 10.1016/S0140-6736(09)62023-7. [Google Scholar] [CrossRef]
2. C. L. Jellis and D. H. Kwon, “Myocardial t1 mapping: Modalities and clinical applications,” Cardiovascular Diagnosis and Therapy, vol. 4, no. 2, pp. 126, 2014. [Google Scholar]
3. X. J. Li, J. C. Lv and Z. Yi, “An efficient representation-based method for boundary point and outlier detection,” IEEE Transactions on Neural Networks and Learning Systems, vol. 29, no. 1, pp. 51–62, 2018. DOI 10.1109/TNNLS.2016.2614896. [Google Scholar] [CrossRef]
4. Z. Liu, C. Maere and Y. Song, “Novel approach for automatic region of interest and seed point detection in ct images based on temporal and spatial data,” Computers, Materials & Continua, vol. 58, pp. 669–686, 2019. DOI 10.32604/cmc.2019.04590. [Google Scholar] [CrossRef]
5. P. Fu, Q. Xu, J. Zhang and L. Geng, “A noise-resistant superpixel segmentation algorithm for hyperspectral images,” Computers, Materials & Continua, vol. 58, pp. 509–515, 2019. DOI 10.32604/cmc.2019.05250. [Google Scholar] [CrossRef]
6. L. Wu, Q. Liu and P. Lou, “Image classification using optimized MKL for SSPM,” Intelligent Automation & Soft Computing, vol. 25, no. 2, pp. 249–257, 2019. [Google Scholar]
7. J. Lei, J. Duan, F. Wu, N. Ling and C. Hou, “Fast mode decision based on grayscale similarity and inter-view correlation for depth map coding in 3d-hevc,” IEEE Transactions on Circuits and Systems for Video Technology, vol. 28, no. 3, pp. 706–718, 2018. DOI 10.1109/TCSVT.2016.2617332. [Google Scholar] [CrossRef]
8. Z. Pan, H. Qin, X. Yi, Y. Zheng and A. Khan, “Low complexity versatile video coding for traffic surveillance system,” International Journal of Sensor Networks, vol. 30, no. 2, pp. 116–125, 2019. DOI 10.1504/IJSNET.2019.099473. [Google Scholar] [CrossRef]
9. Z. Pan, C. N. Yang, V. S. Sheng, N. Xiong and W. Meng, “Machine learning for wireless multimedia data security,” Security and Communication Networks, vol. 2019, pp. 1–2, 2019. [Google Scholar]
10. C. Peng, X. Zhang, G. Yu, G. Luo and J. Sun, “Large kernel matters-improve semantic segmentation by global convolutional network,” in Proc. of the IEEE Conf. on Computer Vision and Pattern Recognition (CVPRHawaii, USA, pp. 4353–4361, 2017. [Google Scholar]
11. R. Mottaghi, X. Chen, X. Liu, N. G. Cho, S. W. Lee et al., “The role of context for object detection and semantic segmentation in the wild,” in Proc. of the IEEE Conf. on Computer Vision and Pattern Recognition (CVPRColumbus, USA, pp. 891–898, 2014. [Google Scholar]
12. O. Ronneberger, P. Fischer and T. Brox, “U-net: Convolutional networks for biomedical image segmentation,” in Proc. of the Int. Conf. on Medical Image Computing and Computer-assisted Intervention (MICCAIMunich, Germany, pp. 234–241, 2015. [Google Scholar]
13. L. C. Chen, G. Papandreou, F. Schroff and H. Adam, “Rethinking atrous convolution for semantic image segmentation,” in Proc. of the IEEE Conf. on Computer Vision and Pattern Recognition (CVPRHawaii, USA, arXiv:1706.05587, 2017 [Google Scholar]
14. F. Chollet, “Xception: Deep learning with depthwise separable convolutions,” in Proc. of the IEEE Conf. on Computer Vision and Pattern Recognition (CVPRHawaii, USA, pp. 1251–1258, 2017. [Google Scholar]
15. R. Girshick, J. Donahue, T. Darrell and J. Malik, “Rich feature hierarchies for accurate object detection and semantic segmentation,” in Proc. of the IEEE Conf. on Computer Vision and Pattern Recognition (CVPRColumbus, USA, pp. 580–587, 2014. [Google Scholar]
16. C. Song, X. Cheng, Y. X. Gu, B. J. Chen and Z. J. Fu, “A review of object detectors in deep learning,” Journal on Artificial Intelligence, vol. 2, no. 2, pp. 59–77, 2020. DOI 10.32604/jai.2020.010193. [Google Scholar] [CrossRef]
17. V. Badrinarayanan, A. Kendall and R. Cipolla, “Segnet: A deep convolutional encoder-decoder architecture for image segmentation,” IEEE Transactions on Pattern Analysis and Machine Intelligence, vol. 39, no. 12, pp. 2481–2495, 2017. [Google Scholar]
18. L. C. Chen, G. Papandreou, I. Kokkinos, K. Murphy and A. L. Yuille, “Deeplab: Semantic image segmentation with deep convolutional nets, atrous convolution, and fully connected crfs,” IEEE Transactions on Pattern Analysis and Machine Intelligence, vol. 40, no. 4, pp. 834–848, 2018. [Google Scholar]
19. K. He, X. Zhang, S. Ren and J. Sun, “Spatial pyramid pooling in deep convolutional networks for visual recognition,” IEEE Transactions on Pattern Analysis and Machine Intelligence, vol. 37, no. 9, pp. 1904–1916, 2015. [Google Scholar]
20. W. Liu, A. Rabinovich and A. C. Berg, “Parsenet: Looking wider to see better,” in Proc. of the Int. Conf. on Learning Representations (ICLRSan Diego, USA, arXiv:1506.04579, 2015. [Google Scholar]
21. C. Szegedy, V. Vanhoucke, S. loffe, J. Shlens and Z. Wojna, “Rethinking the inception architecture for computer vision,” in Proc. of the IEEE Conf. on Computer Vision and Pattern Recognition (CVPRLas Vegas, USA, pp. 2818–2826, 2016. [Google Scholar]
22. H. Noh, S. Hong and B. Han, “Learning deconvolution network for semantic segmentation,” in Proc. of the IEEE Int. Conf. on Computer Vision, Boston, USA, pp. 1520–1528, 2015. [Google Scholar]
23. L. C. Chen, Y. Zhu, G. Papandreou, F. Schroff and H. Adam, “Encoder-decoder with atrous separable convolution for semantic image segmentation,” in Proc. of the European Conf. on Computer Vision (ECCVMunich, Germany, pp. 801–818, 2018. [Google Scholar]
24. K. He, X. Zhang, S. Ren and J. Sun, “Deep residual learning for image recognition,” in Proc. of the IEEE Conf. on Computer Vision and Pattern Recognition (CVPRLas Vegas, USA, pp. 770–778, 2016. [Google Scholar]
25. Z. Gu, J. Cheng, H. Fu, K. Zhou, H. Hao et al., “Ce-net: Context encoder network for 2d medical image segmentation,” IEEE Transactions on Medical Imaging, vol. 38, no. 10, pp. 2281–2292, 2019. [Google Scholar]
26. W. Shi, J. Caballero, F. Huszár, J. Totz, A. P. Aitken et al., “Real-time single image and video super-resolution using an efficient sub-pixel convolutional neural network,” in Proc. of the IEEE Conf. on Computer Vision and Pattern Recognition (CVPRLas Vegas, USA, pp. 1874–1883, 2016. [Google Scholar]
27. G. Csurka, D. Larlus, F. Perronnin and F. Meylan, “What is a good evaluation measure for semantic segmentation?,” in Proc. of the 24th British Machine Vision Conf. (BMVC), Meylan, France, pp. 1–11, 2013. [Google Scholar]
28. S. Loffe and C. Szegedy, “Batch normalization: Accelerating deep network training by reducing internal covariate shift,” in Proc. of the Int. Conf. on Machine Learning (ICMLLille, France, 35, pp. 448–456, 2015. [Google Scholar]
29. L. Pan, J. Qin, H. Chen, X. Xiang, C. Li et al., “Image augmentation-based food recognition with convolutional neural networks,” Computers, Materials & Continua, vol. 59, pp. 297–313, 2019. [Google Scholar]
30. Z. Pan, W. Yu, X. Yi, A. Khan, F. Yuan et al., “Recent progress on generative adversarial networks (gansA survey,” IEEE Access, vol. 7, pp. 36322–36333, 2019. [Google Scholar]
31. A. A. Taha and A. Hanbury, “Metrics for evaluating 3d medical image segmentation: analysis, selection, and tool,” BMC Medical Imaging, vol. 15, no. 1, pp. 29, 2015. [Google Scholar]
32. L. C. Chen, Y. Zhu, G. Papandreou, F. Schroff and H. Adam, “Encoder-decoder with atrous separable convolution for semantic image segmentation,” in Proc. of the European Conf. on Computer Vision (ECCVMunich, Germany, pp. 801–818, 2018. [Google Scholar]
33. F. A. Fardo, V. H. Conforto, F. C. de Oliveira and P. S. Rodrigues, “A formal evaluation of psnr as quality measurement parameter for image segmentation algorithms,” in Proc. of the IEEE Conf. on Computer Vision and Pattern Recognition (CVPRLas Vegas, USA, arXiv: 1605.07116,2016. [Google Scholar]
 | This work is licensed under a Creative Commons Attribution 4.0 International License, which permits unrestricted use, distribution, and reproduction in any medium, provided the original work is properly cited. |