DOI:10.32604/iasc.2021.016953
| Intelligent Automation & Soft Computing DOI:10.32604/iasc.2021.016953 | |
| Article |
Main Factor Selection Algorithm and Stability Analysis of Regional FDI Statistics
1Centre for Innovation Research in Social Governance, Changsha University of Science and Technology, Changsha, 410114, China
2College of Information Technology and Management, Hunan University of Finance and Economics, Changsha, 410205, China
3Department of mathematics and computer science, Northeastern State University, OK, 74464, USA
*Corresponding Author: Huajun Huang. Email: huanghuajun@hufe.edu.cn
Received: 16 January 2021; Accepted: 04 May 2021
Abstract: There are various influencing factors in regional FDI (foreign direct investment) and it is difficult to identify the main influencing factors. For this reason, a main factor selection algorithm is proposed in this article for the main factors affecting regional FDI statistics by analyzing the regional economic characteristics and the possible influencing factors in the regional FDI. Then, an example is used to illustrate its effectiveness and its stability. Firstly, the characteristics of regional economy and the regional FDI data are introduced to develop the main factor selection algorithm based on the adaptive Lasso problem for the regional FDI and to establish the corresponding computing procedure. Then, based on the regional FDI statistical data of six provinces in the central China, the main factor selection algorithm is used to filter out the insignificant factors and identify the main influencing factors for the different regional FDI statistics, including the mean values, the median values, the maximum values, and the minimum values. Finally, the proposed algorithm is validated through an accuracy test experiment performed in central China. On this basis, its corresponding stability with the noise error case is analyzed and the control stability range of the algorithm is determined.
Keywords: Lasso problem; adaptive Lasso problem; main factor selection algorithm; regional FDI statistics; main factors affecting regional FDI Statistics
Economic globalization is essential for economic development, but requires as well the rapid and balanced development among all regions [1]. In the new pattern of global economy, as the overall scale increases and the regional economic cooperation deepens, it is necessary to carry out innovation in the form of regional cooperation [2].
Due to historical and geographical reasons, there are many differences in the regional economies between various regions in China. Since the reforms and the opening up to the world, China has achieved success in implementing the policies aimed to revitalize its economy by taking the lead in the east, develop the western and central regions and revive the northeast. The level of economic development in the east is significantly higher than in the central and western regions while the level of economic development in central China is also higher than in the west. Liu et al. argued that the main reasons for the gap of regional economic development include development strategies and policies, regulations, and the degree of openness [3]. Whether economic development is constrained by the local market conditions of various regions [4], the priority of Chinese economy has been shifted in recent years. Take the economic data of various regions in the first half of 2018 as an example. The overall trend is positive. Based on the data of different regions, the fastest growth is achieved in the central region, with an average growth rate of 7.91%, which is higher than 7.23% for the west, while the slowest is linked to the northeast where the average growth rate is 4.53%. Overall, China has performed well in attracting FDI. In 2015, China became the largest country of foreign capital inflow around the world, the growth of which varies between different regions. Therefore, it is important to analyze the influencing factors in regional FDI for improving the growth rate of regional FDI.
For the analysis of influencing factors in regional FDI, there have been many researchers around the world publishing papers. Wang et al. applied the grey correlation theory to confirm and analyze the relationship between different influencing factors and the variation in regional economic development [5]. Xu et al. [6] conducted the co-integration test and constructed the error correction model to investigate the influencing factors in the destination of FDI in China. Zhou et al. [7] adopted the index DEA model to construct the indicators of high-quality economic development, and then performed the panel quantile regression to explore the impact of FDI on high-quality economic development. Lu et al. [8] relied on stepwise regression, co-integration and error correction models to analyze the influencing factors in FDI. Li et al. [9] conducted the grey relational analysis to compare and analyze the significance of correlation between the influencing factors for region FDI in Henan province from 1990 to 2009. Wei Zhou [10] analyzed the effects of variables related to industrial transfer on the FDI from the perspective of the driving factors in the industrial transfer of Beijing-Tianjin-Hebei urban agglomeration. With the data collected from 31 provinces as the samples, Zhou et al. [11] applied the static panels and spatial measurement models to analyze the correlation of FDI with the conditions of regional economic growth, financial development as well as the impact on industry development and industry optimization [12]. Currently, the global economy is getting more and more interdependent. In the meantime, the focus of research has shifted to exploring how to use the mathematical models to analyze the influencing factors in regional FDI, predict the trends of FDI reasonably and accurately, and promote regional economic development through foreign capital for China.
Although the influencing factors in regional FDI are complex and changeable, most scholars both in China and abroad relied on multivariate statistical or economic methods to analyze their patterns using time series data or panel data. It was found out that the impact of influencing factors on FDI was significant. However, it is inevitable for the above methods to be affected by the random choice of variables and multicollinearity. In this paper, a main factor selection algorithm is proposed to address the adaptive Lasso problem for computing the main influencing factors in FDI. This algorithm can not only eliminate multicollinearity, but also achieve the selection [13–16] and estimation of variables, thus providing effective reference for the regional FDI statistics in central China.
2 Description of Main Factor Selection Algorithm
2.1 Explanation of Lasso and Related Methods
Before the model of the Lasso problem is introduced, a simple linear regression model is presented as follows.
where
The RSS (residual sum of squares) of this model is
The optimized objective function of β can be represented to minimize RSS as follows.
If the inverse of the matrix
If n < p the matrix
The most common method used to solve the over-fitting equation is to regularize the parameters, so that
The above problem is called the Lasso problem, where
where
In order for the Lasso problem to learn the mapping relationship [17] of the feature parameters in regional FDI, the near-end gradient descent algorithm [18] is applied to solve the Lasso problem.
Before the near-end gradient descent algorithm is introduced, some preliminary knowledge is presented briefly.
The optimization goal in Lasso problem [19] is
It can also be described as
where
The process of the near-end gradient descent algorithm is detailed as follow.
1) The optimized problem is
where
2) When
where
3) The original solution at k + 1 iterations is
In the near-end gradient descent algorithm, the following formula can be solved to obtain
4) With (12) solved, set
Get:
where
In order to solve
5) Iteration, otherwise, if
2.3 Main Factor Selection Algorithm for Adaptive Lasso Problem
Based on the Lasso problem [20], the variable selection method assigns the same weight to the different coefficients in the Lasso solving method. As for the adaptive Lasso problem, the basic idea is to give the small weight to the small coefficients for punishment and then convert the adaptive Lasso problem into a Lasso problem through suitable transformation for obtaining their solution. In fact, the policy selection methods [21] can be used to achieve the purpose. However, they are usually subjected to some limitations. It is demonstrated that the adaptive Lasso method is the most ideal choice, which relies on penalty function to compress the variable coefficients. As suggested by Zou et al. [22], an effective penalty function is supposed to have three characteristics: continuity, unbiasedness and sparsity. Therefore, the solution to adaptive Lasso problem has a wider scope of applications as compared to the traditional mathematical statistics and the Lasso problem. According to the above requirements, this paper adopts the main factor selection algorithm to analyze FDI using regional FDI statistics.
The optimization goal of the adaptive Lasso problem is
where,
Main Factor Selection Algorithm:
1) Set
2) Solve the following Lasso problem:
3) Since the adaptive Lasso problem (18) is a convex optimization problem, the near-end gradient descent algorithm is applied to solve the following Lasso problem as follows:
4) Get
For the main factor selection algorithm, the regional FDI in central China is exemplified to demonstrate its effectiveness and stability. The six provinces located in central China have different status of development and their respective advantages. To some extent, there is variation in the ability to attract those large and medium foreign-funded enterprises [23]. Therefore, it is necessary to analyze the six central provinces for regional FDI using the relevant data, so as to figure out the differences between these six provinces and develop targeted regional policies.
Upon investigation and statistics, there werev14 characteristic parameters selected from these six provinces located in central China, including the regional GDP (
The data used in this article is sourced from "Hunan Province Statistical Yearbook”, “Hubei Province Statistical Yearbook”, “Henan Province Statistical Yearbook”, “Shanxi Province Statistical Yearbook”, “Anhui Province Statistical Yearbook”, “Jiangxi Province Statistical Yearbook”, NBS (National Statistics Bureau), and SAFE (State Administration of Foreign Exchange). Due to the large amount of data and the space limit of this article, the data cannot be further detailed here.
3.1 Convergence Analysis of Main Factor Selection Algorithm for Regional FDI statistics
In order to illustrate the convergence of the algorithm proposed in this paper, the average, the median, the maximum and the minimum of the above 14 factors are taken as the input, while those of the annual actual utilization of FDI in these six provinces in central China are taken as the output to illustrate the characteristics of regional FDI.
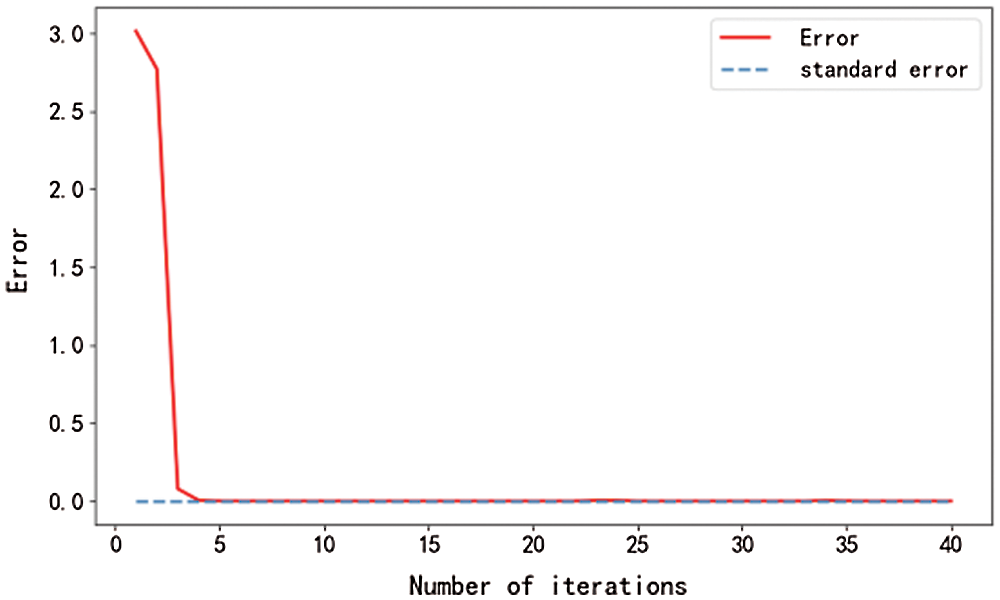
Figure 1: Mean value iterative errors
The algorithm of regional FDI statistics with the adaptive Lasso problem used to compute its mean after 27 iterations shows an iteration error of 0.00009, which is less than the required iteration error1e-4, so that the iteration ends. The algorithm for the adaptive Lasso problem with the median values after 5 iterations shows an iteration error of 0.00005, which is less than the required iteration error1e-4, so that the iteration is terminated. The iteration error for the solution to the adaptive Lasso problem based on the maximum value after 36 iterations is 0.00007, which is less than the required iteration error1e-4, so that the iteration is terminated. After 16 iterations of the minimum-based algorithm for the adaptive Lasso problem, the iteration error is 0.00009, which is less than the required iteration error 1e-4, so that the iteration is terminated. The iteration error process is shown in Fig. 2.
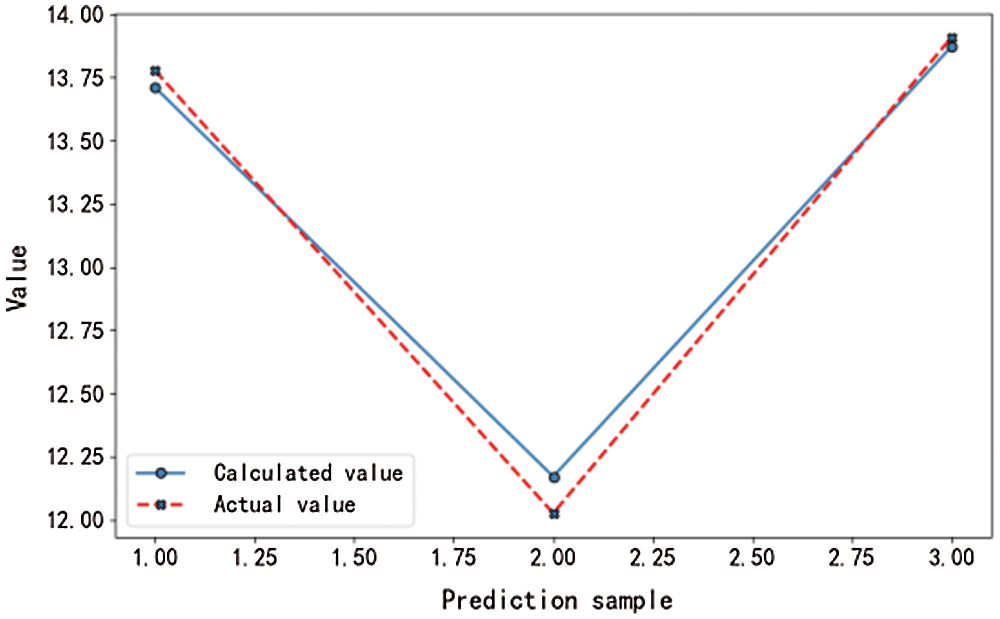
Figure 2: Computedmean value results
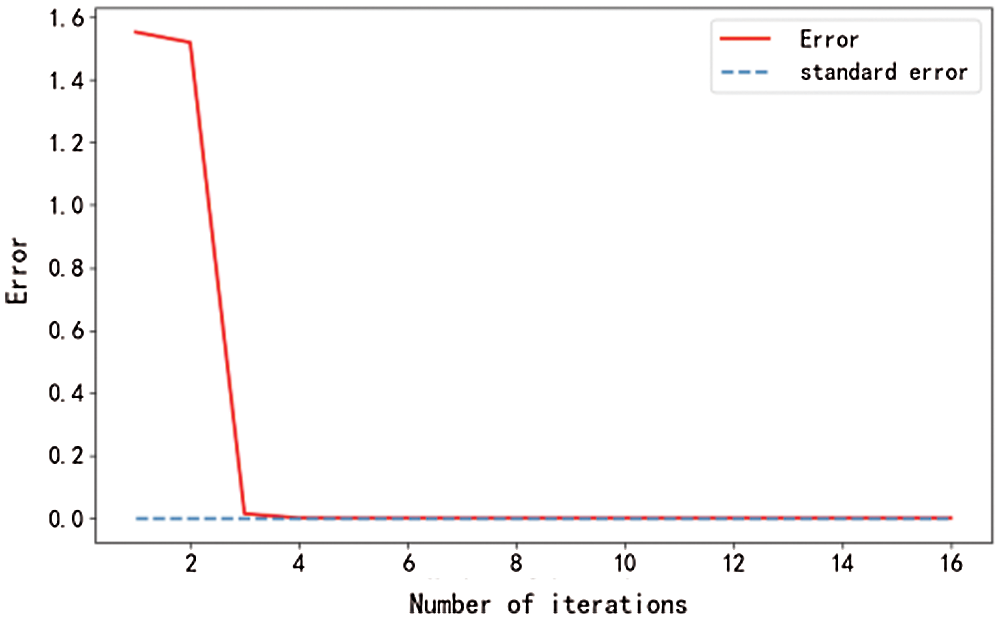
Figure 3: Median value iterative errors
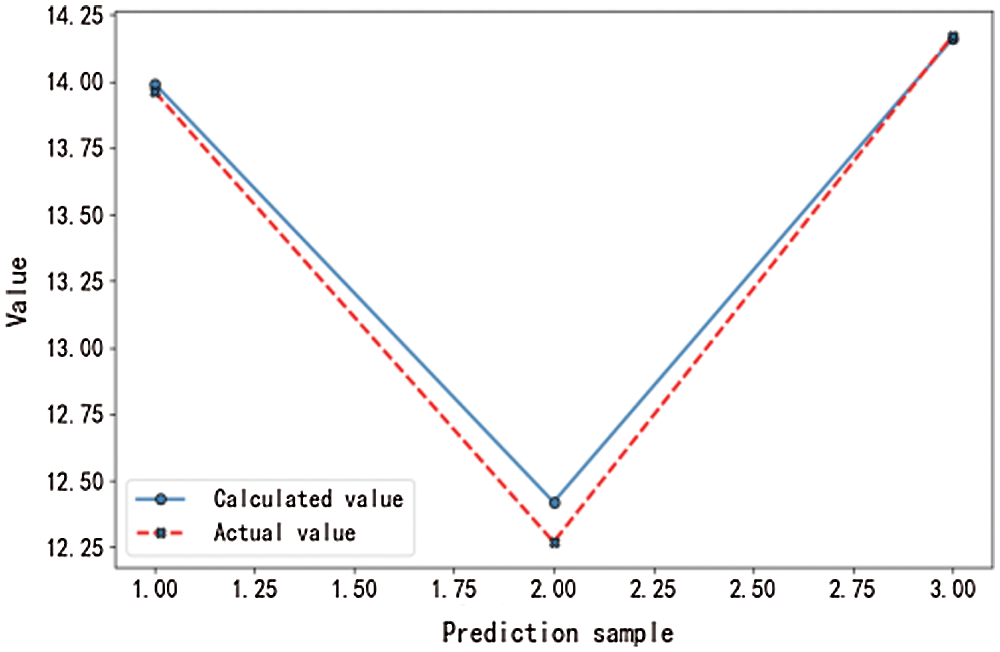
Figure 4: Computed median value results
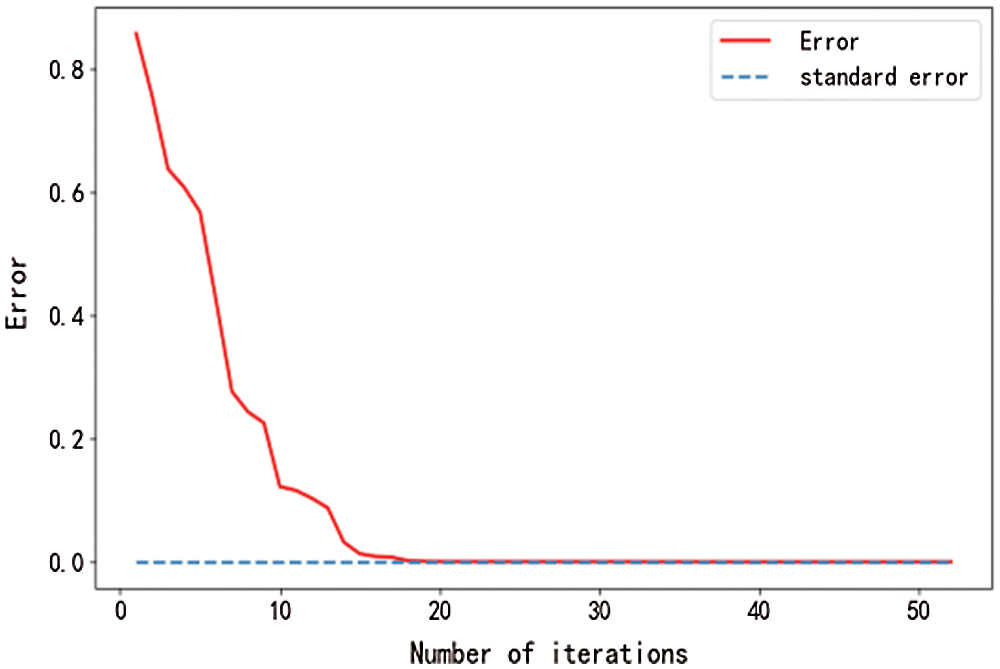
Figure 5: Maximum value iterative errors
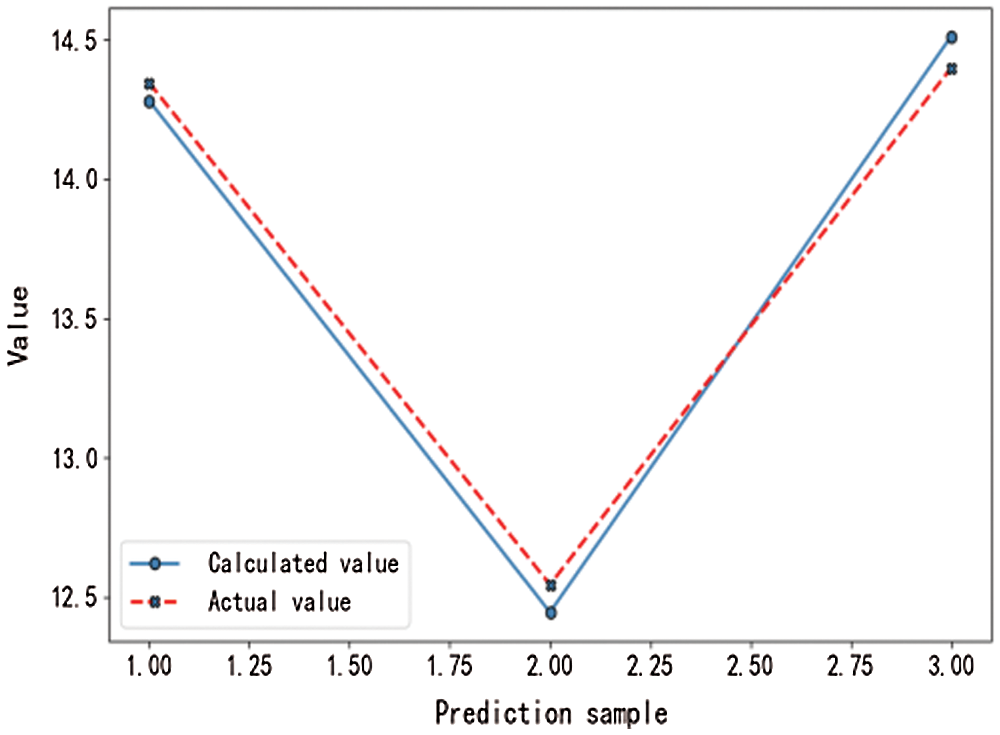
Figure 6: Computed maximum value results
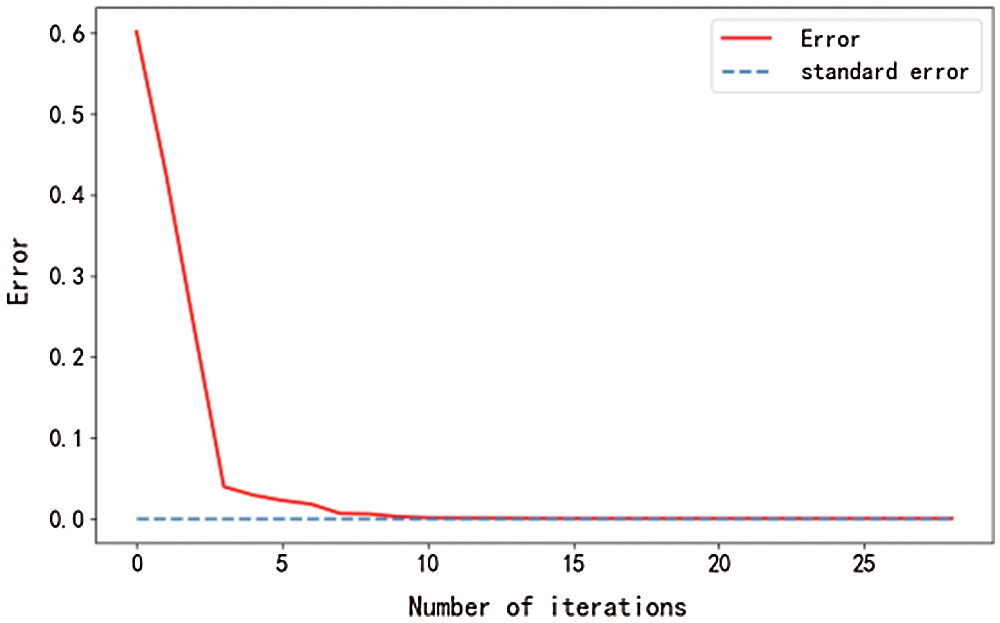
Figure 7: Minimum value iterative errors
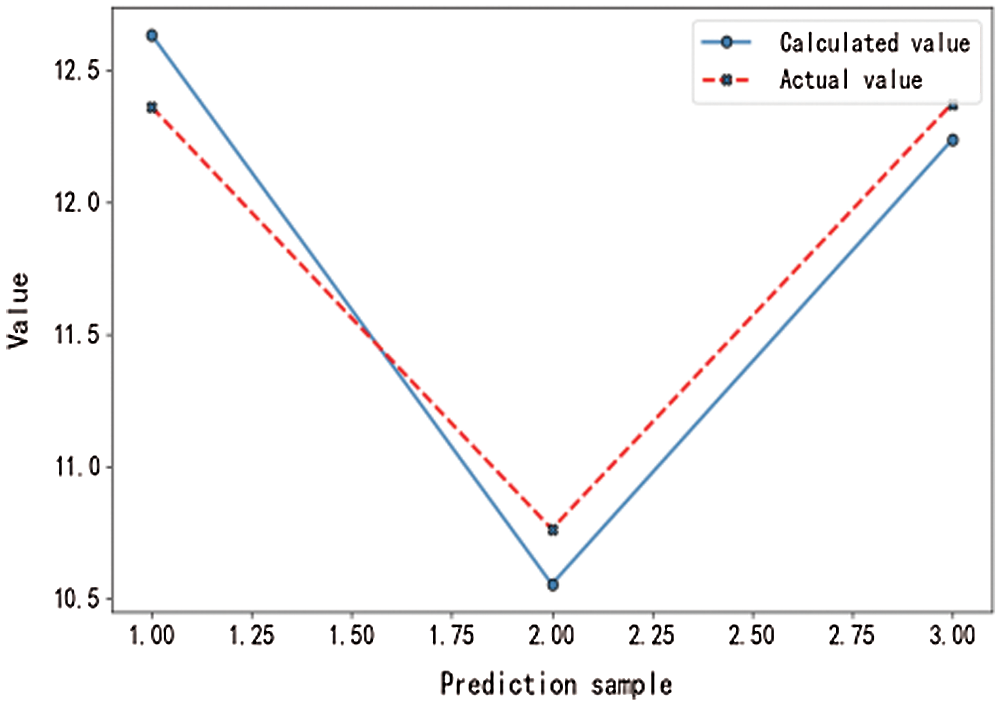
Figure 8: Computed minimum value results
From the curves shown in Figs. 1–8, it can be seen that the main factor selection algorithm for the adaptive Lasso problem can converge rapidly and produce satisfactory results.
After data training, the results of
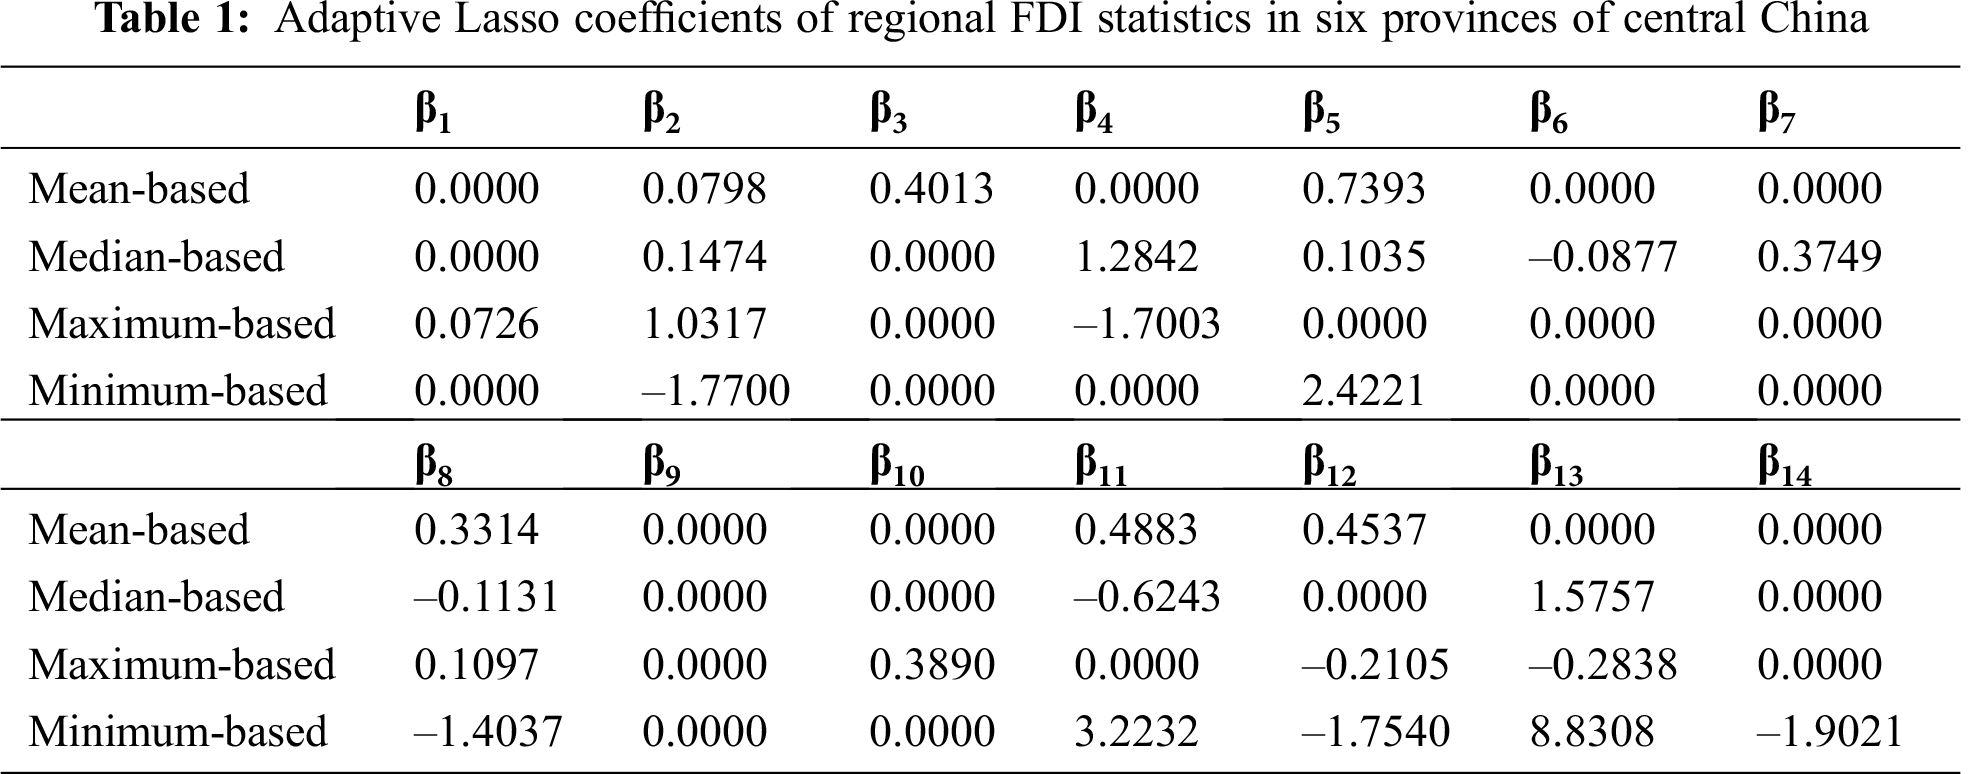
From Tab. 1, it can be seen clearly that the coefficients of the adaptive Lasso estimation (
3.2 Effectiveness of Main Factor Selection Algorithm and Its Stability
In this section, there are two kinds of errors used for the validity analysis: RMSE (root mean square error) and MAE (mean absolute error). The former can measure the deviation between the calculated value and the actual value, while the latter (mean absolute error) is the average of absolute errors, which can reflect the calculated value error faithfully. The RMSE and the MAE between the actual FDI statistics and the computed regional FDI statistics are shown in Tab. 2.
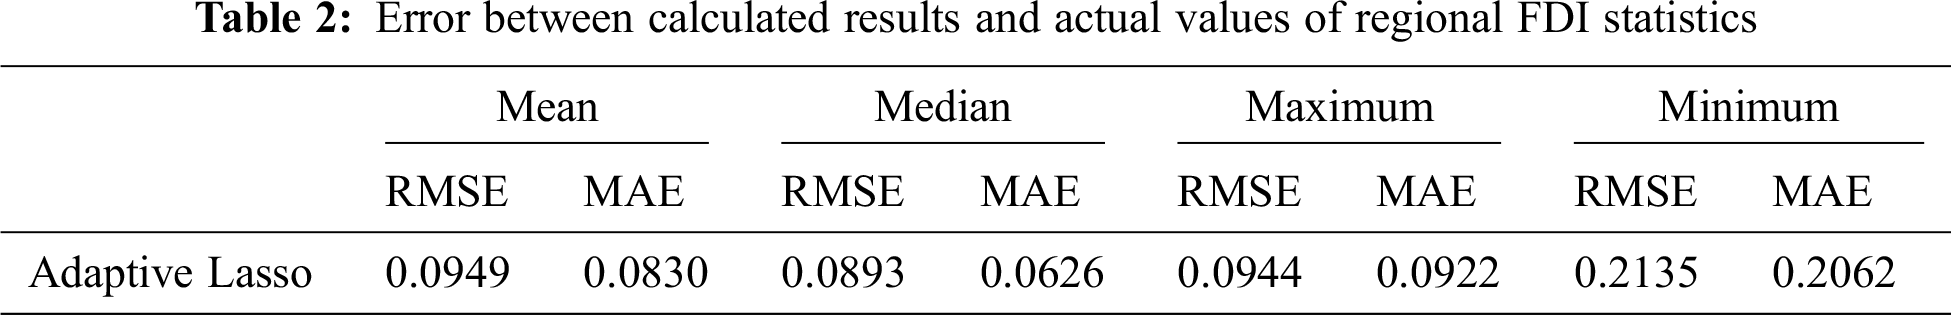
From Tab. 2, it can be found out that the RMSE and the MAE of the calculated values by the main factor selection algorithm for the regional FDI statistics are small, indicating that the algorithm is capable of selecting the main factors required to identify the influencing factors in regional FDI.
Then, in order to illustrate the stability of the established algorithm, the different degrees of the noise [24] are added into the data for evaluating the reliability of the data. In this section, we randomly select S sample feature data and add the different degrees of the noise. The values of S are 36 (accounting for 20% of the total number of data), 55 (accounting for 30%), and 72 (accounting for 40%). The noise is uniformly distributed in
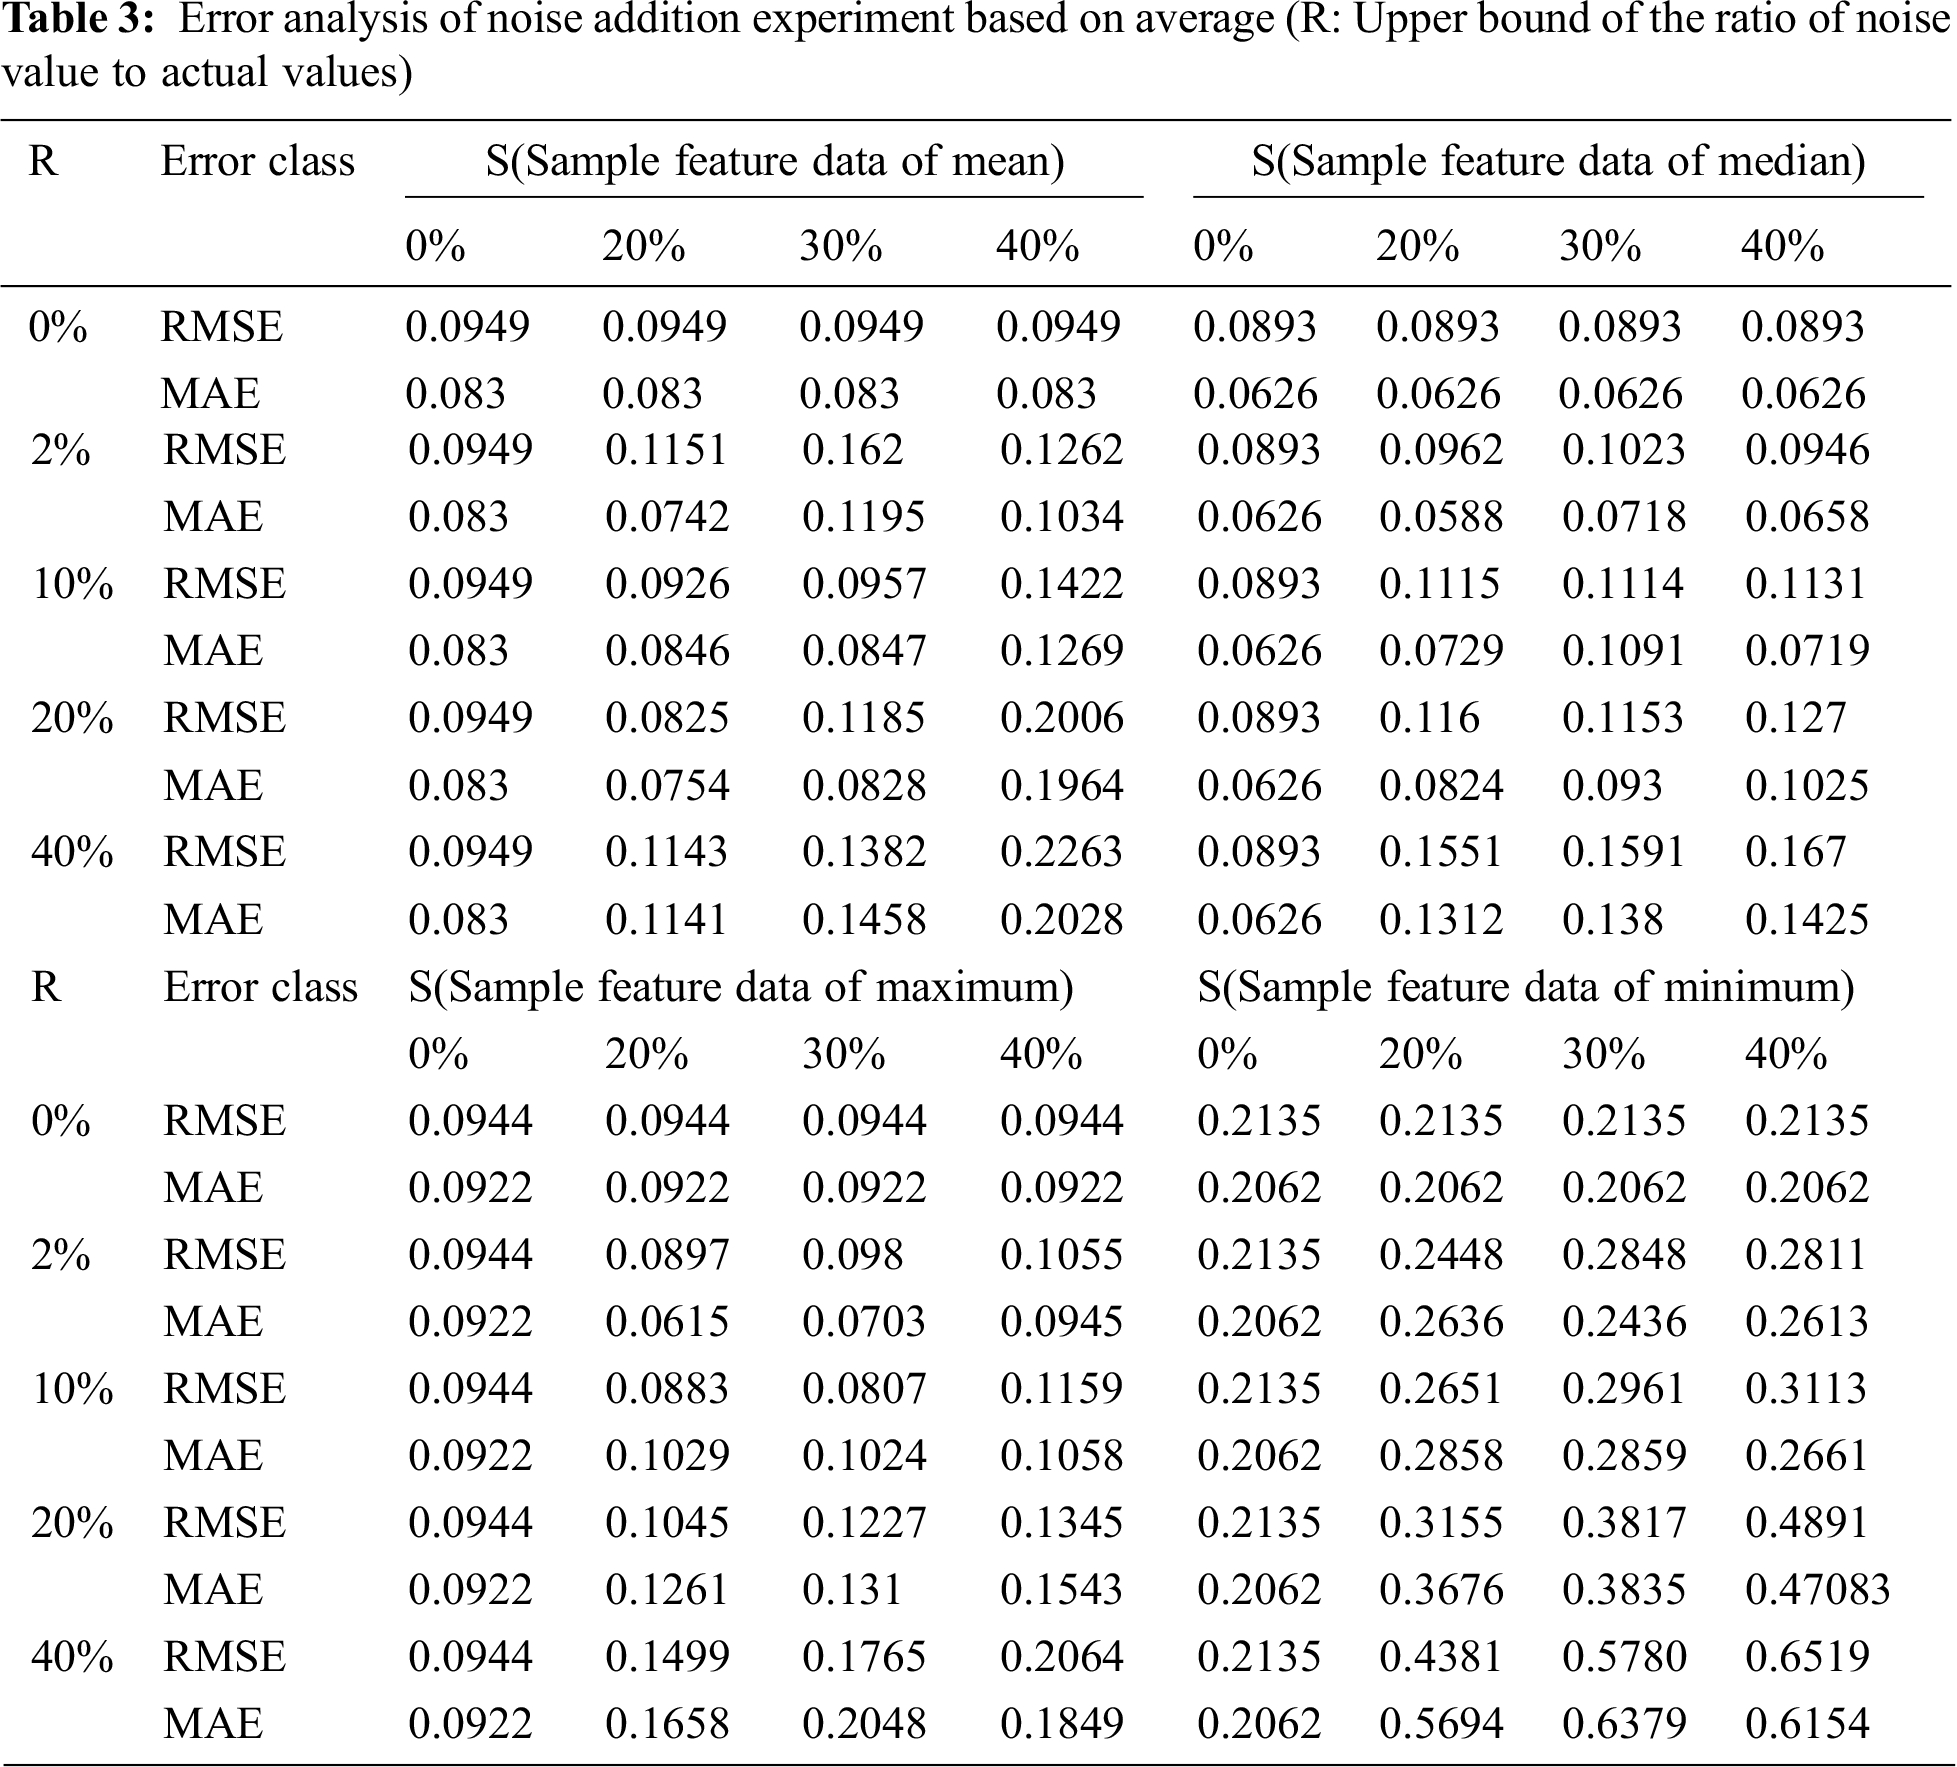
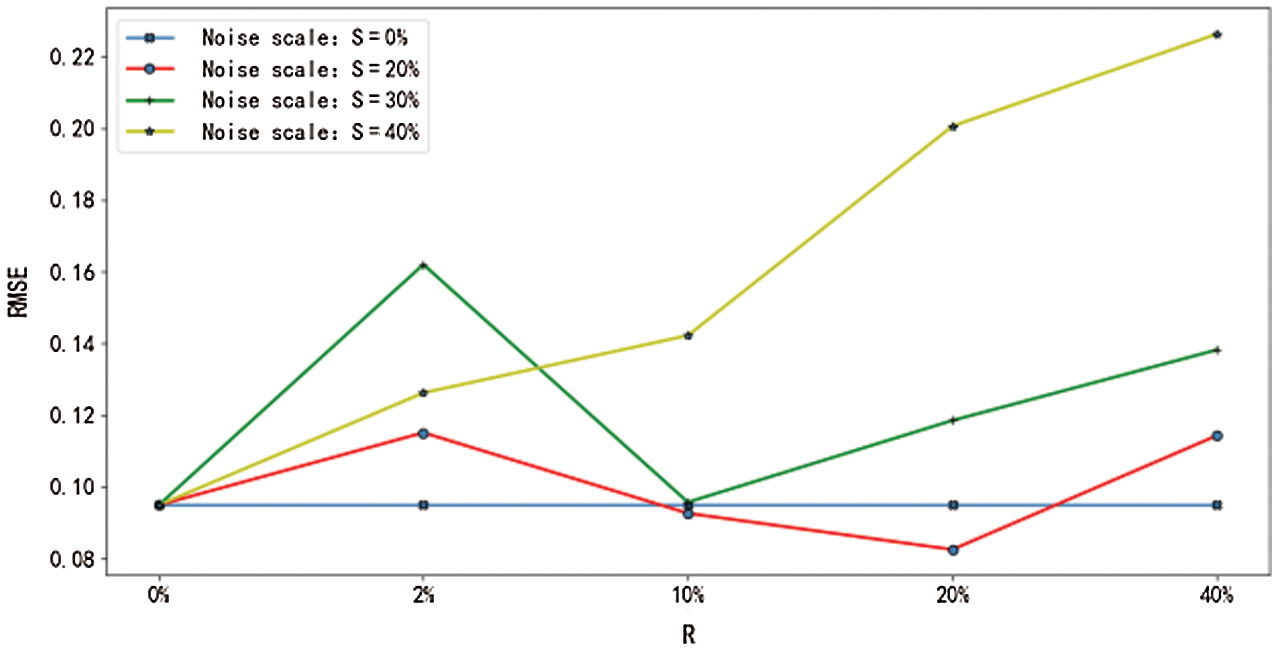
Figure 9: RMSE of mean values with noise
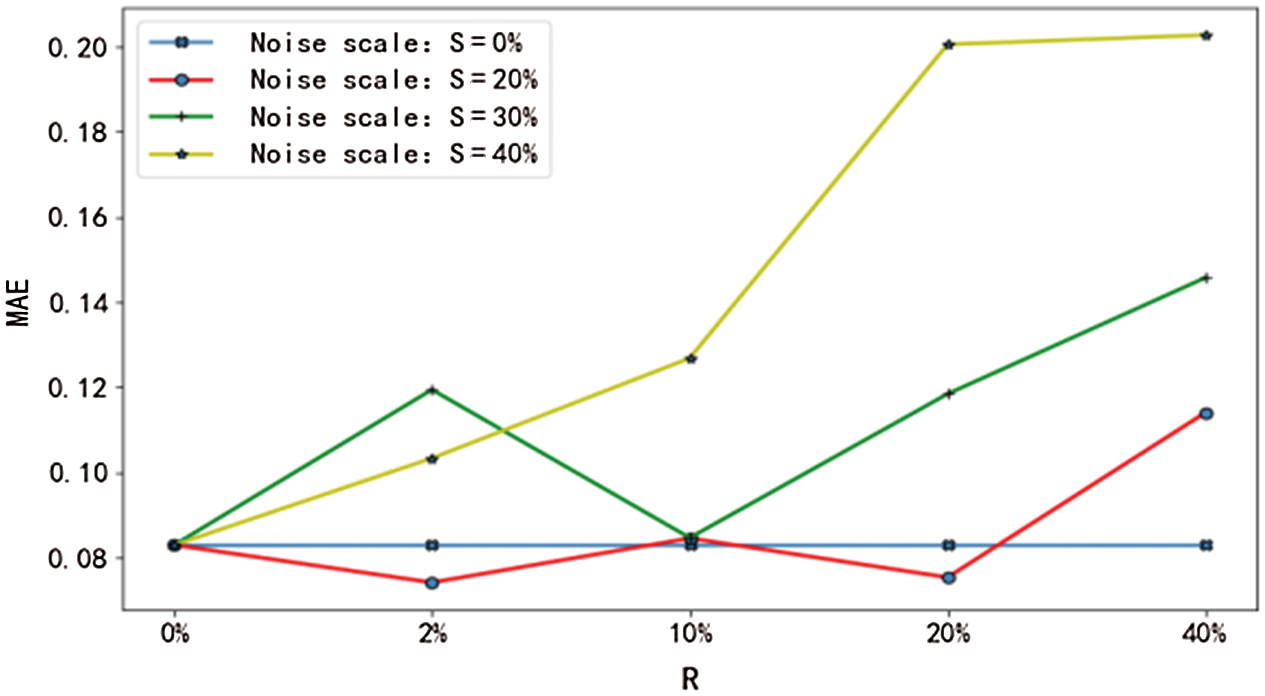
Figure 10: MAE of mean values with noise
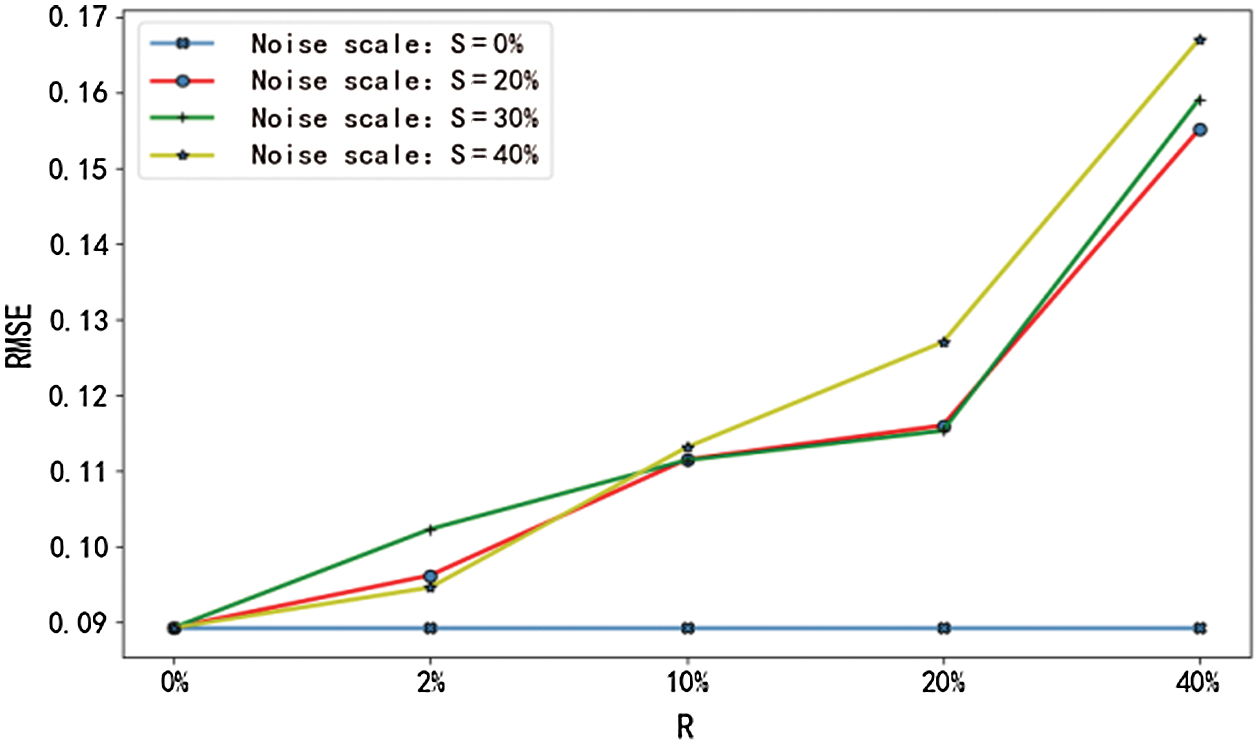
Figure 11: RMSE of median values with noise
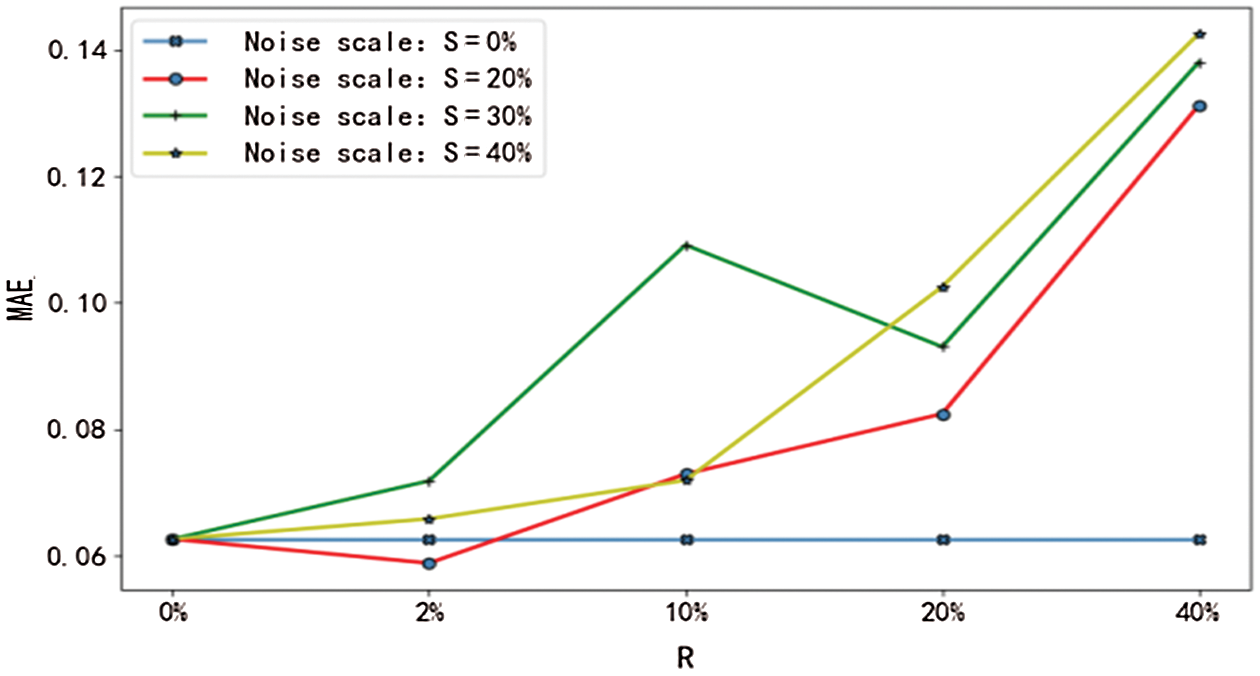
Figure 12: MAE of median values with noise
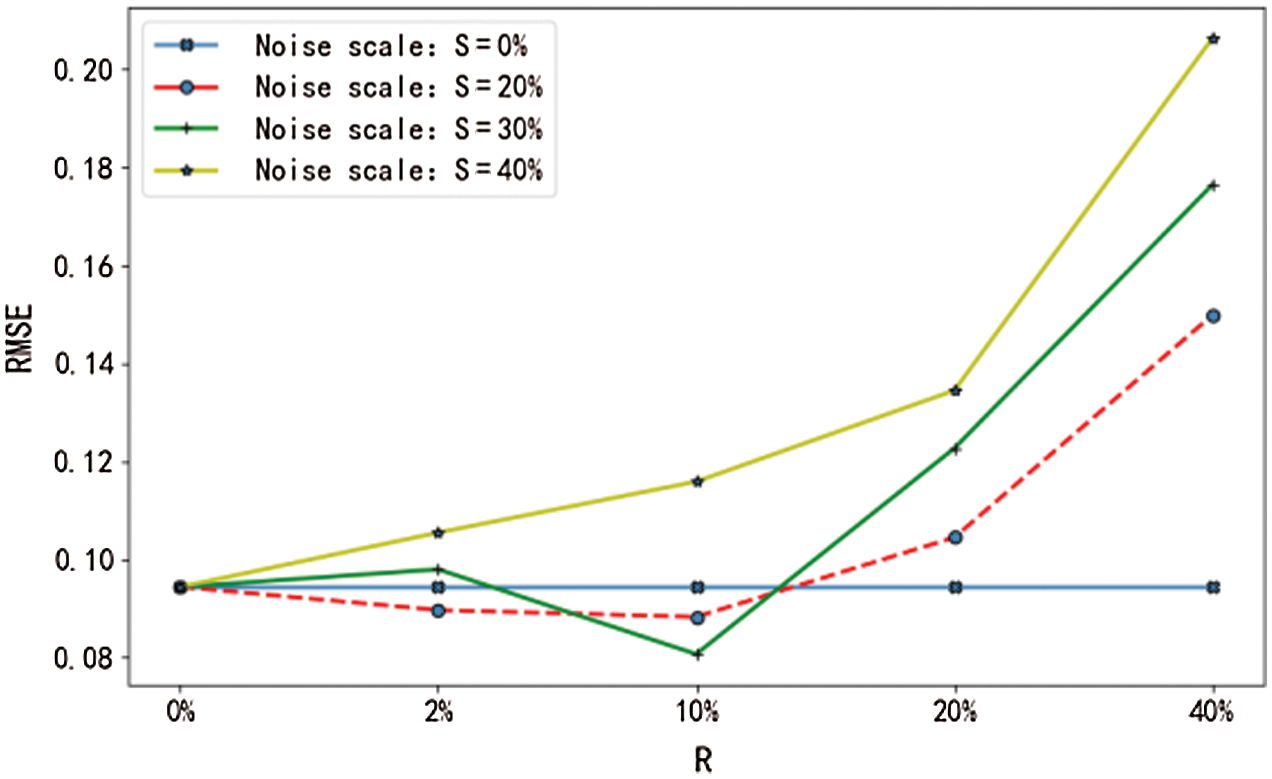
Figure 13: RMSE of maximum values with noise
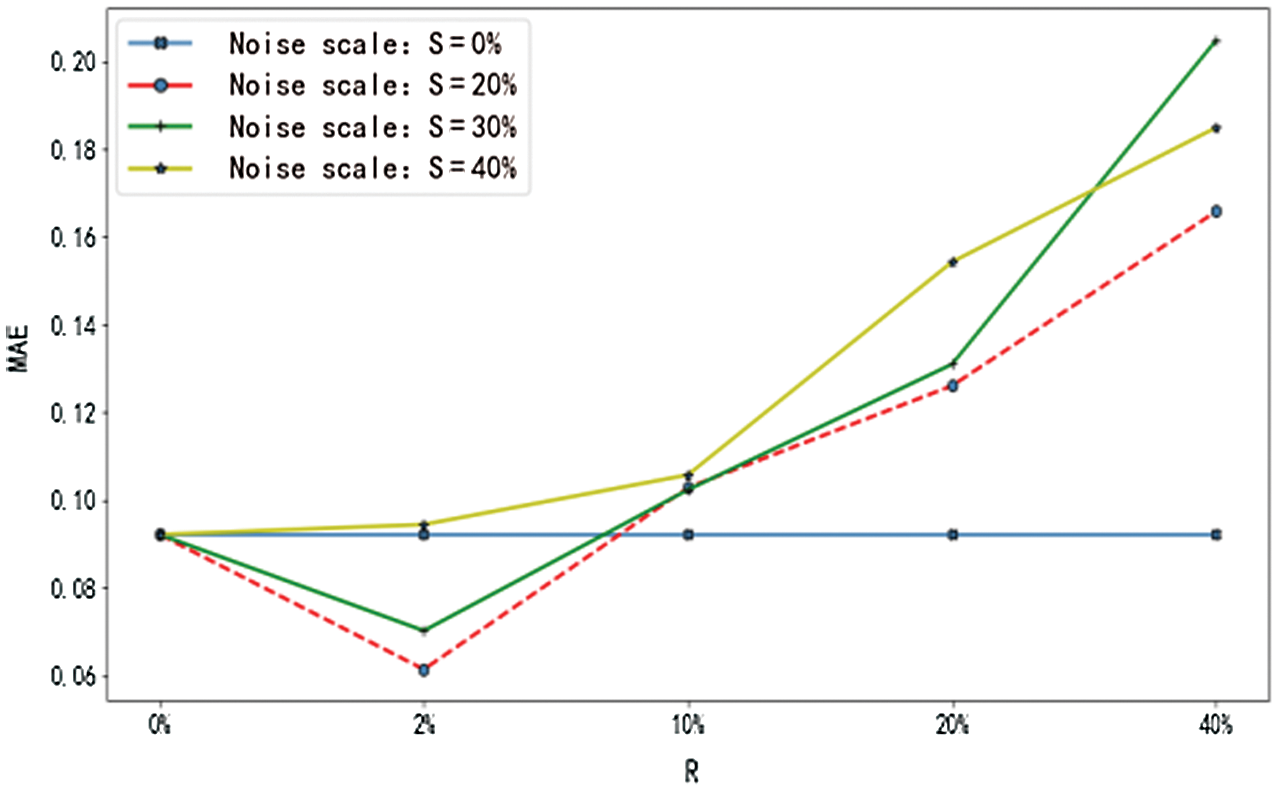
Figure 14: MAE of maximum values with noise

Figure 15: RMSE of minimum values with noise
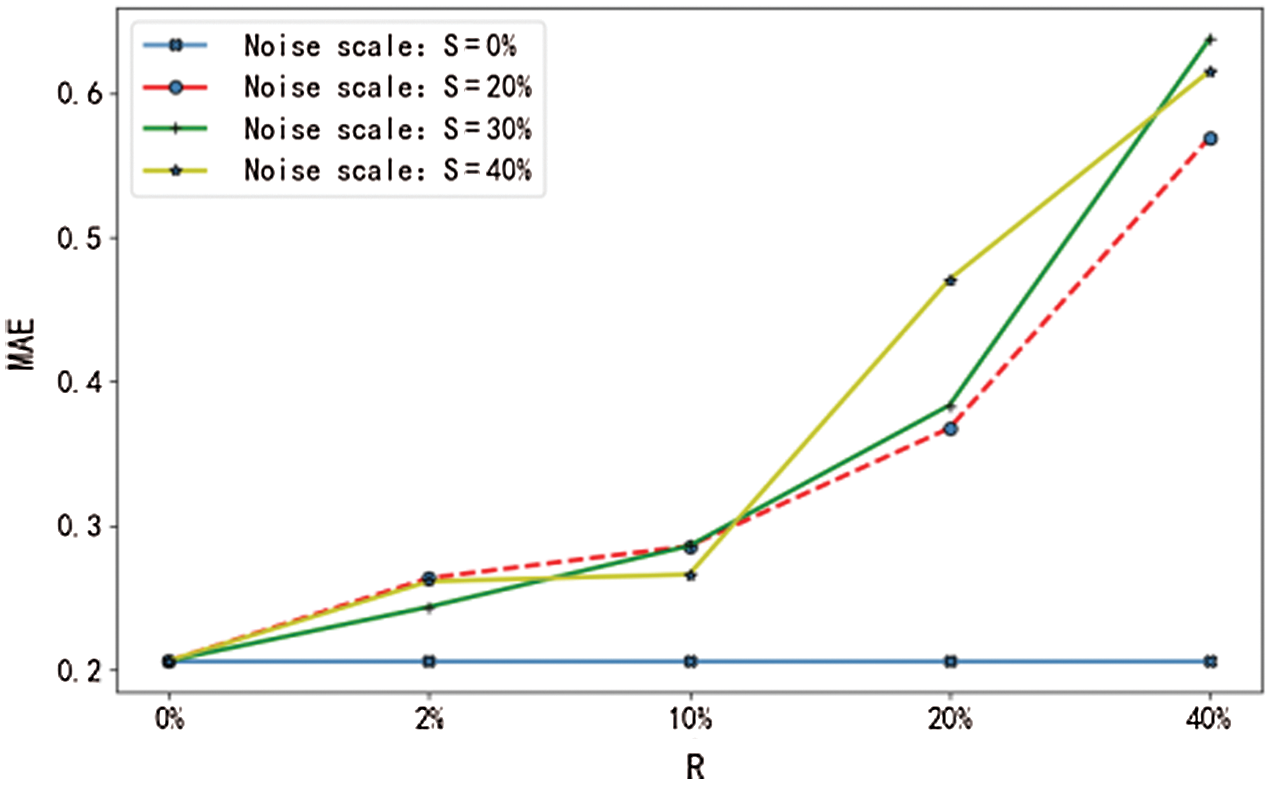
Figure 16: MAE of minimum values with noise
From Figs. 9–12, it can be seen that the RMSE and the MAE of the prediction results show an evident increasing trend when the upper bound of noise R>20%, irrespective of how much noise is added to the sample. That is to say, when the experimental data deviates from the actual value by 20%, the overall performance of the main factor selection algorithm will deteriorate, the error value of the network will increase significantly, the reliability of the prediction result will be reduced, and its stability will be affected. Therefore, it is necessary to prevent the data error from exceeding 20% of the actual value when the mean and the median are computed.
From Figs. 13–16, it can be seen that the RMSE and the MAE of the prediction results show an obvious increasing trend when the upper bound of noise R>10%, regardless of how much noise is added to the sample. That is to say, when the experimental data deviates from the actual value by 10%, the overall performance of the main factor selection algorithm will decline, the error value of the network will increase significantly, the reliability of the prediction result will be reduced, and its stability will be affected. Therefore, it is necessary to prevent data error from exceeding 10% of the actual values when the maximum and the minimum are computed.
Therefore, the algorithm proposed in this paper performs more consistently in computing the regional FDI statistics when the parameter data error of the regional FDI falls within the stable range of the actual value.
Based on variable selection and statistical theory, the main factor selection algorithm is applied to identify the main influencing factors in regional FDI statistics. Then, the regional FDI statistics examples obtained from central China are used to perform verification. Besides, the random noise data experiments are conducted on the characteristic data. Finally, the stability range of regional FDI prediction is determined for the six provinces in central China. According to the results, the algorithm is effective in identifying the main influencing factors in regional FDI. In addition, it is also revealed that the main influencing factors in different regional FDI statistics are quite different, indicating that the FDI statistics in regional economy are affected by different factors. Therefore it is necessary to formulate different policies as reference for the control and development of regional FDI statistics when FDI statistics change in the control area. The algorithm proposed in this paper is also applicable for other economic statistics.
Funding Statement: This project is supported by the National Key R&D Program of China under grant 2019YFE0122600; Open Fund of Centre for Innovation Research in Social Governance of Changsha University of Science and Technology under grant 2017ZXB07; National Social Science Foundation of China under grant16BKS024; Major projects of Hunan Social Science Fund under grant 16ZD02 and Hunan 13th five-year Education Planning Project under grant XJK19CGD011.
Conflicts of Interest: The authors declare that they have no conflicts of interest to report regarding the present study.
1. P. Lu, “Research on the relationship between economic globalization and regional economic integration,” Shanxi Agricultural Economics, vol. 21, pp. 19–20, 2018. [Google Scholar]
2. Q. Zeng, H. Wu and F. Liu, “New features of global economic pattern and significance of ‘Belt and Road’ initiative,” Research on Technical Economy and Management, vol. 8, pp. 113–117, 2018. [Google Scholar]
3. Y. Fang, “A study on the imbalance of regional economic development in China,” Productivity Research, vol. 7, pp. 69–72, 2020. [Google Scholar]
4. X. Li, Y. Wei and X. Liu, “Convergence or divergence? A literature review,” Economic Research Journal, vol. 7, no. 39, pp. 70–81, 2004. [Google Scholar]
5. Y. Wang, “Research on the gap between FDI and regional economic development of China based on grey relational theory,” Systems Engineering, vol. 30, no. 3, pp. 426–430, 2010. [Google Scholar]
6. T. Xu, F. Hong and L. Zhang, “A demonstration on influencing factors of FDI location choice: Based on co-integration and error correction model,” in Proc. of the 2010 Int. Conf. on Logistics Engineering and Intelligent Transportation Systems, pp. 1–4, 2010. [Google Scholar]
7. Z. Zhou, L. Deng, H. Xiao, S. Wu and W. Liu, “The impact of foreign direct investment on high-quality economic development in China-An analysis based on Index DEA and panel quantile regression,” Management Science in China, vol. 10, no. 4, pp. 1–12, 2020. [Google Scholar]
8. S. Lu and M. Xin, “An empirical study on regional influencing factors of FDI and countermeasures in liaoning province,” in Proc. of the 2010 Int. Conf. on Management Science & Engineering 17th Annual Conf. Proc., pp. 859–864, 2010. [Google Scholar]
9. H. Y. Li and D. M. Li, “An empirical study of influencing factors of absorbing FDI in Henan,” in Proc. of the 2011 Int. Conf. on E-Business and E-Government (ICEEpp. 1–3, 2011. [Google Scholar]
10. W. Zhou, “The effect of the driving factors of Jingjinji industry transfer on FDI,” Statistics and Decision Making, vol. 36, no. 17, pp. 110–114, 2020. [Google Scholar]
11. B. Zhou and H. Shao, “FDI, financial development and regional economic growth: A spatial econometric analysis based on provincial panel data,” Economic Restructuring, vol. 4, pp. 150–157, 2020. [Google Scholar]
12. Z. Zhou, J. H. Qin, X. Y. Xiang, Y. Tan, Q. Liu et al., “News text topic clustering optimized method based on TF-IDF algorithm on spark,” Computers, Materials & Continua, vol. 62, no. 1, pp. 217–231, 2020. [Google Scholar]
13. Z. He, “Building a nest to attract a phoenix: Infrastructure and foreign direct investment,” Modern Management Science, vol. 12, pp. 45–47, 2017. [Google Scholar]
14. Z. D. Wang, J. H. Qin, X. Y. Xiang and Y. Tan, “A privacy-preserving and traitor tracking content-based image retrieval scheme in cloud computing,” Multimedia Systmes, 2021. [Google Scholar]
15. T. Q. Zhou, B. Xiao, Z. P. Cai and M. Xu, “A utility model for photo selection in mobile crowd sensing,” IEEE Transactions on Mobile Computing, vol. 20, no. 1, pp. 48–62, 2021. [Google Scholar]
16. T. Xu, M. Zhao, X. Yao and K. He, “An adjust duty cycle method for optimized congestion avoidance and reducing delay for WSNS,” Computers Materials & Continua, vol. 65, no. 2, pp. 1605–1624, 2020. [Google Scholar]
17. Q. Liu, X. Y. Xiang, J. H. Qin, Y. Tan, J. S. Tan et al., “Coverless steganography based on image retrieval of DenseNet features and DWT sequence mapping,” Knowledge-Based Systems, vol. 192, pp. 105375–105389, 2020. [Google Scholar]
18. S. Yu and J. Zhang, “Lasso-based study on the factors influencing foreign direct investment,” Journal of the Hunan University (Social Science Edition), vol. 28, no. 2, pp. 53–56, 2014. [Google Scholar]
19. J. Li and C. Xin, “Economic growth effect and regional heterogeneity of foreign direct investment,” Urban Problem, vol. 4, pp. 51–61, 2020. [Google Scholar]
20. W. T. Ma, J. H. Qin, X. Y. Xiang, Y. Tan and Z. B. He, “Searchable encrypted image retrieval based on multi-feature adaptive late-fusion,” Mathematics, vol. 8, no. 1019, pp. 1–15, 2020. [Google Scholar]
21. L. Y. Xiang, S. H. Yang, Y. H. Liu, Q. Li and C. Z. Zhu, “Novel linguistic steganography based on character-level text generation,” Mathematics, vol. 8, pp. 1558, 2020. [Google Scholar]
22. H. Zou, “The adaptive lasso and its oracle properties,” Journal of the American Statistical Association, vol. 101, no. 476, pp. 1418–1429, 2006. [Google Scholar]
23. X. Liang, Y. Luo and D. Peng, “Comprehensive evaluation of industrial carrying capacity in central China,” Finance and Economics, vol. 7, pp. 91–96, 2020. [Google Scholar]
24. Y. J. Luo, J. H. Qin, X. Y. Xiang and Y. Tan, “Coverless image steganography based on multi-object recognition,” IEEE Transactions on Circuits and Systems for Video Technology, 2021. [Google Scholar]
 | This work is licensed under a Creative Commons Attribution 4.0 International License, which permits unrestricted use, distribution, and reproduction in any medium, provided the original work is properly cited. |