DOI:10.32604/iasc.2021.018577
| Intelligent Automation & Soft Computing DOI:10.32604/iasc.2021.018577 | |
| Article |
A Shadowed Rough-fuzzy Clustering Algorithm Based on Mahalanobis Distance for Intrusion Detection
1School of Artificial Intelligence, Nanjing University of Information Science and Technology, Nanjing, 210044, China
2Southern Marine Science and Engineering Guangdong Laboratory (Zhuhai), Zhuhai, 519080, China
3School of Electronic and Information Engineering, Nanjing University of Information Science and Technology, Nanjing, 210044, China
4School of Computer and software, Nanjing University of Information Science and Technology, Nanjing, 210044, China
5International Business Machines Corporation (IBM), New York, NY, 10504, USA
*Corresponding Author: Lina Wang. Email: wangln@nuist.edu.cn
Received: 12 March 2021; Accepted: 23 April 2021
Abstract: Intrusion detection has been widely used in many application domains; thus, it has caught significant attention in academic fields these years. Assembled with more and more sub-systems, the network is more vulnerable to multiple attacks aiming at the network security. Compared with the other issues such as complex environment and resources-constrained devices, network security has been the biggest challenge for Internet construction. To deal with this problem, a fundamental measure for safeguarding network security is to select an intrusion detection algorithm. As is known, it is less effective to determine the abnormal behavior as an intrusion and learn the entire scope of the normal behavior with the traditional anomaly-based algorithm for Internet intrusion detection. In this paper, we propose an intrusion-detecting algorithm of shadowed rough-fuzzy clustering based on Mahalanobis distance, named MSRFCM. It adopts dissimilarity measurement of Mahalanobis distance to identify the relevant variables that significantly influence the clustering performance and reduce the error rate in the process of partitioning clusters with high attribute correlation. And shadowed rough-fuzzy clustering (SRFCM) is applied to obtaining real value-approaching prototypes based on iteration and partitioning the data set into more meaningful clusters. Through simulation with the NSL-KDD intrusion data set and three other intrusion data sets, the Mahalanobis distance-based shadowed rough-fuzzy clustering algorithm has improved performance in intrusion detection.
Keywords: Intrusion detection; security; SRFCM; FCM; Mahalanobis distance
As network technologies develop, the network environment becomes more complex, and more systems are vulnerable to intrusion attacks. With the rapid development of Internet environments, there is an increasing demand for securing all kinds of internet environments [1–5]. Data mining algorithms have recently been applied to network intrusion detection [6–8]. Data mining-based network intrusion detection technologies differ from others due to their data-centric models, regarding intrusion detection as a procedure for analyzing and processing massive security audit records. The clustering technique plays an important role in data analysis and interpretation as it gains insight into the nature of the data pattern by discovering hidden structures in it. Fuzzy c-means clustering algorithm (FCM) is widely used in intrusion detection, and it categorizes similar samples (patterns) into clusters, but it is an approach somewhat unsatisfactory for intrusion detection processing due to its inconsistent outcomes and liability to a local minimum, and subsequently leading to low detection rate [9–11]. In view of these restrictions and its sensitiveness to the existence of noisy data, a rough fuzzy clustering algorithm (RFCM) is proposed, incorporating fuzzy sets to capture uncertainty associated with the samples [12,13]. RFCM methods, however, need to optimize two sets of parameters to achieve the best clustering objective best at each iterative step. The experiment has been implemented using GAs to tune the weighted coefficient and threshold parameter by minimizing a fitness function based on certain clustering validity indices [14]. In order to disambiguate and capture the essence of a distribution, the concept of shadowed sets has been introduced in the literature, such as work by Pedrycz [15,16].To ensure a more logical selection of threshold parameters, a shadowed rough-fuzzy c-means clustering (SRFCM) was proposed to automatically select a threshold parameter [17], where all clustered patterns are placed into three categories: complete belongingness (core level), complete exclusion (exclusion level), and unknown (boundary level), assuming a particular perspective built by an optimization process. A series of rough fuzzy clustering algorithms based on shadowed sets have been proposed by some scholars [18–20].
The definitions of dissimilarity measures can also improve the clustering algorithm. All of the above algorithms apply the Euclidean distance to measure the dissimilarity between two samples without considering the difference of each attribute’s relative importance. Mahalanobis distance [21] is introduced to the algorithm that neither sample attributes coupling nor actual dimension is taken into consideration in the cluster partitioning process. Since it accounts for unequal variance as well as correlations between attributes, it adequately evaluates the distance by assigning different weights or import factors to the attributes of samples. In addition, Mahalanobis distance can be used to readjust the geometric distribution of patterns so as to reduce the distance of similar patterns, which can prevent increasing the error rate of Euclidean distance in calculating high attribute correlation of data sets, when the sample distribution follows Gauss distribution [22]. Subsequently, a Mahalanobis distance-based fuzzy clustering algorithm (MFCM) is proposed, by using Mahalanobis distance instead of Euclidean distance in traditional FCM clustering [23,24]. The MFCM algorithm’s accuracy increases obviously when dealing with the data sets with high attribute correlation and can effectively resolve the deficiency with FCM to induce aspheric clusters. It will be an issue of singularity when the calculation of Mahalanobis distance involves the inversion of the covariance matrix. In this case, eigenvalue, eigenvector and pseudo-inverse operations are utilized to deal with it.
To improve intrusion detection performance, a shadowed rough-fuzzy clustering intrusion detection algorithm based on Mahalanobis distance (MSRFCM) is proposed. In this research, the SRFCM algorithm is applied to obtain real value-approaching prototypes at iteration and partition the data set into more meaningful clusters. Besides, the dissimilarity measurement of Mahalanobis distance is utilized to identify the relevant variables that have a significant influence on clustering performance and reduce the error rate in the partitioning cluster process with high attribute correlation. The feasible solution for better clustering results is provided by integrating Mahalanobis distance with shadowed rough-fuzzy clustering. Four intrusion data sets known as NSL-KDD, AWID, UNSW-NB 15, and CICIDS-2017, are employed for experimental purposes regarding intrusion detection in computer networks [25]. Experiments on these data sets demonstrate that MSRFCM, the novel algorithm, has improved the intrusion detection performance using validity indices including Recall, Precision, and F1 score.
Organization of the paper is as follows. Section 2 provides the shadowed rough-fuzzy clustering algorithm. Section 3 discusses a Mahalanobis distance-based dissimilarity measure. The proposed algorithm is elaborated in Section 4. Experimental analysis is made to validate the advantage of the algorithm in Section 5. Finally, Section 6 concludes the study and highlights potential future work.
2 Shadowed Rough-Fuzzy Clustering
In 1982, a Polish scholar Z. Pawlak put forward a rough set theory–a mathematical tool for describing incompleteness and uncertainty. It provides an effective approach to analyzing inconsistent, inaccurate, and other incomplete information and also functions in data analysis and reasoning to reveal rules hidden behind patterns. The rough set is characterized by its upper bound
Property 1: A sample can belong to the lower bound of one cluster at most.
Property 2: A sample that belongs to the lower bound of a cluster also belongs to the upper bound of the same cluster.
Property 3: A sample that does not belong to any lower bound belongs to more than one upper bounds.
The shadowed set is an improvement of fuzzy set through information simplification and retention of key fuzzy information. In shadowed sets, three quantification levels describing the elements of the set 0, 1, and [0,1], are utilized to simplify the fuzzy relation. Conceptually, shadowed sets are close to rough sets even though the mathematical foundations are very different. The concepts of the negative region, lower bound, and boundary region correspond to three logical values 0, 1, and [0,1] in shadowed sets, namely, excluded, included and uncertain, respectively. The unknown is formally termed shadowed region.
In shadowed sets theory, the threshold parameter is automatically obtained from fuzzy membership partition to determine the approximation regions for each cluster. The construction of shadowed sets is based on balancing the uncertainty that is inherently associated with fuzzy set. By elevating membership values of some regions of the universe to 1, and at the same time, reducing membership values of some regions of the universe to 0, we can eliminate the uncertainty in these regions. In order to balance the total uncertainty regions, it needs to compensate for these changes by allowing for the emergence of uncertain regions, namely shadowed sets. The main merits of shadowed sets involve the optimization mechanism for choosing the threshold and the burden reduction of the plain numeric computations.
Assuming X is a data set and
where
Based on the obtained threshold
Further, the boundary region is calculated with Eq. (4).
Subsequently, the SRFCM algorithm is constructed to respond to the above discussions. Suppose these samples are classified as c and
where
where
The iteration of the fuzzy membership is denoted with Eq. (7).
The specific steps of SRFCM algorithm are as follows.
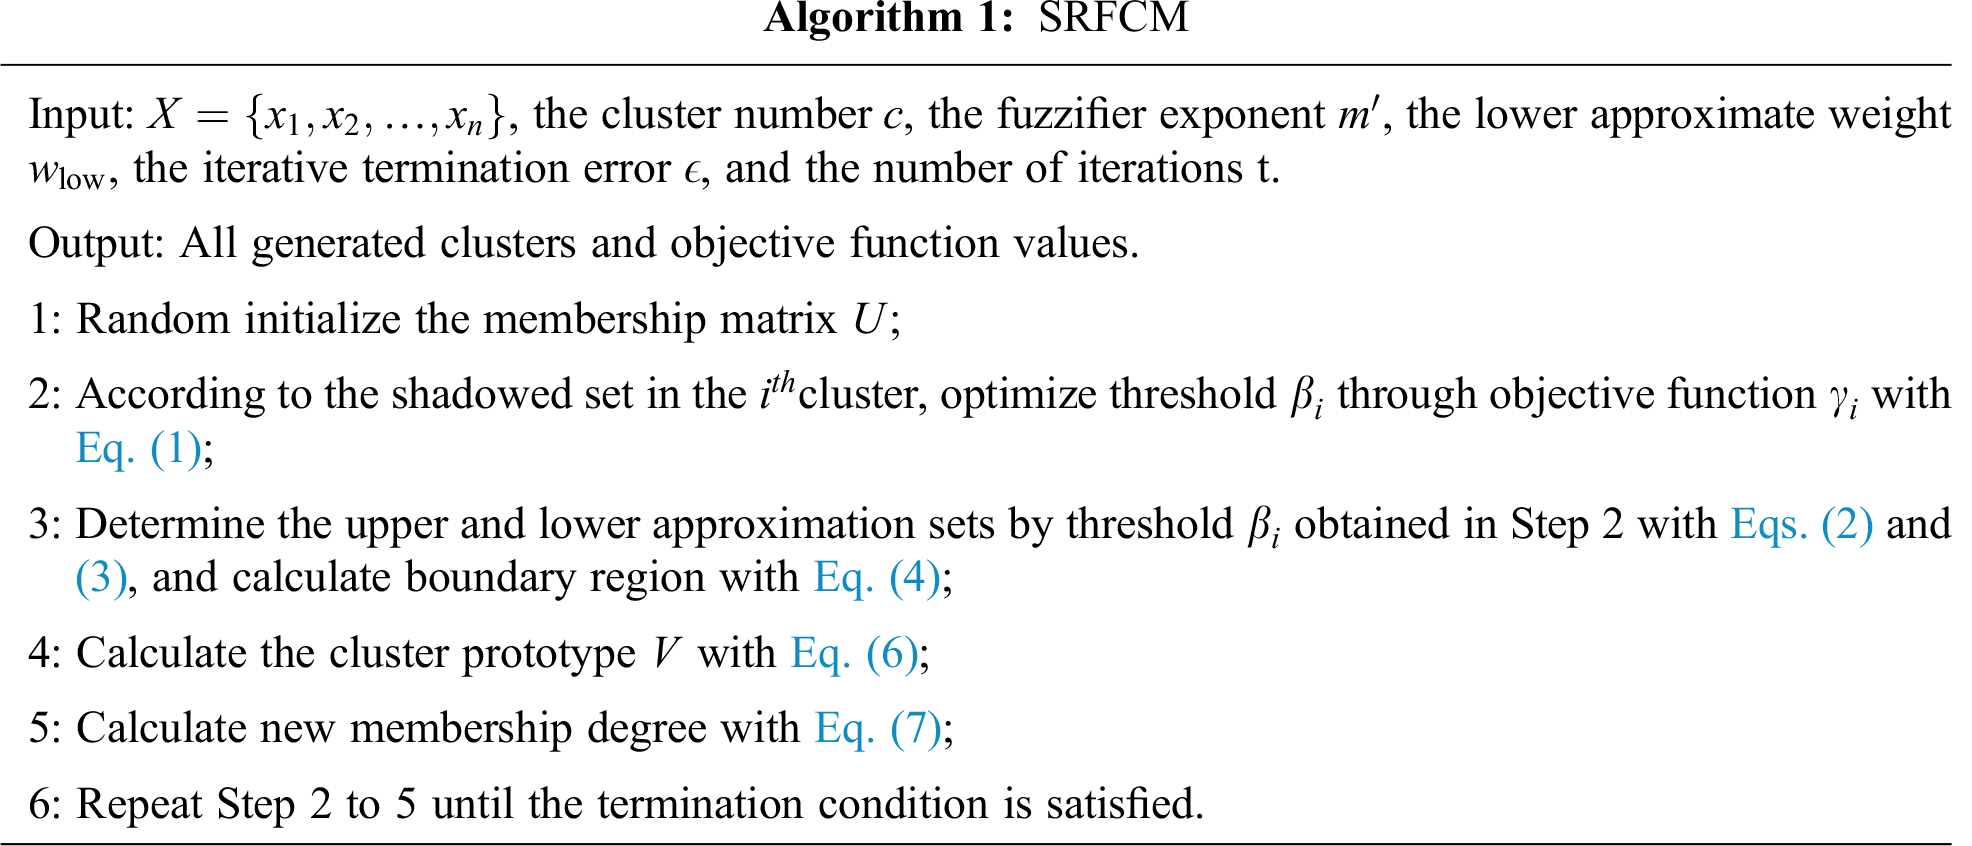
As the presence of approximated patterns between upper and lower bounds, the identification of normal or abnormal patterns in the boundary region is dilemmatic. For comparative analysis of a series of different algorithms, the maximal calculated value of membership degree decides the pattern to a certain cluster in SRFCM algorithm. Simulation experiments show that the definition
Calculating Mahalanobis distance involves the inverse of a covariance matrix
Define
The sample mean vector
The sample covariance matrix
where
The sample inner product matrix
And the centered matrix
where
Meanwhile,
where
To obtain
In Eq. (13),
If the sample is non-linear separable, then its non-linear mapping is employed into a high-dimensional feature space. To avoid explicitly defining the non-linear mapping, a kernel function can be used to replace the inner product in the feature space [28]. At this point, for the inner product matrix
The empirical kernels of sample
The distance can be calculated through the inner product expressed by the kernel function without involving any non-linear mapping. It should also be noted that the pseudo-inverse matrix of the covariance is related to the inner product matrix, which is no longer related to the dimension of the eigenvector but to the number of samples. Therefore, it brings computational advantages in high-dimensional space.
There are two operations to solve the inverse matrix of the covariance matrix. If the sample is linearly separable, an inner product matrix operation is applied directly. Otherwise, given
4 Mahalanobis Distance-Based Shadowed Rough-Fuzzy Clustering Algorithm
4.1 Mahalanobis Distance-based Fuzzy Clustering
On the basis of classical FCM objective function, Euclidean distance is replaced by Mahalanobis distance, and a covariance adjusting factor
Its constraint condition is
Then, the operator is minimized, the partial derivative of
From
From
MFCM algorithm takes the following steps.

The maximal value of the calculated membership degree decides the pattern to a certain cluster in MFCM algorithm. Mahalanobis distance is adopted to identify the relevant variables that significantly influence the clustering performance and reduce the error rate in the process of partitioning clusters with high attribute correlation.
4.2 Mahalanobis Distance-based Shadowed Rough-Fuzzy Clustering
Considering Mahalanobis distance, this paper proposes a shadowed rough-fuzzy clustering algorithm based on Mahalanobis distance for attribute related. The lower bound, the boundary region and Mahalanobis distance in a cluster are also advantageous and beneficial to produce better prototypes and more effective cluster partition. The objective function
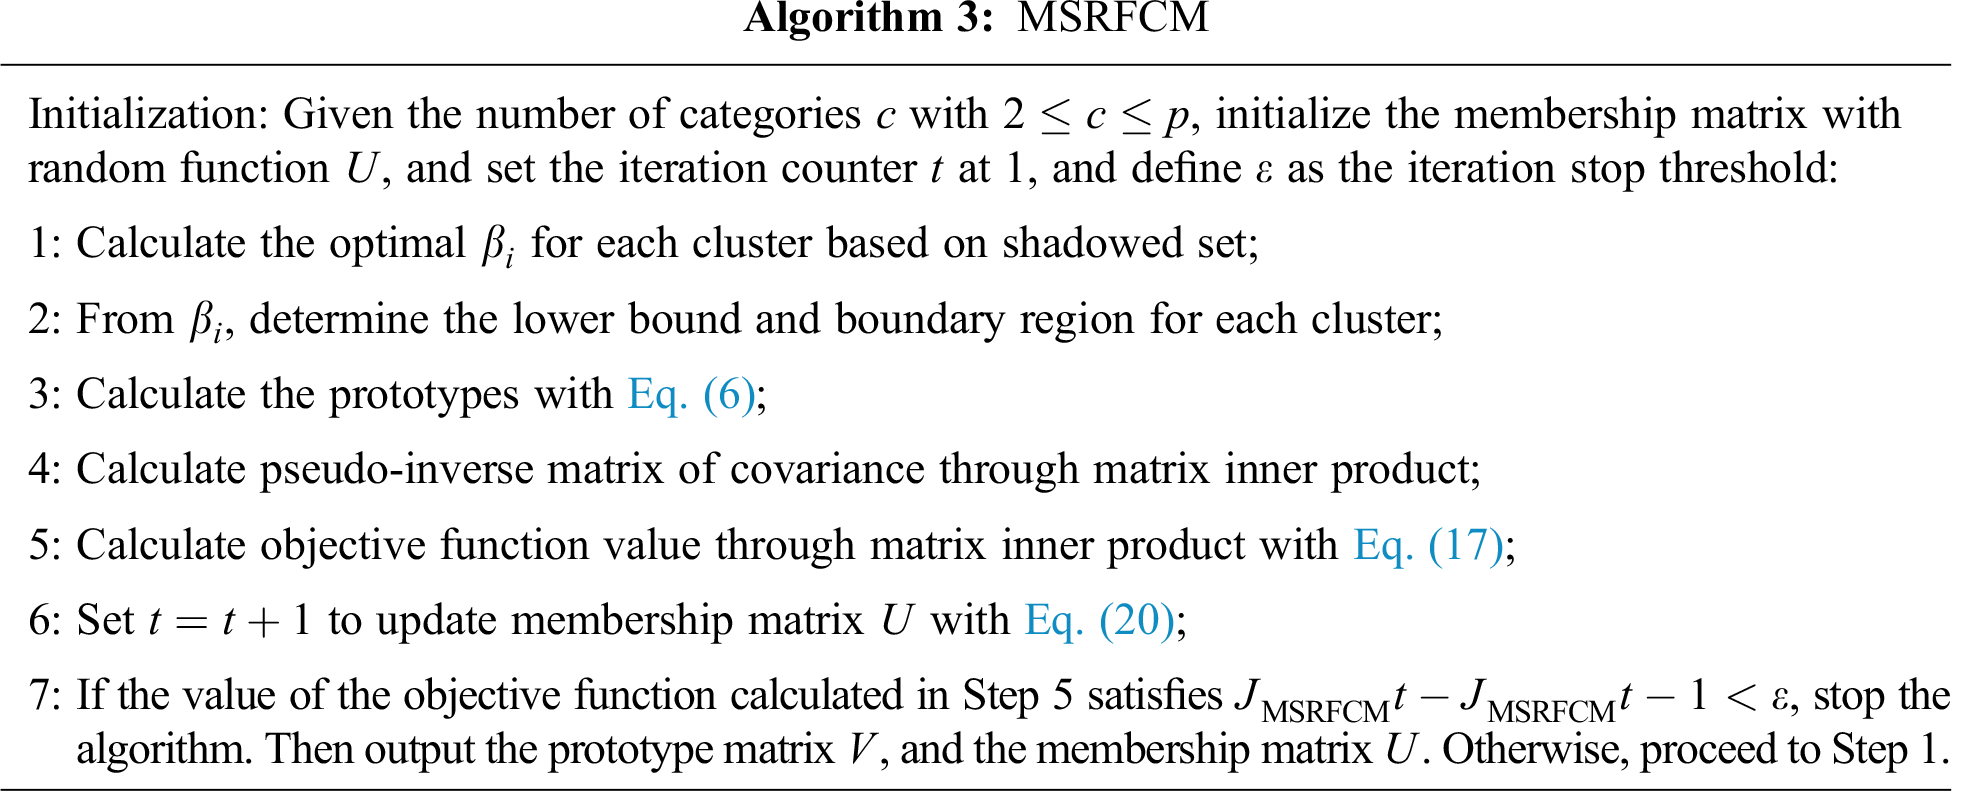
MSRFCM algorithm includes the following steps.
The experiments cover four intrusion data sets and intrusion detection clustering with FCM, SRFCM, MFCM, and MSRFCM. Matlab programming is used with initial parameters of all algorithms consistent with that of FCM algorithm. All intrusion detection experiments extract three subsets, each with a sample capacity of 2000 (including 1900 normal data and 100 abnormal attack data).
NSL-KDD is a modified version of the KDD CUP99, with some redundant traffic removed and imbalanced clusters structure improved. This data set was simulated using artificial data and generated in a closed network, where some of the networks involve proprietary network traffic with manual injected attacks. Among this data set, the training set includes 125,973 data records, and each record contains a class label attribute with a tag value of normal or attack, with nine discrete attributes and 32 continuous digital attributes, totaling 42. These types of attacks can be divided into four categories: Probing, DoS, U2R, and R2L.
The attributes in NSL-KDD data set include different data types. Direct experiment on raw data sets is inefficient and may influence the desirable outcome production. Therefore, data preprocessing is essential. All 42 attributes are selected for this experiment.
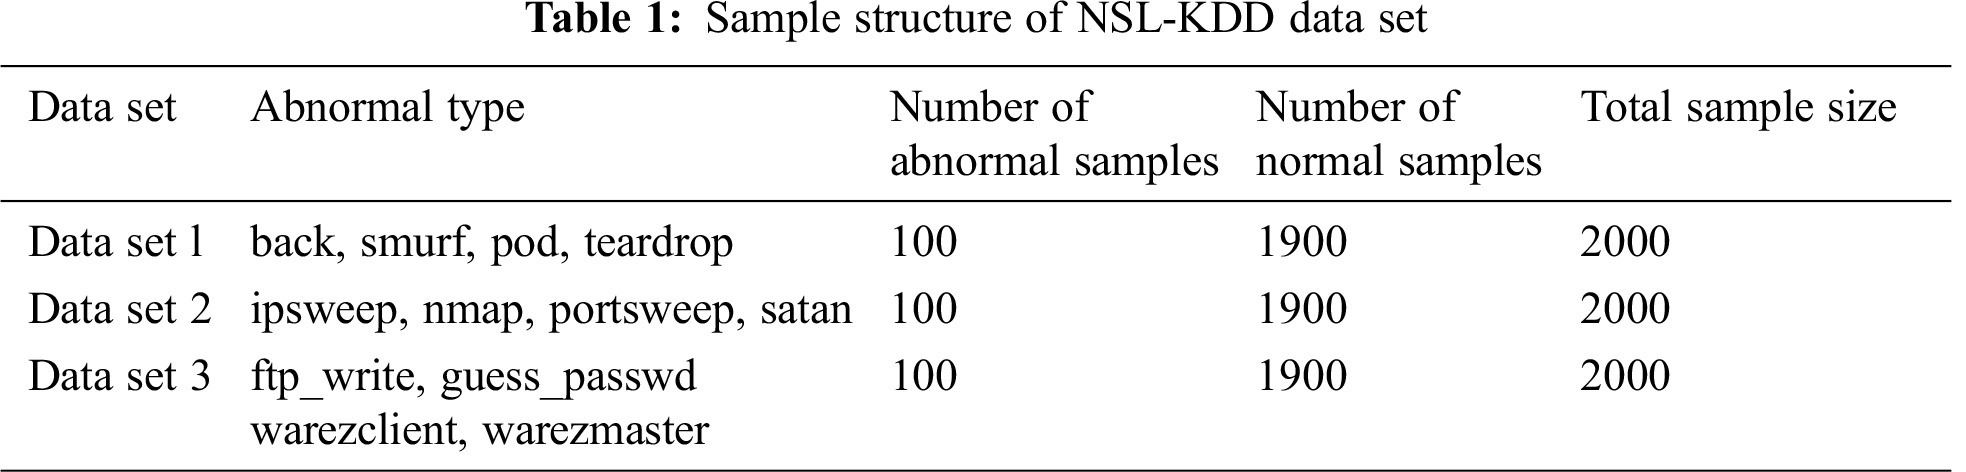
The three data subsets are selected from NSL-KDD data set, and the abnormal sample size of each set accounts for 5% of the total only. The overwhelming majority of normal data over intrusive data makes them valid for experiments. The sample structure is shown in Tab. 1 where different data sets have a respective abnormal type. Each sampled data set corresponds to respective attack type: DOS attack involving back, smurf, pod, and teardrop to data set 1; Probing attack involving ipsweep, nmap, portsweep, and satan to data set 2; and R2L attack involving ftp_write, guess_passwd, warezclient, and warezmaster to data set 3. As a small number of intrusion data related to the U2R attack type, such abnormal data with this attack type is not involved in this discussion.
The normalization process should apply to samples due to the great differences among the attributes of the records in the experimental data sets, so as to standardize the samples with different order of magnitude. Eq. (21) states the specific normalization process:
where
Some indices, such as anomaly detection rate (Recall), Precision, and F1 score, are often used in evaluating the effectiveness of intrusion detection, as defined by Eqs. (22)–(24). Accuracy is also taken into consideration in Eq. (25).
All the above indexes are used in the evaluation of network intrusion detection. Generally, the larger the value of Recall is, the more the intrusion data are detected. However, if more intrusion data are detected at the cost of more normal data misjudged as abnormal data, the corresponding detection performance may become worse. To thoroughly evaluate the intrusion detection performance, F1 score is put forward based on Precision and Recall. The higher the F1 score, the more effective intrusion detection.
Experiments are simulated by using the four algorithms, FCM, SRFCM, MFCM, and MSRFCM, in three subsets. The distribution of subsets and the clustering results are shown in Figs. 1–6, with their 23rd, 31st and 36th attributes where green and blue samples in the three data sets represent intrusion data and normal data, respectively.
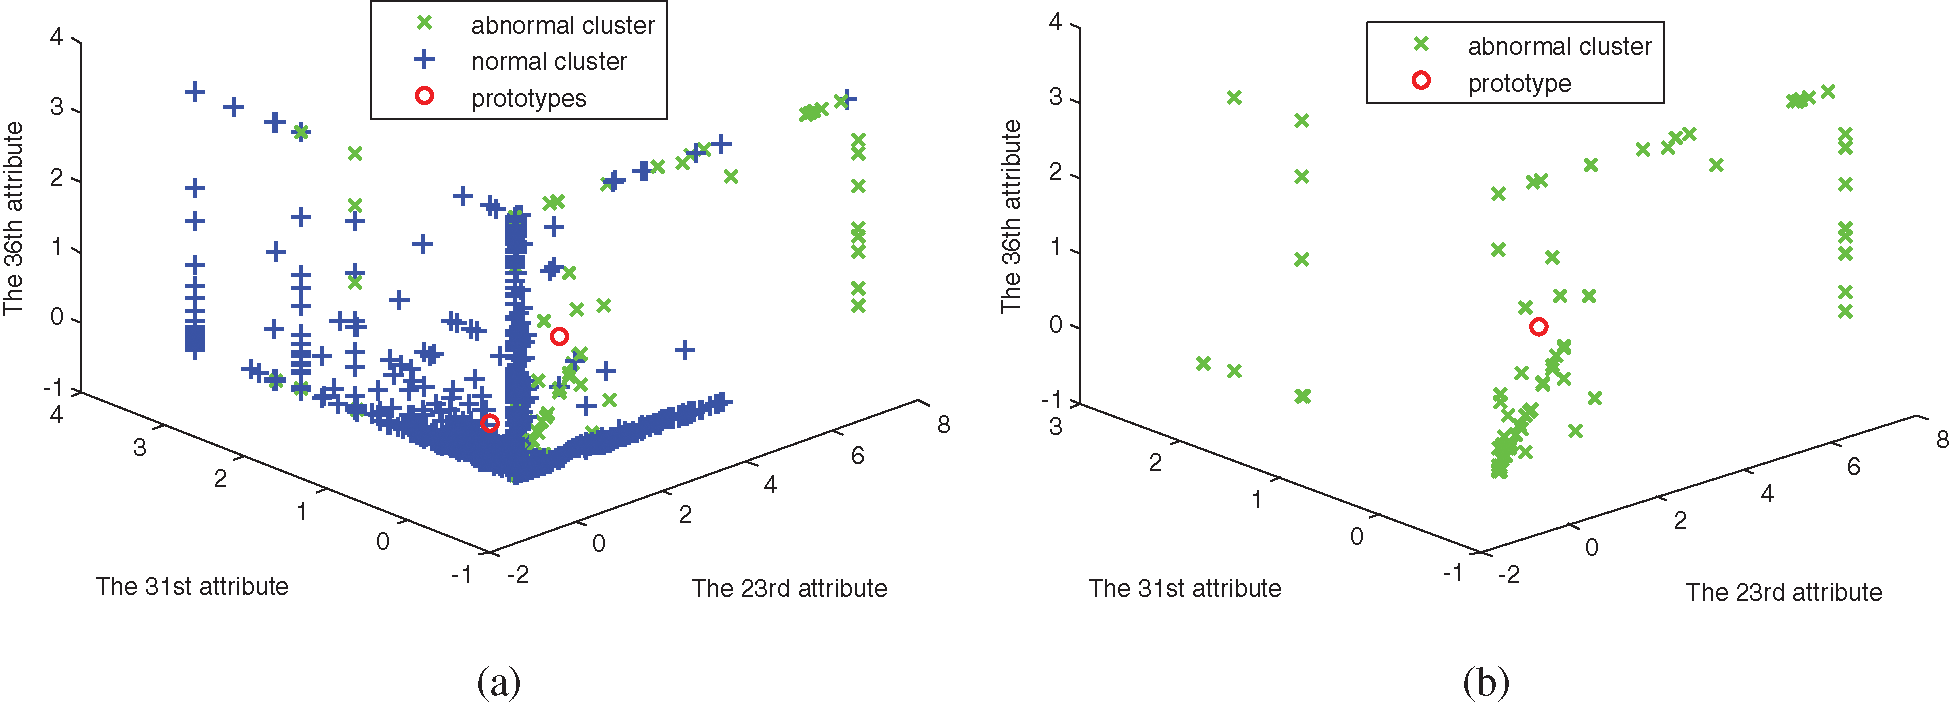
Figure 1: The distribution of data set 1. (a) Abnormal and normal clusters, (b) Abnormal cluster
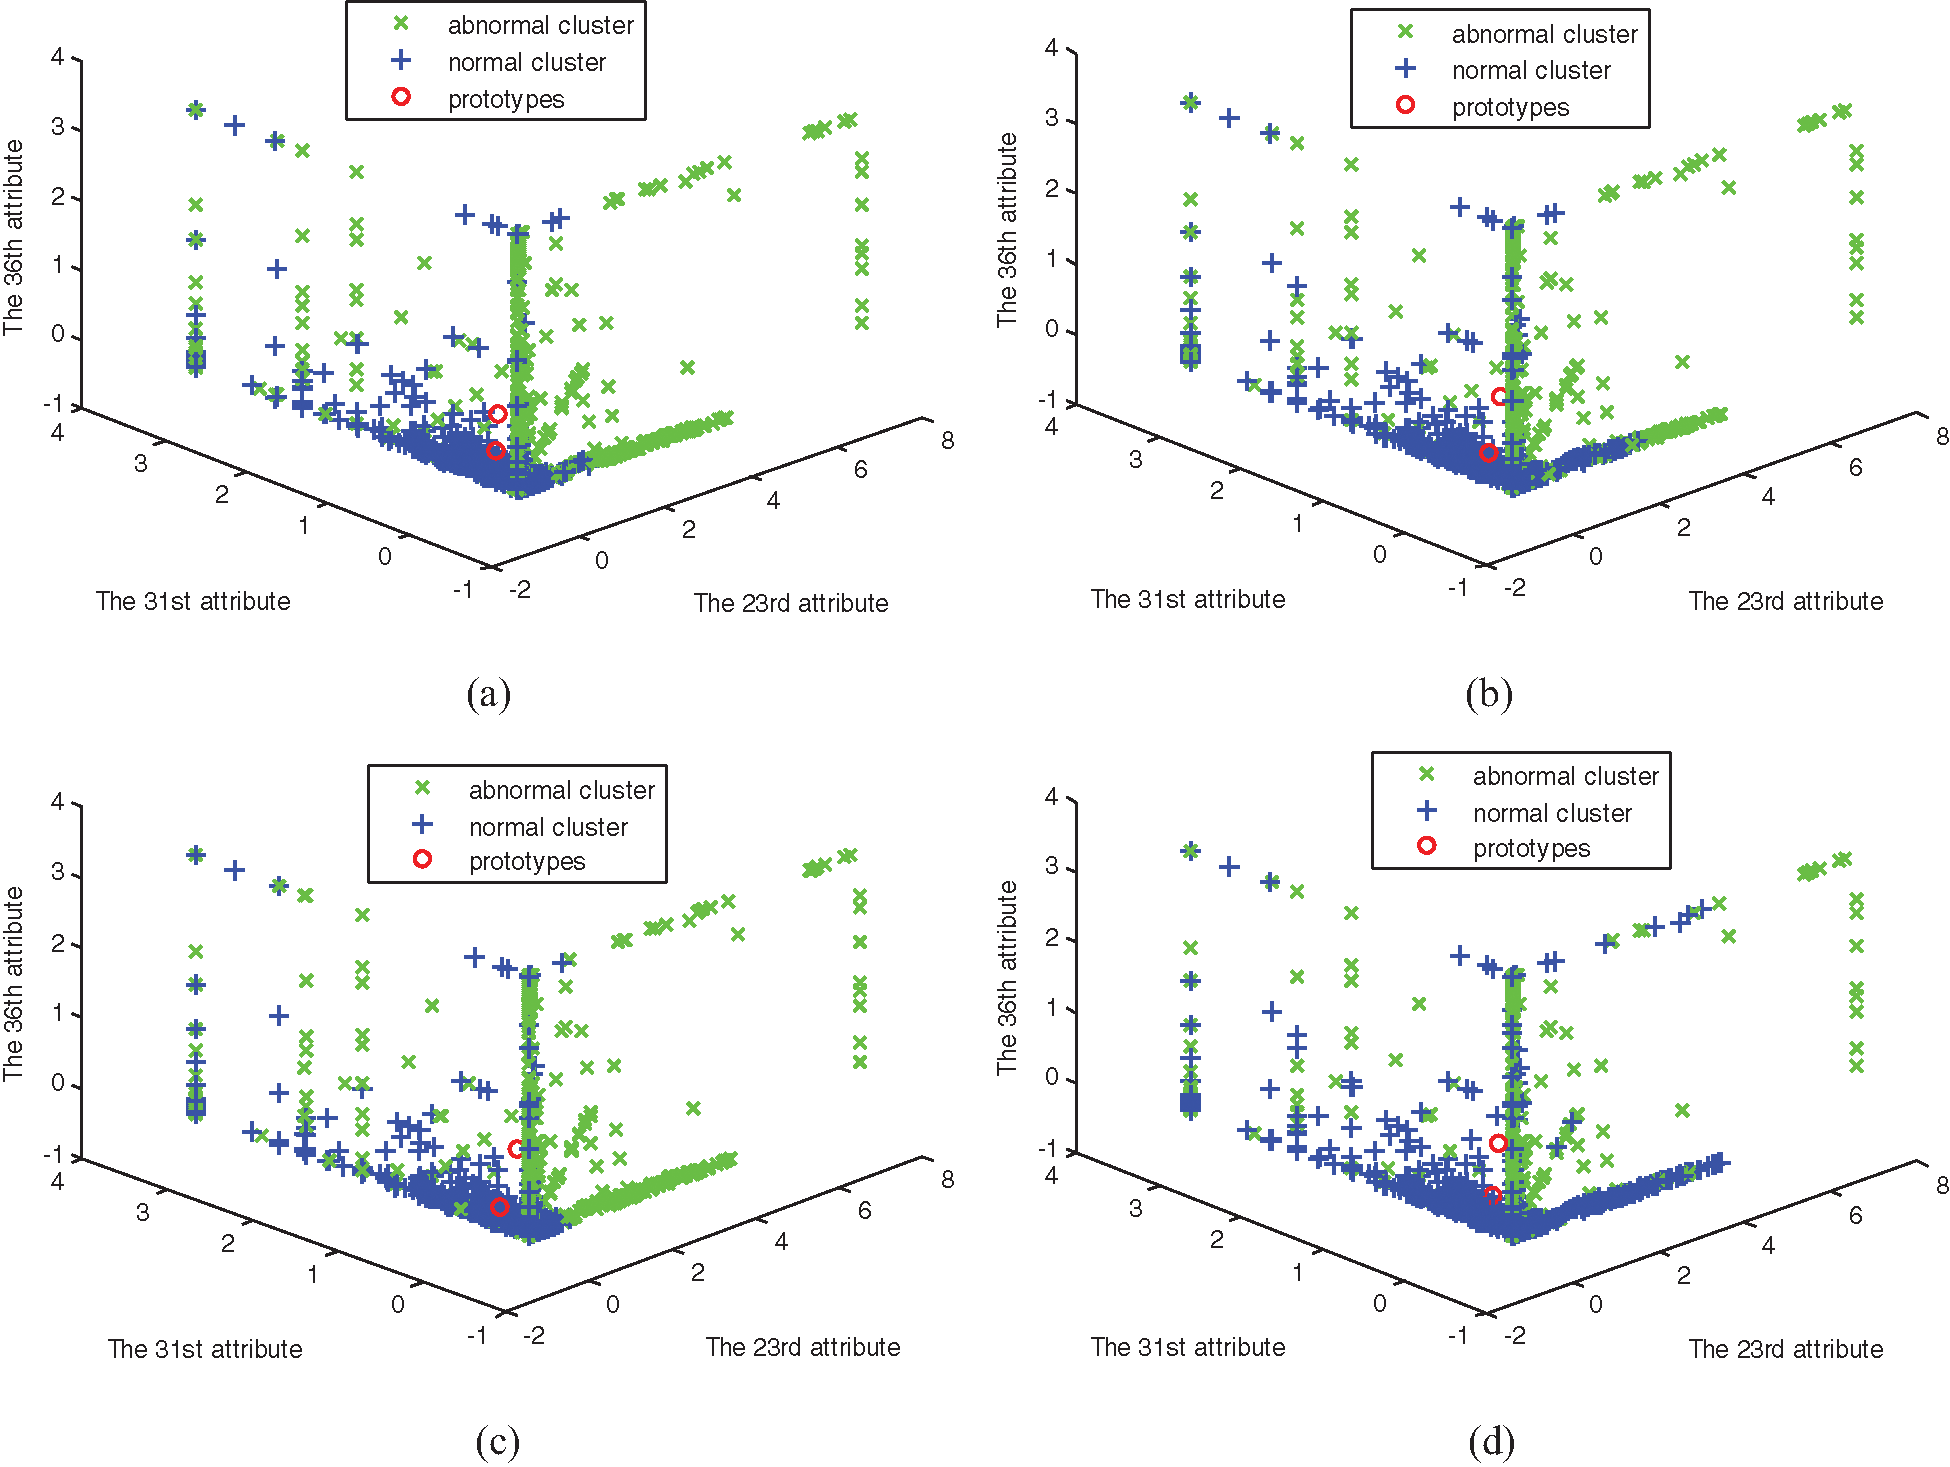
Figure 2: The clustering of four algorithms on data set 1. (a) FCM clustering, (b) MFCM clustering, (c) SRFCM clustering, and (d) MSRFCM clustering
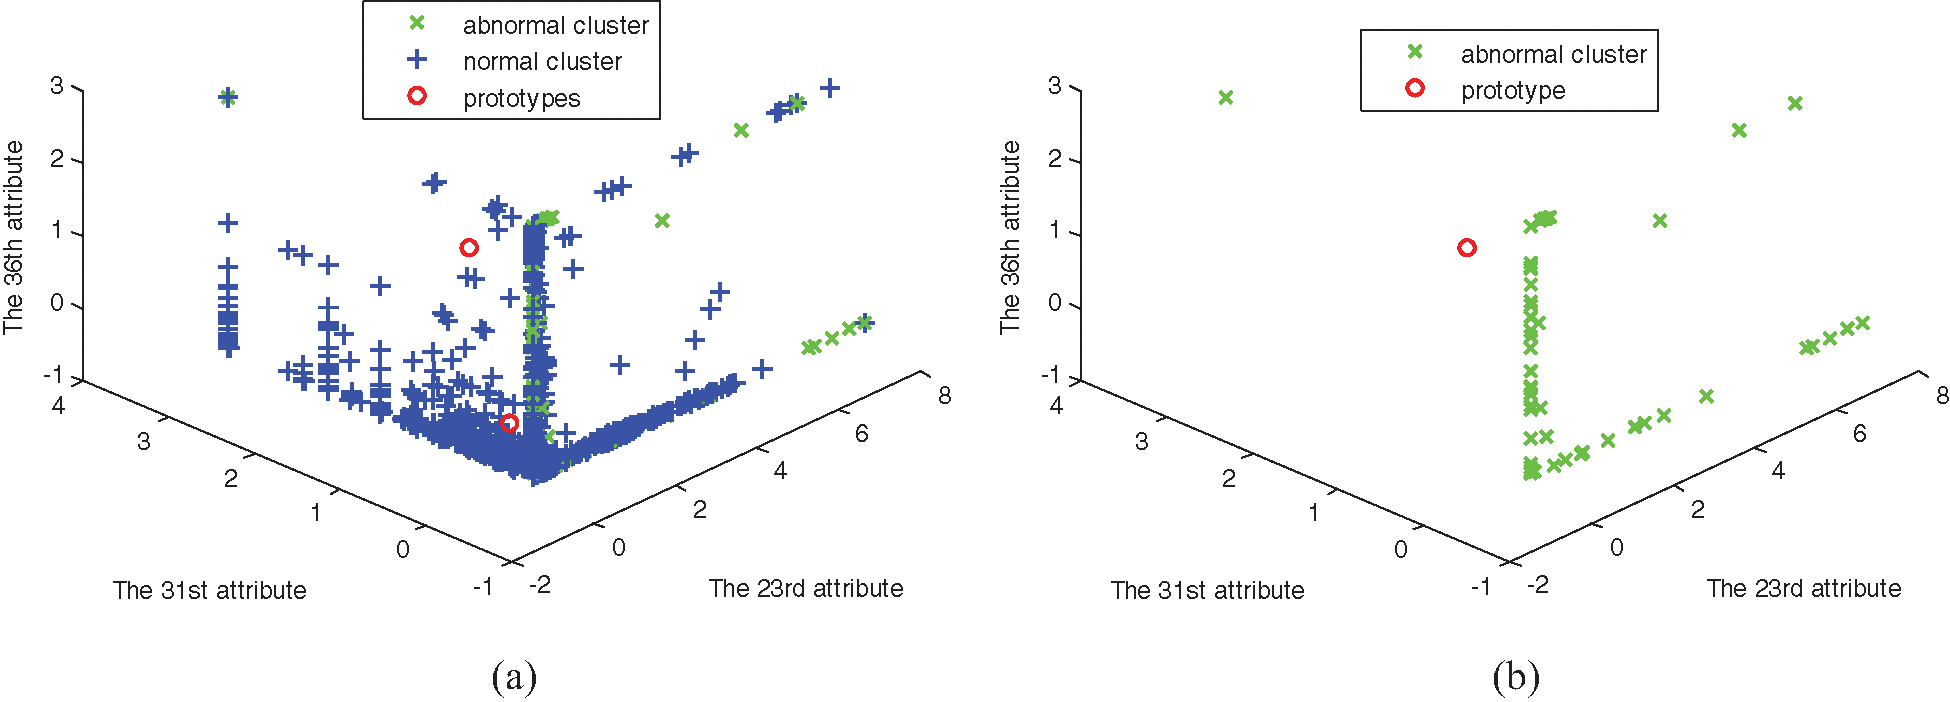
Figure 3: The distribution of data set 2. (a) Abnormal and normal clusters, (b) Abnormal cluster
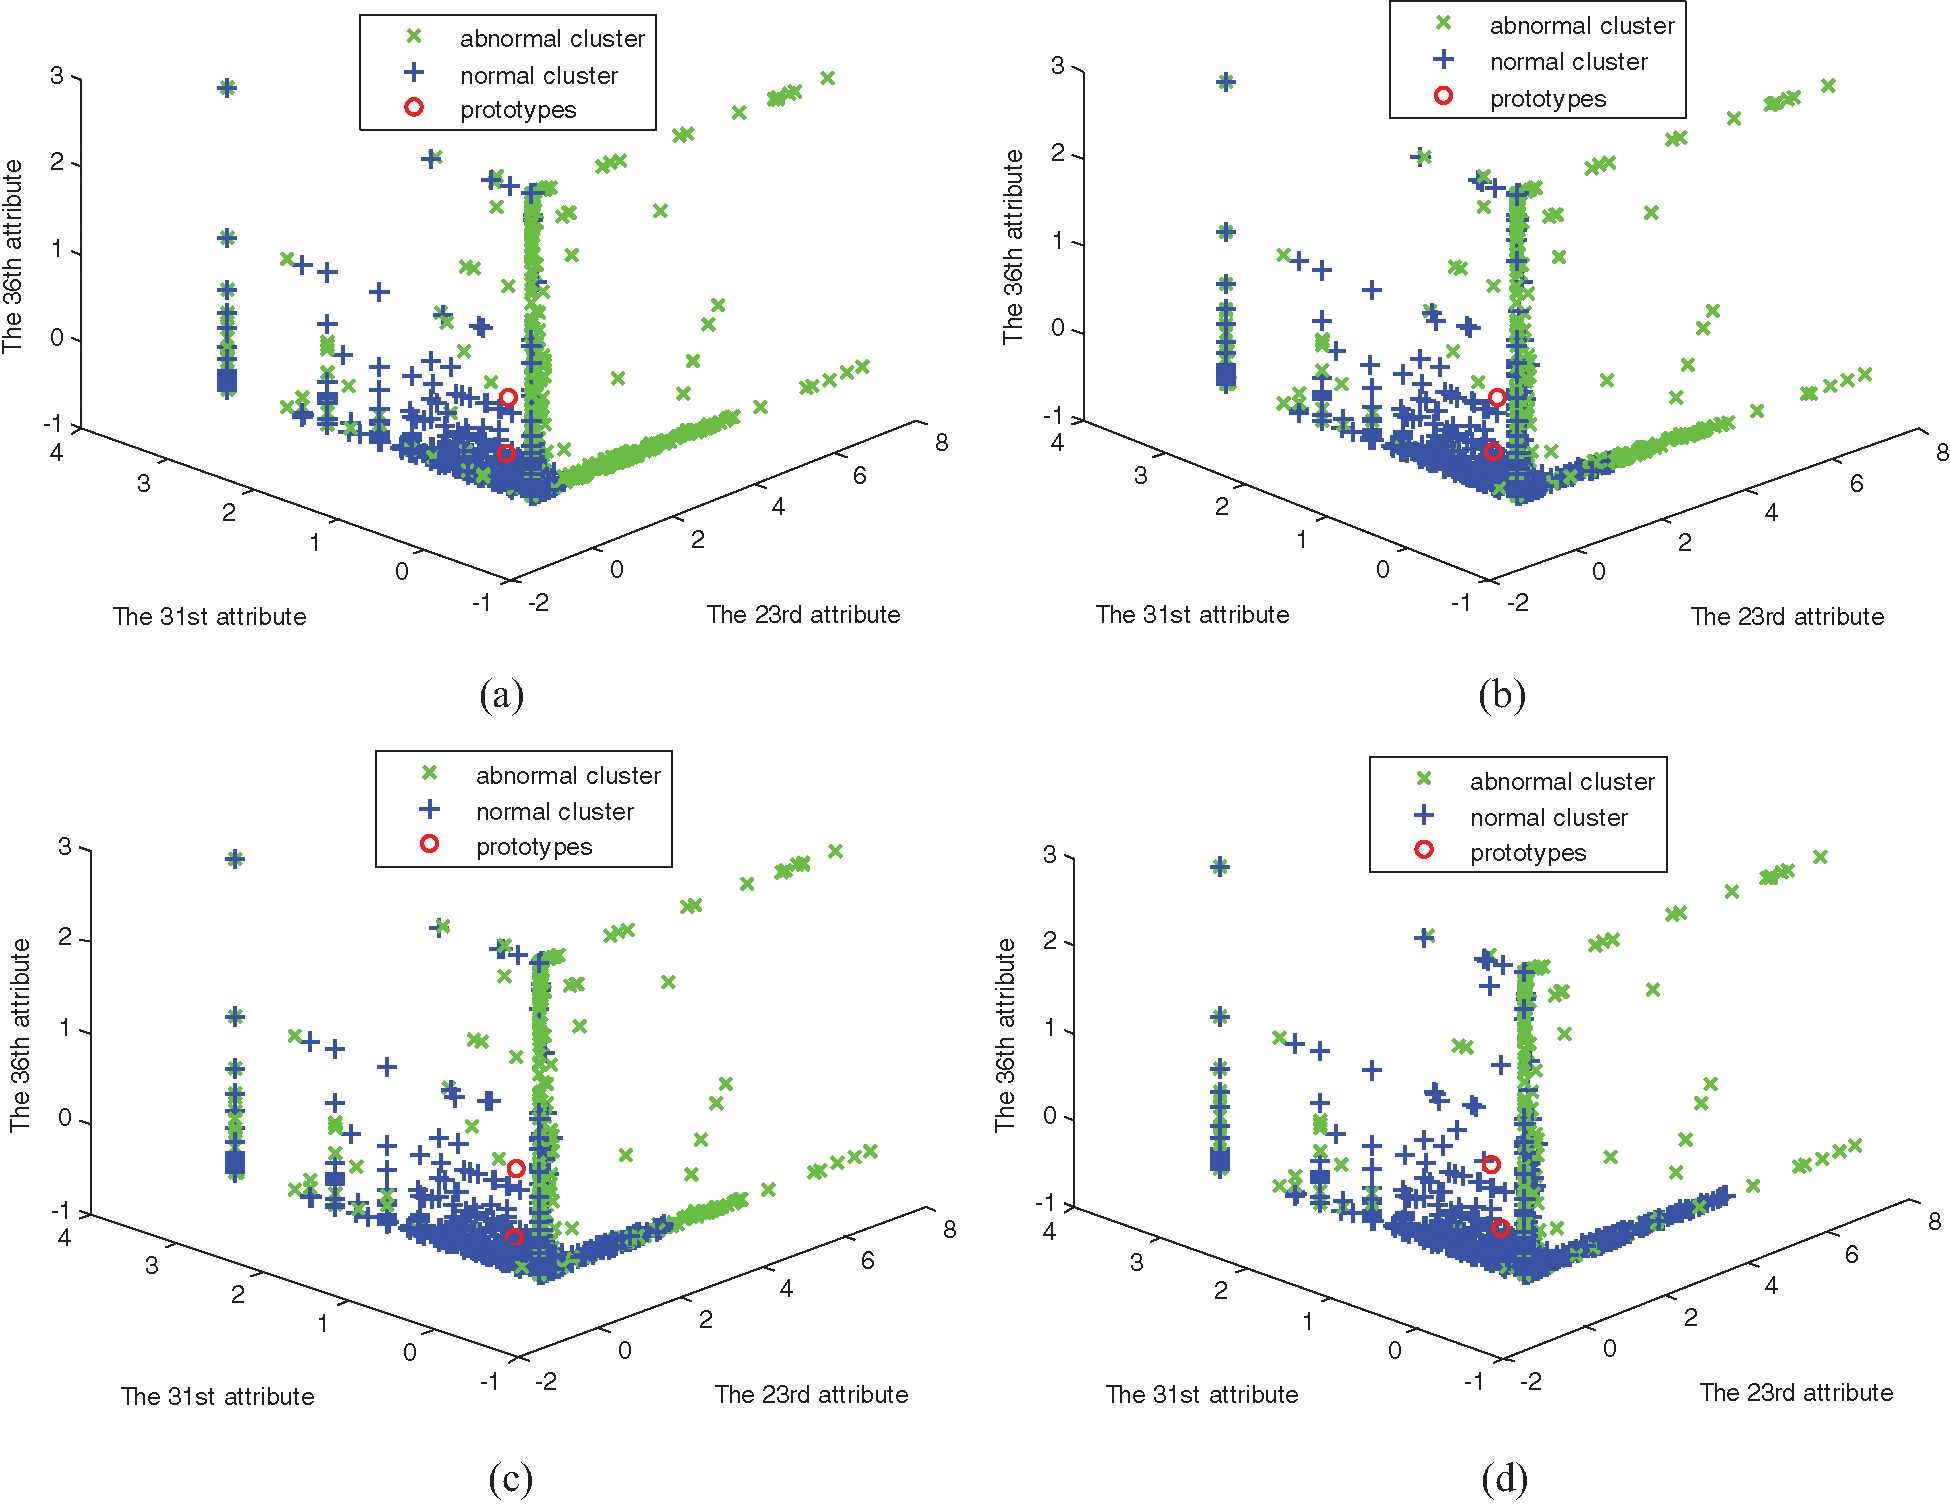
Figure 4: The clustering of four algorithms on data set 2. (a) FCM clustering, (b) MFCM clustering, (c) SRFCM clustering, and (d) MSRFCM clustering
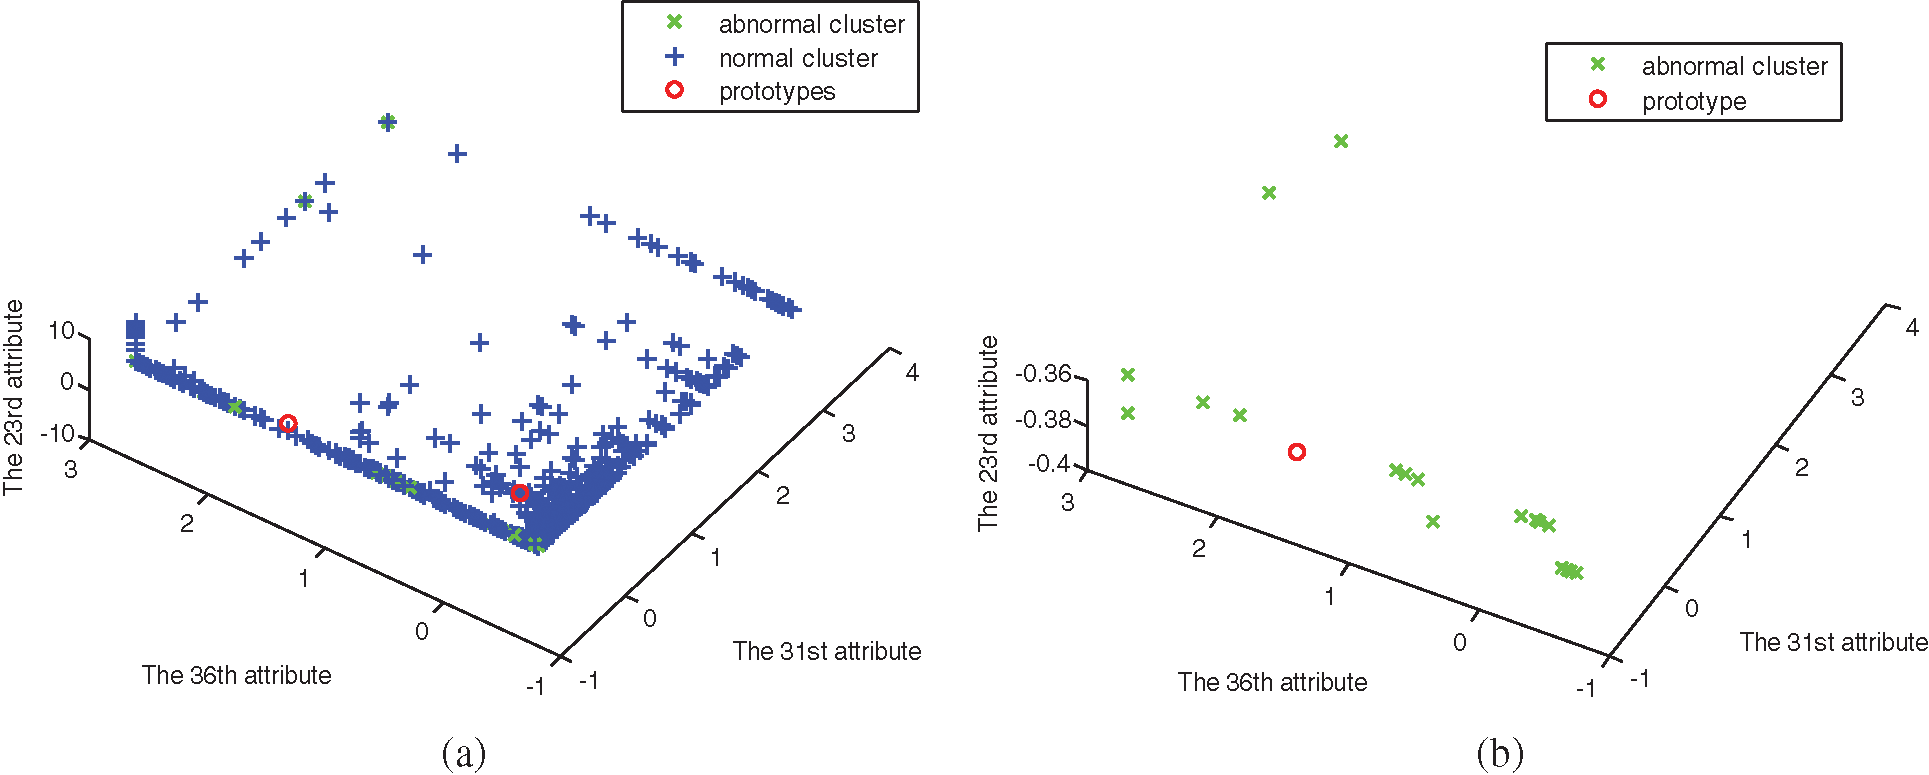
Figure 5: The distribution of data set 3. (a) Abnormal and normal clusters, (b) Abnormal cluster
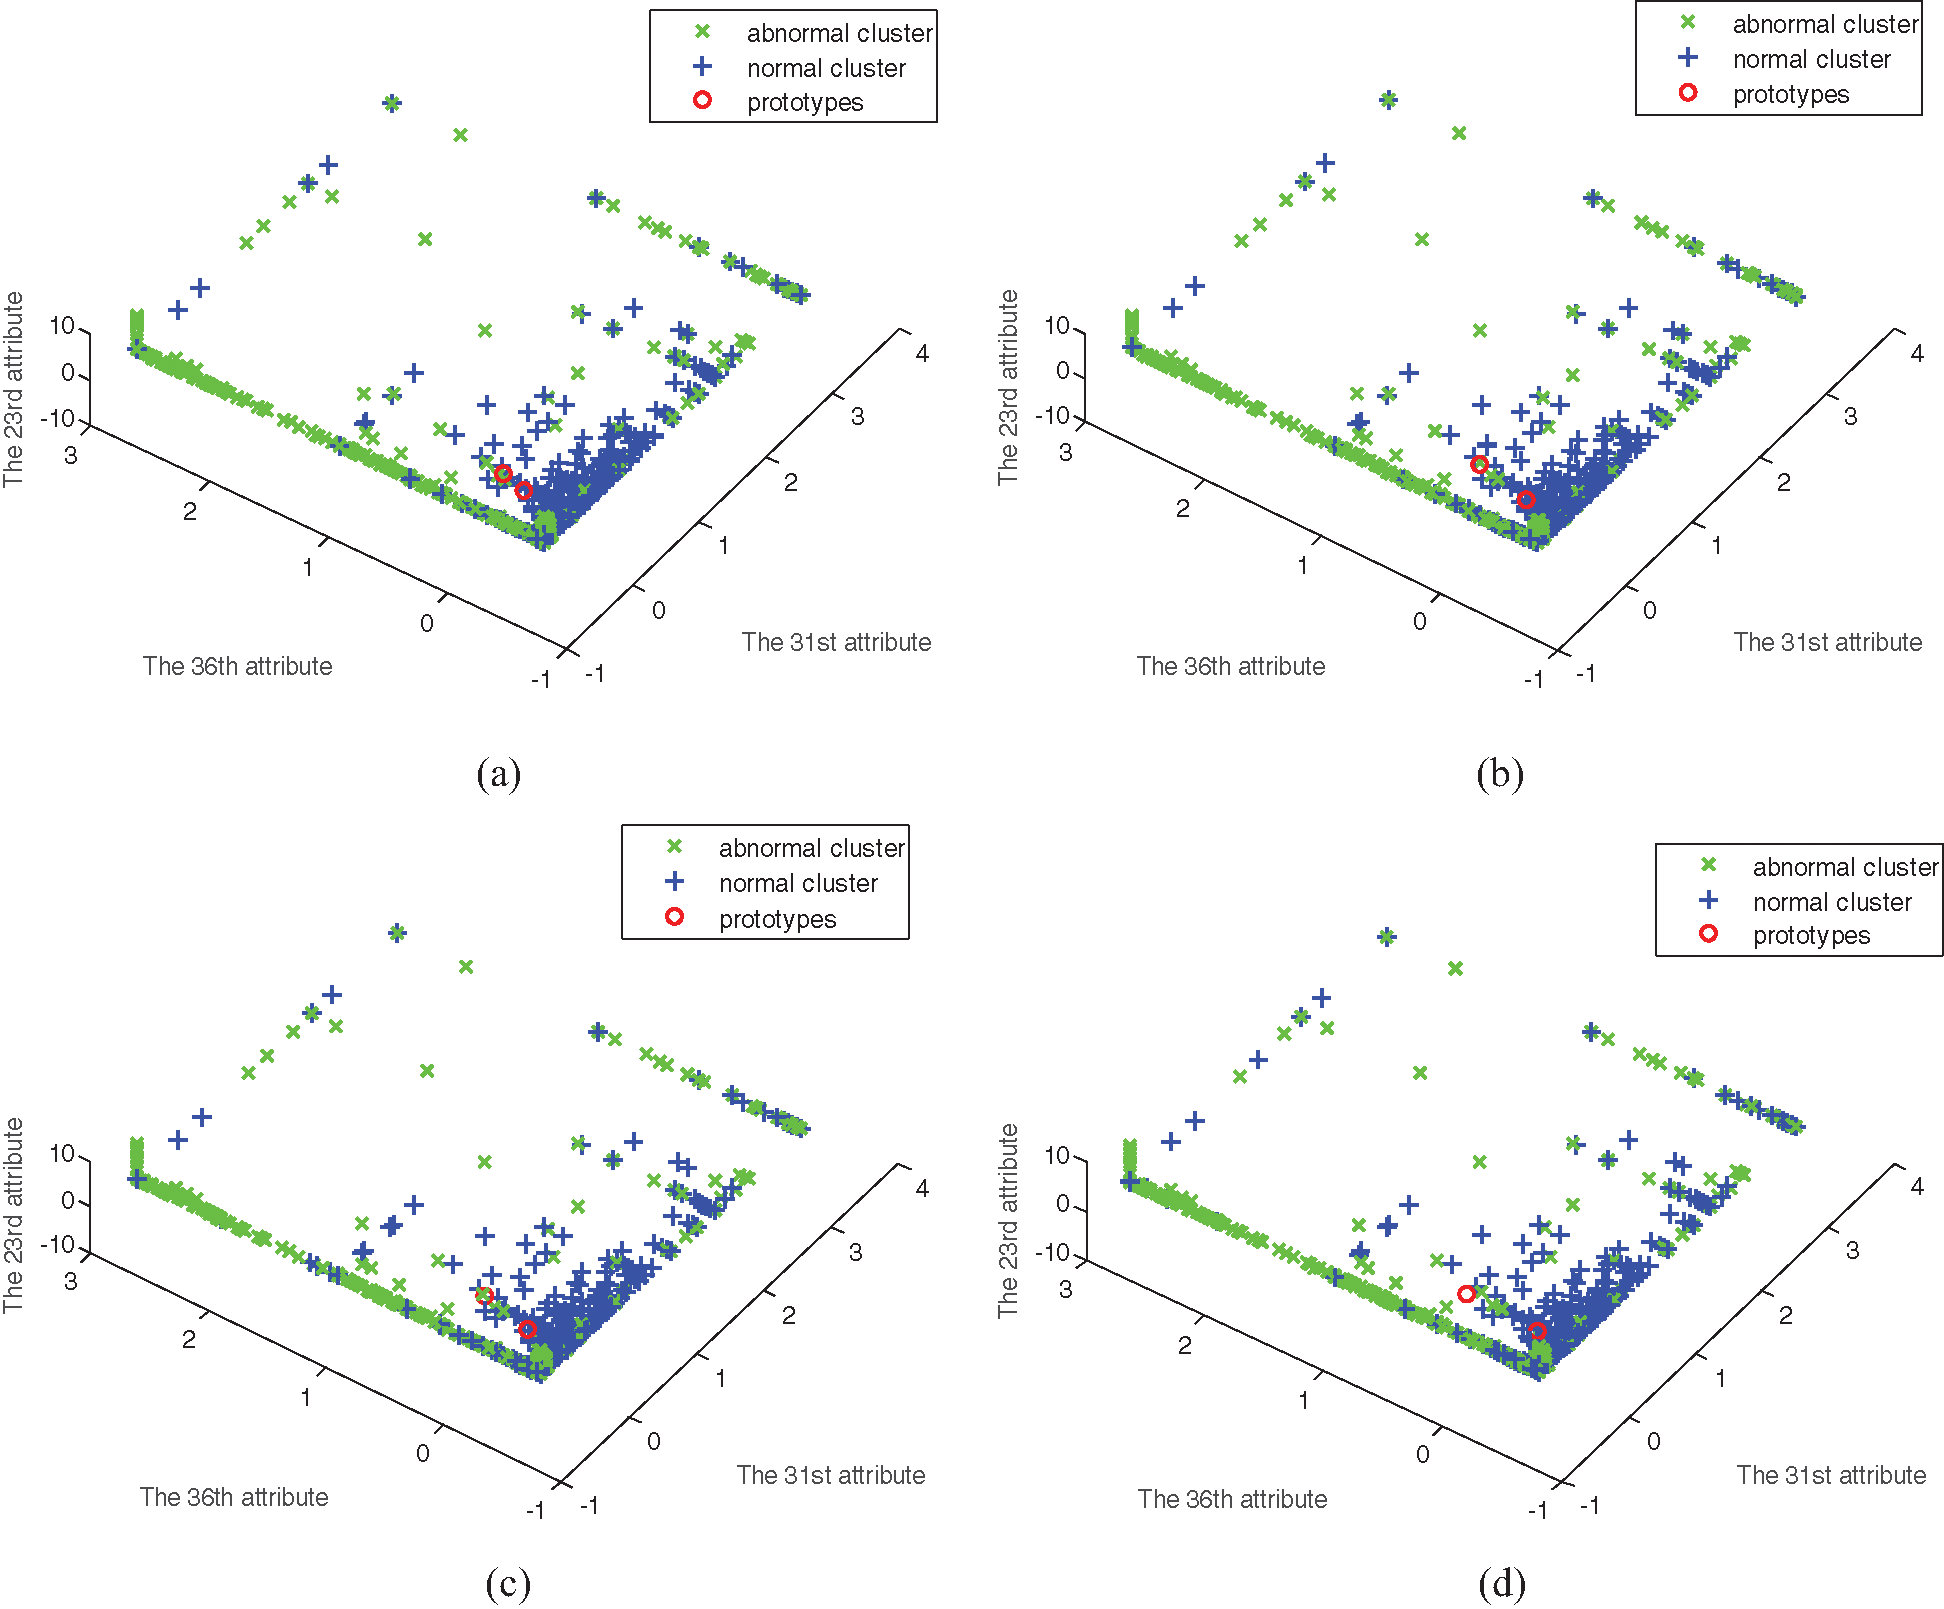
Figure 6: The clustering of four algorithms on data set 3. (a) FCM clustering, (b) MFCM clustering, (c) SRFCM clustering, and (d) MSRFCM clustering
In Figs. 1–6, comparing with the original distributions of data sets, the calculated prototypes through four different algorithms are close in value. In Figs. 2 and 4, MSRFCM partitions most normal data into the right cluster with the lowest partition error rate by comparing with the three algorithms of FCM, SRFCM, and MFCM. Thus, it achieves the highest detection performance. And compared with FCM, SRFCM and MFCM algorithms obtain the more real value-approaching prototypes in the abnormal cluster in Fig. 2 and partition more normal data into the right cluster with the lower partition error rate in Fig. 4, respectively. In Fig. 6, compared with the other three algorithms, MSRFCM obtains the most real value-approaching prototype in the abnormal cluster and can achieve the highest intrusion detection value. In turn, SRFCM and MFCM algorithms obtain the more real value-approaching prototypes in the abnormal cluster than that of FCM.
Through statistical analysis of the experimental results in three data sets, the anomaly detection rate (Recall), Precision, Accuracy, F1 score, and the mean value of F1 score (MF1) of intrusion detection are calculated, as shown in Tab. 2.

Based on Precision and Recall, F1 score is applied to evaluate the intrusion detection performance of different algorithms. In Tab. 2, in terms of F1 score, a series of Mahalanobis distance-based algorithms (MFCM and MSRFCM) are superior to FCM and SRFCM in the three data sets, respectively. In all data sets, MSRFCM clustering algorithm achieves the highest F1 value, and the mean intrusion detection F1 score (e.g., MF1) reaches the highest value of 0.228. The MSRFCM algorithm is superior to other algorithms on F1 score and MF1 score. As far as the accuracy is concerned, the experimental results show that FCM algorithm achieves the lowest accuracy value than the other three algorithms in three data sets. and MSRFCM algorithm acquires the highest accuracy value among all algorithms in three data sets. To sum up, MSRFCM algorithm is obviously superior to MFCM, SRFCM and FCM, and does yield very favorable outcomes in the intrusion detection experiments.
A 155-dimensional AWID data set [25] is provided with two versions: the one with labels corresponding to different attacks, and the other one with the attack labels organized into three major classes. Inside the attributes, some are useful for detecting attacks and others are just noise that may prove misleading. Meanwhile, three subsets are extracted with different attack types involved in each subset: the Flooding attack in data set 1, the Impersonation attack in data set 2, and the Injection attack in data set 3. The statistical analysis of the experimental results is shown in Tab. 3.

A 49-dimensional UNSW-NB 15 data set [25] is simulated in the Cyber Range Lab at the Australian Prototype for Cyber Security (ACCS). It is generated based on the combination of synthetic attack activity along with real modern normal behaviors, and the corresponding nine synthetic attack types are Backdoors, DoS, Analysis, Fuzzers, Generic, Worms, Exploits, Reconnaissance, and Shellcode, respectively. Three subsets sampled from it are corresponding to the respective attack type. The attack type set causing abnormal in data set 1 is comprised of Backdoors, Analysis, and Fuzzers. That causing abnormal in data set 2 is comprised of DoS, Generic, and Exploits attack. The causing abnormal in data set 3 is comprised of Worms, Shellcode, and Reconnaissance. The statistical analysis of experimental results is listed in Tab. 4.

An 85-dimensional CICIDS-2017 intrusion detection data set [25] is produced by the Institute of Network Security in Canada, with three subsets are sampled from it. Each subset corresponds to the respective attack type, Web attack to data set 1, Infiltration and PortScan to data set 2, and DDos attack to data set 3.The statistical analysis of experimental results is displayed in Tab. 5.

The analysis on different algorithm performances in different intrusion data sets shows that MSRFCM has the highest F1 score and MF1 score, comparing with MFCM, SRFCM and FCM. The F1 value of MFCM algorithm in all data sets is higher than that of FCM algorithm. Comparing with the value derived from FCM algorithm, the deduced F1 value through SRFCM algorithm is higher in all data sets. For some instances, FCM algorithm has obtained F1 score of zero in data subset 1 of the AWID data set, and so it is unable to detect any intrusion behavior. By contrast, MSRFCM algorithm has an excellent performance in intrusion detection. Finally, the newly proposed algorithm has reflected its feasibility and advantages in intrusion detection through the experimental results.
This research explored the Mahalanobis distance-based SRFCM clustering algorithms to greater depth and elaborated on its applications in intrusion detection. The process and findings of the research are summarized as follows:
It analyzed and elucidated the effectiveness and feasibility of the improved algorithm in two steps. First, verify the effectiveness of the new method on NSL-KDD data set. Then, test its validity on preprocessed intrusion data selected from AWID, UNSW-NB 15, and CICIDS-2017 data sets.
In the discussion, SRFCM algorithm obtained real value-approaching prototypes based on iteration, and the dissimilarity measurement of Mahalanobis distance was used to identify the relevant variables and demonstrates its significant influence on the clustering performance and the error rate reduction in the process of partitioning clusters with high attribute correlation. With the merits of real value-approaching prototypes and the dissimilarity measurement of Mahalanobis distance, MSRFCM algorithm performed best among all of the algorithms. Besides, MSRFCM algorithm scored highest in intrusion data detection based on the simulation experiments on network intrusion data sets and the corresponding analyses of the Mahalanobis distance-based approach. In the future, coping with emerging security challenge on the Internet and combining various methods to integrate the advantages for detecting intrusion data is a worthy study.
Funding Statement: The authors would like to acknowledge the support of Southern Marine Science and Engineering Guangdong Laboratory (Zhuhai)(SML2020SP007) and The paper is supported by the National Natural Science Foundation of China (Nos. 61772280 and 62072249).
Conflicts of Interest: The authors declare that they have no conflicts of interest to report regarding the present study.
1. K. Sha, W. Wei, T. Andrew Yang, Z. Wang and W. Shi, “On security challenges and open issues in Internet of Things,” Future Generation Computer Systems, vol. 83, no. 6, pp. 326–337, 2018. [Google Scholar]
2. I. Yaqoob, E. Ahmed, M. Habib ur Rehman, A. I. A. Ahmed and M. A. AI-garadi, “The rise of ransomware and emerging security challenges in the Internet of Things,” Computer Networks, vol. 129, no. 12, pp. 444–458, 2017. [Google Scholar]
3. U. Tariq, “Intrusion detection and anticipation system (IDAS) for IEEE 802.15.4 devices,” Intelligent Automation & Soft Computing, vol. 25, no. 2, pp. 231–242, 2019. [Google Scholar]
4. C. F. Cheang, Y. Wang, Z. Cai and G. Xu, “Multi-VMs intrusion detection for cloud security using Dempster-Shafer theory,” Computers Materials & Continua, vol. 57, no. 2, pp. 297–306, 2018. [Google Scholar]
5. J. Wang, J. Cao, R. S. Sherratt and J. H. Park, “An improved ant colony optimization-based approach with mobile sink for wireless sensor networks,” Journal of Supercomputing, vol. 74, no. 12, pp. 6633–6645, 2018. [Google Scholar]
6. T. Ling, L. Chong, X. Jingming and C. Jun, “Application of self-organizing feature map neural network based on k-means clustering in network intrusion detection,” Computers Materials & Continua, vol. 61, no. 1, pp. 275–288, 2019. [Google Scholar]
7. M. H. Luo, K. Wang, Z. P. Cai, A. F. Liu, Y. Y. Li et al., “Using imbalanced triangle synthetic data for machine learning anomaly detection,” Computers Materials & Continua, vol. 58, no. 1, pp. 15–26, 2019. [Google Scholar]
8. J. Wang, Y. Cao, B. Li, H. Kim and S. Lee, “Particle swarm optimization based clustering algorithm with mobile sink for WSNs,” Future Generation Computer Systems, vol. 76, no. 11, pp. 452–457, 2017. [Google Scholar]
9. D. Li, H. Gu and L. Y. Zhang, “Fuzzy C-means algorithm with interval-supervised attribute weights,” Control and Decision, vol. 25, no. 3, pp. 457–460, 2010. [Google Scholar]
10. J. P. Mei and L. Chen, “Fuzzy clustering with weighted medoids for relational data,” Pattern Recognition, vol. 43, no. 5, pp. 1964–1974, 2010. [Google Scholar]
11. D. G. Yang, “Research of the Network intrusion detection based on fuzzy clustering,” Computer Science, vol. 32, no. 1, pp. 86–87, 2005. [Google Scholar]
12. S. Mitra, H. Banka and W. Pedrycz, “Rough-fuzzy collaborative clustering,” IEEE Transactions on Systems, Man, and Cybernetics (Part B), vol. 36, no. 4, pp. 795–805, 2006. [Google Scholar]
13. P. Maji and S. K. Pal, “RFCM: A hybrid clustering algorithm using rough and fuzzy sets,” Fundamenta Informaticae, vol. 80, no. 4, pp. 475–496, 2007. [Google Scholar]
14. S. Mitra, “An evolutionary rough partitive clustering,” Pattern Recognition Letters, vol. 25, no. 12, pp. 1439–1449, 2004. [Google Scholar]
15. W. Pedrycz, “Shadowed sets: Representing and processing fuzzy sets,” IEEE Transactions on Systems, Man, and Cybernetics (Part B), vol. 28, no. 1, pp. 103–109, 1998. [Google Scholar]
16. W. Pedrycz, “Granular computing—The emerging paradigm,” Journal of Uncertain Systems, vol. 1, no. 1, pp. 38–61, 2007. [Google Scholar]
17. J. Zhou, W. Pedrycz and D. Miao, “Shadowed set in the characterization of rough-fuzzy clustering,” Pattern Recognition, vol. 44, no. 8, pp. 1738–1749, 2011. [Google Scholar]
18. L. N. Wang and J. D. Wang, “Attribute weighting fuzzy clustering integrating rough set and shadowed set,” International Journal of Pattern Recognition and Artificial Intelligence, vol. 26, no. 4, pp. 1250010-1–1250010-25, 2012. [Google Scholar]
19. J. H. Guo, D. Miao and J. Zhou, “Shadowed set based threshold selection in rough clustering,” Computer Science, vol. 38, no. 10, pp. 209–210, 227, 2011. [Google Scholar]
20. H. L. Wang, K. She and M. T. Zhou, “Shadowed set-based rough fuzzy possibility C-mean clustering,” Computer Science, vol. 40, no. 1, pp. 191–194, 2013. [Google Scholar]
21. S. M. Xiang, F. P. Nie and C. S. Zhang, “Learning a Mahalanobis distance metric for data clustering and classification,” Pattern Recognition, vol. 41, no. 12, pp. 3600–3612, 2008. [Google Scholar]
22. J. D. Peter and E. Peter, “A study of parameter values for a Mahalanobis distance fuzzy classifier,” Fuzzy Set and Systems, vol. 137, no. 2, pp. 191–213, 2003. [Google Scholar]
23. N. A. H. Haldar, F. A. Khan, A. Ali and H. Abbas, “Arrhythmia classification using Mahalanobis distance based improved Fuzzy C-Means clustering for mobile health monitoring systems,” Neurocomputing, vol. 220, no. 12, pp. 221–235, 2017. [Google Scholar]
24. X. M. Zhao, Y. Li and Q. H. Zhao, “Mahalanobis distance based on fuzzy clustering algorithm for image segmentation,” Digital Signal Processing, vol. 43, no. 12, pp. 8–16, 2015. [Google Scholar]
25. A. Aldweesh, A. Derhab and A. Z. Emam, “Deep learning approaches for anomaly-based intrusion detection systems: A survey, taxonomy, and open issues,” Knowledge-Based Systems, vol. 189, no. 1, pp. 1–19, 2020. [Google Scholar]
26. J. Y. Cai, F. D. Xie and Y. Zhang, “New fuzzy clustering algorithms based on attribute weighted Mahalanobis distance,” Computer Engineering and Application, vol. 48, no. 5, pp. 198–200, 2012. [Google Scholar]
27. A. Ruiz and P. E. López-de-Teruel, “Nonlinear kernel-based statistical pattern analysis,” IEEE Transactions on Neural Networks, vol. 12, no. 1, pp. 16–32, 2001. [Google Scholar]
28. F. R. Bach and M. I. Jordan, “Kernel independent component analysis,” Journal of Machine Learning Research, vol. 3, no. 1, pp. 1–48, 2002. [Google Scholar]
 | This work is licensed under a Creative Commons Attribution 4.0 International License, which permits unrestricted use, distribution, and reproduction in any medium, provided the original work is properly cited. |