DOI:10.32604/iasc.2021.018700
| Intelligent Automation & Soft Computing DOI:10.32604/iasc.2021.018700 | |
| Article |
Improving the Power Quality of Smart Microgrid Based Solar Photovoltaic Systems
1Electrical Department, Faculty of Technology and Education, Sohag University, Sohag, 82524, Egypt
2College of Engineering at Wadi Addawaser, Prince Sattam Bin Abdulaziz University, Al-Kharj, 11911, Saudi Arabia
3Electrical Engineering Department, Faculty of Engineering, Minia University, Minia, 61517, Egypt
4Department of Electrical Engineering, College of Engineering, Taif University, 21944, Taif, Saudi Arabia
5Electrical Engineering Department, Faculty of Engineering, Assiut University, Assiut, 71518, Egypt
*Corresponding Author: Hegazy Rezk. Email: hr.hussien@psau.edu.sa
Received: 18 March 2021; Accepted: 29 April 2021
Abstract: Microgrids are hybrid power systems that consist of several distributed generation resources and local loads that can supply electrical power to remote or specific areas. The integration of microgrids with the utility network is one of the most recent technologies developed in countries like Egypt. One area of study is how the integration of smart microgrids and utility systems can be used to solve power quality problems such as voltage sags, increased use of distributed generators, deep energy, and power loss. This paper is aimed at investigating a possible solution to some common and dangerous power quality issues associated with the integration of smart microgrids and utility systems such as voltage fluctuation and total harmonic distortion (THD) at different solar irradiance and load conditions. This study used a MATLAB and Simulink code developed to model and analyze smart microgrid and utility system integration and the power quality issue at different loads. This study focuses on five scenarios of voltage analysis and two scenarios of THD at different irradiance and load conditions. The results show that using an integrated smart microgrid and utility system will reduce the voltage drop percentage with high solar irradiance and will increase it with low solar irradiance at both high and low loads. Additionally, THD decreases with increasing solar irradiance and increases with decreasing solar irradiance at both high and low loads.
Keywords: Power quality issues; integration of smart microgrids and utility systems; voltage fluctuation; solar photovoltaic system
The use of microgrids has gradually increased in Egypt’s utility grid from microgrids that include both PV systems and wind turbine farms. Egypt’s government has placed additional importance on using renewable energy to decrease its reliance on fossil fuel, oil and natural gas, and generation stations in order to decrease emissions that cause global warming [1]. Microgrid systems can be classified into two types: small-scale systems and large-scale systems. The possible impact of the distribution of microgrids on the utility system provides a feasible solution before real-time and practical implementation. Weather conditions—such as varying solar irradiation, cloudy days, and the variation of the load placed on the grid—can cause serious power quality problems including over-voltage, power fluctuations, voltage fluctuations, frequency fluctuations, and inrush current [2]. Furthermore, connecting microgrids with the utility system requires the use of power electronic devices that cause harmonics distortion. Harmonics distortion can cause significant problems, such as losing reactive power, reducing the stability of the system, and increasing the temperature of utility equipment. For this reason, different types of active filters such as shunts, series, and hybrid active filters are used to improve power quality issues. The size of active filters depends on the harmonics in the grid [3]. Finally, variation in solar irradiation is negligible in small-scale microgrids, but in large-scale microgrids it causes voltage fluctuation in the system, which affects the power quality of the system [4].
The main role of power electronic devices is to interface between microgrids and the utility network. Using renewable energy sources in the utility grid requires more reliability, high efficiency for power electronics, and more control. DC/AC inverters with maximum power point tracking (MPPT) for operation at their maximum capacity at a given irradiation condition should be used to adjust the voltage and frequency of the microgrid and utility connection [5]. Energy storage is used during peak power generation periods to store excess power and then supply it to load the system during low generation hours [6]. As a result, the energy storage system improves the power quality of the system overall. For instance, in customer energy management, power electronics play an important role in the energy storage system, regulating performance for the energy storage side and the utility interface on the other side [7]. In the case of smart microgrids, the concept of “smart” is defined by the use of communication and control technology in the microgrid and the utility network, facilitating high efficiency operation. For example, bidirectional power flow and smart metering are used in smart microgrids. Power electronics play an important role in achieving this communication and control, providing a communication interface between power technology and information technology such as the supervisory control and data acquisition (SCADA) system that improves voltage regulation, frequency regulation, and power quality [8].
This paper is aimed at investigating possible solutions to some common and dangerous power quality issues resulting from the integration of smart microgrids and the utility system such as voltage fluctuation and THD at different solar irradiance and load conditions. A Matlab and Simulink code was developed to analyze the power quality issue including voltage fluctuations and harmonic injection in the LV side of the microgrid and utility system based on the PV solar systems. This study covers five voltage analysis scenarios and two THD scenarios at different solar irradiance and load conditions. The study considers a voltage analysis of microgrids and the utility system at minimum load with maximum solar irradiance (Scenario A) and of the utility system only at minimum load (Scenario B). Scenarios C, D, and E study the voltage analysis of the microgrid and utility system at peak load with maximum solar irradiance, the voltage analysis of the microgrid and utility system at peak load with minimum solar irradiance, and the voltage analysis of the utility system only at peak load with minimum solar irradiance, respectively. Additionally, this study performs a THD analysis of the integrated microgrid and utility system at minimum load with different solar irradiance levels due to shading (Scenario A) and at maximum load with different solar irradiance levels due to shading (Scenario B).
Variation in solar irradiance due to cloudy days causes voltage fluctuation in the microgrid and utility system in the microgrid installation area. Average daily irradiance on the tilted surface
Here,
Power electronics inject voltage and current harmonics into the microgrids and utility system. Power electronics, as noted above, interface between and integrate the microgrids and utility system, using, for example, an inverter for converting DC power generation from the PV system to AC power.
The THD is the sum of the total harmonics current distortions (
where f1: magnitude of the fundamental frequency, fn: harmonic frequency, n: harmonic order, k: last harmonic series.
The total harmonic voltage distortion
where
Additionally, total harmonic current distortion
where
3 Modeling of the Smart Microgrid and Utility System
A Matlab and Simulink code was used to simulate and analyze the output voltage and current of the microgrid and utility system. This simulation complied with the determination of THD as specified by the IEEE standard. The proposed smart microgrid and utility system for New Assiut City, Egypt, is shown in Figs. 1 and 2, including consideration the level of solar irradiance and load demand.
3.1 Microgrid System Configuration
The microgrid system consists of PV solar systems that contain three clusters in different places in New Assiut City, Egypt to investigate the suggested models. Each PV group used a 100 kW rated capacity as standard test conditions, which consisted of 330 PV models connecting five solar PV units in series and 66 parallel branches. Each PV module is 54.7 V and 5.58 A, with a maximum voltage (Vmp) and current (Imp), respectively. The microgrid is connected to the utility network via a 5 kHz boost converter, which is used to increase the voltage level from nominal DC voltage (272 V) to 500 V DC. Duty cycle switching is optimized by using an MPPT controller. In this study, incremental conductance (IC) and integral regulator (IR) techniques of 1650 Hz (33 × 50) are considered, and a 3-level 3-phase VSC converts 500 V DC to 260 V AC, unity PF. A 10 kVAR capacitor bank filters harmonics produced by the VSC. Three-phase distribution transformer (DT), 100 kVA and 260 V/11 kV are used, as shown in Figs. 1–3.
The utility model has a three-phase, 66 kV, 50 Hz voltage source with an RL branch. At a base VA of 50 kVA and base voltage of 66 kV, the X/R ratio is 7 [10]. It uses a three-phase step-down transformer: 10 MVA, 66 kV/11 kV, 50 Hz with Yd configuration [11].
The system uses a three-phase transformer with a feeder of length 20 km, and the groups of microgrids using solar power PV are connected along the feeder as shown in Figs. 1 and 2. Microgrid 1 is connected very close to the transformer at node D1. Microgrid 2 is connected approximately 5 km away from Microgrid 1 at node D2. Microgrid 3 is likewise connected approximately 5 km from Microgrid 2 at node D3, and Microgrid 4 is connected 5 km apart from Microgrid 3 at node D4. Microgrid 5 is connected approximately 5 km apart from Microgrid 4, and 20 km from Microgrid 1, at node D5. The feeder parameters are: resistance R = 0.1153 ohm/km, inductance L = 1.05 mH/km, and conductance C = 11.33 nF/km [12,13].
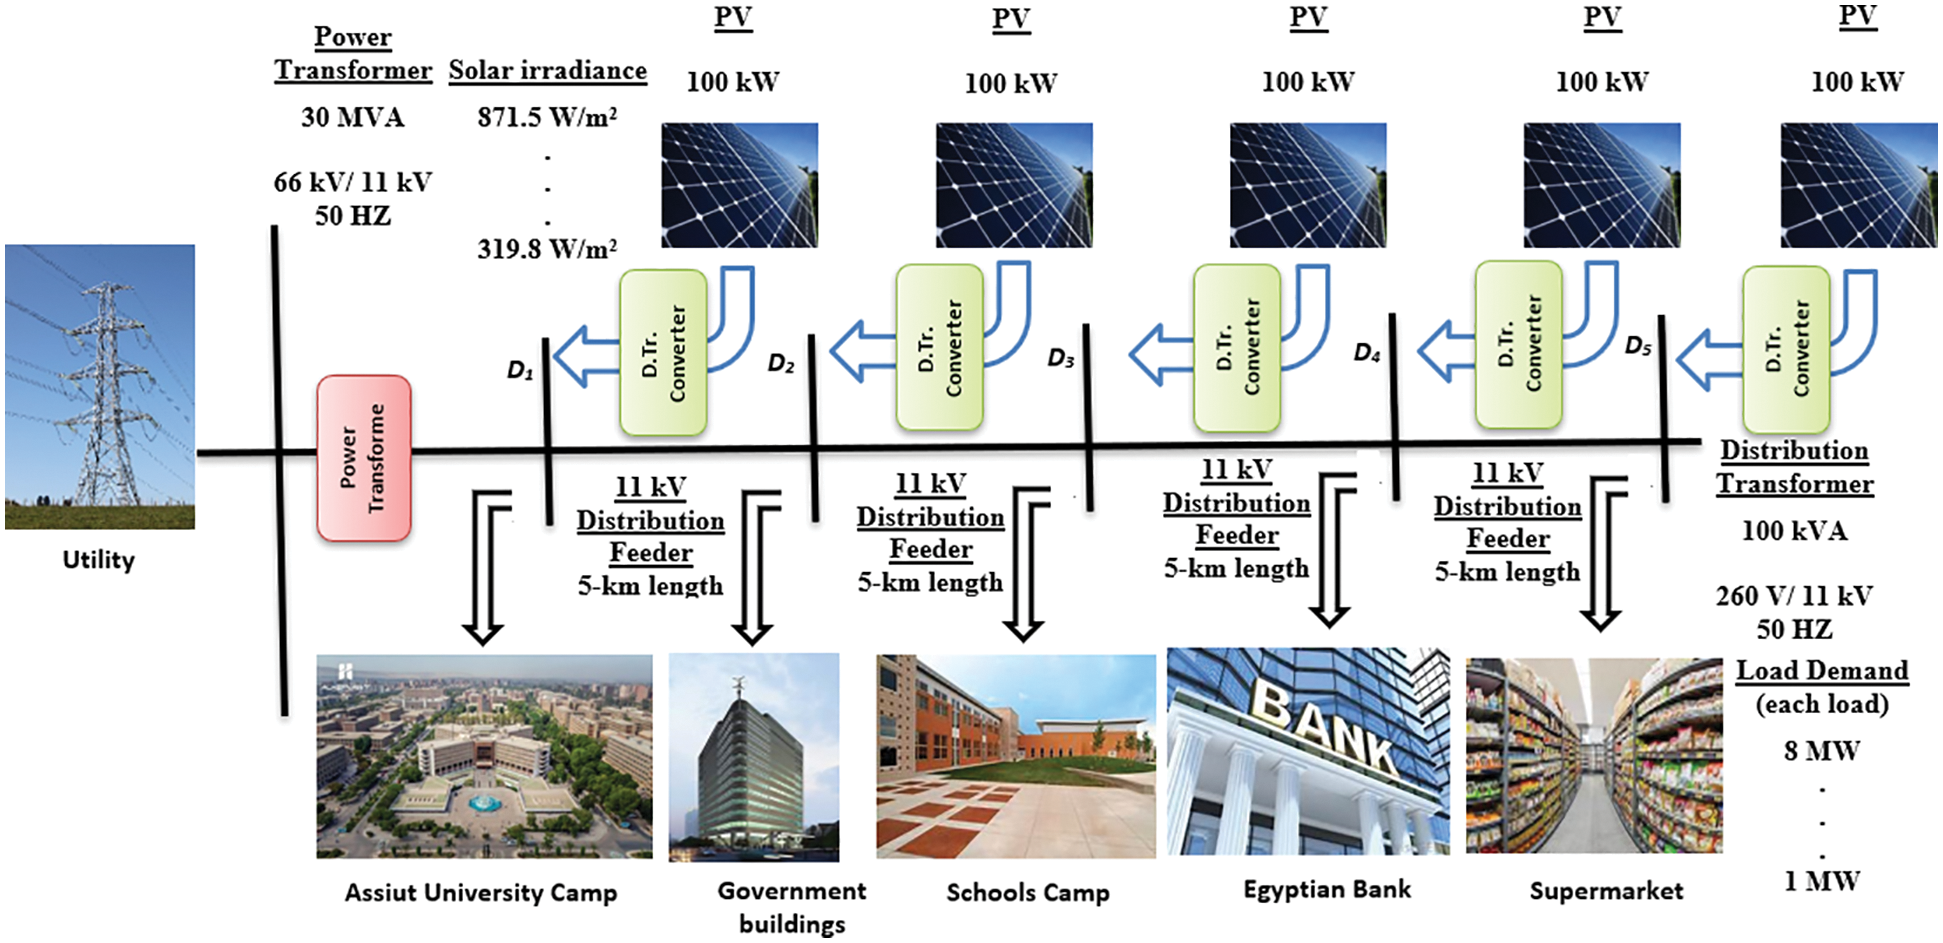
Figure 1: Proposed integration of the microgrid and utility system
In this model, five load groups are connected along the feeder and the maximum capacity of each load is assumed to be 1 MW. This assumes five groups of the residential load, five-building zone in New Assiut City, Egypt: Assiut University Camp, two groups of government buildings, a group of several schools, Egyptian Bank, and two groups of supermarkets, as shown in Figs. 1 and 2. The average load demand of each group is approximately 1 MW during daylight hours and the daily average minimum load of each group is assumed to be 0.25 MW [8,9].
Egypt receives a large amount of sunshine compared with many other countries. The authors chose New Assiut City as the location for the study. For the site under study, the monthly average radiation (MAR) and solar radiation clearness index (SRCI) values are shown in Fig. 4. SRCI is the atmosphere clearness measure, which is the fraction of solar radiation that is transmitted through the atmosphere that reaches the surface of the earth. The New Assiut City region has an average irradiance level between 3.5 and 8.1 kWh/m²/day [9,11,12]. In summer months, solar irradiance is more than 8.1 kWh/m2/day, while during the winter months, irradiation is at its lowest level, 3.5 kWh/m2/day, as shown in Fig. 4. Actual sunshine hours reach 11 hours per day. Thus, it is efficient to use solar energy as a renewable source in New Assiut City rather than using conventional energy sources [9–13].
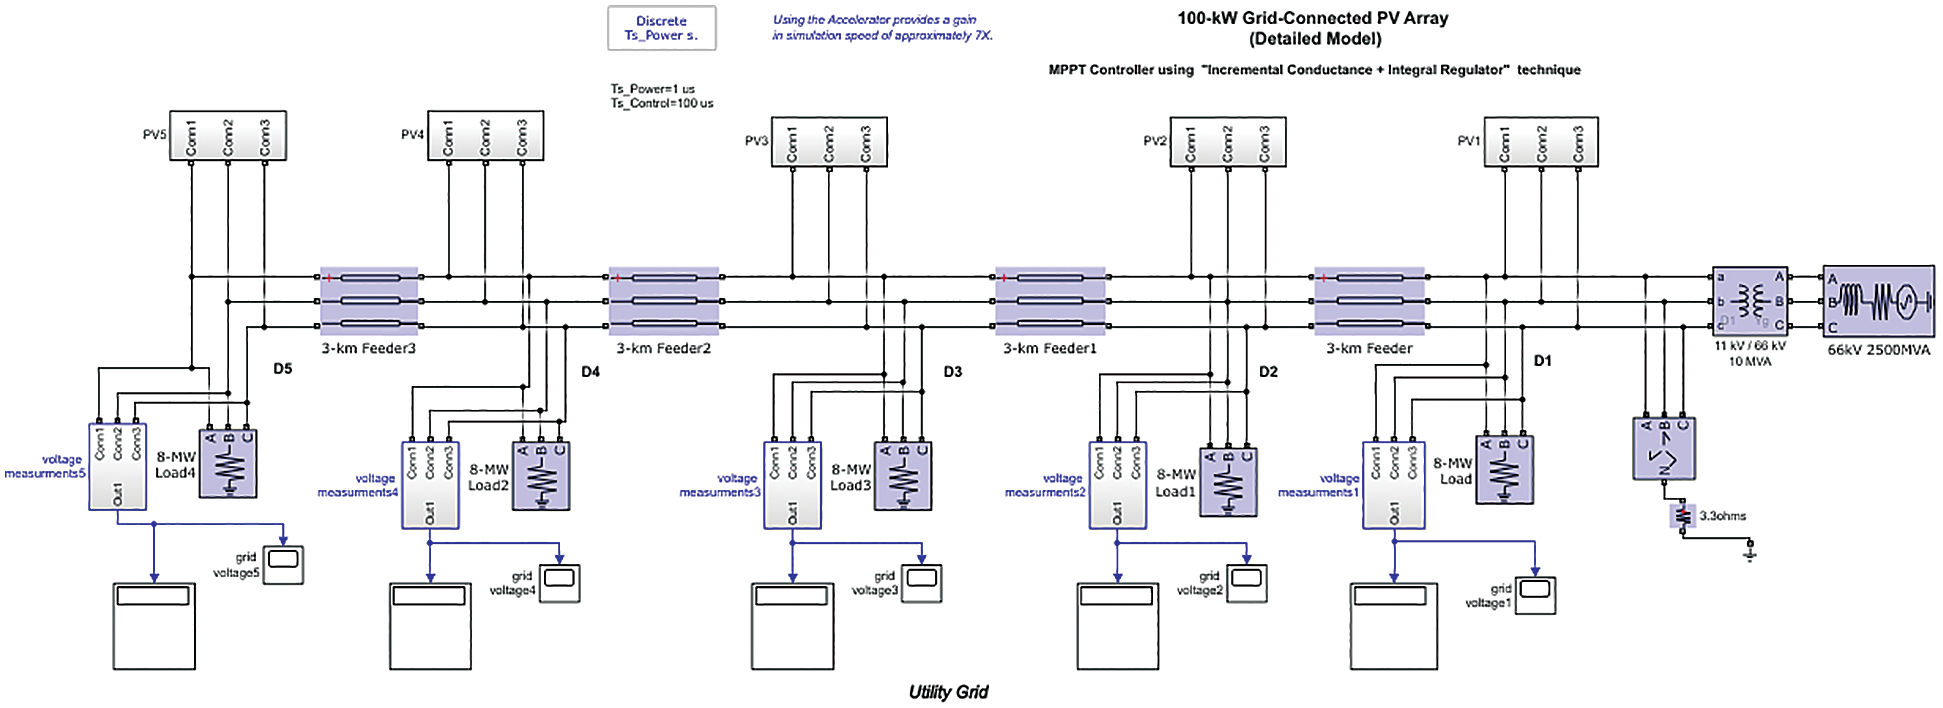
Figure 2: Simulation of the integration of the microgrid and utility system
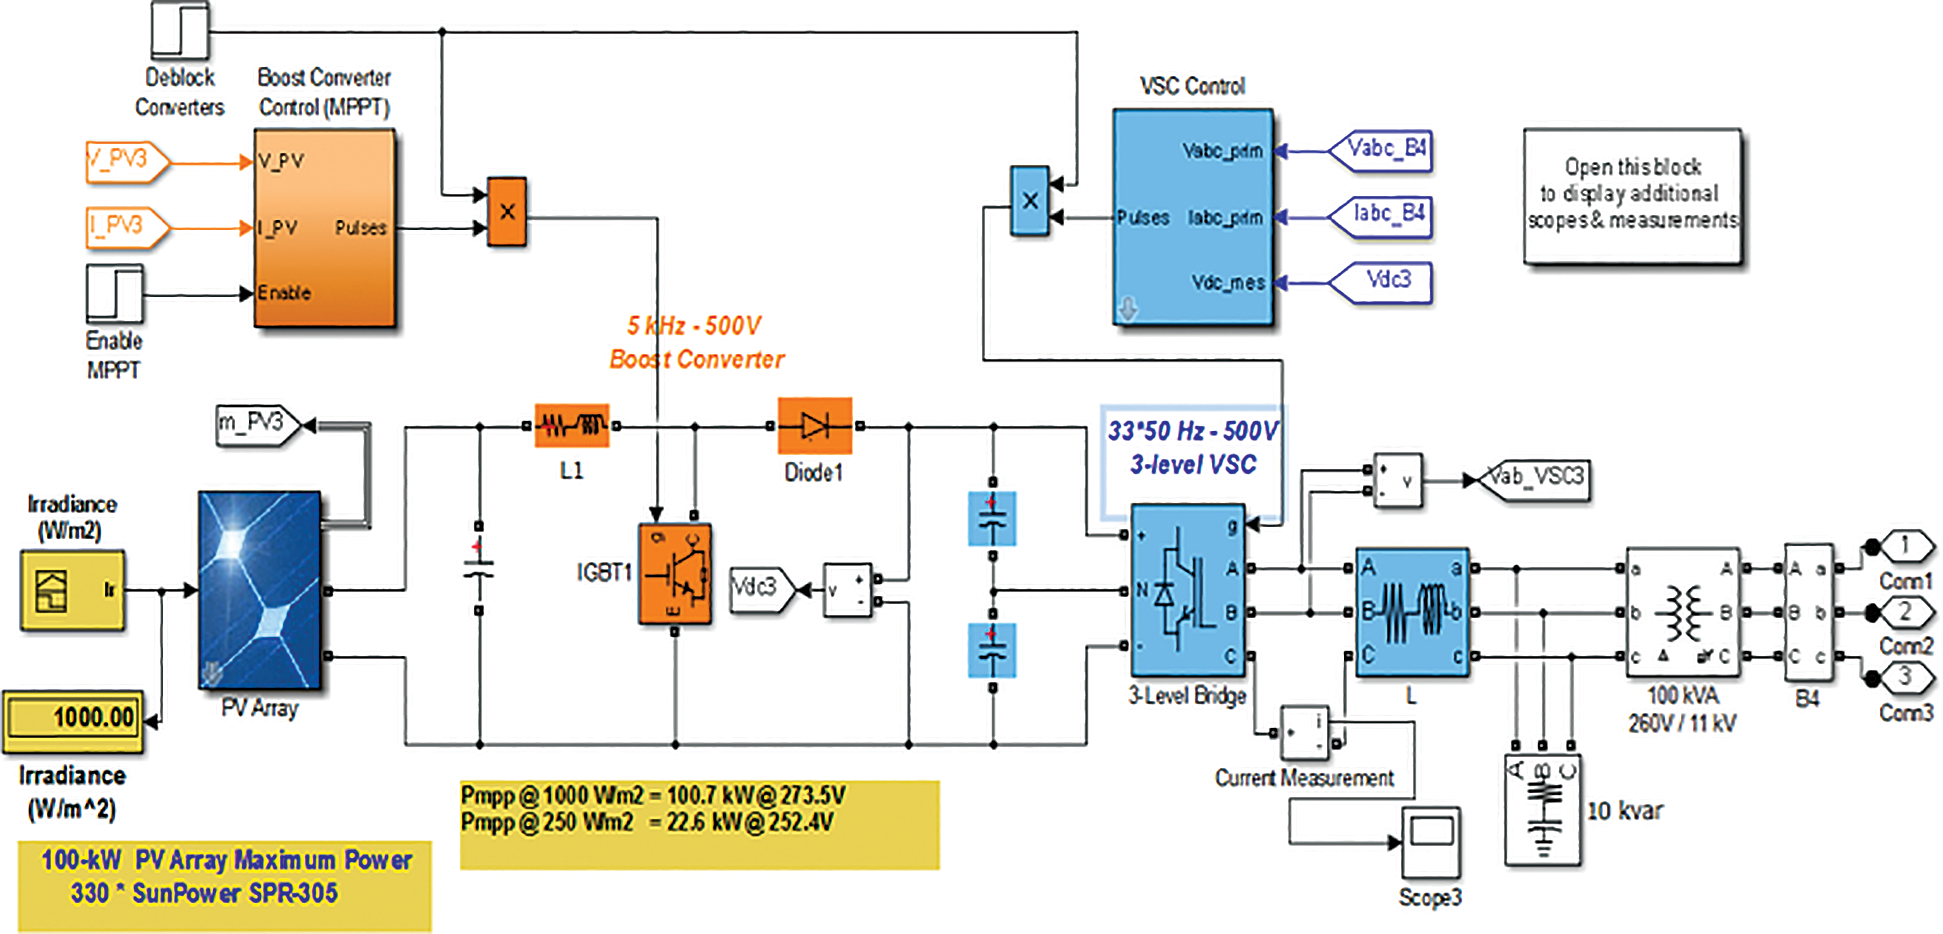
Figure 3: Modeling of 100-kW microgrid system components
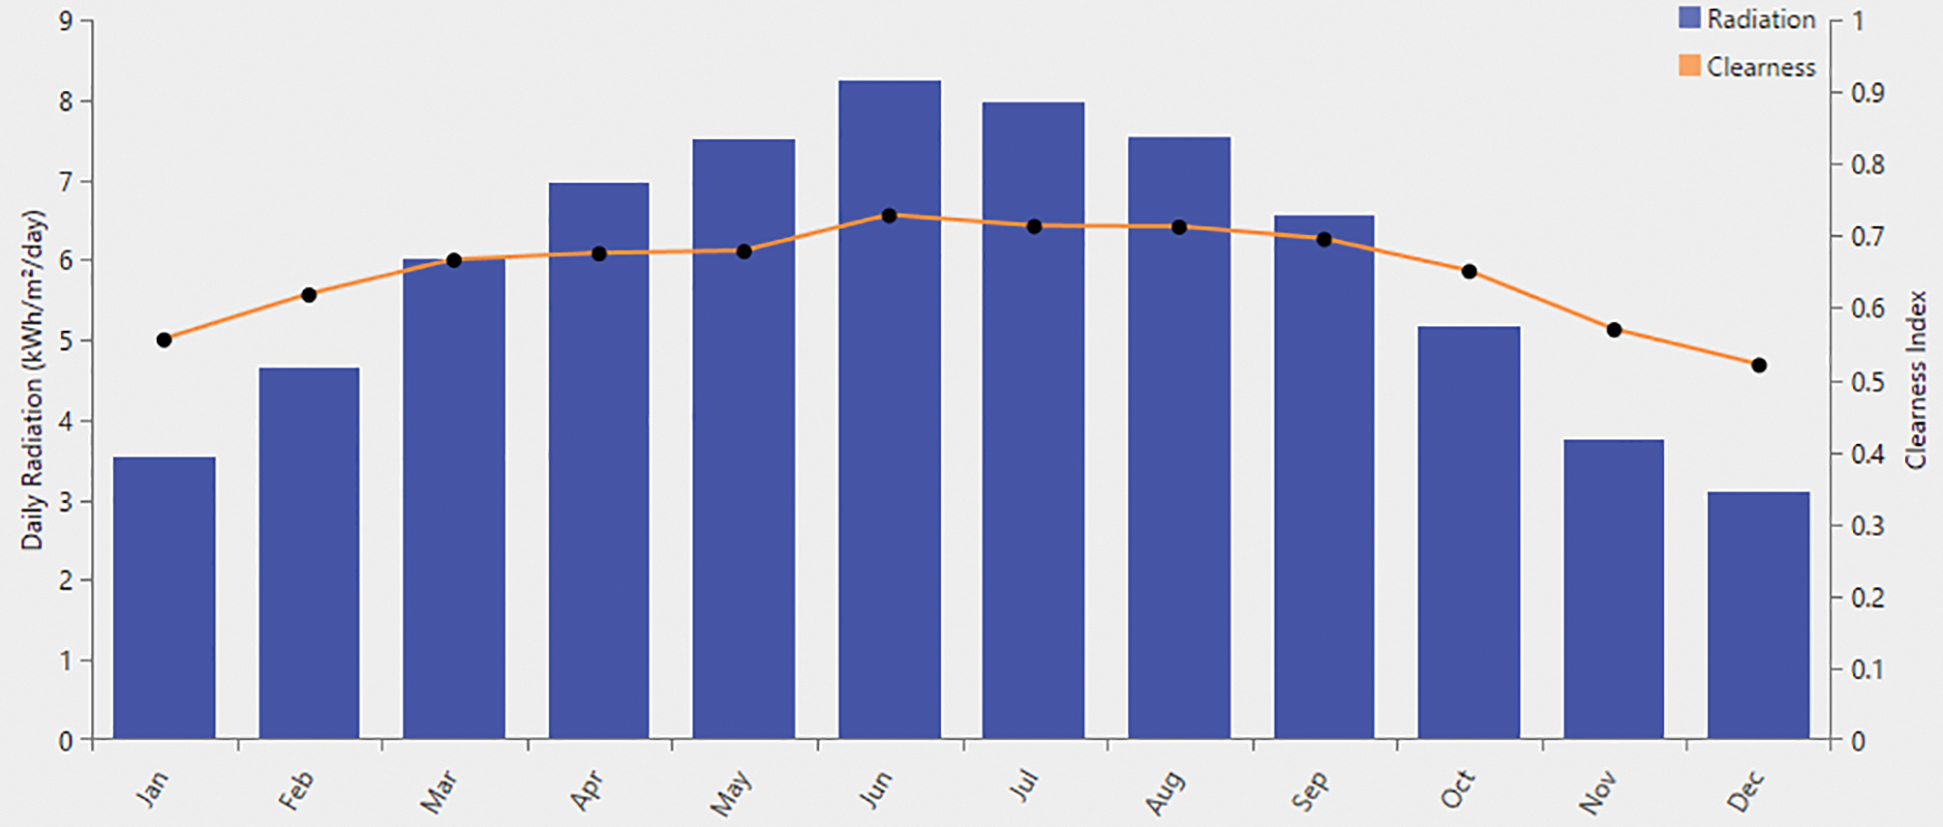
Figure 4: Average monthly irradiance (kW/m2/day) and clearness index (CI) values for New Assiut City, Egypt [9,11,12]
This study is aimed at analyzing the power quality issues surrounding the integration of microgrids and utility systems. As explained above, five voltage analysis scenarios and two THD scenarios at different solar irradiance and load conditions are discussed in this study.
4.1.1 Scenario A: Voltage Analysis of Microgrid and Utility System at Minimum Load with Maximum Solar Irradiance
This scenario assumes minimum load conditions of 0.25 MW and maximum solar irradiance of 871.5. As shown in Fig. 4, the voltage levels at each node—D1, D2, D3, D4, and D5—are approximately 9.14 kV, 8.95 kV, 8.9 kV, 8.85 kV, and 8.5 kV, respectively. The voltage at node D1 is higher than at node D5, and the voltage drop percentage at nodes D1 and D5 are 1.2% and 1.53%, respectively. This voltage drop is lower than the drop using utility system only due to the excess power supply generated by the microgrids, which is applied to loads at their nodes to overcome the voltage drop due to line impedances, as shown in Tab. 1, Fig. 5.
4.1.2 Scenario B: Voltage Analysis Based on Utility System Only (Minimum Load)
Next, the simulation performed a voltage analysis of the utility system only, without connecting microgrid systems, to supply a load of 0.25 MW, the minimum load condition. Based on the simulation, the voltage levels at nodes D1, D2, D3, D4, and D5 are around 9.05 kV, 8.8 kV, 8.75 kV, 8.7 kV, and 8.65 kV, respectively, where node D1 is close to the transformer. The percentage voltage drops at nodes D1 and D5 are 2.41% and 3.5%, respectively. The voltage level decreases with increasing distance from node D1 towards node D5 due to the rising value of feeder impedance due to its length, as listed in Tab. 1 and shown in Fig. 5.
4.1.3 Scenario C: Voltage Analysis of Microgrid and Utility System at Peak Load with Maximum Solar Irradiance
A voltage analysis of the integrated microgrid and utility system at a peak load of 1 MW, and a maximum solar irradiance of 871.5 W/m2 was performed. The voltage at nodes D1, D2, D3, D4, and D5 are approximately 8.98 kV, 8.7 kV, 8.64 kV, 8.6 kV, and 8.58 kV, respectively. The percentage voltage drops at nodes D1 and D5 are 1.75% and 6.13%, respectively, as listed in Tab. 1 and shown in Fig. 5.
4.1.4 Scenario D: Voltage Analysis of Microgrid/Utility System at Peak Load with Minimum Solar Irradiance
This scenario performed a voltage analysis of the integrated microgrid and utility system at a peak load of 1 MW, with a minimum PV generation at an irradiance of 319.8 W/m2. The voltage at nodes D1, D2, D3, D4, and D5 are around 8.9 kV, 8.65 kV, 8.58 kV, 8.54 kV, and 8.52 kV, respectively. The percentage voltage drops at nodes D1 and D5 are 2.18% and 6.78%, respectively, which are higher than Scenario C, as listed in Tab. 1 and shown in Fig. 5. The power generation from the microgrid at each node is around 12.5% of peak PV generation due to minimum solar irradiance.
4.1.5 Scenario E: Voltage Analysis Based on Utility System Only (Peak Load)
Lastly, the simulation performed a voltage analysis of the utility system only, without connecting to microgrid systems, at a peak load of 1 MW. From the simulation, the voltage levels at nodes D1, D2, D3, D4, and D5 are around 8.69 kV, 8.56 kV, 8.48 kV, 8.43 kV, and 8.41 kV, respectively, where node D1 is close to the transformer. The percentage voltage drops at nodes D1 and D5 are 4.92% and 7.99%, respectively. The voltage level decreases with increasing distance from node D1 towards node D5 at peak load due to the rising value of feeder impedance, as listed in Tab. 1 and shown in Fig. 5.
4.2 Total Harmonic Distortion (THD)
4.2.1 Scenario A: Harmonics Analysis of Microgrid and Utility System at Minimum Load with Different Solar Irradiances due to Shading
The THD analysis of the microgrid and utility system at minimum load, 1 MW, with different solar irradiances—900, 600, and 300 W/m2—was obtained, as shown in Tab. 2. The voltage and current harmonics distortions at nodes D1 to D5 have been analyzed as listed in Tab. 2 and shown in Figs. 6 and 7. It is clear from the results that by increasing the number of under-shading cells, the output voltage of the converter decreases, it reduces the fundamental harmonic amplitude of the output waveform, and, in general, causes an increase in the THD of the output voltage or current in this scenario. The THD level of current harmonics is high at all nodes as compared to the voltage harmonics levels. The THD level of current decreases from node D1 to D5 whereas the THD level of voltage increases from node D1 to D5.
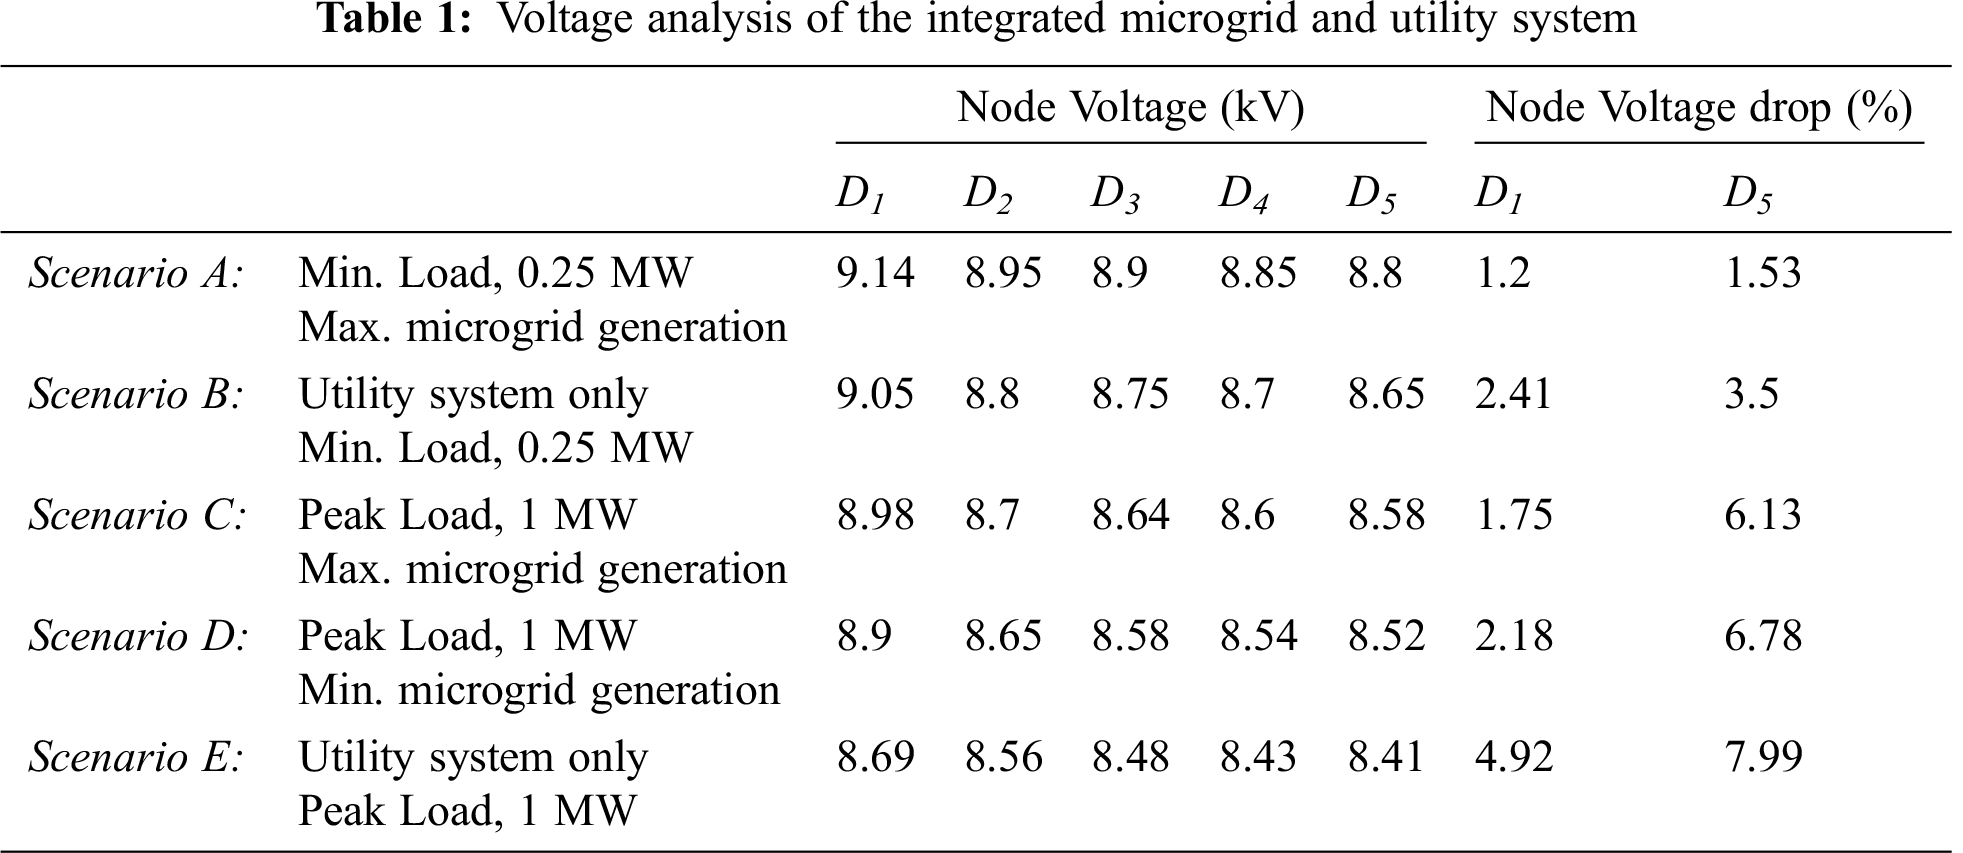
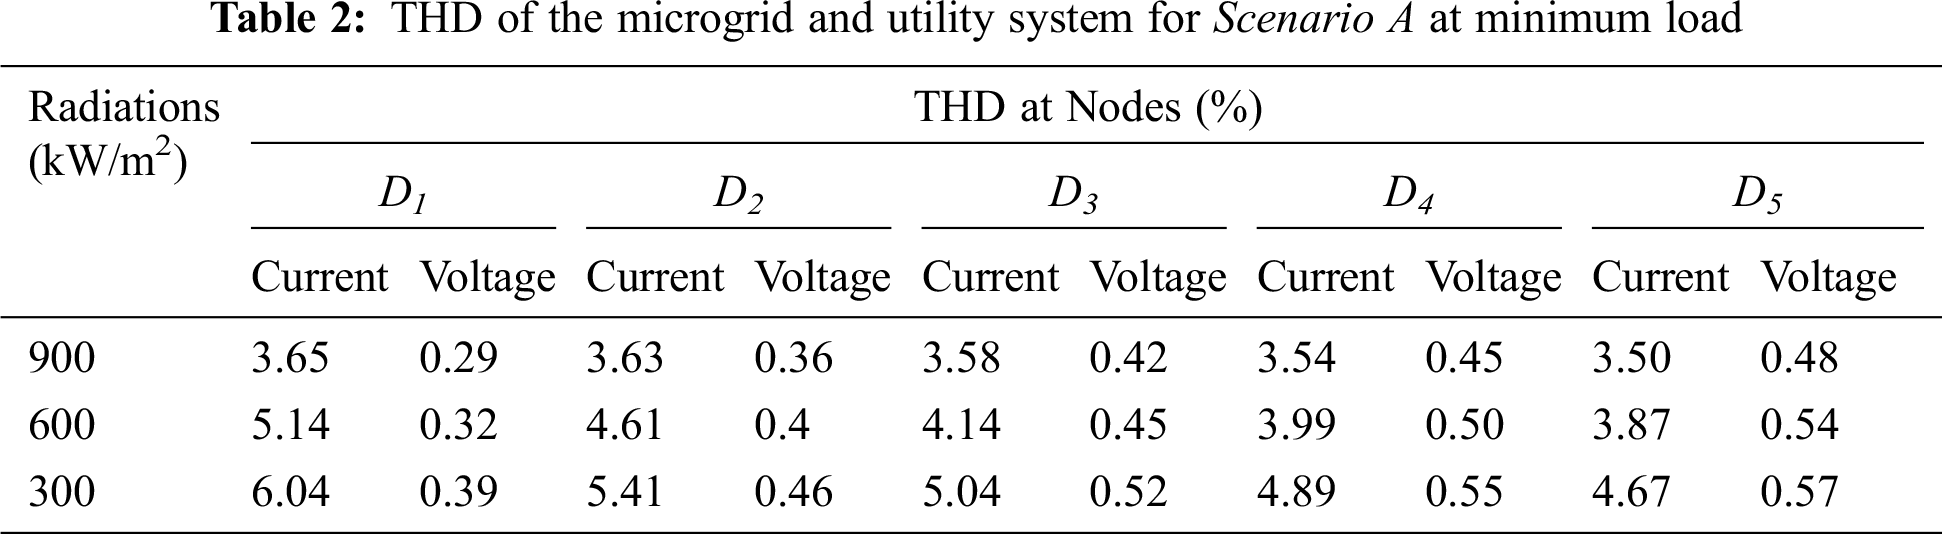
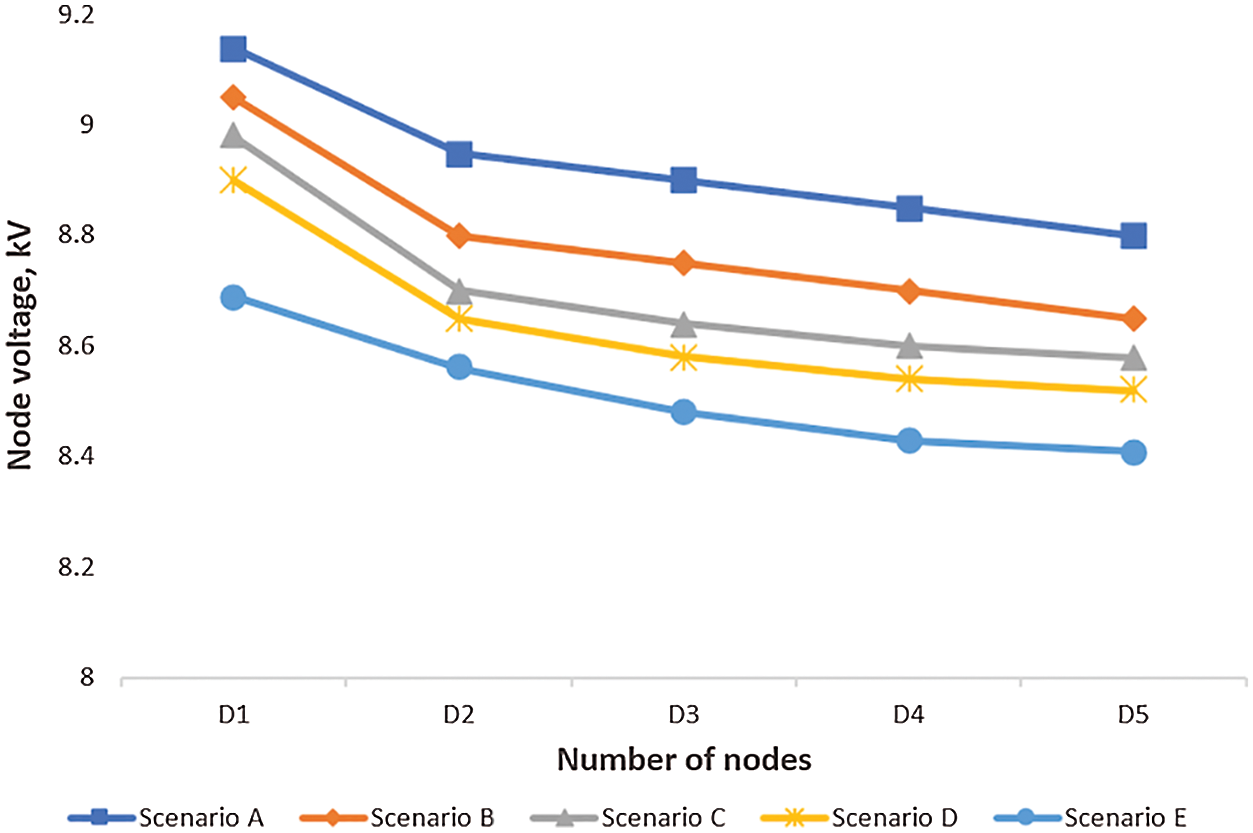
Figure 5: Voltage analysis of the integrated microgrid and utility system
4.2.2 Scenario B: Harmonics Analysis of the Microgrid and Utility System at Maximum Load with Different Solar Irradiance Due to Shading
Next, a THD analysis of the microgrid and utility system at a peak load of 1 MW with a minimum solar irradiance of 319.8 W/m2 was obtained. Voltage and current harmonics values at node D5 are 0.18% and 7.96% while at node D1 are 0.13% and 8.36%, respectively, as shown in Tab. 3, Figs. 8 and 9. The results show that the THD values at the far end of the feeder, node D5, are higher voltage harmonic values than values at node D1 which is closest to the transformer. Also, THD values increase with increasing solar irradiation with the same peak load.
Additionally, a THD analysis of the microgrid and utility system at a maximum load of 1 MW with different solar irradiances of 900, 600, and 300 W/m2 were obtained. The voltage and current harmonics distortions at nodes D1 and D5 are analyzed in Tab. 3, Figs. 8 and 9. The results show that, in this scenario, by increasing the number of under-shading cells, the output voltage of the converter decreases, it reduces the fundamental harmonic amplitude of the output waveform, and, in general, causes an increase in the THD of the output voltage or current. The THD level of current harmonics is high at all nodes as compared to the voltage harmonics levels. The THD level of current decreases from node D1 to D5, whereas the THD level of voltage increases from node D1 to D5.
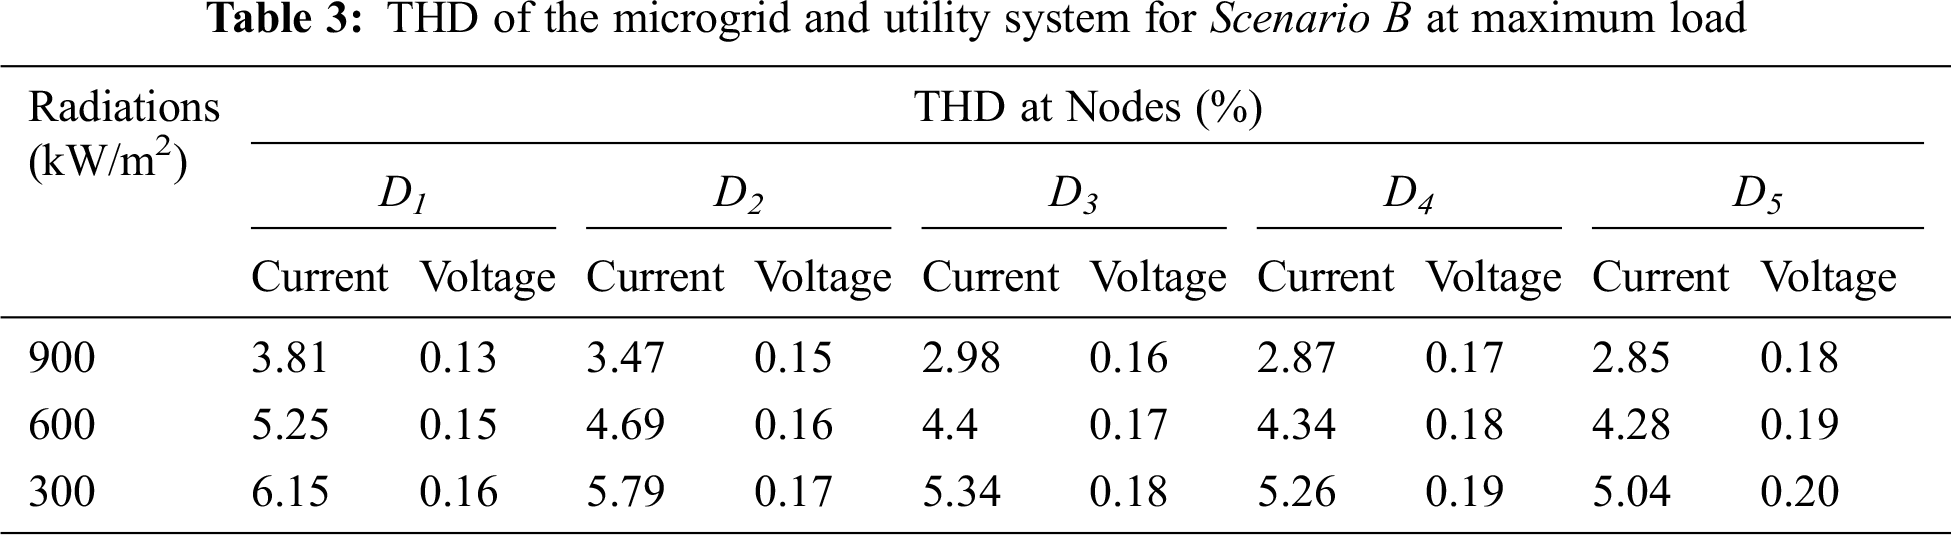
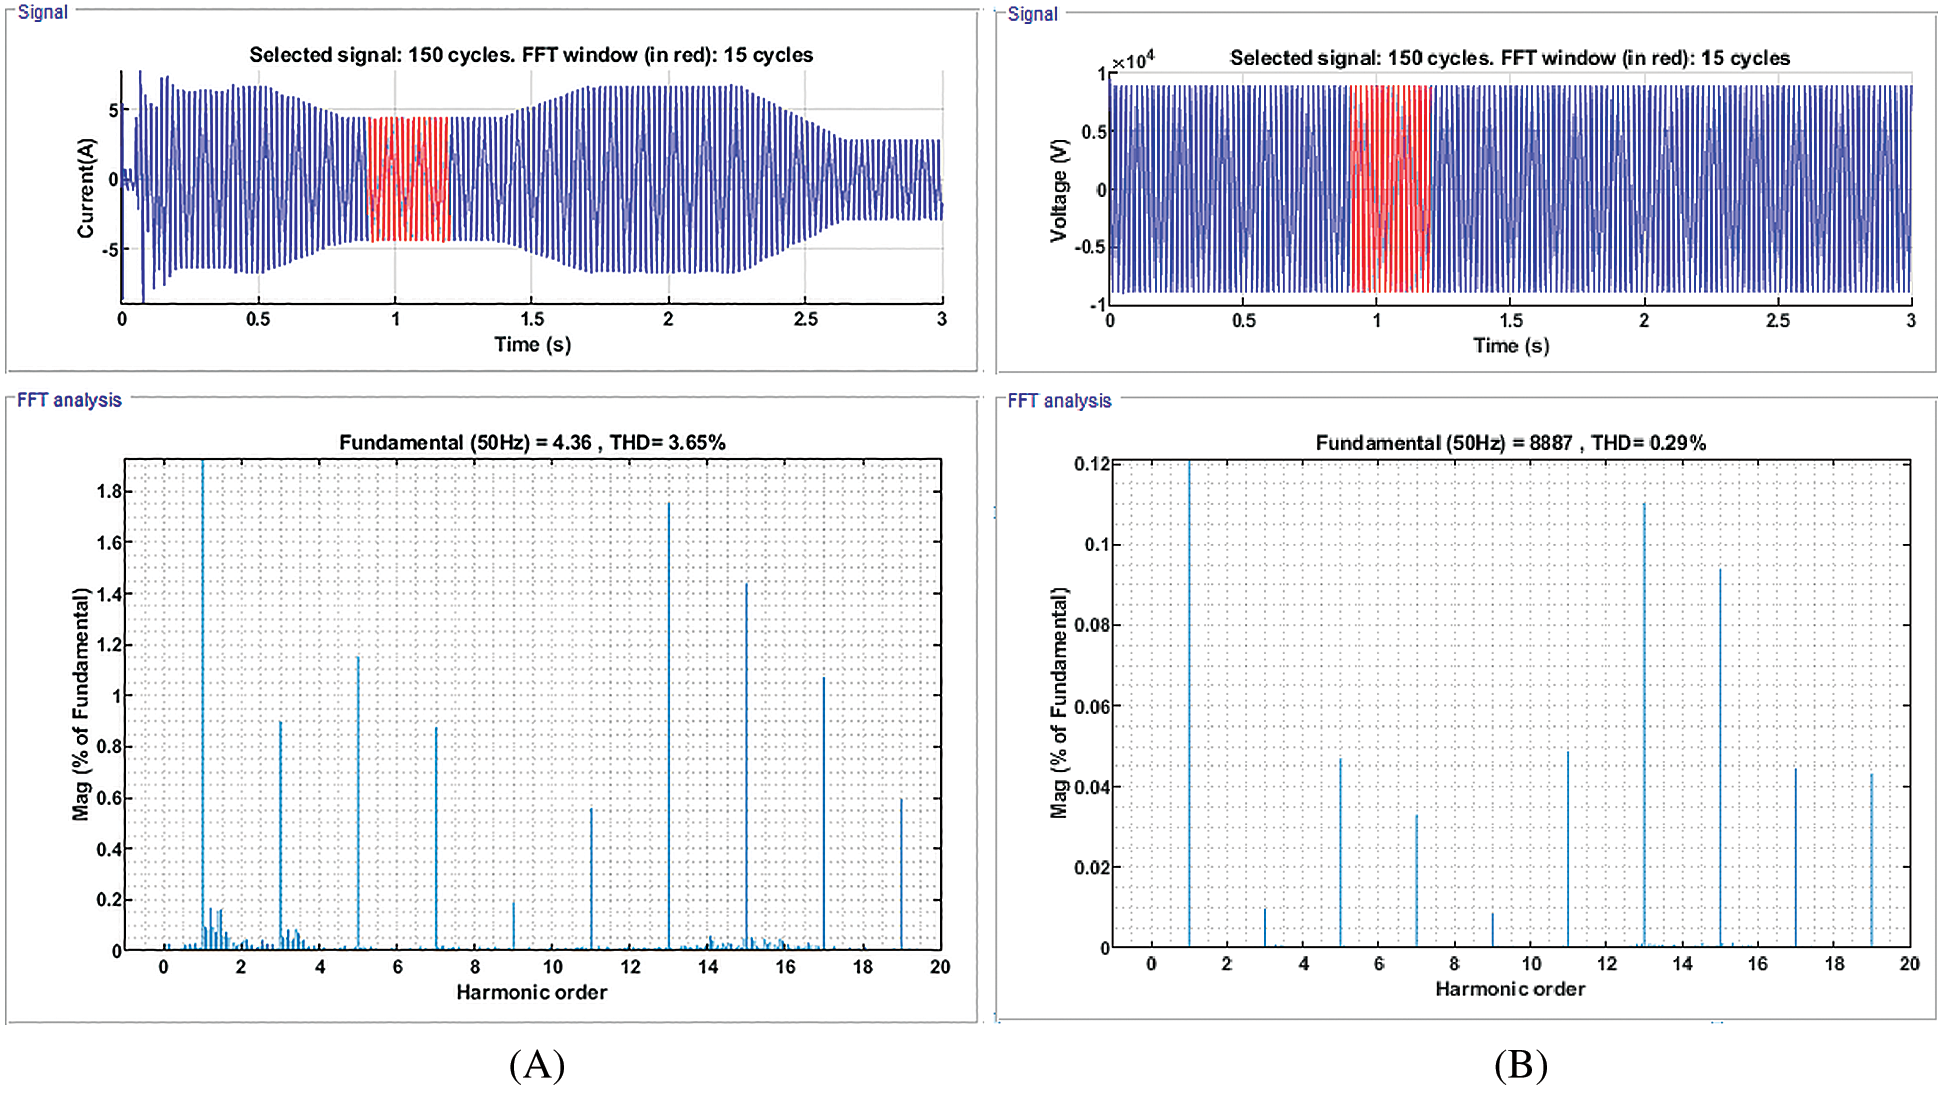
Figure 6: Voltage and current harmonic values at node D1, Scenario A. (A) Voltage harmonic values. (B) Current harmonic values
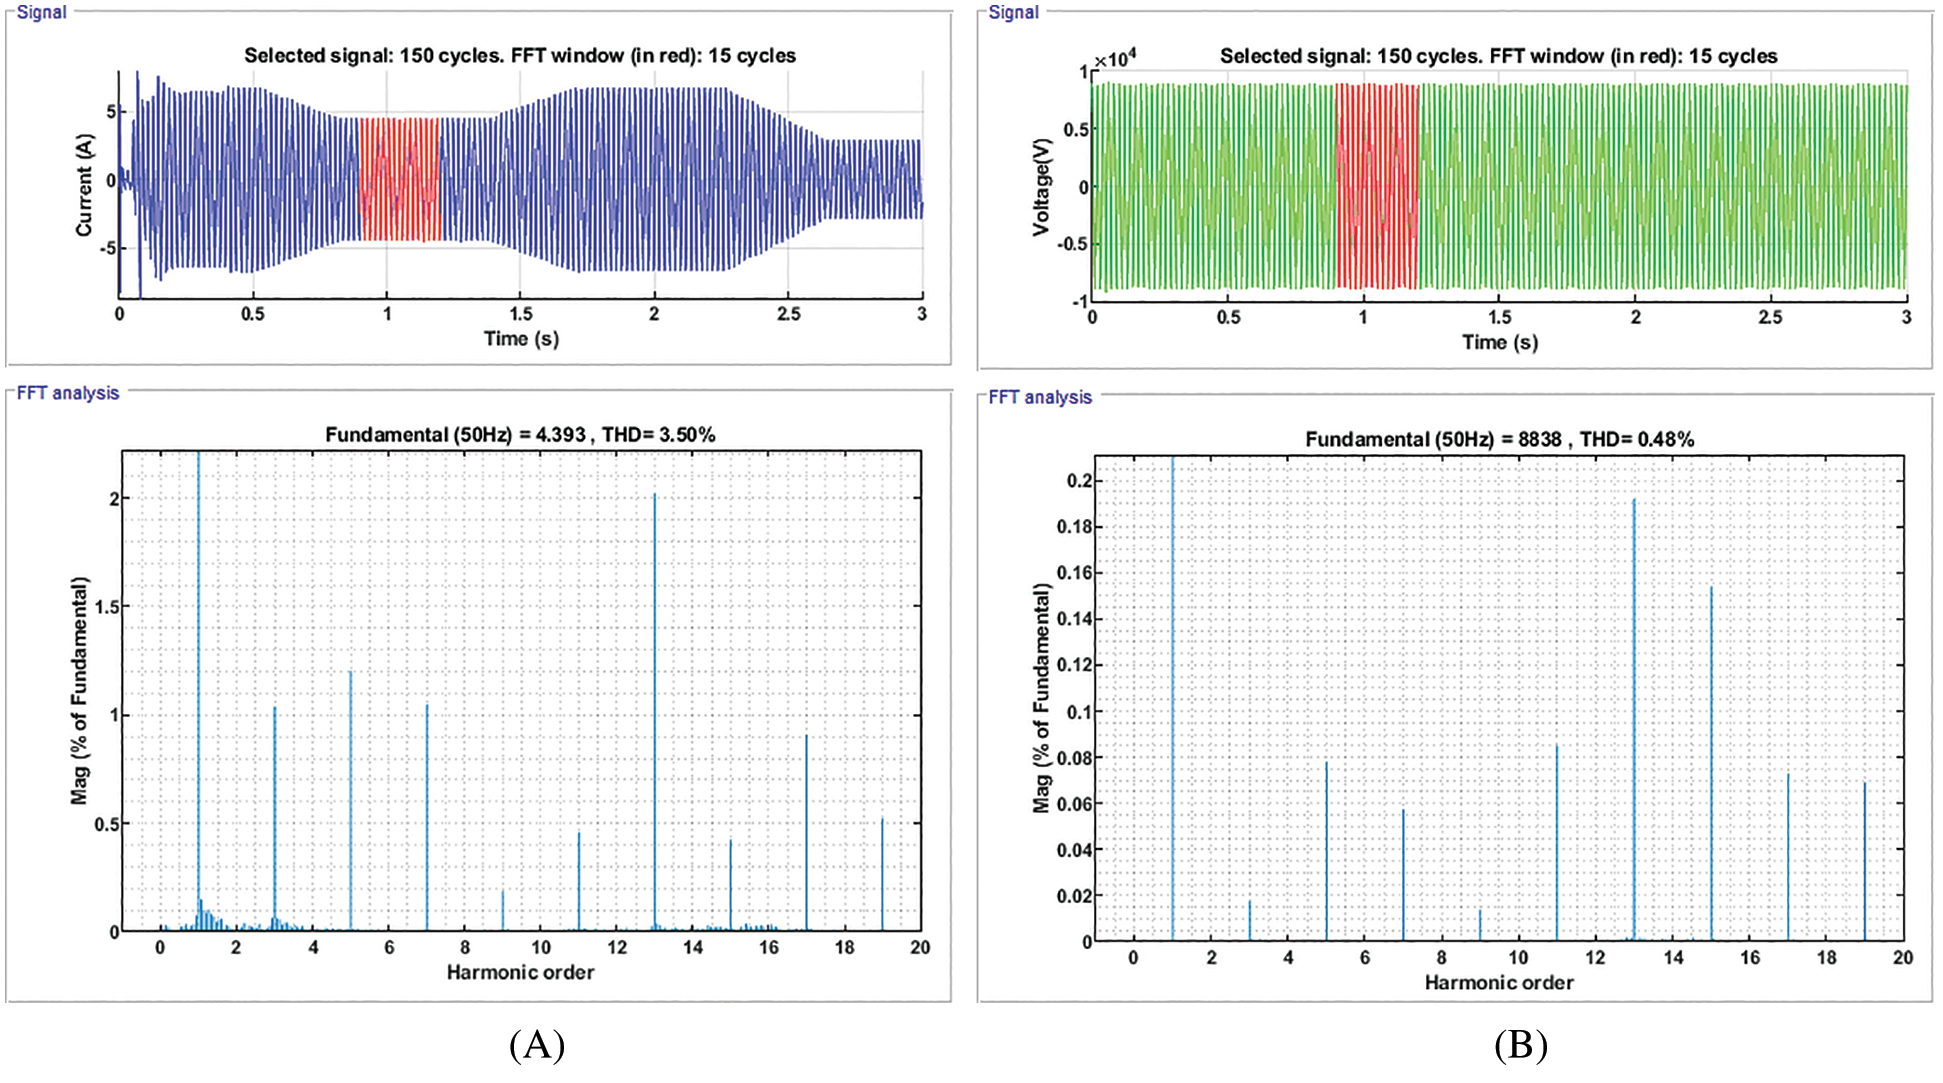
Figure 7: Voltage and current harmonic values at node D5, Scenario A. (A) Voltage harmonic values. (B) Current harmonic values
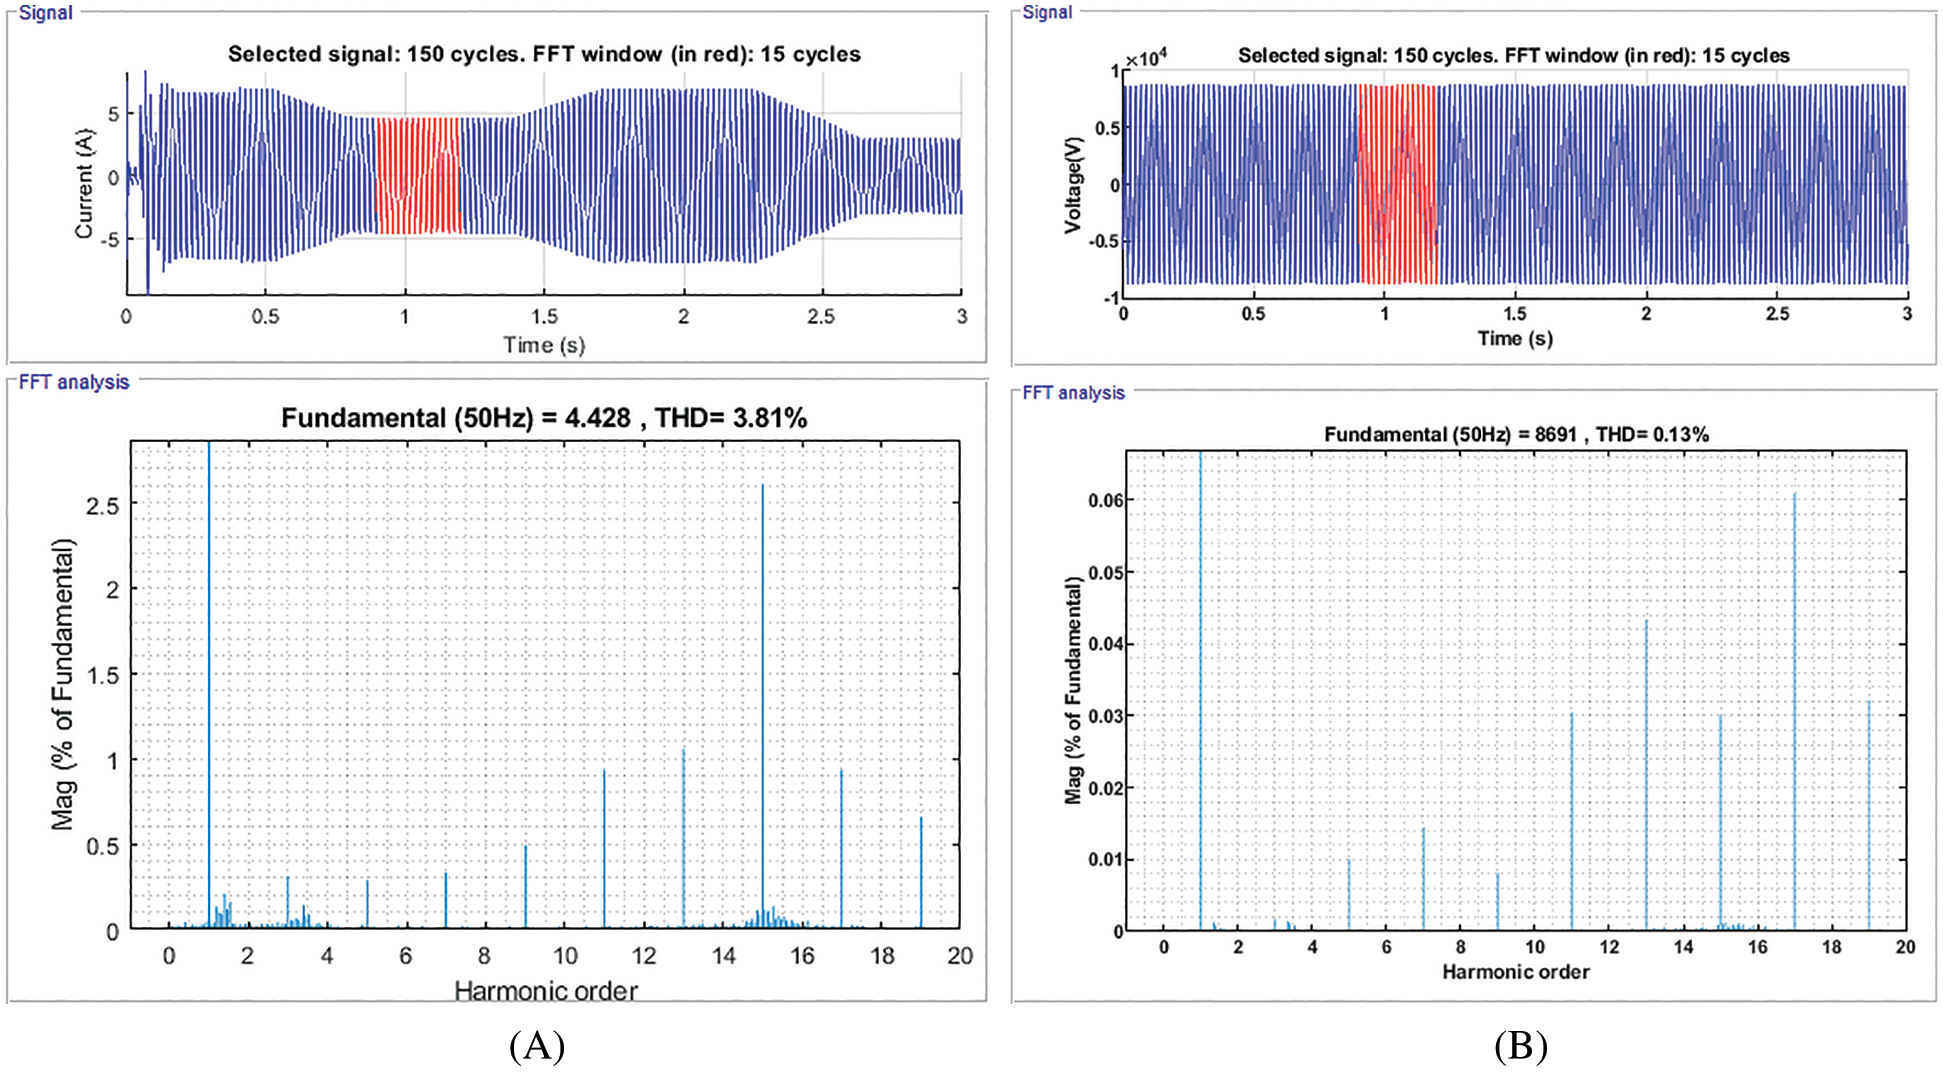
Figure 8: Voltage and current harmonic values at node D1, Scenario B. (A) Voltage harmonic values. (B) Current harmonic values
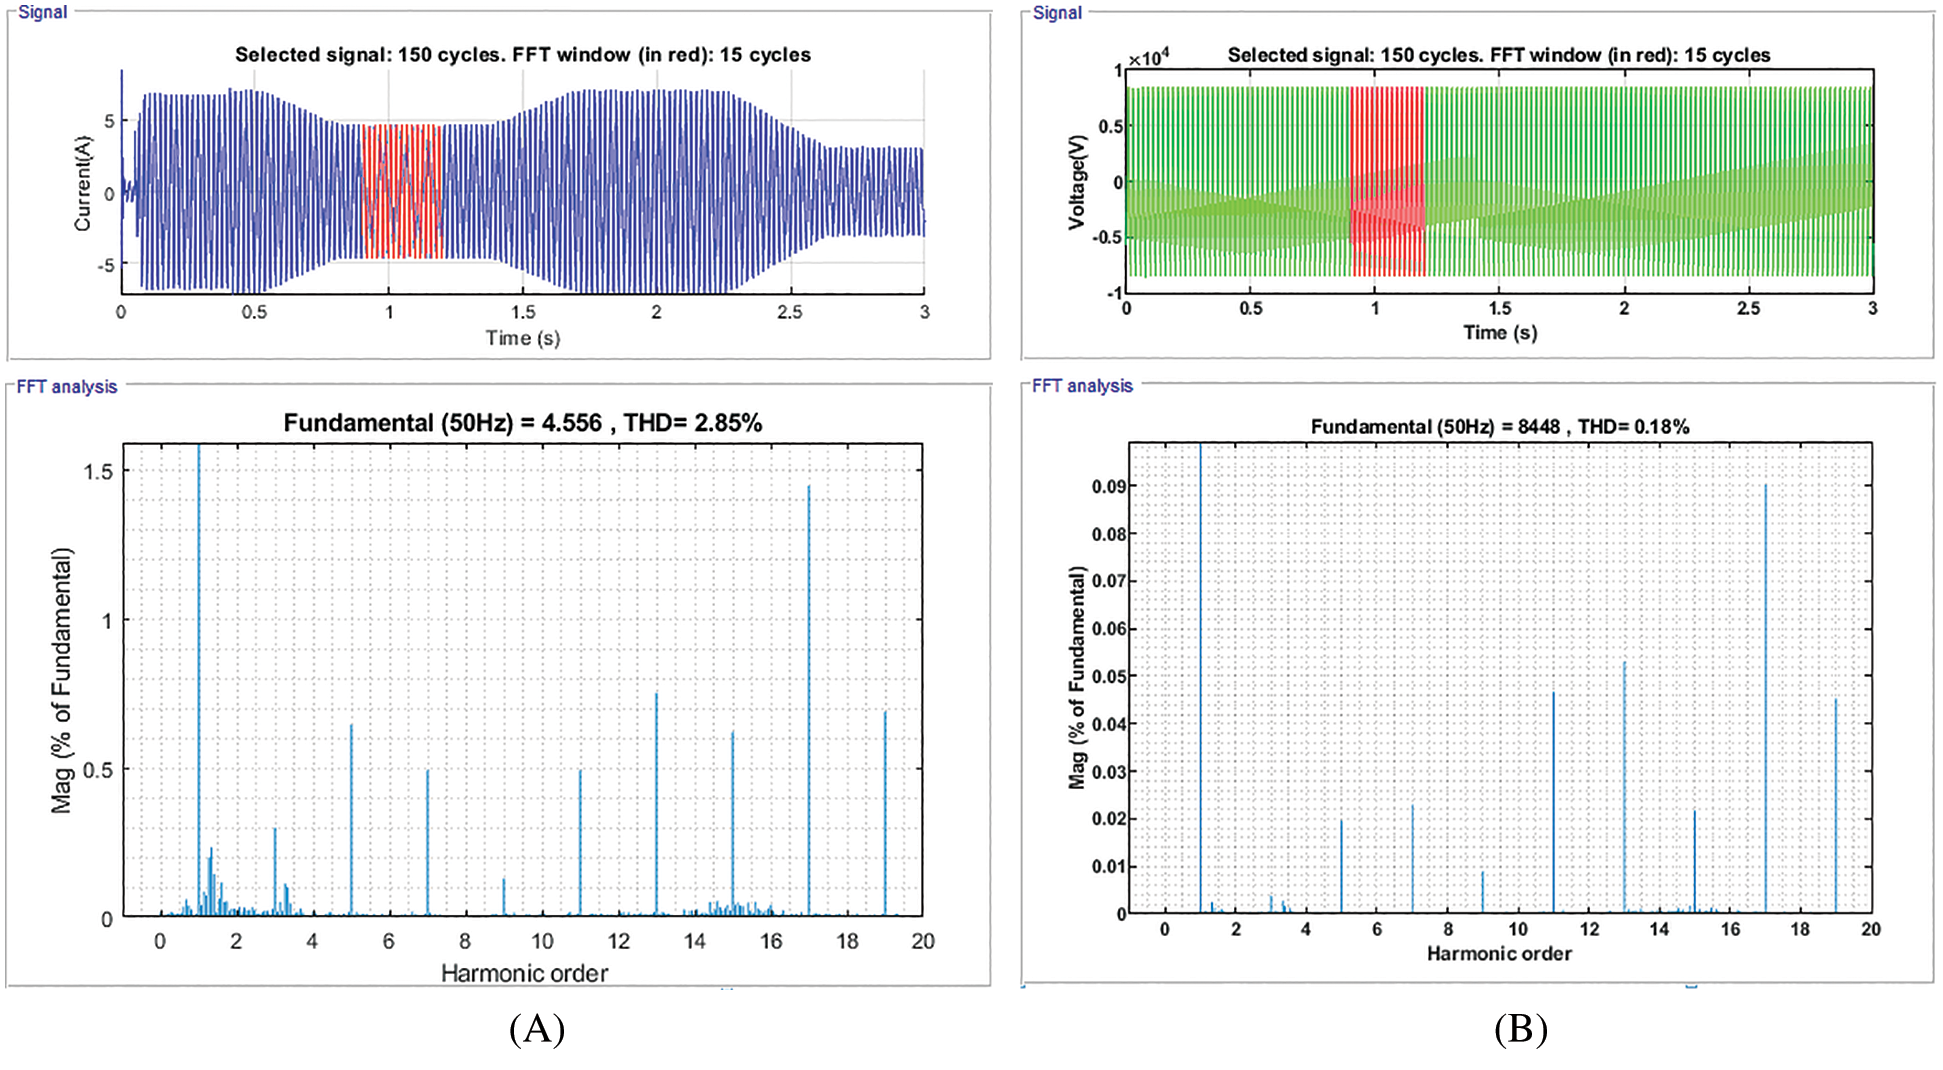
Figure 9: Voltage and current harmonic values at node D5, Scenario B. (A) Voltage harmonic values. (B) Current harmonic values
This study developed a simulation to analyze the power quality issues—including voltage fluctuations and harmonic injection in the LV side—of the integrated microgrid and utility system based on the PV solar system. This study addresses five scenarios of voltage analysis and two scenarios of total harmonic distortion at different solar irradiation and load conditions. In Scenario A, the voltage level at the far end of the feeder, node D5, is less than the voltage level close to the transformer, node D1. The voltage drops at the far end, node D5, depend on the length of the distribution feeder due to its impedance level. Additionally, there is no power supply at these nodes because no solar PV system is used and only the utility feeding the loads. In Scenario B, the use of a solar PV system at nodes D1, D2, D3, D4, and D5 is effective in minimizing the voltage drop at all nodes for several load conditions with high solar radiation. In Scenario C, the voltage drop level at the nodes at the far end are similar to Scenario A. In Scenario D, although a solar PV system is supplying power to the load, the power is not enough to compensate for the drop in voltage due to low solar irradiance. In Scenario E, the voltage analysis is based on the utility system only. For the simulation of the utility system only, without connecting to microgrid systems, at a peak load of 1 MW the voltage level decreases with increasing distance from node D1 towards node D5 at peak load due to the rising value of feeder impedance.
The THD analysis shows that while distribution network feeding peak loads and microgrids generate maximum or minimum power due to maximum or minimum solar radiation, respectively, THD values are high at far end nodes, D5, as compared by nearest nodes, D1. THD values are reduced to a minimum level at minimum solar irradiance when compared with maximum solar irradiance conditions. This is due to using a greater number of inverters in case of maximum solar irradiance. However, maximum voltage deviation and THD are within the tolerance level of the AS777 standard.
This research can help utilities and customers to minimize any impact on power quality factors in the distribution network while integrating large-scale microgrids into the network. In future research, the authors would like to compare the simulation results with experimental or real-world research.
Acknowledgement: The authors would like to acknowledge the financial support received from Taif University Researchers Supporting Project Number (TURSP-2020/278), Taif University, Taif, Saudi Arabia.
Funding Statement: This research was funded by Taif University Researchers Supporting Project, grant number TURSP-2020/278 and the APC was funded by Dr. Basem Alamri.
Conflicts of Interest: The authors declare that they have no conflicts of interest to report regarding the present study.
1. H. Rezk, M. Al-Dhaifallah, Y. B. Hassan and H. A. Ziedan, “Optimization and energy management of hybrid photovoltaic-diesel-battery system to pump and desalinate water at isolated regions,” IEEE Access, vol. 8, pp. 102512–102529, 2020. [Google Scholar]
2. D. P. Kaundinya, P. Balachandra and N. H. Ravindranath, “Grid-connected versus stand-alone energy systems for decentralized power—A review of literature,” Renewable and Sustainable Energy Reviews, vol. 13, no. 8, pp. 2041–2050, 2009. [Google Scholar]
3. H. Rezk, M. Alghassab and H. A. Ziedan, “An optimal sizing of stand-alone hybrid PV-fuel cell-battery to desalinate seawater at Saudi Neom city,” Design, Control and Optimization of Desalination Processes, vol. 8, no. 4, pp. 382, 2020. [Google Scholar]
4. N. M. Abdel-Rahim and J. E. Quaicoe, “Analysis and design of a multiple feedback loop control strategy for single-phase voltage-source UPS inverters,” IEEE Transactions on Power Electronics, vol. 11, no. 4, pp. 532–541, 1996. [Google Scholar]
5. F. U. Qiang, L. F. Montonya, A. Solanki, A. Nasiri and V. Bahavaraju, “Microgrid generation capacity design with renewables and energy addressing power quality and surety,” IEEE Transaction on Smart Grid, vol. 3, no. 4, pp. 2019–2027, 2012. [Google Scholar]
6. S. Chowdhury, S. P. Chowdhury and P. Crossley, Microgrids and active distribution networks, 1st edition. London, United Kingdom: The Institution of Engineering and Technology, 2009. [Google Scholar]
7. W. El-Khattam and M. Salama, “Distributed generation technologies, definitions and benefits,” Electric Power Systems Research, vol. 71, no. 2, pp. 119–128, 2004. [Google Scholar]
8. R. Torquato, F. C. F. Trindade and W. Freitas, “Analysis of the harmonic distortion impact of photovoltaic generation in Brazilian residential networks,” in 16th IEEE Int. Conf. on Harmonics and Quality of Power (ICHQPBucharest, pp. 239–243, 2014. [Google Scholar]
9. K. J. P. Macken, K. Vanthournout, J. V. den Keybus, G. Deconinck and R. J. M. Belmans, “Distributed control of renewable generation units with integrated active filter,” IEEE Transactions on Power Electronics, vol. 19, no. 5, pp. 1353–1360, 2004. [Google Scholar]
10. H. Rezk, T. S. Babu, M. Al-Dhaifallah and H. A. Ziedan, “A robust parameter estimation approach based on stochastic fractal search optimization algorithm applied to solar PV parameters,” Energy Reports, vol. 7, no. 5, pp. 620–640, 2021. [Google Scholar]
11. A. Tsikalakis, T. Tomtsi, N. D. Hatziargyriou, A. Poullikkas, C. Malamatenios et al., “Review of best practices of solar electricity resources applications in selected Middle East and North Africa (MENA) countries,” Renewable and Sustainable Energy Reviews, vol. 15, no. 6, pp. 2838–2849, 2011. [Google Scholar]
12. I. Moukhtar, A. A. Elbaset, A. Z. E. Dein, Y. Qudaih, E. Blagin et al., “A developed concentrated solar power model using artificial neural network technique,” in 19th IEEE Int. Middle-East Power System Conf. (MEPCON’17Egypt: Menoufia University, pp. 1346–1350, 2017. [Google Scholar]
13. L. Y. Vilathgamuwa and D. M. Loh, “Microgrid power quality enhancement using a three-phase four-wire grid-interfacing compensator,” IEEE Transactions on Industry Applications, vol. 41, no. 6, pp. 1707–1719, 2005. [Google Scholar]
 | This work is licensed under a Creative Commons Attribution 4.0 International License, which permits unrestricted use, distribution, and reproduction in any medium, provided the original work is properly cited. |