DOI:10.32604/iasc.2021.018944
| Intelligent Automation & Soft Computing DOI:10.32604/iasc.2021.018944 | |
| Article |
An Intelligent Business Model for Product Price Prediction Using Machine Learning Approach
1Department of Software Engineering, Mehran University of Engineering & Technology, Jamshoro, 76062, Pakistan
2College of Computer Science and Information Systems, Najran University, Najran, 61441, Saudi Arabia
3College of Computer Science and Engineering, University of South Florida, Tampa, 33620, USA
*Corresponding Author: Asadullah Shaikh. Email: shaikhasad@hotmail.com
Received: 27 March 2021; Accepted: 28 April 2021
Abstract: The price of a product plays a vital role in its market share. Customers usually buy a product when it fits their needs and budget. Therefore, it is an essential area in the business to make decisions about prices for each product. The major portion of the business profit is directly connected with the percentage of the sale, which relies on certain factors of customers including customers’ behavior and market competitors. It has been observed in the past that machine learning algorithms have made the decision-making process more effective and profitable in businesses. The fusion of machine learning with business intelligence systems has produced potentially better results for business workers. This study proposes a fusion model of machine learning and business intelligence to facilitate the effective pricing mechanism of products. Three machine learning algorithms namely (1) Multiclass Random Forest, (2) Multiclass Logistic Regression and (3) Multiclass one-vs-all have been applied for product price prediction. This intelligent business model helps business workers to set product pricing and discounts based on customer’s buying behavior (i.e., customer’s average amount spent in buying items). The model also predicts the demand for the product in the market, which may help in making effective decisions about the product to gain a better productivity. The performance of the model has been evaluated using hold-out cross validation. Multiclass one-vs-all out performed the other two algorithms in terms of average log-loss and it produced better accuracy in prediction for both hold-out as well as cross validation. The outcomes of the proposed model may help businesses in exploring business data and to gain higher share in the market.
Keywords: Machine learning; data mining; business intelligence; data analysis
The emergence of data mining techniques and business intelligence systems have made the business workers’ life easier towards critical decision making [1]. It has proven to be a better strategy from decision-making to design of infrastructure, management [2], and customer retention. The business intelligent systems collect and analyze customer data and help in prediction for business improvements and overall organizational performance [3]. These systems rely on online analytical processing (OLAP) and data mining techniques [4] to provide better customer services. Data mining plays an essential role in the success of a business intelligence system, due to the fact that it deals with several issues related to data including heterogeneity, immense volume, the speed at which data is being produced, and many more [5]. Data mining identifies meaningful patterns from large data volumes, it reveals customer behavior in terms of customer buying trends [6,7], market basket analysis [8–10], fraud detection, and much other important information in several application domains. The customer buying pattern is one of the essential information in improving organizational productivity for businesses, which utilize business intelligent systems. Besides, these businesses also gain more customer satisfaction. However, the major factor that remains always a key point in buying is the price of a product. It happens more often that despite loving a product, customers don’t buy it even with a discount due to high pricing. The product price often makes customers get out of budget, thus, leaving no other option for the customer but to give up buying the product. This business phenomenon is the main motivation behind this research study. The buying patterns of the customers can be considered as the base for making decisions about product pricing at normal business routine as well as during sales (i.e., discounts) offers. Moreover, the surge in profit and plunge in loss can also be analyzed through the customer buying patterns and customer feedback. Another important aspect of product price is to review its initial price. The review or revisit of product price activity may be carried out when the product fails to achieve an acceptable number of transactions and/or unsatisfactory customer feedback.
This research study proposes an intelligent business model to set up product prices, which results in a win-win situation for the customer as well as for the business. The customer wins by buying the desired product at an affordable price and the business wins by selling out the maximum number of products at a certain time and keeping the profit stable. The model predicts the product demand for the current time and possible demand in the future based on transactions of the product and product reviews. The model investigates customer buying behavior and classifies the customers according to the amount (high, moderate, or less) spend at a certain sale-point (i.e., store). The model, furthermore, identifies the products which have been sold at a high rate. Thus, it helps in setting discounts. The model predicts the demand for a specific product based on data about transactions made in buying products and customer feedback about such products. The business workers may take better decisions in the light of available predictions for better business strategies and business productivity.
The study has considered three different scenarios where the proposed intelligent business model may serve as a tool to increase the productivity of the business by making better decisions and framing better business strategies. The three different scenarios are reported in the following.
Raquel runs a clothing store. To sell the products from the last collection (i.e., previous season), she puts the products on sale. Out of a total of 800 products, only 350 products get sold leaving. The possible reason may be the wrong classification of products. The discount onset at the store is listed below:
– 25% at the aisle holding most of the products that the customers with low expenditure buy the most.
– 50% at the aisle holding most of the products that the customers with high expenditure buy the most.
– 75% at the aisle holding most of the products that the customers with moderate expenditure buy the most
The proposed model can help Raquel in setting the product prices based on their amount spent on a certain product by the customer categories. Fig. 1 depicts this scenario.
Michael runs a grocery store. In the months of extremely hot weather conditions, the mosquito repellents’ sale remained less than half of other months, resulting in no profit for the product item. It is because the demand for mosquito repellents is usually less during the extreme weather conditions in the town.
The proposed intelligent business model can also boost the business sale in this situation by analyzing the customers’ transactions reflecting buying timestamps to get insights into the products’ demand for the entire year. This data may help the business owners from buying the products in bulk at times when such products may not have much demand.

Figure 1: Scenario A representation
Jenifer and John run a beauty store and sale face oils, toners, and hair oils. Customers initially purchased every product with a similar transaction rate. However, the rate of sale for the products could not remain similar after certain. It has been observed that customers’ buying rate decreased for the toners with time.
This situation can cope with the use of the proposed intelligent model, which analyses data to predict the demand for certain products. Especially, the rate of sale of a certain product may help in making better decisions about to product in keeping in the category of high demand products or lower demand items.
The rest of this paper is structured as follows. Section 2 presents related work. Section 3 focuses on the architecture of the proposed intelligent model and Section 4 explores the implementation and performance evaluation of the proposed model. Section 5 presents the scope and limitations. Section 8 provides conclusions.
The scientific literature reports several systems and methods that use business intelligence to improve organizational performance. The use of business intelligence systems, which consider customer and competitor behavior increased business transactions [11]. The business intelligent systems predict product prices to cope with local competitors. For instance, a four-vector auto-regression technique for predicting the starting price as well as a current price of a particular product at every outlet available in the city is reported in Ahmad et al. [12]. Kisilevich et al. [13] proposed a GIS (Geographic Information System) based decision support system to book attractive travel packages for their customers to beat the competitors. The decision support system calculates rates based on temporal rates (to predict the future charges keeping in view the past charges) and reasonable hotel rates (i.e., considering the hotel location characteristics). A machine learning model is proposed in Zhao [14] to predict the futures price of agricultural products using factors affecting agricultural products’ futures prices. The study used PCA (Principal Component Analysis) for dimension reduction, ICA (Independent Component Analysis) for data processing, SVM (Support Vector Machine) classification, and SVM regression to provide a better trading tool to traders and investors [14]. Besides, price prediction can also help optimizing selling prices. The study in Xuefeng et al. [15], for example, discussed an attribute construction method using traditional statistics along with machine learning techniques to predict the final prices of auction items to optimize selling price.
The in-depth information of competitor statistics, customer preferences, and customer feedback are considered essential attributes that help to frame better business strategies. Customer feedback has always been significant. The customer reviews about products are recommended as an important element in business strategies in Archak et al. [16]. Archak et al. [16] introduced a hybrid technique combining text mining and hedonic regression for customer review analysis. The iPhone reviews from Twitter have been used in predicting iPhone sales in Lassen et al. [17]. Tseng et al. [18] analyzed the effects of news and comments on the sale prices of electronic products by an SSA-ARMA (signal, sentiment, autoregressive, and moving average) model, which predicts future prices of products based on news articles.
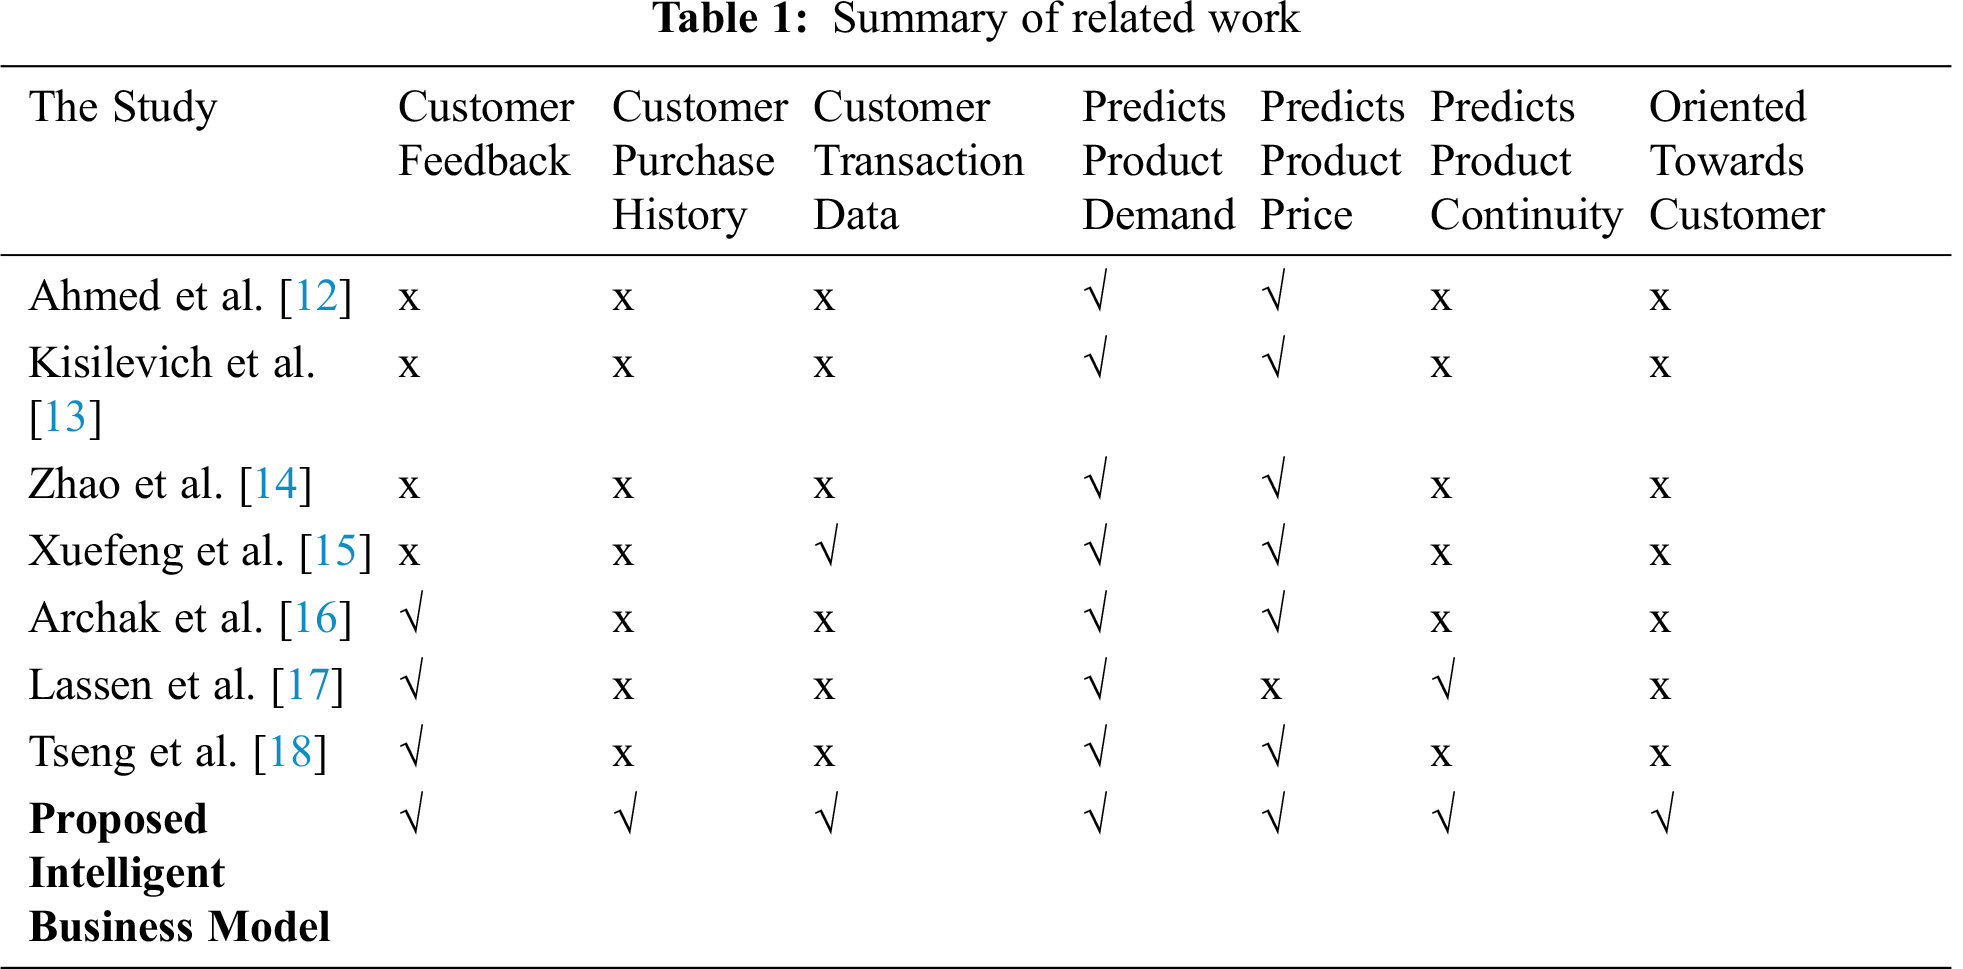
Tab. 1 reports related studies which predicted product demands. Xuefeng et al. [15] considered customer transactional data as part of the prediction. The studies [16–18] relied on customer feedback in predicting product demand and price. The comparison of the proposed model with existing related studies, which focus on price prediction based on one of the factors including statistics of local competitors, product demand, and sale based on customer reviews. The existing systems are inclined towards sellers aiming at winning market share utilizing competitors’ statistics, customer reviews. None of them considered customer purchase history as an attribute to gain in-depth knowledge about customer purchase patterns. Thus, these systems lack an attribute of customer affordability about a certain product while predicting prices.
The major contribution of this study is the consideration of customer affordability during the prediction of prices and demand. As reported in Tab. 1, existing systems do not consider customer purchase history and customer buying behavior for the prediction. The proposed model not only predicts product demand and its sustainability in the business but also help in providing discounts for certain products with the help of customers’ purchase history (i.e., to know customers’ affordability) and product category (i.e., customer buys the most products from which category). This feature lacks in the existing systems, thus, it makes the proposed model comparatively robust.
3 Proposed Intelligent Business Model Architecture
The proposed Intelligent Business Model uses a ubiquitous way of computing in which data related to the customers’ purchases, transactions, and feedback is collected from the physical and online stores. The collected data is stored at computers accessible online for pre-processing as well as for further computation to extract the desired predictions. Fig. 2 illustrates the proposed model consisting of three major modules: (1) Data Acquisition Module, (2) Web-Server Module and (3) End User Module.
The goal of this module is to acquire data such as customer purchase history, feedback, customer transactions with timestamps. The data is being collected from multiple sources to provide machine learning algorithms enough data for predictions.

Figure 2: Proposed intelligent business model architecture
Customer transaction data helps to set the product prices based on customers’ purchase history. Whilst, customers’ feedback data helps to predict product demand and its sustainability in the market. The transaction data has been collected from online stores as well as from physical POS (Point of Sale), whereas, feedback data is collected from online survey forms. The collected data is sent to the Web-Server for further processing.
This module receives data from Data Acquisition Module and processes it for further computation. This module has two sub-modules to carry on its responsibilities: Data Storage, Pre-processing, and Machine Learning. The Data storage and Pre-processing deal with storing and cleaning the collected data before forwarding it to the machine learning step. The Machine learning step executes machine learning algorithms.
3.2.1 Data Storage and Pre-Processing
This received data from the data acquisition module is stored in a database. The collected data needs initial processing in transforming into a suitable format for further computation. The preprocessing removes noisy and irrelevant information. The data is transformed in accordance with machine learning techniques, which could be applied for predictions. The customer data is classified according to their amount spent on buying products such as high, moderate, and low for certain franchises/stores. Additionally, the products are also classified based on discounts offered, for instance, high discounts, moderate discounts, and low discounts.
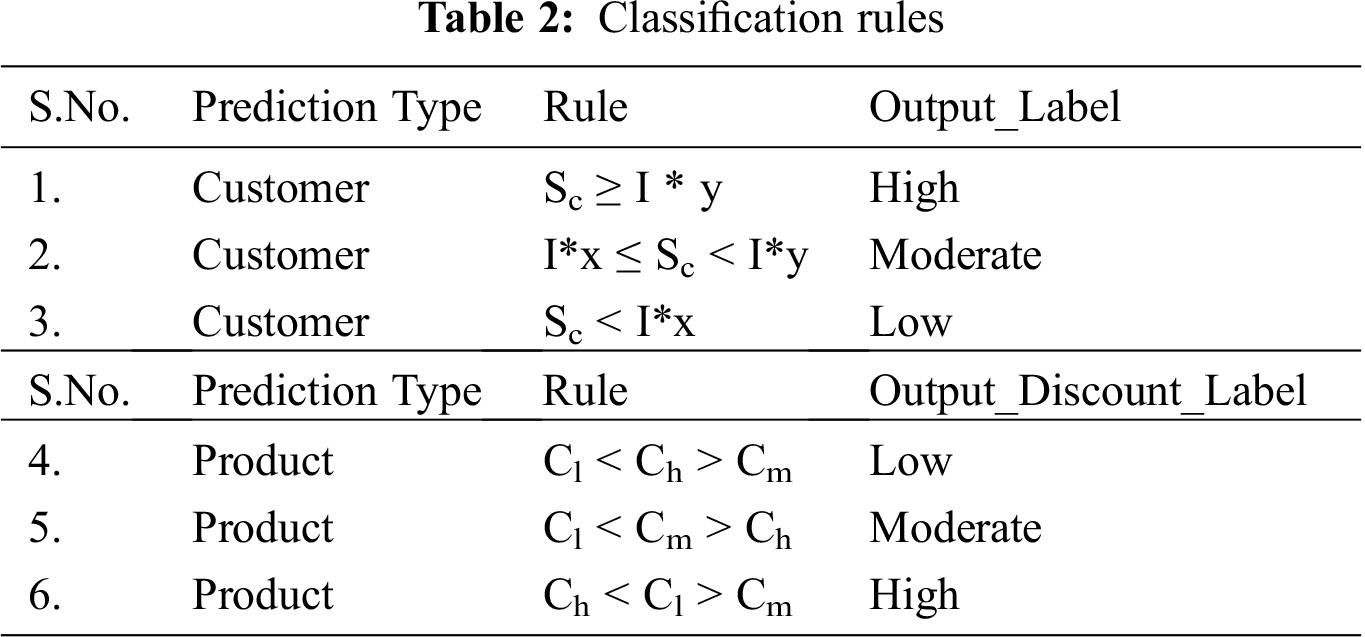
Tab. 2 reports the criteria (classification rules) for the High, Moderate, and Low labels for the customers and the products. The terms Ch, Cl, and Cm denote customers at a specific franchise/store. Ch represents customers, who spent a high amount in purchasing products. Similarly, Cm denotes customers spending a moderate amount and customers, who purchased with lesser amount are presented with Cl. The total amount spent by the customer is denoted with Sc; whilst ‘I’ describes total revenue (i.e., profit and capital cost) during a season at franchise/store. The x & y represent the minimum and maximum return (i.e., profit) to the business.
This data is further used to find out the product selling trends during the whole year to predict its demand in particular seasons, months, or events, and the products with negligible sell to discontinue them completely or partially (i.e., for a particular season).
The machine learning methods are applied at this stage in order to gain predictions. A number of classification methods are applied during the experimental phase for better prediction of the proposed model. Especially, three multiclass machine learning methods [19] have been applied: (1) Multiclass Decision Forest, (2) Multiclass Logistic Regression, and (3) One-vs-All Multiclass. The details about these methods are described in the subsequent sections.
3.2.2.1 Multiclass Decision Forest
Multiclass Decision Forest consists of a large number of decision trees that predict the class for a given data. The algorithm takes predictions from all the trees and decides on the model’s prediction based on the voting results [20]. The model takes a set of uncorrelated trees to work as parallels. These uncorrelated models may outperform the individual constituent model (i.e., tree). The independence (i.e., non-correlation) helps tress protect other models working in parallel from individual erroneous effects. In case, some of the trees may predict wrong (incorrect), the other trees help in predicting correct and lead towards the right direction [20]. The node importance for the multiclass decision forest mothed has been computed suing GINI index as given in Eq. (1):
where, nij = the importance of node j, Wj = weighted number of samples reaching node j, Cj = the impurity value of node j, left(j) = child node from left split on node j and right(j) = child node from right split on node j.
The importance of each feature is calculated as in Eq. (2):
where fij = the importance of feature I and nij = the importance of node j
The final prediction is then decided using the Eq. (3):
where, RFfij = the importance of feature i calculated from all trees in the Random Forest model, normfiij = the normalized feature importance for i in tree j, and T = total number of trees.
3.2.2.2 Multiclass Logistic Regression
A logistic regression model predicts binary dependent variable (i.e., Yes/No, win/loss, healthy/sick) using logistic sigmoid function. The extended model can predict from a given set of values. This extension suits in modelling a dependent variable where there are more than two categories (i.e., low/ moderate/ high) and is known as multiclass logistic regression [21]. The multiclass logistic regression calculates the probabilities using Eq. (4):
where, ak = [wk]Tϕ + bk, k = 1, 2, 3, …., K and Wk = k weighted vectors & b = biases.
This model is N-binary classification model for the N-class instances in a given dataset such that the number of class labels must be equal to the number of binary classifiers generated by the model [22]. The dataset used in this study has three classes named Type1–Low, Type2 –Moderate, and Type3–High. The number of classifiers needs to be three for the One-vs-All model for the three label classes, thus, three binary classifiers are used in this study are given below:
Each classifier in the One-vs-All classification model responds either +1 or an adverse response −1. The final outcome (i.e., class label) is computed based on the maximum probability score for the given dataset.
The performance evaluation of classification models has been computed using cross-validation and split percentage methods to reckon the better method from the considered ones. The details of the performance evaluation are reported in Section 5.
The business user interacts with the proposed intelligent business model through end-user module to make business decisions. This module hides all the processing and computational activities behind a user interface. The business user receives outcomes (i.e., prediction), which may be visualized in several formats (i.e., reports, graphs, charts) for a proper understanding of results.

Figure 3: Uploading dataset (b) Predicted discounts for product items
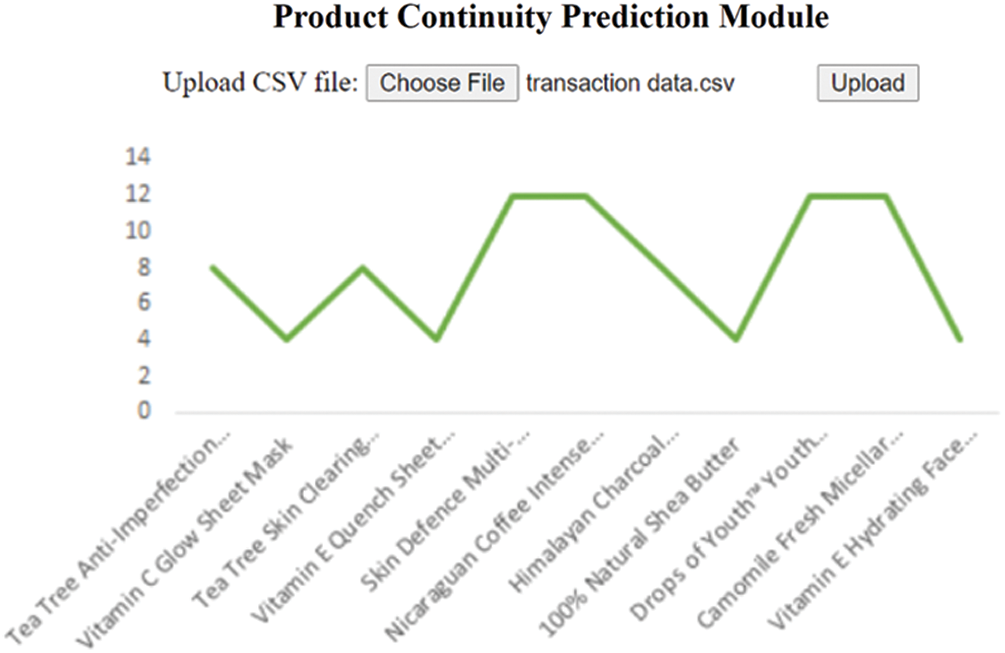
Figure 4: Product continuity prediction
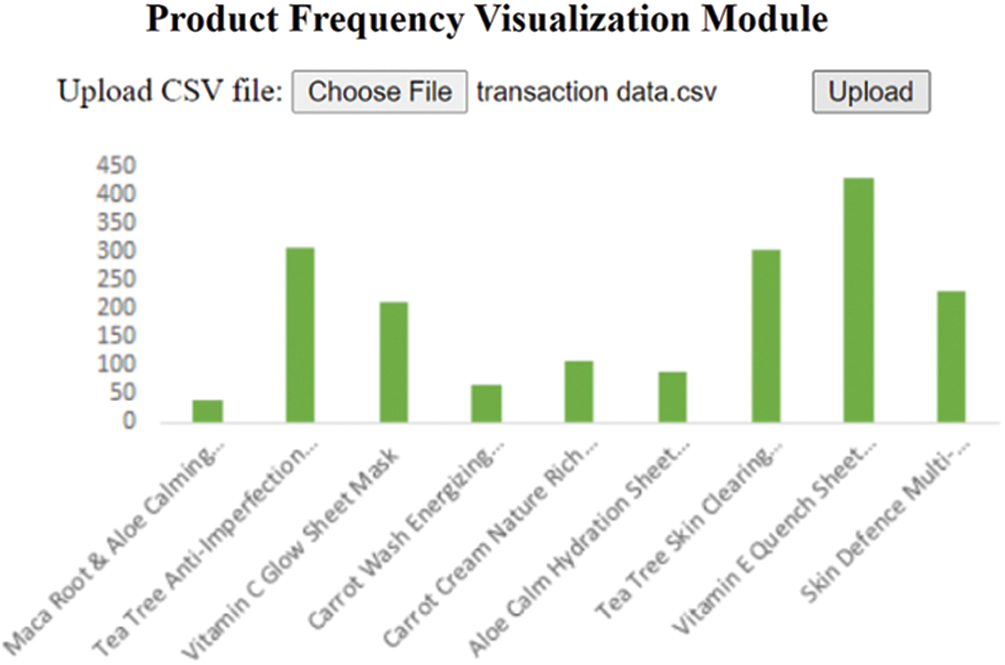
Figure 5: Product frequency visualization
4 Implementation and Performance Evaluation
The study has been carried out using Desktop Computer. The beauty store dataset comprising 12 attributes and 1350 records of 500 online reviews has been used. Besides, Python web service using PyCharm IDE [23] to deal with data processing and machine learning tasks has been programmed. The data storage and pre-processing tasks have been managed using SQL Server Management Studio 2018 [24]. The machine learning methods have been utilized for experimental purposes using Microsoft Azure Machine Learning Studio [25]. The End User Module has been developed to provide the user interface to the business users and a platform to visualize the outcomes.
The proposed intelligent business model has been applied for the three different scenarios discussed in Section 1. The model enquired data for all three scenarios to predict discount amounts, product frequency and product continuity using Graphical Unser Interface as shown in Fig. 3(a). The results of scenario A (reported in Section 1.1) are presented in Fig. 3(b) suggesting/predicting discounts to be offered for each product given in the dataset.
The results for the Scenario B and Scenario C (reported in Sections 1.2 and 1.3) are presented in Figs. 4 and 5 respectively. It should be noted that the proposed model predicts and suggests business strategies in terms of discount offered, product continuity and product frequency for the upcoming seasons. The use of the model may help business owners to take better decisions for increased productivity.
The performance of each machine learning method has been evaluated using cross-validation and Hold-out (i.e., split percentage) methods. The prediction results are validated using precision, recall and average log loss values.
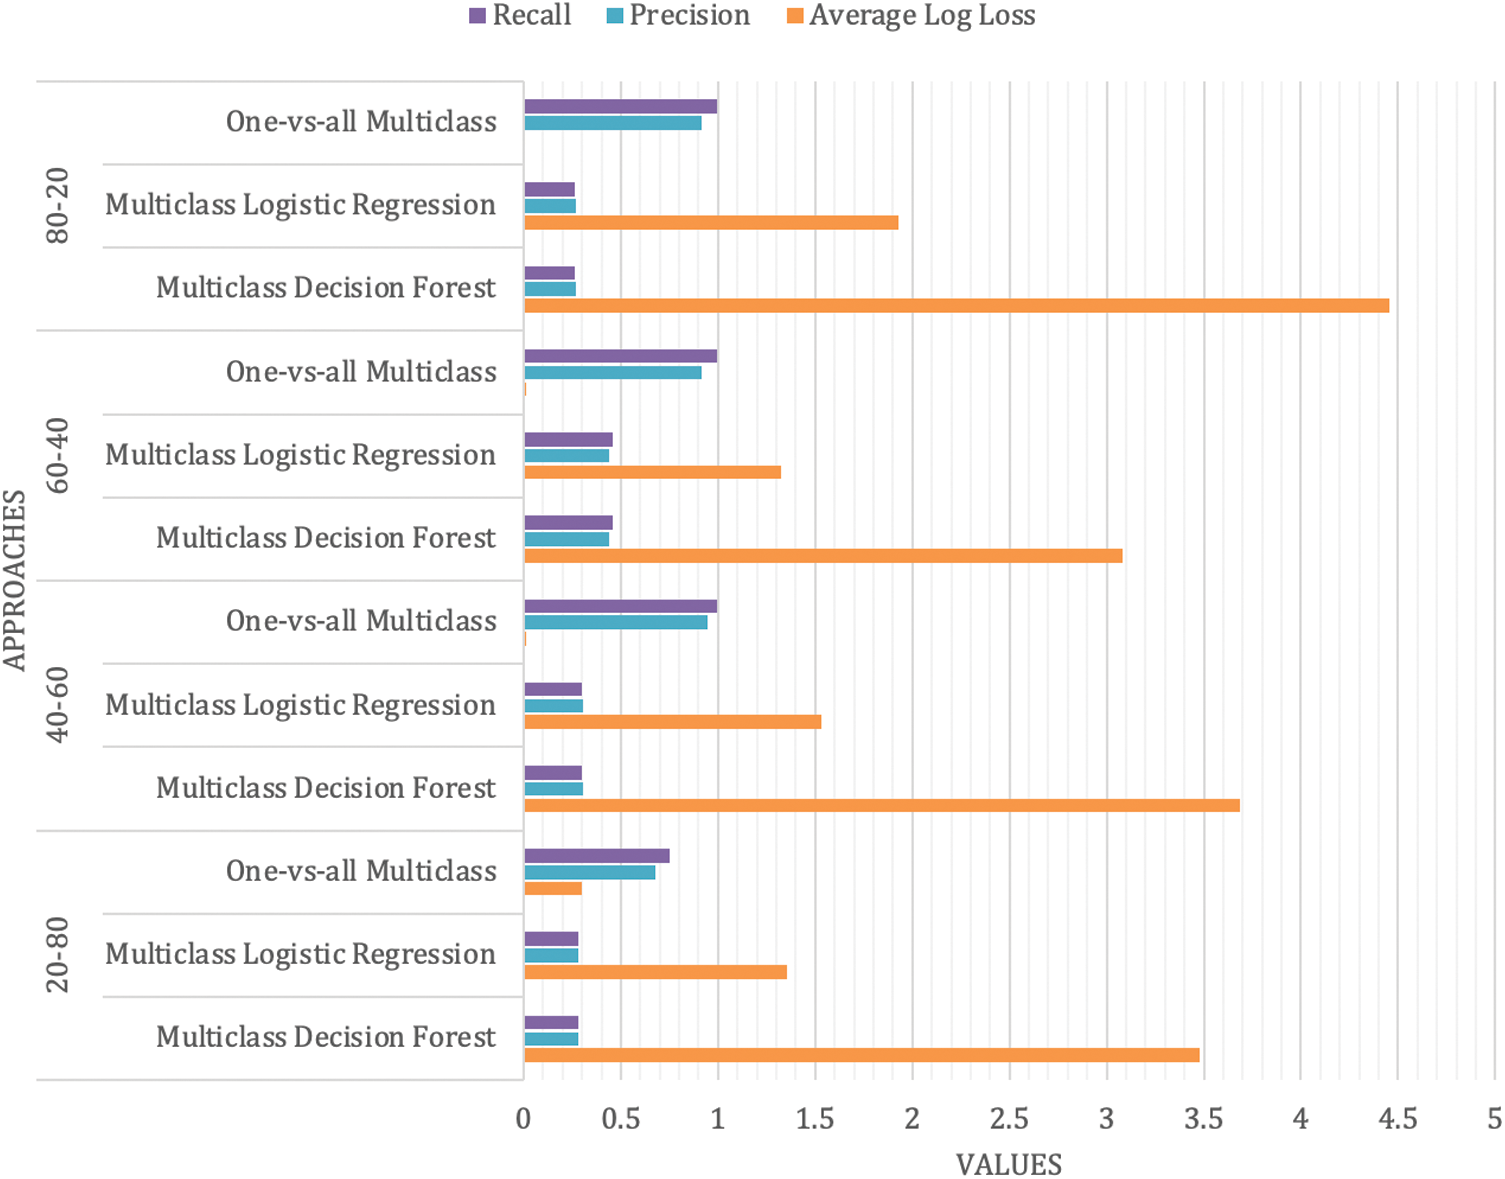
Figure 6: Performance evaluation results using hold-out method
This method divides given data into two parts: one for training the model (training set) and the other to apply the trained model (test set). The purpose of this method is to evaluate the performance of the model on the test data [26].
A repeated hold-out evaluation has been performed where the proposed model has been evaluated using different data partitions as reported in the following.
• 20-80: 20% data for training, 80% data for testing
• 40-60: 40% data for training, 60% data for testing
• 60-40: 60% data for training, 40% data for testing
• 80-20: 80% data for training, 20% data for testing
The results of these experiments are shown in Fig. 6. The one-vs-all classification method resulted better in comparison with the other two methods (i.e., Multiclass Decision Forest and Multiclass Logistic Regression) for different partitions. It is observed that the higher the training dataset, the better the prediction is achieved as shown in Fig. 3 for 80–20 cases.
The cross validation evaluates the machine learning models on limited data using a resampling procedure. The procedure requires a certain value of “k”, specifying the number of groups in which the available data should be divided for evaluation, thus, it is called k-fold cross validation [27]. This study adopted 10-fold cross validation for the performance evaluation of the machine learning methods. The evaluation results are presented in Fig. 7. It is evident from Fig. 7 that the one-vs-all multiclass method provides better performance on the given data, with a good average and low standard deviation compared to the other two models. Therefore, the stability of the proposed model and consistency of results with the one-vs-all method is found significantly well with both evaluation methods.
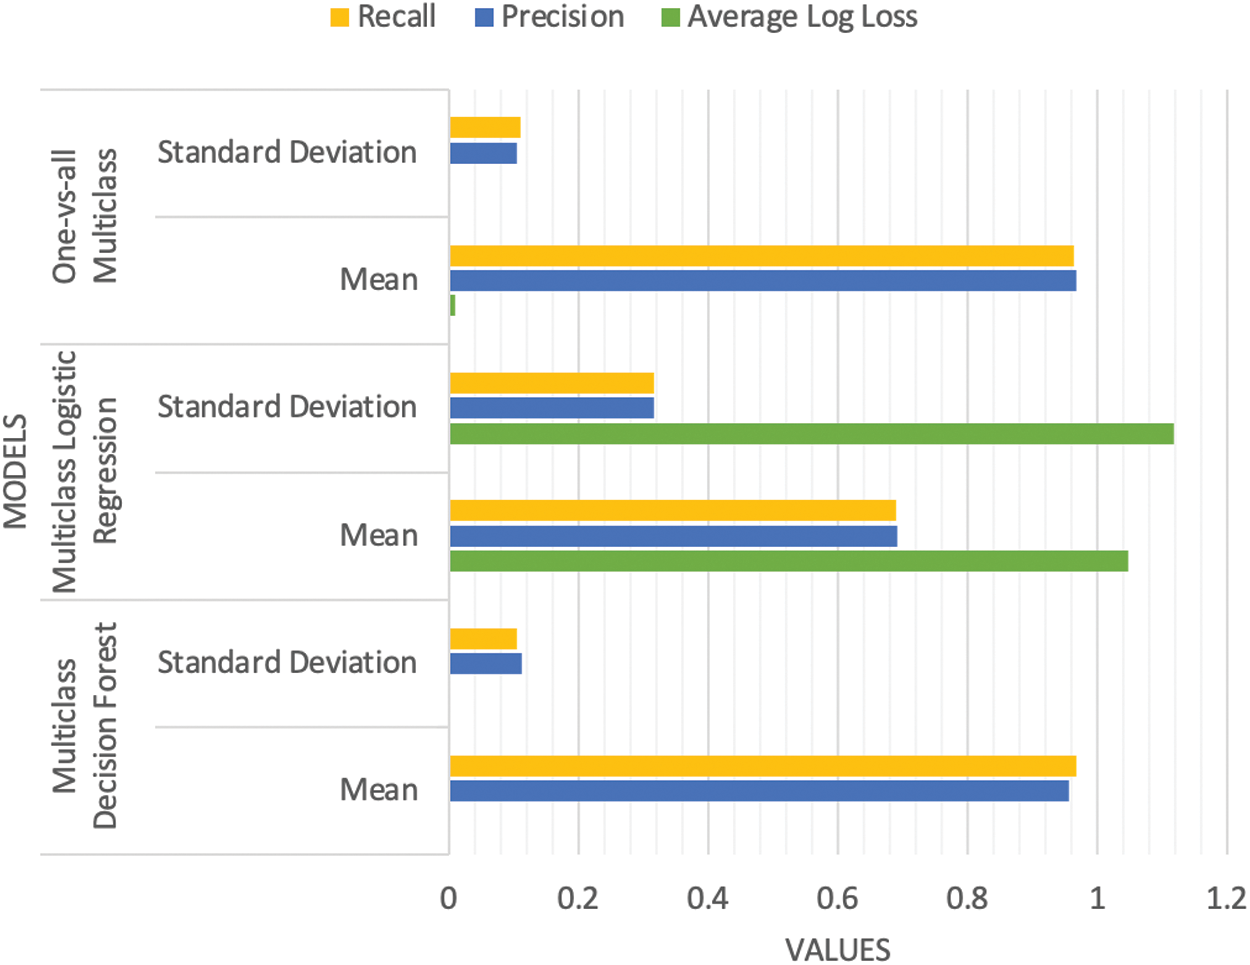
Figure 7: Performance evaluation results using cross validation method
The proposed model has been programmed into web-service with a one-vs-all multiclass and cross validation method for business data exploration. The possible reasons behind taking cross validation as performance evaluation indicator for the web-service are given as follows:
• Cross validation does not require multiple iterations unlike the hold-out approach
• It reduces the variance of estimates
• It can work on a limited dataset
• It trains and validates the model in a single turn
• It evaluates the model as well as data
The proposed intelligent business model requires a great volume of data to make better predictions. The outcomes may not produce better outcomes in the initial duration, due to the fact that data volumes are smaller. The model has been developed for small and medium size of business setups. The rules adopted for the proposed model may also need to alter when dealing with global and enterprise businesses.
An intelligent business model has been proposed for the prediction of product prices. The model considers data characteristics including customer purchase history, feedback, and transactions of the business over a certain duration of time. It predicts demand and suggests sale discounts for certain products to gain better market share and boost business productivity. The machine learning algorithms have been applied and the one-vs-all multiclass method outperformed the other two methods namely multiclass decision forest and multiclass logistic regression. The performance evaluation of the model has been carried out using hold-out and cross-validation. The model is built in a working prototype by developing a web-service, which provides an interface for the users to interact and provide predictions about products for better decision-making strategies.
Funding Statement: The authors would like to acknowledge the support of the Deputy for Research and Innovation, Ministry of Education, Kingdom of Saudi Arabia for this research through a grant (NU/IFC/INT/01/008) under the institutional Funding Committee at Najran University, Kingdom of Saudi Arabia.
Conflicts of Interest: The authors declare that they have no conflicts of interest to report regarding the present study.
1. H. Chen, R. H. Chiang and V. C. Storey, “Business intelligence and analytics: From big data to big impact,” MIS Quarterly, vol. 36, no. 4, pp. 1165–1188, 2012. [Google Scholar]
2. R. Jaffari, M. Memon, T. Hafiz and R. Iftikhar, “Framework of business intelligence systems for infrastructure design and management,” in Int. Conf. on Latest Trends in Electrical Engineering and Computing Technologies (INTELLECTKarachi, Pakistan: IEEE, pp. 1–8, 2017. [Google Scholar]
3. D. Arnott, F. Lizama and Y. Song, “Patterns of business intelligence systems use in organizations,” Decision Support Systems, vol. 97, pp. 58–68, 2017. [Google Scholar]
4. Z. Jourdan, R. K. Rainer and T. E. Marshall, “Business intelligence: An analysis of the literature,” Information Systems Management, vol. 25, no. 2, pp. 121–131, 2008. [Google Scholar]
5. P. Wlodarczak, M. Ally and J. Soar, “Data mining in IOT: Data analysis for a new paradigm on the internet,” in Proc. of the Int. Conf. on Web Intelligence, Leipzig, Germany, ACM, pp. 1100–1103, 2017. [Google Scholar]
6. D. D. Phan and D. R. Vogel, “A model of customer relationship management and business intelligence systems for catalogue and online retailers,” Information & Management, vol. 47, no. 2, pp. 69–77, 2010. [Google Scholar]
7. F. Wang and M. Head, “How can the web help build customer relationships? An empirical study on e-tailing,” Information & Management, vol. 44, no. 2, pp. 115–129, 2007. [Google Scholar]
8. R. Amit and C. Zott, “Value creation in e-business,” Strategic Management Journal, vol. 22, no. 6–7, pp. 493–520, 2001. [Google Scholar]
9. G. Linden, B. Smith and J. York, “Amazon.com recommendations: Item-to-item collaborative filtering,” IEEE Internet Computing, vol. 7, no. 1, pp. 76–80, 2003. [Google Scholar]
10. E. Brynjolfsson, Y. J. Hu and M. D. Smith, “From niches to riches: Anatomy of the long tail,” Sloan Management Review, vol. 47, no. 4, pp. 67–71, 2006. [Google Scholar]
11. D. S. Soper, “A framework for automated web business intelligence systems,” in Annual Hawaii Int. Conf. on System Sciences (HICSSBig Island, HI, USA: IEEE, pp. 217a, 2005. [Google Scholar]
12. H. W. Ahmad, S. Zilles, H. J. Hamilton and R. Dosselmann, “Prediction of retail prices of products using local competitors,” International Journal of Business Intelligence and Data Mining, vol. 11, no. 1, pp. 19–30, 2016. [Google Scholar]
13. S. Kisilevich, D. Keim and L. Rokach, “A GIS-based decision support system for hotel room rate estimation and temporal price prediction: The hotel brokers’ context,” Decision Support Systems, vol. 54, no. 2, pp. 1119–1133, 2013. [Google Scholar]
14. H. Zhao, “Futures price prediction of agricultural products based on machine learning,” Neural Computing and Applications, vol. 33, no. 3, pp. 837–850, 2021. [Google Scholar]
15. L. Xuefeng, L. Lu, W. Lihua and Z. Zhao, “Predicting the final prices of online auction items,” Expert Systems with Applications, vol. 31, no. 3, pp. 542–550, 2006. [Google Scholar]
16. N. Archak, A. Ghose and P. G. Ipeirotis, “Show me the money! Deriving the pricing power of product features by mining consumer reviews,” in Proc. of the 13th ACM SIGKDD Int. Conf. on Knowledge Discovery and Data Mining, San Jose, California, USA: ACM, pp. 56–65, 2007. [Google Scholar]
17. N. B. Lassen, R. Madsen and R. Vatrapu, “Predicting iPhone sales from iPhone tweets,” in 18th Int. Enterprise Distributed Object Computing Conf., Ulm, Germany: IEEE, pp. 81–90, 2014. [Google Scholar]
18. K. K. Tseng, R. F. Y. Lin, H. Zhou, K. J. Kurniajaya and Q. Li, “Price prediction of e-commerce products through Internet sentiment analysis,” Electronic Commerce Research, vol. 18, no. 1, pp. 65–88, 2018. [Google Scholar]
19. S. Rajagopal, K. S. Hareesha and P. P. Kundapur, “Performance analysis of binary and multiclass models using azure machine learning,” International Journal of Electrical & Computer Engineering, vol. 10, no. 1, pp. 2088–8708, 2020. [Google Scholar]
20. F. Abramovich, V. Grinshtein and T. Levy, “Multiclass classification by sparse multinomial logistic regression,” arXiv preprint arXiv, vol. 1, e print 2003.01951, 2020. [Google Scholar]
21. B. Siswoyo, “MultiClass decision forest machine learning artificial intelligence,” Journal of Applied Informatics and Computing (JAIC), vol. 4, no. 1, pp. 1–7, 2020. [Google Scholar]
22. J. Yan, Z. Zhang, K. Lin, F. Yang and X. Luo, “A hybrid scheme-based one-vs-all decision trees for multi-class classification tasks,” Knowledge-Based Systems, vol. 198, no. 4, pp. 105922, 2020. [Google Scholar]
23. I. D. E PyCharm Python, “For Professional Developers,” (Accessed on 12-04-20212000. [Online]. Available: https://www.jetbrains.com/pycharm/. [Google Scholar]
24. Microsoft, “SQL Server Management Studio 2018,” (Accessed on 12-04-20212019. [Online]. Available: https://docs.microsoft.com/en-us/sql/ssms/download-sql-server-management-studio-ssms. [Google Scholar]
25. Microsoft Azure, “Microsoft Azure Machine Learning Studio,” (Accessed on 12-04-20212021. [Online]. Available: https://azure.microsoft.com/en-us/services/machine-learning/. [Google Scholar]
26. C. Sammut and G. I. Webb, “Encyclopedia of machine learning,” Springer Science & Business Media, Springer, New York, 2011, 978-0-387-30768-8. [Google Scholar]
27. D. Berrar, “Cross-validation,” Encyclopedia of Bioinformatics and Computational Biology, vol. 1, pp. 542–545, 2019. [Google Scholar]
 | This work is licensed under a Creative Commons Attribution 4.0 International License, which permits unrestricted use, distribution, and reproduction in any medium, provided the original work is properly cited. |