DOI:10.32604/iasc.2021.019513
| Intelligent Automation & Soft Computing DOI:10.32604/iasc.2021.019513 | |
| Article |
CT Segmentation of Liver and Tumors Fused Multi-Scale Features
1School of Computer Science and Communications Engineering, Jiangsu University, Zhenjiang, 212013, China
2Department of Computer Science, University of Central Arkansas, Conway, 72032, USA
3Department of Anesthesiology, the First Affiliated Hospital of Anhui Medical University, Hefei, 230001, China
4College of Tourism and Geographic Science, Jilin Normal University, Jilin, 136000, China
*Corresponding Author: Zhe Liu. Email: 1000004088@ujs.edu.cn
Received: 14 April 2021; Accepted: 15 May 2021
Abstract: Liver cancer is one of frequent causes of death from malignancy in the world. Owing to the outstanding advantages of computer-aided diagnosis and deep learning, fully automatic segmentation of computed tomography (CT) images turned into a research hotspot over the years. The liver has quite low contrast with the surrounding tissues, together with its lesion areas are thoroughly complex. To deal with these problems, we proposed effective methods for enhancing features and processed public datasets from Liver Tumor Segmentation Challenge (LITS) for the verification. In this experiment, data pre-processing based on the image enhancement and noise reduction. This study redesigned the original UNet with two novel modules and named it DResUNet which was applied deformable convolution. The first module aimed to recalibrate information by the channel and spatial dimension. The other module enriched deep information of these liver CT images through fusing multi-scale features. Besides, we used cross-entropy loss function for adaptive weights to solve the troubles of class imbalance in the dataset samples. These can improve the performance of the network in-depth and breadth feature learning to deal with many complex segmentation scenes in abdominal CT images. More importantly, the effect of predicted images fully proved that our methods are highly competitive among the segmentation of liver and liver tumors.
Keywords: Computed tomography (CT); liver tumors; deep learning; fully automatic segmentation; multi-scale features
The liver resembles a large chemical processing plant inside the human body, maintaining vital life activities. As the largest substantial tissue in the human abdomen, the liver has plenty of functions, such as metabolism, detoxification, and immune defense [1]. Nevertheless, the liver is extremely vulnerable to suffer trauma or physical injury, which leads to multiple liver diseases [2]. According to the latest statistics from the World Health Organization, liver cancer has a high mortality rate worldwide. Since liver tumors endanger people’s health to a large extent, it is of great clinical significance to accurately diagnose diseases both and assist doctors in formulating suitable treatment plans. As the rapid development of computer technology, imaging technology has become one of the indispensable methods of clinical medical diagnosis [3]. Computed tomography (CT) has been widely used to reveal internal injury or bleeding, due to its fast speed of scanning and less harmful to the human body [4]. It is necessary to know the location of the liver, the size and number of tumors when the doctors diagnose liver cancer or monitor treatment response [5]. Therefore, segmentation of liver and lesions accurately on CT scan abdominal images became especially required.
Manual segmentation has been applied initially, but this is time-consuming and inefficient. Doctors are required to have a professional level and rich experience. Semi-automatic segmentation which combines manual operation and computer-assisted processing has been utilized afterward. Some researchers analyzed the gray histogram of the tumor and used the maximum between-class variance to obtain the optimal threshold for extracting the liver [6]. Then, they used the method of contrast stretching to enhance the contrast of the region of interest and manually segmented the tumor region at last. Other scholars [7] proposed an adaptive method that used traditional region-growing algorithms which achieved great results in CT images segmentation only if there is a single liver tumor. Certain experts [8] designed a morphological gradient correction level set method. Different sizes of structural elements in gray-level neighborhoods to perform corresponding local gradient corrections. Representative algorithms about semi-automatic segmentation mainly include region growth, threshold, level set and graph cut, etc [9]. Semi-automatic segmentation required manual design and extraction of features. As a result, the ability to express features was limited.
In recent years, artificial intelligence has developed rapidly [10]. Image segmentation technologies based on various neural networks have also been applied to the field of medical image processing [11]. This way can be named fully automatic segmentation. Convolutional neural network (CNN) is a globally artificial neural network model that can learn abstract, essential, and deep features. LeNet is mainly applied to recognize and classify handwritten characters with very high accuracy [12]. Many excellent networks included AlexNet [13], VggNet [14], and ResNet [15] have been produced on the basis of LeNet. Fully Convolutional Network (FCN) was proposed by Long et al to make the scale extracted by CNN reach the size of the original image [16]. The fully connected layers of the convolutional neural network are replaced with convolutional layers. This method not only can input data of any size, but also realizes pixel-level image segmentation. Researchers have proposed many improved fully convolutional neural networks such as UNet [17], DeepLab [18], and PSPNet [19] which have achieved great results in the image segmentation.
The article is mainly to solve the problem of missing segmentation targets and reducing segmentation errors, especially for small targets. Firstly, we proposed a hybrid enhanced attention module at the channel and spatial level. In addition, designed a high-resolution and low-resolution feature fusion module. Simultaneously, we analyzed the complexity of segmentation targets and the imbalance of target categories about samples. We applied deformable convolution and used an adaptive weighted cross-entropy loss function. Therefore, we have created a novel liver and tumors segmentation network DResUNet that based on UNet, which applied residual learning and multi-scale feature fusion. After training and testing on Liver Tumor Segmentation Challenge (LITS) dataset, it is proved that the segmentation results and efficiency of the network have been steadily improved.
The purpose of the convolution kernel is to extract more features [20]. The traditional convolution kernel has poor adaptability to unknown changes. Different positions need correspond to objects with different scales or deformations, the model needs to automatically adjust the changes. Therefore, the method of deformable convolution was presented.
The deviation can be obtained through an ordinary convolution kernel firstly. Generated channel dimension is 2N, corresponding to the original output feature and the offset feature respectively. These two convolution kernels learn together through the bilinear interpolation backward propagation algorithm. After that, the size and position of the deformable convolution kernel can be dynamically adjusted according to the current image content that needs to be recognized [21].
Deeper networks are more difficult to be trained. For the purpose of addressing gradient explosion and gradient disappearance, residual blocks have been applied to the model. Shortcut connection and mapping are the main designs of residual block. Experiments proved that the residual block often requires more than two layers, and the residual block of a single layer could not work. The so-called residual network is actually a network composed of several residual blocks.
Hu represents the true density of an object, independent of the device, and values within different ranges can represent different organs. The contrast of the image depends on the window width and the brightness of the image depends on the window level. window width is the range of ct values contained in a ct image. The window level is the midpoint of the ct value. As the window level decreases, the image will be brighter and the opposite will be darker. When the window width and the window level are given, the upper and lower boundaries of the window can be calculated. The target range of its windowing is [level − width/2, level + width/2].
The presence of noise will seriously affect the accuracy of segmentation, so noise reduction was needed on CT images. Gaussian filtering is a linear smoothing filter. Its basic principle is to use gaussian function to perform weighted average operation on the entire image. The gray value of each pixel and the value of all other pixels in the neighborhood are weighted and averaged to obtain a new image. This new gray value will replace the gray value of the original pixel [22].
The histogram describes the distribution of gray levels in an image. Through the histogram operation to change the gray distribution in the original image to achieve the effect of enhancing the image. Histogram equalization is a common way of histogram operation. The central idea of histogram equalization was to redistribute relatively concentrated grayscale intervals in original histogram, so that pixels of images were distributed across entire grayscale range [23].
3.1 CT Data Pre-processing Based on Image Enhancement and Noise Reduction
The preprocessing process of this experiment can be shown in Fig. 1. It was necessary to read data at first and extracted the target slices after windowing operation. Then, we used gaussian filtering to reduce some noise of images. This research applied histogram equalization to enhance the presentation of features. Last but not least, normalization was an indispensable step.

Figure 1: Steps of Pre-processing
The network structure is shown in Fig. 2. The overall structure is a typical ResUnet structure. It was named as DResUNet due to the use of deformable convolution and feature extraction modules which we proposed. In detail, we passed images through firstblock for processing during the stage of down-sampling. Then, we used Max_Pooling for down-sampling. The processed data is transferred not only to the efficient channel and spatial attention residual module (EcsaResM), but also to the concat operation layer at the up-sampling stage. This module used deformable convolution and embed designed efficient channel and spatial attention into residual blocks.
After four rounds of iteration, the images entered the up-sampling stage. The same five sets of up-sampling operations which was named deconvblock restore the feature map size to the same size as the original image. Next, we designed the feature pyramid rearrangement module, the characteristics will be enhanced. In addition, after the processing of finalblock, we final got the segmentation results for liver and tumors prediction.
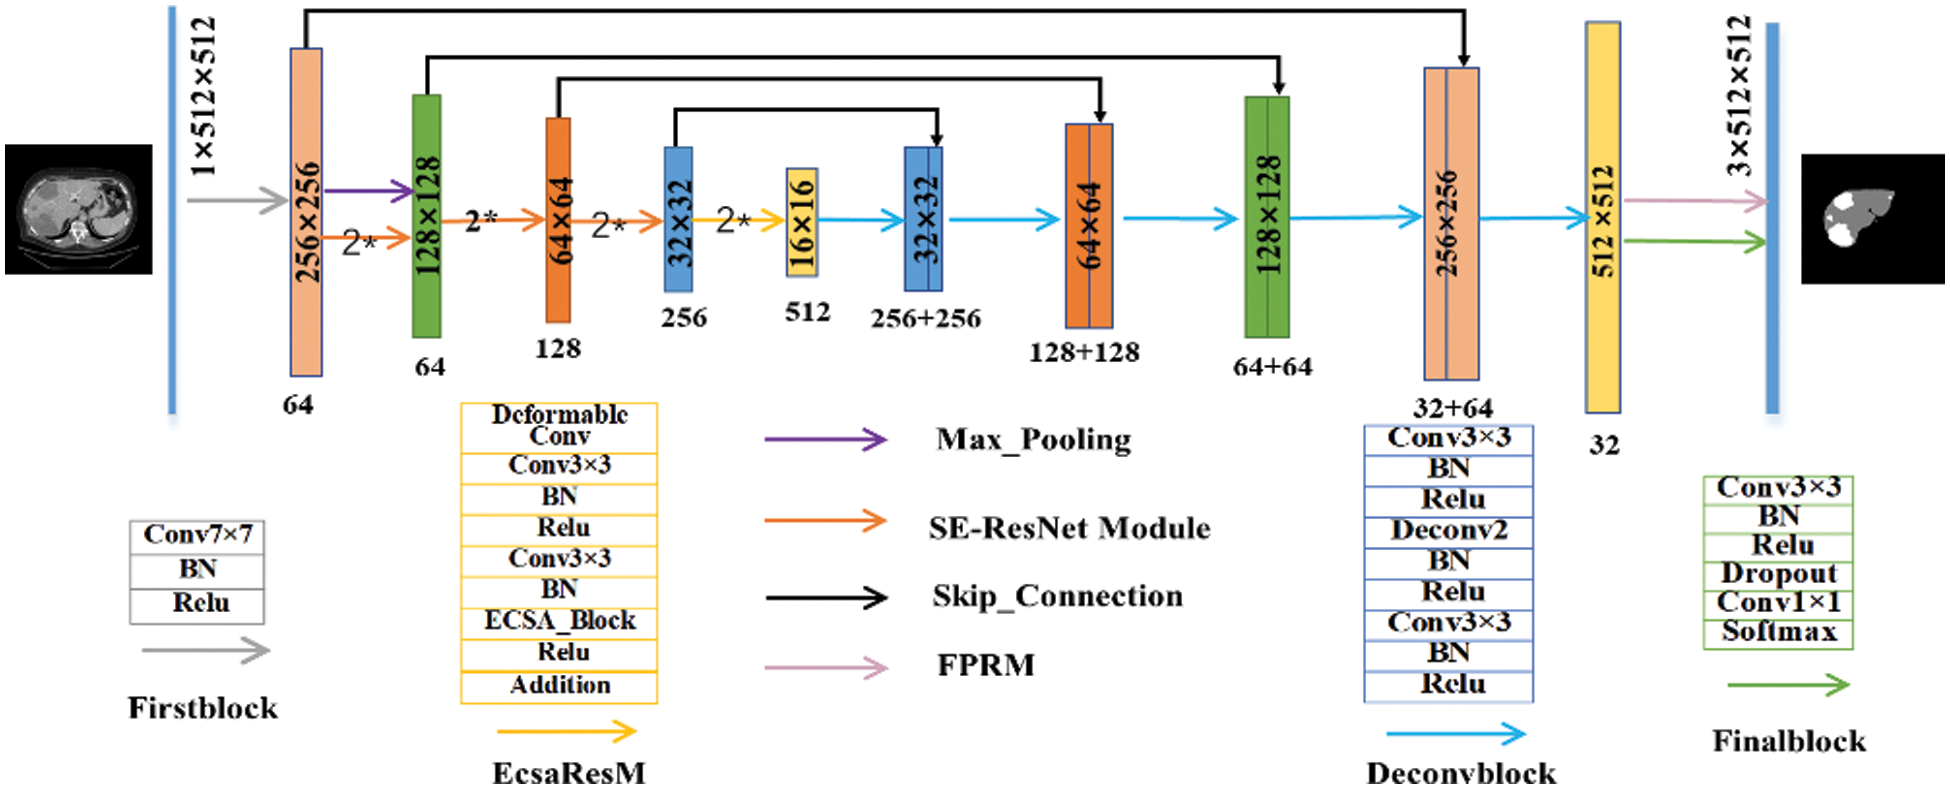
Figure 2: The structure of proposed DResUNet
3.2.1 Efficient Channel and Spatial Attention
Being the core of convolutional neural network, convolution kernel aggregates spatial information and channel-wise information on the local receptive field. In order to obtain more key features of the target area in the images, we designed a hybrid attention block of channel and space. The block performed feature recalibration of CT images after comprehensively considering the information which on the channel together with spatial dimension level. One-dimensional convolution was used to quickly realize local cross-channel interaction without dimensionality reduction, and learn effective attention more effective. Therefore, we named it the efficient channel and spatial attention (ECSA), and the specific implementation process is shown in Fig. 3.
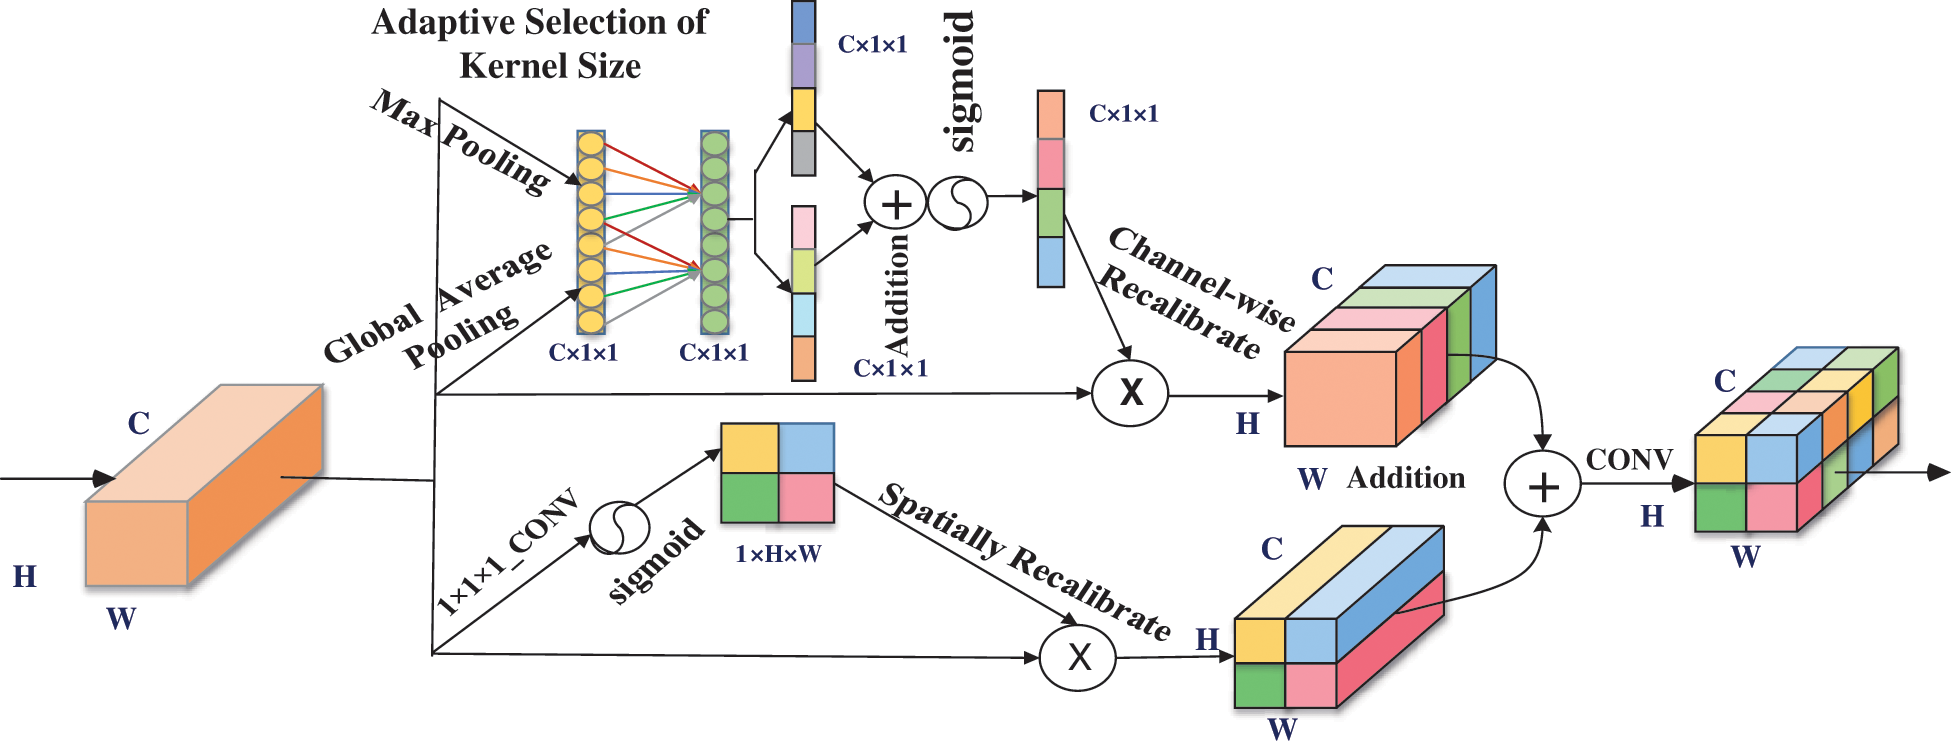
Figure 3: Mechanism of proposed efficient channel and spatial attention
It was mainly divided into efficient channel attention mechanism and spatial attention mechanism. Efficient channel attention as follows: first, we changed the feature map from C × H × W to C × 1 × 1 through the global average pooling and max pooling method, and we used K × 1 × 1 convolution to process information and obtain a C-dimensional vector. We used the sigmoid function to normalize and got the corresponding weights. Finally, through channel-wise multiplication, the feature map after information calibration is obtained. Spatial attention mechanism part: firstly, we directly used 1 × 1 × 1 convolution on the feature map to change C × H × W into features of 1 × H × W. Secondly, sigmoid function for activation to get the spatial attention map. Then we directly apply it to the original feature map to complete the spatial information calibration.
In Fig. 3, it can be showed that the ECSA is a parallel connection of the above two parts. Specifically, after the feature map passes through the two modules, the two parts are added together to obtain a more accurately calibrated feature map. It should be noted that without dimensionality reduction, K is adaptively determined through a function related to the channel dimension. After all, the interaction coverage rate is related to the channel dimension.
Here, we embed ECSA into residual blocks, applying deformable convolution before the residual blocks to form efficient channel and spatial attention residual module (EcsaResM). More details about the principle of EcsaResM can be obtained in Fig. 4.
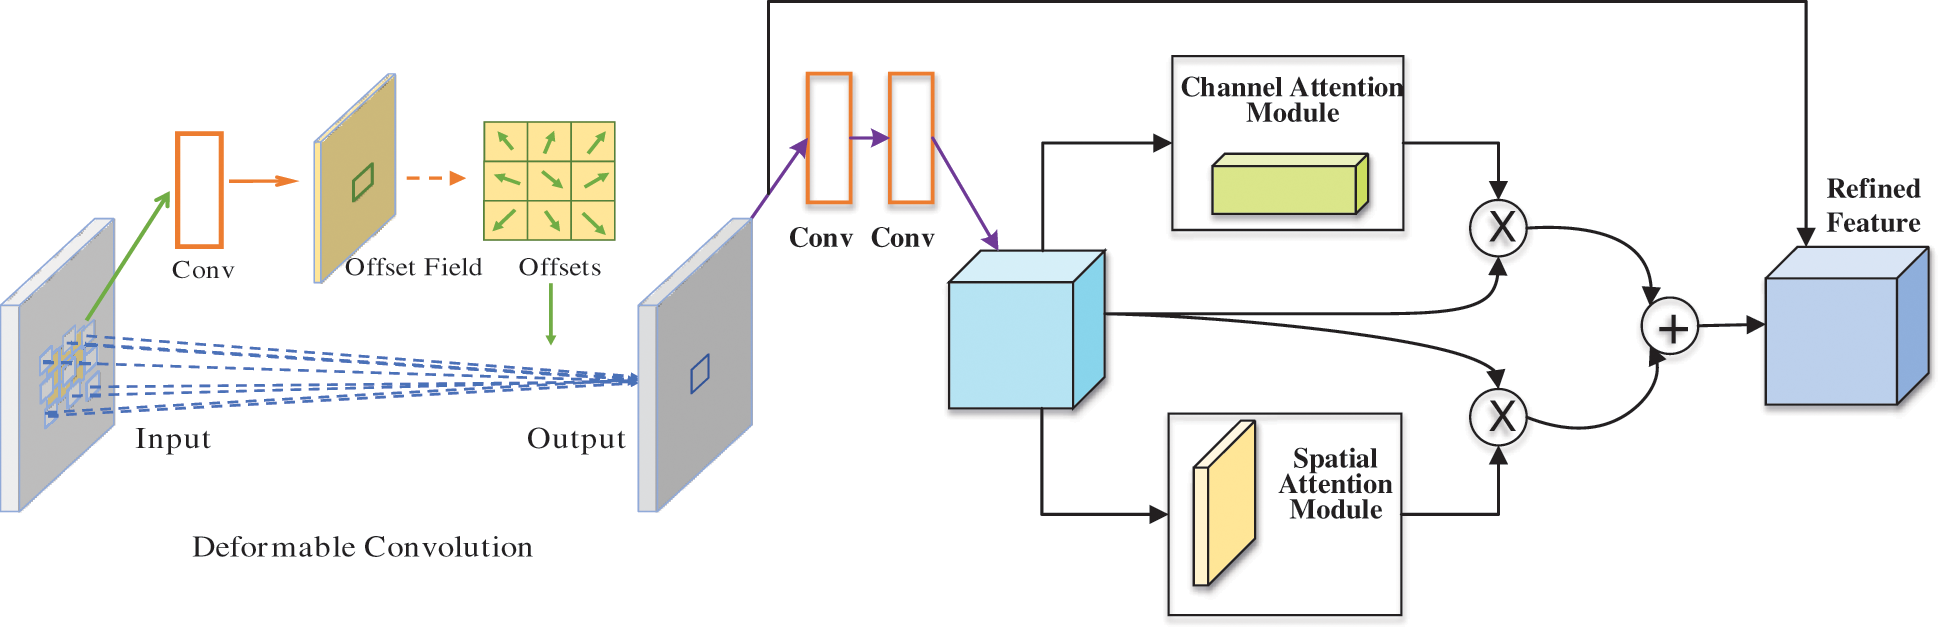
Figure 4: The principle of EcsaResM
3.2.2 Feature Pyramid Rearrangement
Almost every parameter of the CNN network will affect the generated feature map. This implies that a network with a fixed structure will often learn features of a specific scale, and the network may also have a certain scale invariance. Mixing the feature map directly into a vector will lose spatial information and cause ambiguity. At the same time, these parameters were often closely related to the current task and cannot be easily modified, which made it difficult for the model to learn multi-scale information. Global context information with subregion information was helpful for distinguishing multiple categories. Furthermore, feature representation more powerful can fuse information from different sub-regions with multiple receptive fields.
For the purpose of making up for the insufficient feature learning generated by the model when extracting the deep-level information of the image, we designed another network block to supplement the information of the previous EcsaResM. It was like saying that we proposed feature pyramid rearrangement module (FPRM) to integrate the context of different regions to obtain global context information. The input image passed through a feature extraction network to extract features. This part used ResUnet with deformable convolution. The function of deformable convolution was mainly to increase the receptive field to adapt to the geometric deformation of targets, and the extracted features are used as the input of the FPRM. In Fig. 5, a feature pyramid with a depth of 4 was constructed. Features of different depths are obtained through pooling operations of different scales based on input features, and the scale of pooling can be adjusted. Therefore, multiple levels of pooling kernels should be maintained a reasonable gap.
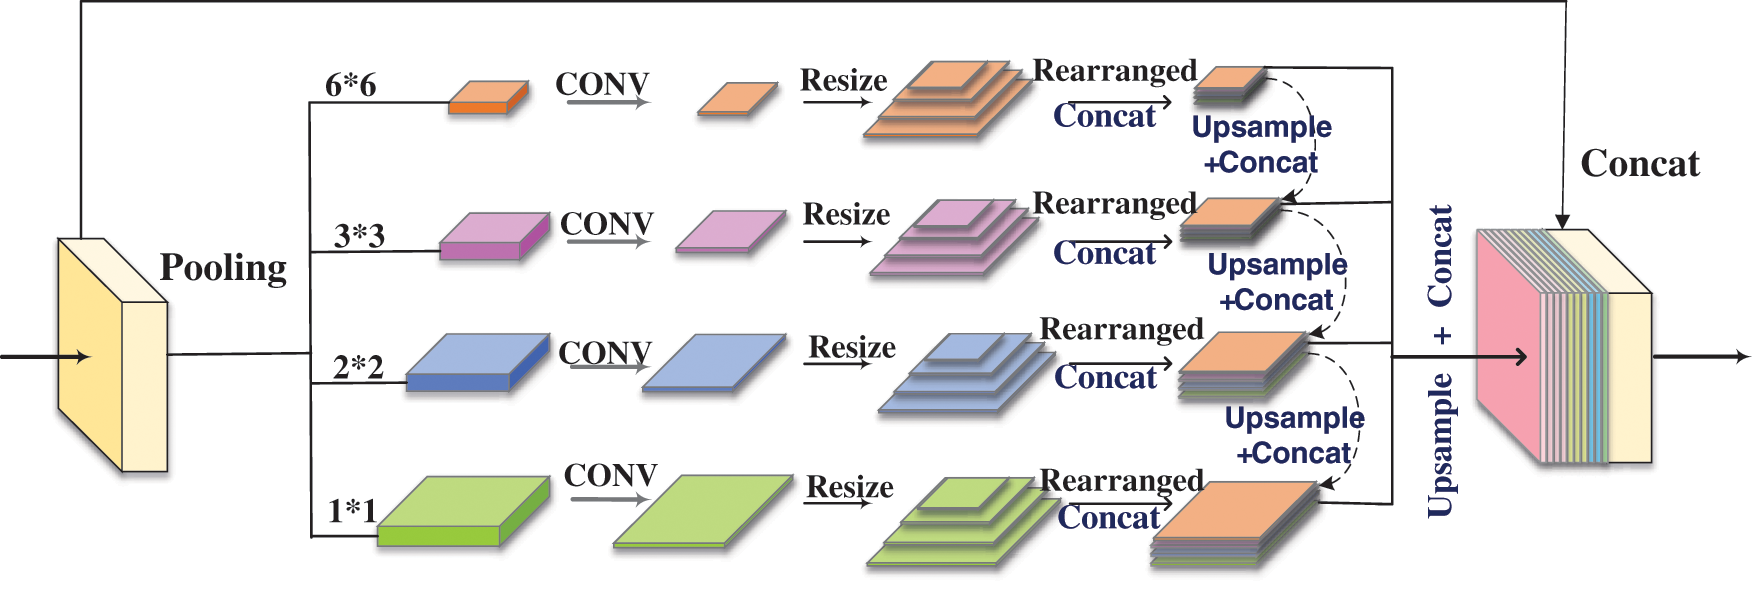
Figure 5: Process of feature pyramid rearrangement module
There are four levels of FPRM, and the pooling kernel size of each level is 1 × 1, 2 × 2, 3 × 3 and 6 × 6. Then, we used a 1 × 1 convolutional layer to reduce the feature dimension to a quarter of the original. Afterward, we resized feature maps about different scales to convert them into feature maps of four sizes. After rearranging the feature maps according to the size, we performed the operation of concat. The feature maps of different scales were sequentially upsampled and concatenated together with the feature maps of the higher level, and then the feature maps of each level were upsampled by bilinear interpolation to the size of the original feature map before being sent to the FPRM. Finally, we concatenated all the features on the pyramid levels as well as the original features together as the final output of this module.
3.3 Cross-entropy Loss Function for Adaptive Weights
We applied a weighted cross-entropy function as the loss function in experiments. In the case of unbalanced categories in the samples, different weights can be assigned to different categories. In this experiment, we needed to use the adaptive weighting approach. The equation is as follows:
In this formula,
We set t which is a hyper-parameter to 1.02.
We processed the public dataset about Liver Tumor Segmentation (LITS) provided by Coda Lab. There were hundreds of CT image slices for each patient. The data which have been Pre-processing can be shown in the Fig. 6. The abdominal CT images and labels of cases used in this research all from LITS which were manually annotated by some radiologists. From these 131 groups of cases, we selected 118 groups of cases as training set and tumor labels and 25 groups of cases for testing. In addition, we set to extract 45 valid slices in each group of cases.
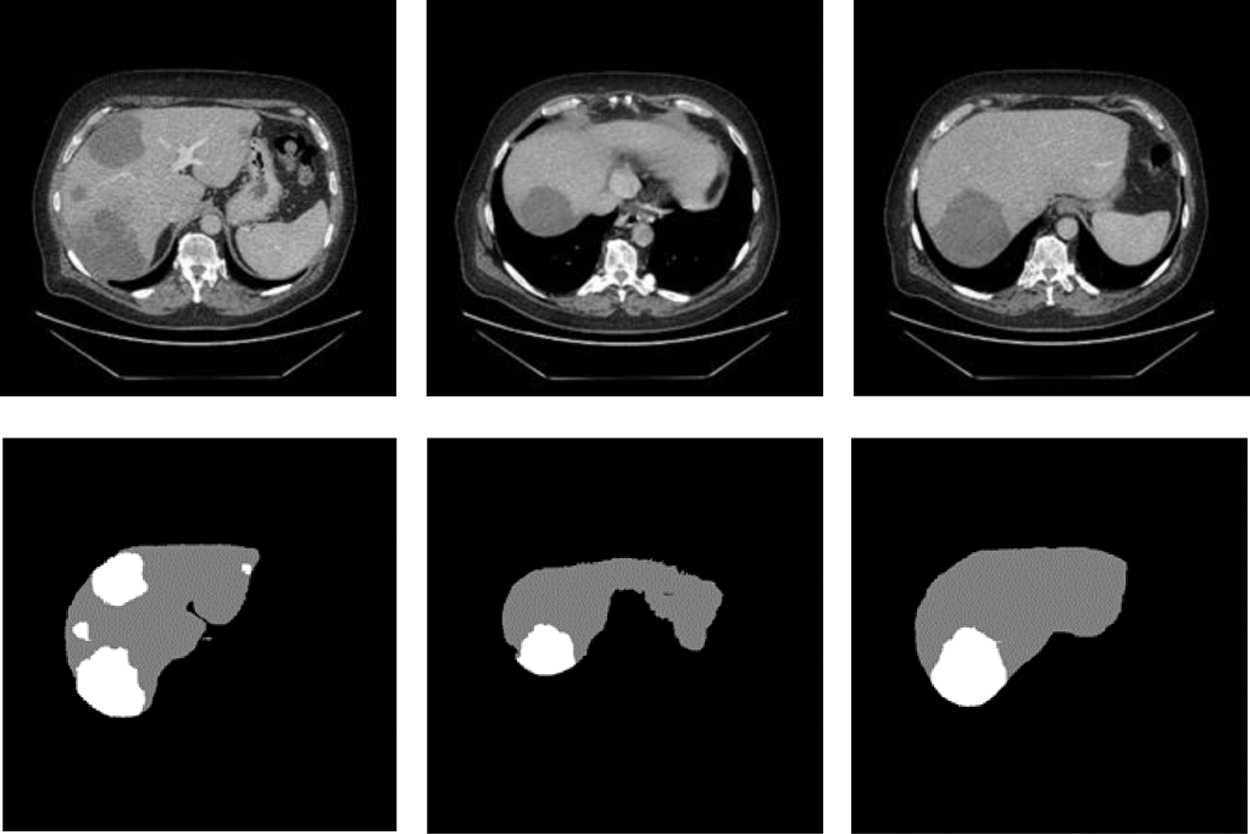
Figure 6: The slices used to train
The experimental environment was a computer running Linux Ubuntu 16.04 64-bit operating system, using Intel i7 4.20 GHz CPU (Intel Core i7-7700k), 16gb memory and NVIDIA GeForce GTX 1070 graphics card.
4.2 Evaluation Metrics and Results
In order to prove that the two new modules designed in this network and the adaptive weighted cross-entropy loss function achieved superior results for liver and tumors segmentation, the ablation experiments were first performed and the trained model was tested on the test set, and the segmentation results are shown in the Fig. 6. It indicated the test results of the proposed network for liver and tumors segmentation together with the results of manual annotation by experts.
From Fig. 7, we can see that the segmentation results obtained from the model designed in this paper were very close to expert annotation images, and this method can effectively optimize the border details of liver and tumor and solve low contrast and complex areas problems.
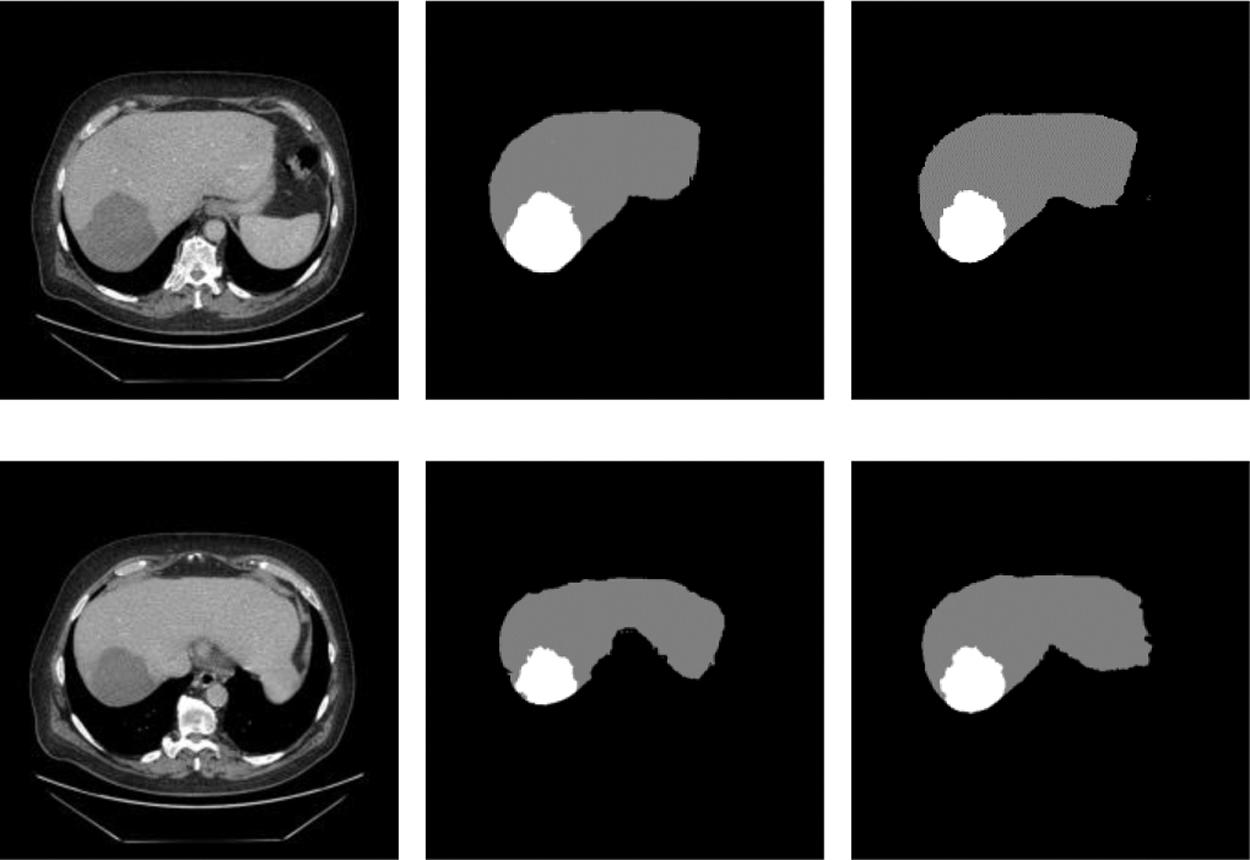
Figure 7: Raw, ground truth and segmentation results on the test image
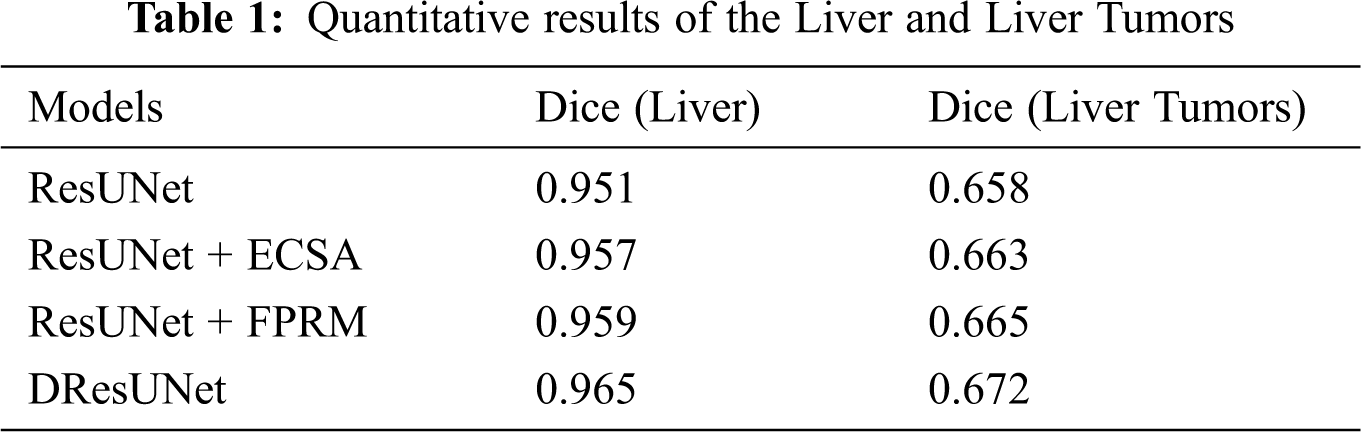
We wanted to verify the effectiveness of the model for completing segmentation tasks, so we will compare the test results about Dice. The details of the comparison can be seen in Tab. 1. From the data in the table, we can find that the performance has been slightly improved after adding ECSA and FPRM separately; and after using cross-entropy loss function for adaptive weights, the performance has been better improved. This also verifies the efficiency of this model.
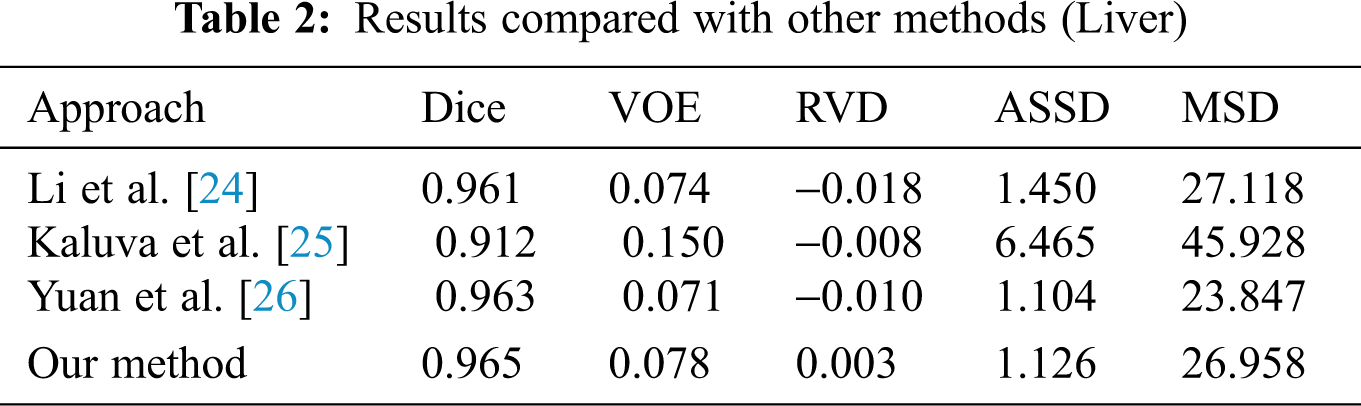
When we conducted comparative experiments, five metrics are used to measure the accuracy of segmentation results, including the volumetric overlap error (VOE), relative volume difference (RVD), average symmetric surface distance (ASSD), root mean square symmetric surface distance (MSD) and DICE. Tabs. 2 and 3 made clear results of comparing the proposed method with other segmentation algorithms. It can be seen that the Dice of the proposed network model in segmenting the liver was 0.965, and the values of other indicators were also relatively high. The Dice of segmented tumor was 0.672, which stated clearly that the network structure was more stable.
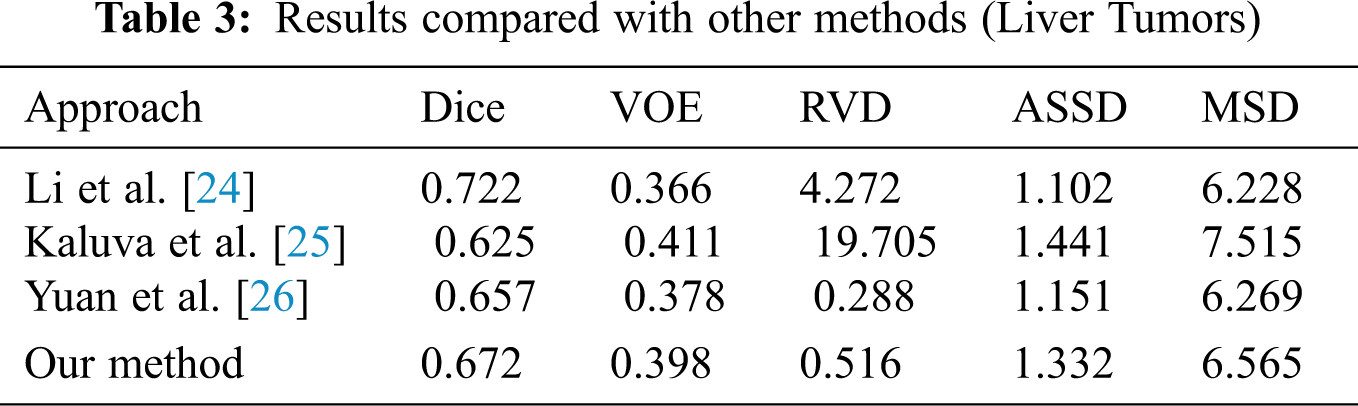
Although the Dice of H-DenseUNet was slightly higher, it used 3DdenseUNet that required higher conditions for hardware acceleration operations. The model we proposed can complete the segmentation of liver and tumors under the condition of low hardware requirements. It also fully proved that the modules designed by us effectively optimized the segmentation results both and obtained more accurate predicted target areas of CT scan abdominal images.
This paper proposed novel methods to segment liver and tumors, because the liver has the low contrast with surrounding tissues and its lesion complex areas. The DResUNet still achieved accurate segmentation in the case of insufficient data. Experimental results showed that insertion of residual blocks during the down-sampling process and the designed new two modules can significantly improve the accuracy of liver and tumors segmentation. In addition, deformable convolution was applied to enlarge the receptive field to adapt to targets deformations. The most important thing was new embedded modules alleviate the blurring of the liver and each tumor boundary and complex areas effectively.
Acknowledgement: The authors would like to thank Radiologists of the Medical Imaging department of Affiliated Hospital of Jiangsu University, University of Central Arkansas, the First Affiliated Hospital of Anhui Medical University, Jilin Normal University.
Funding Statement: This work was supported by Zhenjiang Key Deprogram “Fire Early Warning Technology Based on Multimodal Data Analysis” (SH2020011) and Jiangsu Emergency Management Science and Technology Project “Research on Very Early Warning of Fire Based on Multi-modal Data Analysis and Multi-Intelligent Body Technology” (YJGL-TG-2020-8).
Conflicts of Interest: The authors declare no conflict of interest.
1. Z. Liu, Y. Q. Song, V. S. Sheng, L. Wang, R. Jiang et al., “Liver CT sequence segmentation based with improved U-Net and graph cut,” Expert Systems with Applications, vol. 126, pp. 54–63, 2019. [Google Scholar]
2. Z. Bai, H. Jiang, S. Li and Y. D. Yao, “Liver tumor segmentation based on multi-scale candidate generation and fractal residual network,” IEEE Access, vol. 7, pp. 82122–82133, 2019. [Google Scholar]
3. H. Wu, Q. Liu and X. Liu, “A review on deep learning approaches to image classification and object segmentation,” Computers, Materials & Continua, vol. 60, no. 2, pp. 575–597, 2019. [Google Scholar]
4. B. Hu and J. Wang, “Deep learning for distinguishing computer-generated images and natural images: A survey,” Journal of Information Hiding and Privacy Protection, vol. 2, no. 2, pp. 95, 2020. [Google Scholar]
5. E. Vorontsov, M. Cerny and P. Régnier, “Deep learning for automated segmentation of liver lesions at CT in patients with colorectal cancer liver metastases,” Radiology: Artificial Intelligence, vol. 1, no. 2, pp. 180014, 2020. [Google Scholar]
6. A. Nugroho, D. Ihtatho and H. Nugroho, “Contrast enhancement for liver tumor identification,” MICCAI Workshop, vol. 41, no. 43, pp. 201, 2008. [Google Scholar]
7. C. C. Chang, H. H. Chen and Y. C. Chang, “Computer-aided diagnosis of liver tumors on computed tomography images,” Computer methods and programs in biomedicine, vol. 145, pp. 45–51, 2017. [Google Scholar]
8. M. Cui, H. Chen and J. Zhou, “A level-set based multi-material topology optimization method using a reaction diffusion equation,” Computer-Aided Design, vol. 73, pp. 41–52, 2016. [Google Scholar]
9. A. Khaloo and L. David, “Robust normal estimation and region growing segmentation of infrastructure 3D point cloud models,” Advanced Engineering Informatics, vol. 34, pp. 1–16, 2017. [Google Scholar]
10. V. S. Sheng and J. Zhang, “Machine learning with crowdsourcing: A brief summary of the past research and future directions,” Proc. of the AAAI Conf. on Artificial Intelligence, vol. 33, pp. 9837–9843, 2019. [Google Scholar]
11. J. Hu, Z. Luo, X. Wang, S. Sun, Y. Yin et al., “End-to-end multimodal image registration via reinforcement learning,” Medical Image Analysis, vol. 68, pp. 101878, 2020. [Google Scholar]
12. Y. LeCun, L. Bottou, Y. Bengio and P. Haffner, “Gradient-based learning applied to document recognition,” Proceedings of the IEEE, vol. 86, no. 11, pp. 2278–2324, 1998. [Google Scholar]
13. A. Krizhevsky, I. Sutskever and G. E. Hinton, “Imagenet classification with deep convolutional neural networks,” Communications of the ACM, vol. 60, no. 6, pp. 84–90, 2017. [Google Scholar]
14. K. Simonyan and A. Zisserman, “Very deep convolutional networks for large-scale image recognition,” arXiv: cs.CV, arXiv:2003.09424, 2020. [Online]. Available at: https://arxiv.org/abs/1409.1556. [Google Scholar]
15. K. He, X. Zhang, S. Ren and J. Sun, “Deep residual learning for image recognition,” in Proc. of the IEEE Conf. on Computer Vision and Pattern Recognition, pp. 770–778, 2016. [Google Scholar]
16. J. Long, E. Shelhamer and T. Darrell, “Fully convolutional networks for semantic segmentation,” in Proc. of the IEEE Conf. on Computer Vision and Pattern Recognition, pp. 3431–3440, 2015. [Google Scholar]
17. O. Ronneberger, P. Fischer and T. Brox, “U-net: Convolutional networks for biomedical image segmentation,” in Int. Conf. on Medical Image Computing and Computer-Assisted Intervention, Cham: Springer, pp. 234–241, 2015. [Google Scholar]
18. L. C. Chen, G. Papandreou, I. Kokkinos, K. Murphy and A. L. Yuille, “Deeplab: Semantic image segmentation with deep convolutional nets, atrous convolution, and fully connected crfs,” IEEE Transactions on Pattern Analysis and Machine Intelligence, vol. 40, no. 4, pp. 834–848, 2017. [Google Scholar]
19. H. Zhao, J. Shi, X. Qi, X. Wang and J. Jia, “Pyramid scene parsing network,” in Proc. of the IEEE Conf. on Computer Vision and Pattern Recognition, pp. 2881–2890, 2017. [Google Scholar]
20. J. Chen, Z. Zhou, Z. Pan and C. N. Yang, “Instance Retrieval Using Region of Interest Based CNN Features,” Journal of New Media, vol. 1, no. 2, pp. 87, 2019. [Google Scholar]
21. J. Dai, H. Qi, Y. Xiong, Y. Li, G. Zhang et al., “Deformable convolutional networks,” in Proc. of the IEEE Int. Conf. on Computer Vision, pp. 764–773, 2017. [Google Scholar]
22. Z. Liu, Y. Song and Z. Tang, “Noised image segmentation based on rough set and orthogonal polynomial density model,” Journal of Electronic Imaging, vol. 24, no. 2, pp. 023010, 2015. [Google Scholar]
23. M. Raghavendra, M. V. Lakshmaiah and S. Dastagiri, “Image enhancement using histogram equalization and spatial filtering,” International Journal of Science and Research (IJSR), vol. 1, no. 3, pp. 105–107, 2012. [Google Scholar]
24. X. Li, H. Chen, X. Qi, Q. Dou, C. W. Fu et al., “H-DenseUNet: Hybrid densely connected UNet for liver and tumor segmentation from CT volumes,” IEEE Transactions on Medical Imaging, vol. 37, no. 12, pp. 2663–2674, 2018. [Google Scholar]
25. K. C. Kaluva, M. Khened, A. Kori and K. Ganapathy, “2D-densely connected convolution neural networks for automatic liver and tumor segmentation.” arXiv: cs.CV, arXiv: 1802.02182, 2018. [Online]. Available at: https://arxiv.org/abs/1802.02182. [Google Scholar]
26. Y. Yuan, “Hierarchical convolutional-deconvolutional neural networks for automatic liver and tumor segmentation.” arXiv: cs.CV, arXiv:1710.04540, 2017. [Online]. Available at: https://arxiv.org/abs/1710.04540. [Google Scholar]
 | This work is licensed under a Creative Commons Attribution 4.0 International License, which permits unrestricted use, distribution, and reproduction in any medium, provided the original work is properly cited. |