DOI:10.32604/iasc.2021.020075
| Intelligent Automation & Soft Computing DOI:10.32604/iasc.2021.020075 | |
| Article |
Visualization of Reactor Core Based on Triangular Mesh Method
1Science and Technology on Reactor System Design Technology Laboratory of NPIC, Chengdu, 610213, China
2School of Computer Science, Chengdu University of Information Technology, Chengdu, 610225, China
3China Ship Scientific Research Center, Wuxi, 214082, China
4School of Computer Science, University of Nottingham Jubilee Campus, NG8 1BB, UK
*Corresponding Author: Hao Yang. Email: vhyang@foxmail.com
Received: 08 May 2021; Accepted: 21 June 2021
Abstract: In view of the characteristics of the numerical simulation results of the nuclear reactor core, including the regular structures, multiple geometry duplications, large-scale grids, and the demand for refined expression of calculation results, a mesh generation method based on Delaunay triangulation was used to solve the restructuring and visualizing problem of core three-dimensional (3D) data fields. In this work, data processing and visualization of the three-dimensional refined calculation of the core were accomplished, using the triangular mesh model, hash matching algorithm, 3D visualization technology, etc. Descriptions are also given for key issues such as Delaunay triangular mesh construction, the geometric model of the reactor core, and 3D data field mapping in this work. The application results showed that the 3D physical field data, such as core power and temperature, can be accurately and efficiently displayed using the visualization technology and solution. In addition, the efficiency of design and analysis in nuclear engineering activities can also be improved significantly.
Keywords: Triangular mesh method; three-dimensional data field; visualization technology
With the development of computer software and hardware technology, high-performance computing technology based on the use of a fine mesh has successfully been applied to solve challenging problems in the nuclear engineering field [1]. Using advanced physics and mathematics models, the fine numerical simulation and analysis of the whole reactor core can be carried out, and the calculation results are characterized by a large scale and diverse types. Traditional post-reprocessing methods no longer meet the needs of nuclear engineers. Data visualization [2,3] is a series of processes for converting large-scale data into geometric elements and generating visual images, including data loading, data conversion, geometric primitives generating, and visual attribute mapping. It was first applied in computing science and became an important branch of scientific computing visualization. Until now, the research results have been extensively used in medicine, geological exploration, weather forecasting, molecular biology, nuclear science, and other fields [4]. Due to great improvements in the refinement of nuclear reactor numerical simulations, massive amounts of data and results that change with time and space are generated in large-scale calculations [5]. As a result, the demand for processing and visualization technology applicable to three-dimensional (3D) data fields has become prominent, which can also provide support for multidimensional observation and decision analysis of numerical simulation results in the field of nuclear engineering.
2 Construction Method and Characteristic Analysis of Triangular Mesh
Traditionally, the analysis of core calculation data mainly includes two methods: direct text retrieval and data analysis assisted by schematic 2D images. The former method is not intuitive and inefficient in data retrieval. Although the latter method can directly observe the distribution characteristics of data in 2D space, it is still difficult to get the overall distribution of data in 3D space. The above two methods do not make full use of visualization technology to convert the resulting data generated during the scientific calculation process into image information for interactive processing and intuitive understanding. The key to the visualization of scientific computing in the field of nuclear engineering lies in the visualization of the 3D data field of the reactor core, which contains the spatial distribution of various types of physical field data in different dimensions. In the field of nuclear engineering, the generated numerical calculation data are huge with multidimensional, multivariable, and multimodel characteristics. Therefore, it is a resource- and calculation-intensive problem to fully display large-scale data [6], thus necessitating a fast and efficient mesh construction method.
2.1 Delaunay Triangular Mesh Method
Computer graphics processing equipment can only display limited types of primitives [7], such as points, line segments, polygons, triangles, and quadrilaterals. In order to display smooth geometric structures of various shapes, special algorithms are needed to generate discrete grids that approximate these smooth geometric structures as accurately as possible [8]. A polygon mesh has the characteristics of low input redundancy and high display rendering efficiency. As a special case of a polygon mesh, the triangular mesh has been widely used in the field of computer graphics processing [9] for generating clear data structures and mature mesh construction algorithms.
The Delaunay triangular mesh method [10] features a series of adjacent and non-overlapping triangles. It has empty circumscribed circles and a right angle, demonstrating higher quality than other types of triangular meshes [11]. Therefore, the Delaunay triangular mesh is the most widely used triangular mesh in computer graphics programs, and there are many researches on the optimization of the Delaunay triangular mesh [12]. This paper uses point-by-point insertion method [13] as an efficient Delaunay triangular mesh generation algorithm. Fig. 1 shows the detailed process of this algorithm:
(1) Define initial mesh: As showing in part (a) of Fig. 1, a triangular element is defined that contains the point set of the Delaunay mesh to be generated;
(2) Insert subsequent node: As showing in part (b) of Fig. 1, the subsequent node is inserted to the triangular mesh and connected with the three vertices of the triangular element which containing the node;
(3) Adjust the triangular mesh: Adjust the triangular mesh according to the rule that the circumcircle of the triangle element does not contain the vertices of other triangles;
(4) Insert the remaining nodes in a loop: Repeat steps (2) and (3) as showing in part (c) to part (i) of Fig. 1. Insert other nodes into the triangular mesh one by one to generate the corresponding triangular element and complete the optimization and adjustment work of the newly triangular mesh;
(5) Clean up outside elements: Clean the mesh elements outside the boundary of the point set to generate the final triangular mesh as showing in part (j) of Fig. 1.

Figure 1: The process of Delaunay triangular mesh generation. (a) Define Initial mesh, (b) Insert first node, (c) Insert second node, (d) Insert third node, (e) Insert fourth node, (f) Insert fifth node, (g) Insert sixth node, (h) Insert seventh node, (i) Insert last node, (j) Clean up outside elements.
The detailed algorithm of the generation of Delaunay triangular mesh can be seen in Tab. 1.
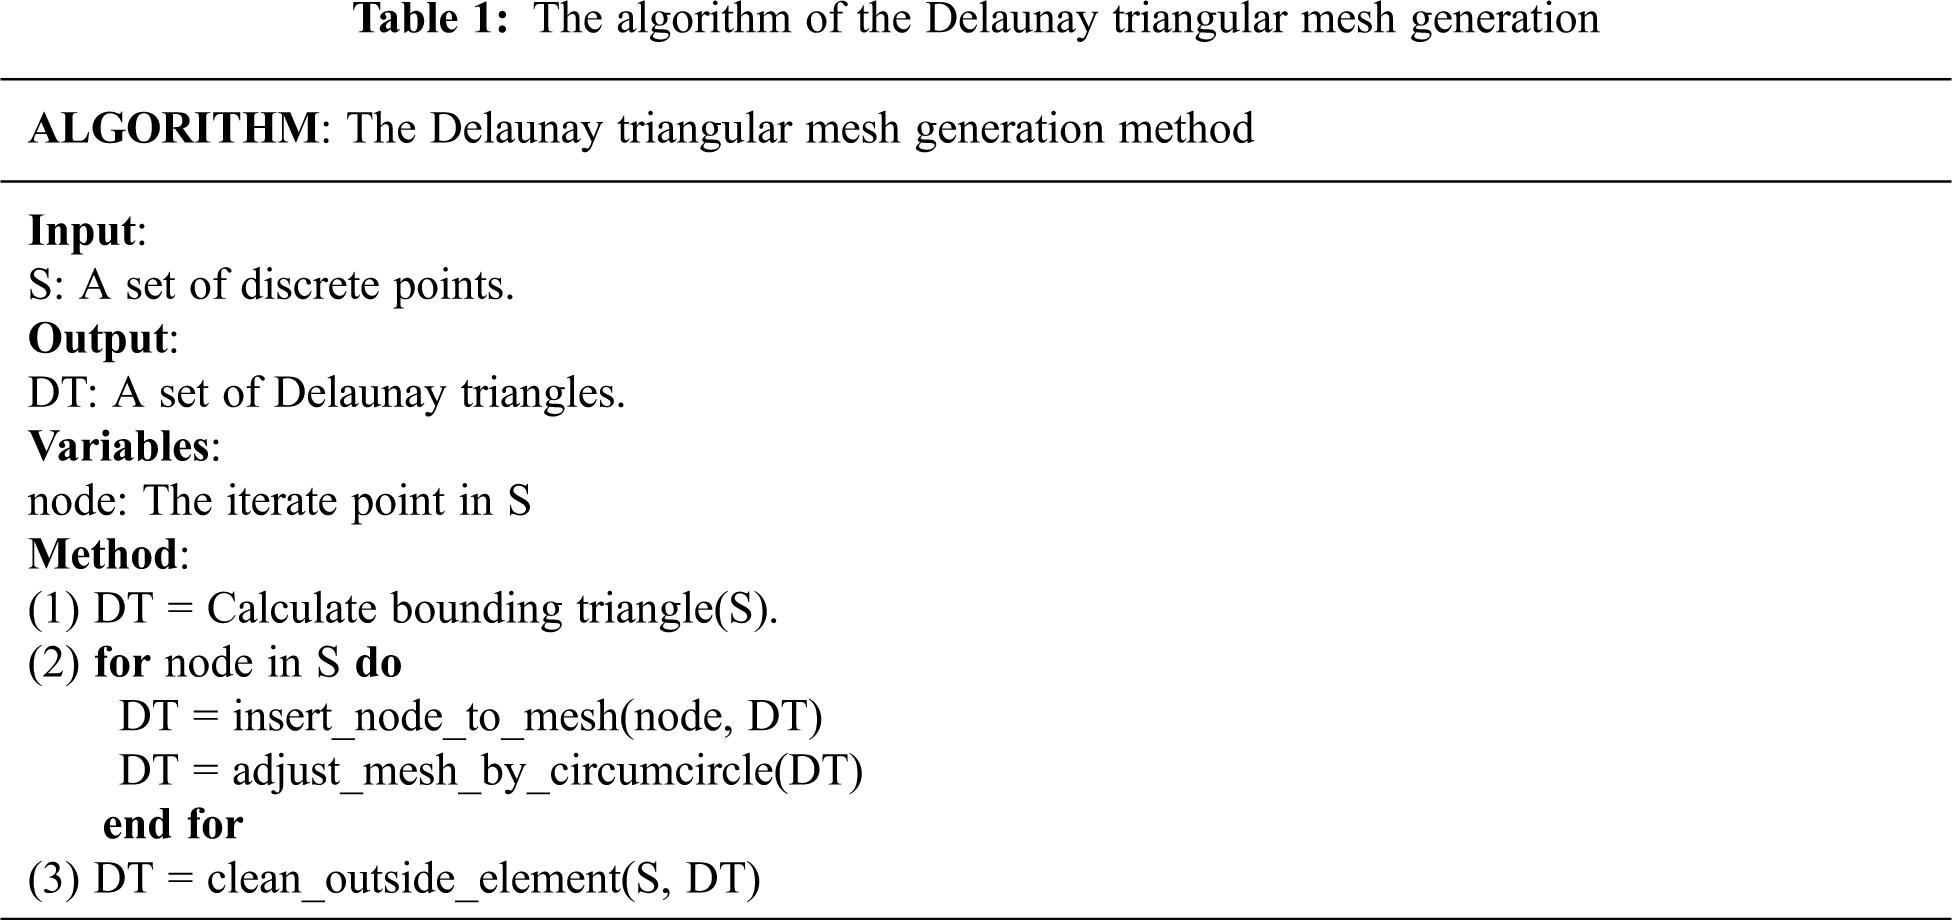
The advantages of this triangular method include more easily generated high-quality triangular mesh elements, strong adaptability, simple requirements for input nodes, and relatively easy programing implementation. The only input condition required is an orderly node set.
2.2 Applicability Analysis of Delaunay Triangular Mesh Method for the Reactor Core
The basic process describing the application of the triangular grid modeling method to the reactor core is as follows: firstly, the triangular mesh method is used to establish a mesh model matching the geometry of the reactor core. Then, the numerical core calculation results are mapped with the geometric grid. Lastly, the 3D fine data field of the whole reactor core is visualized using professional post-processing software. In this way, nuclear engineers can understand the performance of the reactor core more accurately and intuitively.
In the process of constructing a 3D visualization mesh model of the reactor core, compared with other geometric modeling techniques, the triangular mesh modeling method has the following advantages:
(1) Faster modeling speed: Only the data structure of the triangular mesh needs to be constructed, which contains the node and element information. There is no need to use open-source or commercial CAD libraries [14];
(2) Intuitive display of results: The coloring range is relatively rich, and it can be colored on the basis of points, elements, surfaces, bodies, etc. The cross-scale rendering of the model can be refined [15];
(3) Efficient data loading: The triangular mesh data structure is suitable for the storage of results and visual mapping; thus, there is no need to design an additional storage structure [16].
Furthermore, since there are a large number of fuel elements composed of cylindrical geometry in the core, a cylinder was used to test the effectiveness of the algorithm. Fig. 2 shows different Delaunay triangular meshes generated using different precision discrete point sets as input. The results illustrate that the use of the triangular mesh generation algorithm described in Section 2.1 can easily generate core visualization models with different display accuracy.

Figure 2: The results using Delaunay triangular mesh algorithm with different accuracy
3 Geometry Model Construction of the Core and Data Field Mapping
The reactor core is composed of hundreds of fuel assemblies, which are arranged in a certain layout [17]. The geometric models involved in the field of core numerical calculation are generally classified into three categories:
(1) Real geometric models: Based on the actual structure of the reactor core, geometric models contain accurate and complete geometric features, such as the STEP model constructed with CAD tools [18];
(2) Computational grid models: For numerical calculation, computational grid models are simplified and redivided on the basis of the real geometric model [19]. Computational grid models need to fully consider the actual characteristics of the algorithm (such as the point and line geometry used for the MOC method [20] or CSG geometry used for the Monte Carlo method [21]);
(3) Rendering mesh models of data field: Geometric mesh models can be used for the three-dimensional visualization analysis of spatial numerical calculation results. Generally, they fully consider the characteristics of computer graphics processing technology and use tetrahedron, hexahedron, and other discrete methods to approximate the geometric structure [22].
The core numerical calculation involves a large number of calculation codes, which use different data description formats. Therefore, in order to improve the efficiency of the rendering mesh model, in this work, an intermediate data format-based method was adopted to realize the decoupling of 3D visualization and calculation software.
3.1 Construction of Rendering Mesh of Core Data Field
Most 3D models are constructed using geometry engines to generate polygon meshes, which can automatically generate corresponding polygon meshes with the help of general CAD tools. The tools are characterized by strong algorithm versatility. It is difficult to associate the computational grid model, as well as optimize the rendering efficiency, for the specific structure of the core. Considering a reactor core with a regular geometric structure (commonly using basic solids such as cuboids and cylinders) and a large number of repeated structures, a triangular grid was adopted to approximate the reactor core geometry, as shown in Fig. 3.

Figure 3: Schematic diagram of the construction process of the core 3D geometric mesh
Fig. 3 shows a schematic of the construction process of the 3D geometric structure mesh model of the reactor core. The construction method of the core rendering model was divided into five main steps:
(1) Parse calculation data: Combined with the characteristics of the core numerical calculation software, the corresponding data source analysis programs were developed. Data generated by the calculation software at different time steps, including the power, burnup, and neutron flux, were extracted, which were all further processed into a standard intermediate format.
(2) Construct the computational grid: The input file of the calculation software was analyzed. The core computational grid model was constructed in an automatic or semi-automatic way.
(3) Generate rendering mesh of fuel rods: According to the requirements of accuracy, considering the geometric parameters of the fuel rods, this work used a specific algorithm to generate the control nodes of fuel rods. Then, the control node of the fuel rods was taken as input to generate the triangular mesh on the section, before stretching it in the axial direction to generate the mesh model of fuel rods, using the Delaunay triangular mesh construction method described in Section 2.
(4) Generate a 3D rendering mesh for reactor core: According to the layout parameters of the fuel assembly and fuel rods of the reactor core, a 3D mesh model of the entire reactor core was constructed by referencing the mesh model of fuel rods. According to the calculated data in the standard intermediate format, the core data field matching algorithm was used to realize correlation mapping between the full core three-dimensional geometric mesh model and data from the core power, burnup, flux, etc.
(5) Map visualization attributes: The visual attribute mapping method was used to map spatial calculation data into visual attributes such as color and transparency [23], allowing nuclear engineers to accurately and intuitively determine the distribution of power, fuel consumption, neutron flux, and other calculation results, thereby providing a reliable basis for the optimization of calculation schemes.
In this work, the general finite element mesh model was used to describe the 3D rendering mesh model; accordingly, the complete mesh model was composed of multiple elements arranged on the basis of specific rules, while the elements were defined according to the referencing node element ID [24]. Specifically, the node was defined by an array of triples. The spatial position coordinates of the node were defined by each element of the array, and the element was defined by an array that described the connection mode of the node.
3.2 Generation Algorithm for Control Node of Fuel Rods
The geometric structure of the core was composed of a large number of repeated cylinders. Eq. (1) presents the implicit calculation formula for the inner circumference of the bottom surface of the cylinder, where a represents the coordinate value of the center of the circle in the X-direction, b represents the coordinate value of the center of the circle in the Y-direction, x represents the abscissa of the circle point, y represents the ordinate of the circle point, and r is the circle radius.
When constructing the cylindrical bottom point set, Ni represents the ith point where the total number of circumferential nodes is N, θ is the rotation angle increment of the adjacent points in the circumferential direction, and z is the normal coordinate of the cylindrical bottom surface. The parameter expressions of the circular curve can be obtained via interpolation as Eqs. (3) and (4).
Eq. (5) is the matrix expression of the cylindrical point set.
After the control node was obtained, the point-by-point insertion algorithm described in Section 2 was used to generate the Delaunay triangular mesh model of the fuel pin [25]. Combined with the core characteristics of a large number of repeated structures, the modular method was used to form the final visualization mesh model of the reactor core. Compared with directly generating the mesh model for analysis and display, this method can significantly improve the generation and rendering efficiency of the core geometric mesh model.
3.3 Core Data Field Matching Algorithm
In order to accurately present the spatial distribution characteristics of the core calculation data, an interpolation algorithm was also used to complete the data mapping between the computational grid and the rendering mesh. As a result that there were tens of millions of cells in the core finite element model, the hash matching algorithm [26] was used in this work to efficiently complete the mapping.
The “divide and leave remainder” method is a commonly used construction hash algorithm, as described in Eq. (6).
where K is the key code, and p is an integer used as the filling factor of the hash table. If the length of the hash table is M and the number of triangle units is N, then 0 < p ≤ M ≤ N is required, and p is as close to or equal to M as possible. Here, p is generally selected as a prime number; alternatively, it can be a composite number that does not include prime factors less than the number of core triangle cells.
There are three factors in the hash table method that affect the number of keyword comparisons: the hash function, the method of handling conflicts, and the filling factor of the hash table. The filling factor p is equal to the number of elements in the hash table divided by the length of the hash table. A smaller value of p denotes a smaller probability of conflict. Conversely, a larger value of p denotes a greater probability of conflict, whereby more comparisons are used to handle the conflict. Generally, p is taken as an appropriate decimal between 0.5 and 1.0.
Fig. 4 shows a schematic of the segmented mapping of a certain calculation result obtained by the matching algorithm in this work.

Figure 4: Schematic diagram of result segment mapping
The below steps take the first segment of a single fuel rod as an example to illustrate the method of establishing the mapping relationship between the geometric model and the calculated data in Fig. 4.
Step 1: Use a triangular meshing algorithm to discretize segment 1 of the fuel rod into finite element meshes.
Step 2: Build a hash list on the basis of grid meshes and build a hash index with the grouping key.
Step 3: Use the hash function to calculate the hash address corresponding to the key code.
Step 4: Sequentially compare whether the internal element of the hash address in the grouping grid is the key code of the result data, and copy the resulting data to the mesh model to complete the mapping.
This work optimized the frequency of calling keywords when constructing the hash function. Keywords with high frequency were placed in positions with fewer comparisons in the list, whereas keywords with low frequency were placed in positions with a greater number of comparisons. In this way, the data search speed was further accelerated, thereby improving the function's ability to search massive grid data.
4 Visualization of 3D Core Data Field
Considering the scale of the core three-dimensional data field and the technical difficulty of the visualization scheme, combined with the visual analysis requirements of nuclear engineers, this work adopted the method of secondary development based on EnSight software to realize the visualization of the core 3D calculation data.
The characteristics of the scheme are described below [27]:
(1) Applicable to very large mesh models: For the core 3D mesh visualization model constructed using the abovementioned triangular meshing method, EnSight can support the smooth display of mesh models that contain tens of millions of cells.
(2) Standardization of core data formats: The core power, burnup, flux, and other results obtained via the above-introduced numerical calculation software can all be converted into standard data formats for EnSight.
The data flow principle of the data field 3D visualization software (referred to CorePost) is shown in Fig. 5.

Figure 5: The data flow chart of 3D visualization tool
4.2 Three-dimensional Display of Core Calculation Results
In practical applications, there are many output formats of core numerical calculation software; however, we only need to develop the corresponding data source extraction interface and convert it into an intermediate data format when using CorePost. The CorePost tool can automatically complete the other steps needed for core data field three-dimensional display, including standard data format reconstruction, sequential node-set construction, FEM triangulation mesh division, 3D model generation, unit result data matching, and simulation model visualization.
CorePost can reconstruct and create multiscale models of the entire core, fuel assemblies, fuel cells, etc. Various model operation functions are provided, such as the symmetrical expansion of the core and 3D sectioning. Multidimensional result-viewing functions are also provided, such as 1D curves, 2D sections, and 3D cloud map rendering, which allow comprehensively displaying the 3D refined display results of the core data field from both quantitative and qualitative perspectives.
Fig. 6 takes the calculation result of a nuclear reactor core as an example to show a 3D visualization analysis of the core power distribution calculation result. It contained 157 fuel assemblies with a single fuel assembly containing 289 fuel pins, where each fuel pin contained approximately 600 volume cells. In this example, the number of cells generated after conversion was 2.0 × 10⁷.

Figure 6: Core 3D power calculation results
The 3D mesh model building module was used to reconstruct and generate models of the core, fuel assemblies, fuel pins, etc. The visualization tool was then used to display the 2D curve and 3D temperature cloud map of the results with multiple scales. The results are shown in Fig. 7.

Figure 7: Multidimensional visualization analysis of core power data
Due to in-depth research, the wide application of high-fidelity models, and the development of high-precision algorithms in the field of nuclear engineering, massive calculation data are generated during numerical calculations of cores. As such, big data processing and visualization technologies can be effectively combined to process and analyze these data that change dynamically over time and have high-dimensional and heterogeneous data sources.
This work designed a visualization scheme for the calculation results of 3D reactor core models using the triangular mesh method. The processes mainly included data model design, data field mapping, and visualization tool development. The generation process of the triangular mesh was adaptively optimized according to the actual structural characteristics of the nuclear reactor. The achieved result performed well in terms of the loading time and processing efficiency for large-scale calculation models, thus significantly improving calculation efficiency for nuclear engineers.
Funding Statement: This work was sponsored by the Sichuan Science and Technology Program (2020YFS0355, 2020YFG0479, and 2019YFG0196).
Conflicts of Interest: The authors declare that they have no conflicts of interest to report regarding the present study.
1. P. J. Turinsky and D. B. Kothe. “Modeling and simulation challenges pursued by the consortium for advanced simulation of light water reactors (CASL),” Journal of Computational Physics, vol. 313, pp. 367–376, 2016. [Google Scholar]
2. K. Liu, X. Z. Zhou and D. R. Zhou, “Data visualization research and development,” Computer Engineering, vol. 28, no. 8, pp. 1–2+63, 2002. [Google Scholar]
3. G. Sun, F. H. Li and W. D. Jiang, “Brief talk about big data graph analysis and visualization,” Journal on Big Data, vol. 1, no. 1, pp. 25–38, 2019. [Google Scholar]
4. Z. S. Tang, Y. K. Sun and J. H. Deng, “Advances in the study of visualization in scientific computing,” Journal of Tsinghua University (Science and Technology), vol. 41, no. 4, pp. 199–202, 2001. [Google Scholar]
5. W. D. Jiang, J. Wu, G. Sun, Y. X. Ouyang, J. Li et al., “A survey of time series data visualization methods,” Journal of Quantum Computing, vol. 2, no. 2, pp. 105–117, 2020. [Google Scholar]
6. D. Cui, X. Y. Guo and W. Chen, “Challenges and recent progress in big data visualization,” Journal of Computer Applications, vol. 37, no. 7, pp. 2044–2049 + 2056, 2017. [Google Scholar]
7. G. Y. Wang and Z. R. Wang, “Research on 3D visualization system of culverts based on OpenGL,” Journal of Water Resources and Architectural Engineering, vol. 12, no. 5, pp. 137–141, 2014. [Google Scholar]
8. L. Q. Zhou, “Research on unstructured finite element mesh generation method and its application,” Ph.D. dissertation, Shandong University of Science and Technology, China, 2019. [Google Scholar]
9. G. P. Luo, Y. J. Yin, X. Shen, X. Y. Ji and J. X. Zhou, “Triangular mesh generation algorithm for casting surface based on STL file,” Special Casting & Nonferrous Alloys, vol. 40, no. 7, pp. 740–746, 2020. [Google Scholar]
10. V. Tran and L. Wang. “Delaunay triangulation-based spatial colocation pattern mining without distance thresholds,” Statistical Analysis and Data Mining: The ASA Data Science Journal, vol. 13, no. 3, pp. 282–304, 2020. [Google Scholar]
11. F. X. Li, Y. M. Liu, X. Z. Wang and Y. H. Rao, “New delaunay triangulation algorithm of point cloud based on parametric method,” Application Research of Computers, vol. 32, no. 3, pp. 950–953, 2015. [Google Scholar]
12. S. Oh, “A new triangular mesh repairing method using a mesh distortion energy minimization-based mesh flattening method,” Advances in Engineering Software, vol. 131, pp. 48–59, 2019. [Google Scholar]
13. W. X. Qing and W. Chen. “Delaunay triangular mesh optimization algorithm,” Computer Science, vol. 46, no. s1, pp. 226–229, 2019. [Google Scholar]
14. S. X. Zhang, M. Zeng, H. L. Zhao, X. J. Xu and L. Zhao, “CAD software with CAE data conversion and interface research methods,” Oil Field Equipment, vol. 36, no. 2, pp. 4–6, 2007. [Google Scholar]
15. L. B. Shen, A. M. Ji and Q. S. Huang. “Research on CAD model transformation oriented CAE analysis,” Machine Tool & Hydraulics, vol. 37, no. 11, pp. 202–204+210, 2009. [Google Scholar]
16. X. H. Wang, L. Chang, X. H. Nie and H. Huang, “Research on a fast display method of finite element results data for CAE analysis,” Aeronautical Computing Technique, vol. 50, no. 3, pp. 58–61, 2020. [Google Scholar]
17. X. Y. Li, Q. W. Liu, Q. Li, L. Chen, X. L. Liu et al., “177 core nuclear design for HPR1000,” Nuclear Power Engineering, vol. 40, no. s1, pp. 8–12, 2019. [Google Scholar]
18. Y. Zhao, “Research on methods of design feature boundary segmentation for STEP solid models,” M.S. thesis, Dalian University of Technology, China, 2017. [Google Scholar]
19. Y. Zheng, “Study on acceleration techniques of matrix MOC and 3-D neutron transport calculation method,” Ph.D. dissertation, Harbin Engineering University, China, 2017. [Google Scholar]
20. X. L. Tu, J. J. Pan, X. M. Chai, W. B. Wu, S. Chen et al., “Research and development of visual graphic modeling for advanced neutron transport lattice code KYLIN-II,” Nuclear Power Engineering, vol. 38, no. 3, pp. 126–131, 2017. [Google Scholar]
21. G. H. Yuan, D. Liu, H. X. Yu, J. T. Hao, S. L. Qiang et al., “Research of visual conversion technology for reactor core monte carlo model based on CSG,” Nuclear Power Engineering, vol. 40, no. 3, pp. 180–184, 2019. [Google Scholar]
22. B. Cui, “Key techniques for real-time 3-D interactive visualization of massive data,” Ph.D. dissertation, Shanghai University, China, 2010. [Google Scholar]
23. G. H. Peng, B. X. Wang and Y. B. Huang, “Visualisation treatment of calculation results for radiation hydrodynamics,” Computer Applications and Software, vol. 32, no. 4, pp. 56–58, 2015. [Google Scholar]
24. H. J. Liu and W. N. Fu, “A parameterized mesh generation and refinement method for finite element magnetic field computation and its application in optimal design of electric motors,” Proc. of the CSEE, vol. 32, no. 21, pp. 125–130, 2012. [Google Scholar]
25. Q. Huang, H. liu and P. Y. Liang, “Parallel construction algorithm of delaunay triangulated irregular network,” Science of Surveying and Mapping, vol. 42, no. 6, pp. 171–177, 2017. [Google Scholar]
26. P. Ramachandran and G. Varoquaux, “3D visualization of scientific data,” Computing in Science & Engineering, vol. 13, no. 2, pp. 40–51, 2011. [Google Scholar]
27. W. W. Xue and C. Z. Cheng, “Visualization of scientific data using ensight,” Journal of Hefei University (Comprehensive ED), vol. 26, no. 1, pp. 41–45, 2016. [Google Scholar]
 | This work is licensed under a Creative Commons Attribution 4.0 International License, which permits unrestricted use, distribution, and reproduction in any medium, provided the original work is properly cited. |