DOI:10.32604/iasc.2021.016868
| Intelligent Automation & Soft Computing DOI:10.32604/iasc.2021.016868 | |
| Article |
Association between Temperature and Relative Humidity in Relation to COVID-19
1Department of Statistics, Universitas Negeri Makassar, Makassar, 90223, Indonesia
2Department of Mathematics and Statistics, College of Science, Taif University, Taif, 21944, Saudi Arabia
3Department of Mathematics, Universitas Negeri Makassar, Makassar, 90223, Indonesia
*Corresponding Author: Ansari Saleh Ahmar. Email: ansarisaleh@unm.ac.id
Received: 14 January 2021; Accepted: 10 May 2021
Abstract: The aim of this study is to determine the association between temperature and humidity in relation to COVID-19 above 3°C. This was carried out in the cities of Bandung and Surabaya which have temperatures of about 22°C to 31°C. Data was analyzed using descriptive analysis and the Pearson and Spearman correlation for normally and abnormally distributed data. The results showed that there was no association between people under monitoring (ODP)/close contact, patients under surveillance (PDP)/suspect, and COVID-19 confirmed cases in relation to the temperature and humidity in Bandung and Surabaya. Furthermore, there was no relationship between temperature and humidity with ODP, PDP, and COVID-19 Confirmed cases in both cities, because they had a comfortably wet category (RH > 70%). This results are expected to provide information to the government that weather cases in Indonesia (temperatures around 26°C–30°C with humidity > 60%) do not affect the spread of COVID-19. In addition, it is expected that further studies would be carried out on other factors that influence the spread of COVID-19 in Indonesia, for example, how the level of alternating flow in and/or out of the population into an area.
Keywords: Temperature; relative humidity; COVID-19
COVID-19 is an infectious disease that currently exists worldwide. Based on the data from WHO, as of April 6th 2020, there were 1,210,956 confirmed cases and 67,594 deaths [1]. COVID-19 outbreak was first detected in the city of Wuhan, Hubei Province, China in December 2019. It is an infectious disease caused by a newly discovered coronavirus (SARS-CoV-2) [2]. Most people infected with the virus experienced a mild to moderate respiratory disease and later recovered without the need for special care. Meanwhile, for older people that were infected and have a history of cardiovascular disease, diabetes, chronic respiratory illnesses, and cancer may experience different treatment in order to be cured. This is in line with [2] the study which stated that on February 11th 2020, there were 44,672 confirmed cases in China, and most of them were aged between 30 and 69 years (77.8%). Furthermore, 12.8% had hypertension, 5.3% diabetes and 4.2% cardiovascular, and 81% of the infected Chinese that died were 60 years and above [2,3]. The following individuals conducted a research on COVID-19, namely Ahmar [4] studied everything about COVID-19 and weather/climate, El Safty et al. [5] studied about Topological Modeling for Symptom Reduction of Coronavirus; Alblowi et al. [6] studied about decision making in COVID-19; Ahmar et al. [7–9] studied about forecasting COVID-19 in Spain, and Atuahene et al. [10] studied the effects of COVID-19 on the educational sector management and economy.
Temperature also has an effect in increasing the number of COVID-19 cases. Xie et al. [11] stated that “in China when mean temperature (lag 0–14) was below 3°C, each 1°C rise was associated with a 4.861% (95% CI: 3.209–6.513) increase in the daily number of confirmed cases”. However, there is no supporting evidence of this study which stated that the confirmed cases occurred at temperatures above 3°C. Shi et al. [12] also conducted a study on the relationship between temperature and absolute humidity with COVID-19 in China. The results showed that lower and higher temperatures might be positive for reducing the incidence of COVID-19. Furthermore, this is in line with Ma et al. [13] which stated that an increase in temperature and absolute humidity per 1 unit would be associated with a decrease in the death rate of COVID-19. Wang et al. [14] revealed that the arrival of summer and the rainy season in the northern hemisphere could effectively reduce the COVID-19 transmission in the region.
The COVID-19 case in Indonesia was detected on March 2nd 2020 in Jakarta and over time, the pandemic had spread to various provinces. As of April 7th 2020, more than 2738 cases of COVID-19 have been reported in 32 provinces in Indonesia. Furthermore, more than 204 people have recovered and 221 people died [15]. Based on the outcomes, it was necessary to determine whether the temperature above 3°C would increase the number of COVID-19 cases. Therefore, this study was conducted in Bandung and Surabaya cities, Indonesia with an average temperature of around 24°C and 29°C.
The temperature and relative humidity data of both Surabaya and Bandung cities were obtained from BMKG (http://dataonline.bmkg.go.id) [16], while the COVID-19 data were obtained from the website of Surabaya (https://lawanCOVID-19.surabaya.go.id), and Bandung cities (https://covid19.bandung.go.id), respectively from March 6th to April 23rd 2020. These COVID-19 data consist of people under monitoring (ODP), patients under surveillance (PDP), and positive patients (Confirmed) [17]. Furthermore, people under monitoring (ODP) are those that have symptoms of fever more than 38°C and have a history of fever or ARI without Pneumonia and travelling to affected areas in the last 14 days before the symptoms appeared. Patients under surveillance (PDP) are those that have symptoms of fever more than 38°C and have a history of fever, ARI and mild to severe Pneumonia and travelling to the coronavirus epicenter or have made contact with people suspected to be COVID-19 positive in the last 14 days [17]. In addition, the data for confirmed cases of COVID-19 are those that have been officially announced by the Ministry of Health of the Republic of Indonesia [15].
Data was analyzed using descriptive analysis and the Pearson and Spearman correlation analysis for normally and abnormally distributed data. The stages of correlation data analysis are as follow:
a) Data need to be standardized first, because their units differ.
b) Test data normality
c) Look for associations between temperature, humidity, ODP, PDP, and Confirmed cases variables by using Pearson correlation analysis for normally distributed data and Spearman rho correlation analysis for abnormally distributed data.
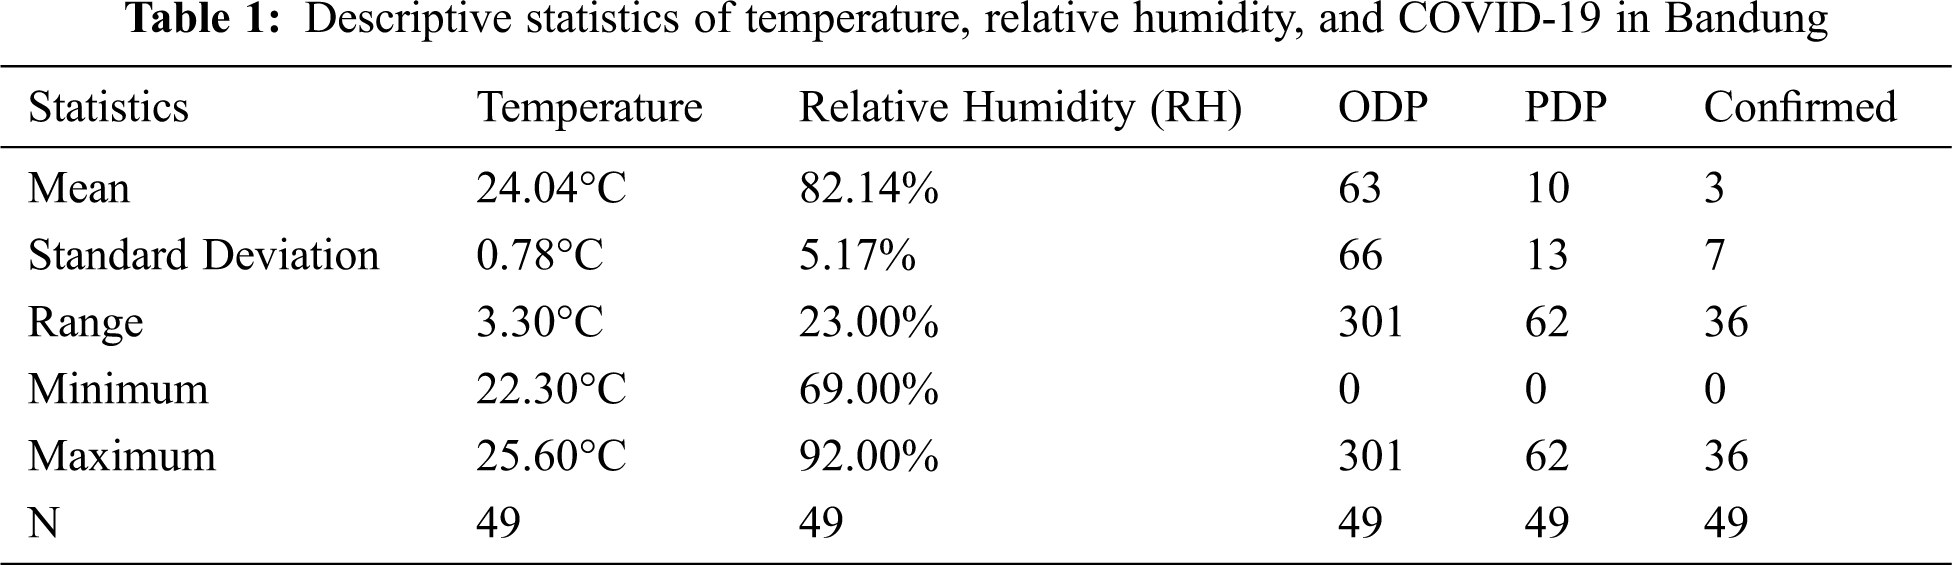
Based on Tab. 1, the average temperature in Bandung during the COVID-19 period was 24.04°C (in the minimum temperature range of 22.30°C and a maximum of 25.60°C) with an average humidity level of 82.14%. Furthermore, the humidity of the city of Surabaya was included in the category of uncomfortably wet [18] and of high humidity with a normal limit of 30% to 60% [19]. A high humidity level >70% could trigger asthma and allergies. In addition, the average number of people with ODP status was about 63 people, PDP was 10, and patients with confirmed positive cases of COVID-19 was about 3 people per day with a standard deviation of 66, 13, and 7 respectively.
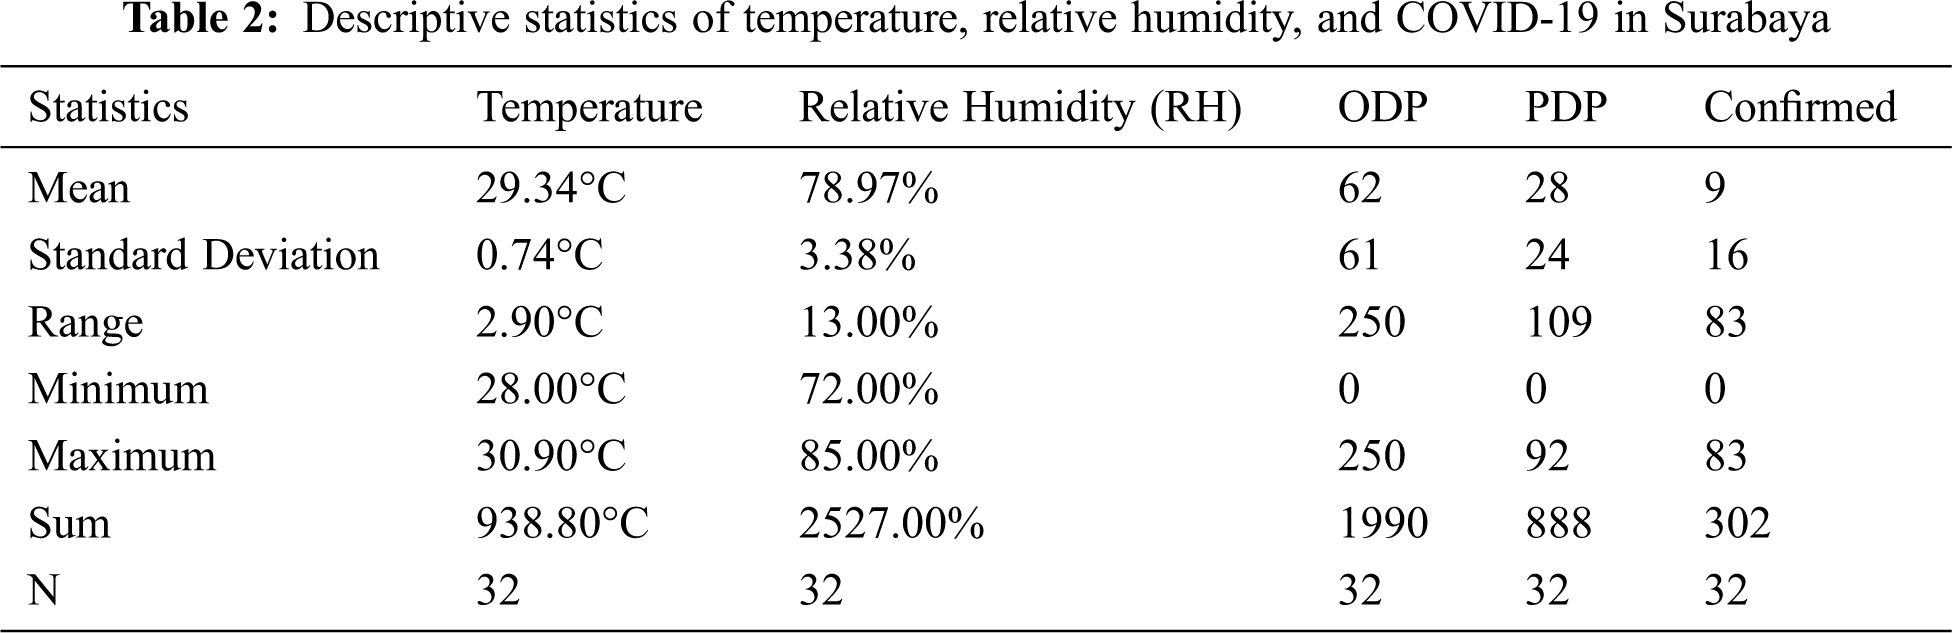
For the case of Bandung, based on Tab. 2, the average temperature in Surabaya during the COVID-19 period was 29.34°C (in the minimum temperature range of 28.00°C and a maximum of 30.90°C) with an average humidity level of 78.97%.
Figs. 1b and 1d show that at the beginning of the plot, the temperature curve was inversely proportional to the humidity curve, which is different from that of the PDP and confirmed cases that are directly proportional. Furthermore, based on Figs. 1b and 1d, temperature and humidity do not significantly affect the amount of ODP, PDP, and Confirmed cases. In Bandung, as of April 4th 2020, it was found that the ODP, PDP, and confirmed cases curves are directly proportional, in other words, when humidity rises, ODP, PDP, and confirmed cases would also rise. These things happen because the average high humidity level in Bandung (82.14%) could cause asthma which is an indicator of ODP and PDP. Furthermore, in order to determine more about the association between temperature and humidity in relation to the COVID-19 case, a correlation analysis was conducted. It was divided into 2 namely Pearson and Spearman rho correlation analysis. In order to determine the use of this analysis, the data normality test was first performed. When the data do not meet the normality test, Pearson correlation analysis is used and vice versa, before using the nonparametric correlation analysis (Spearman rho).
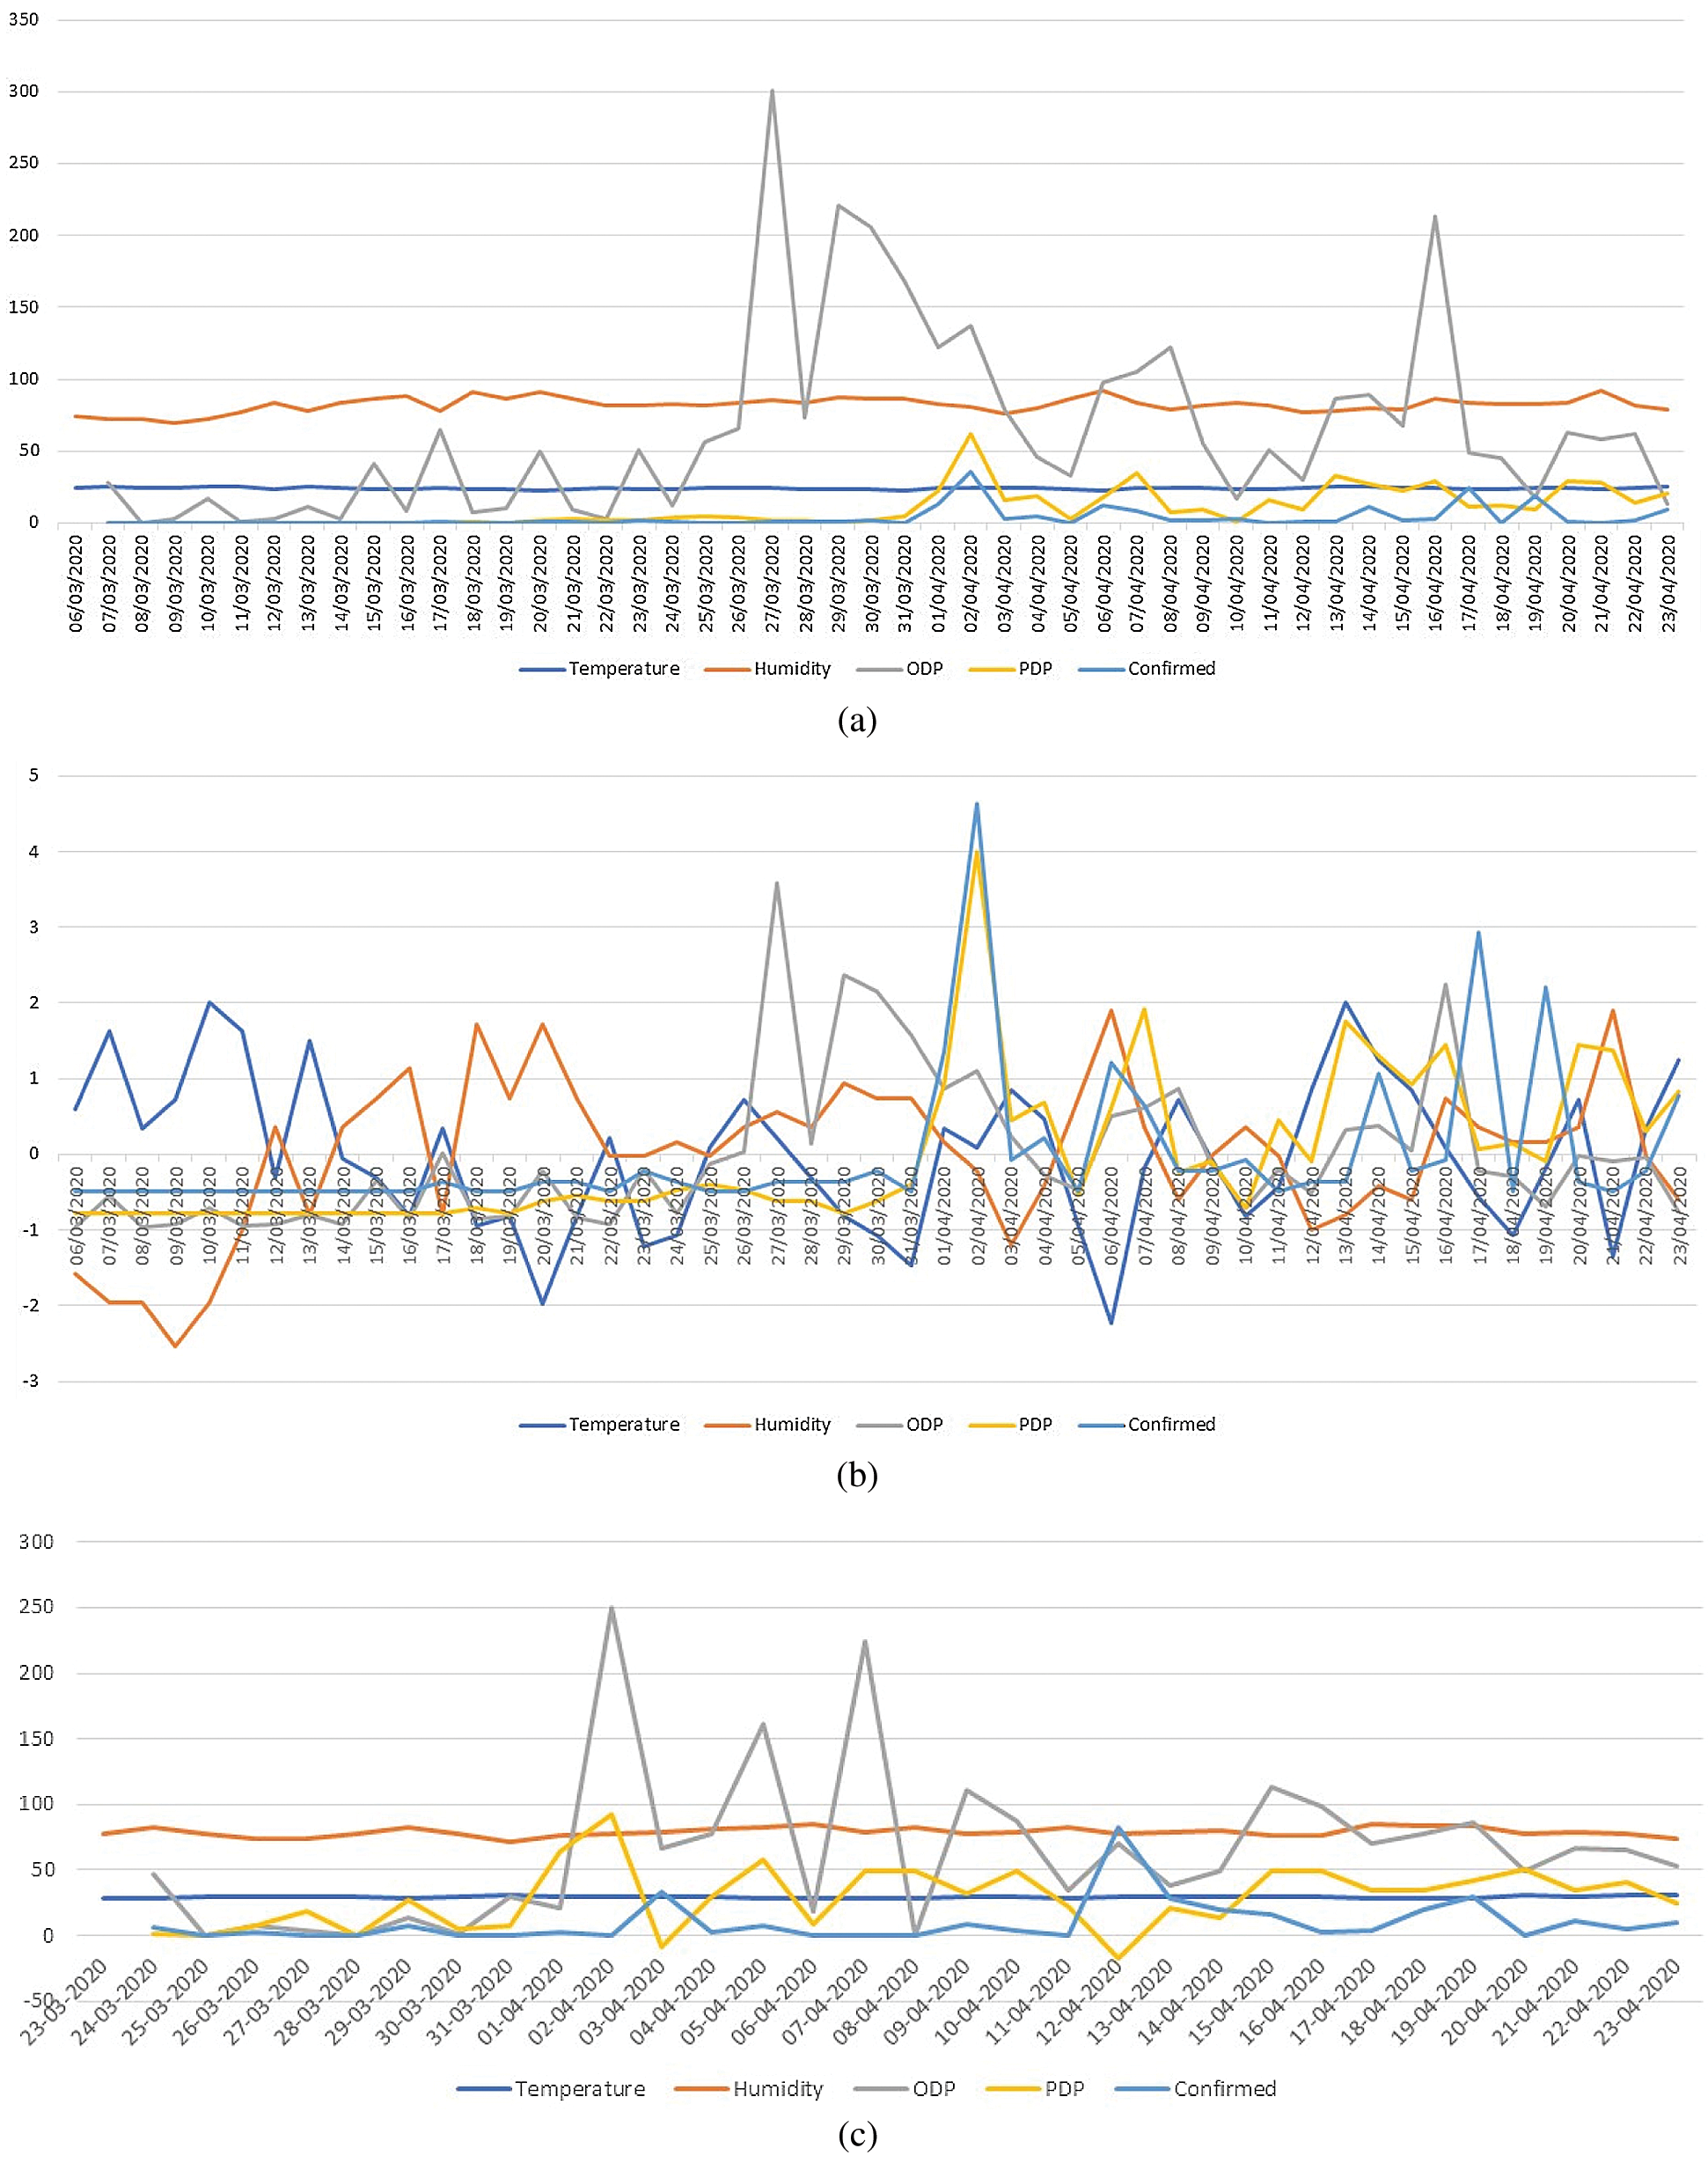
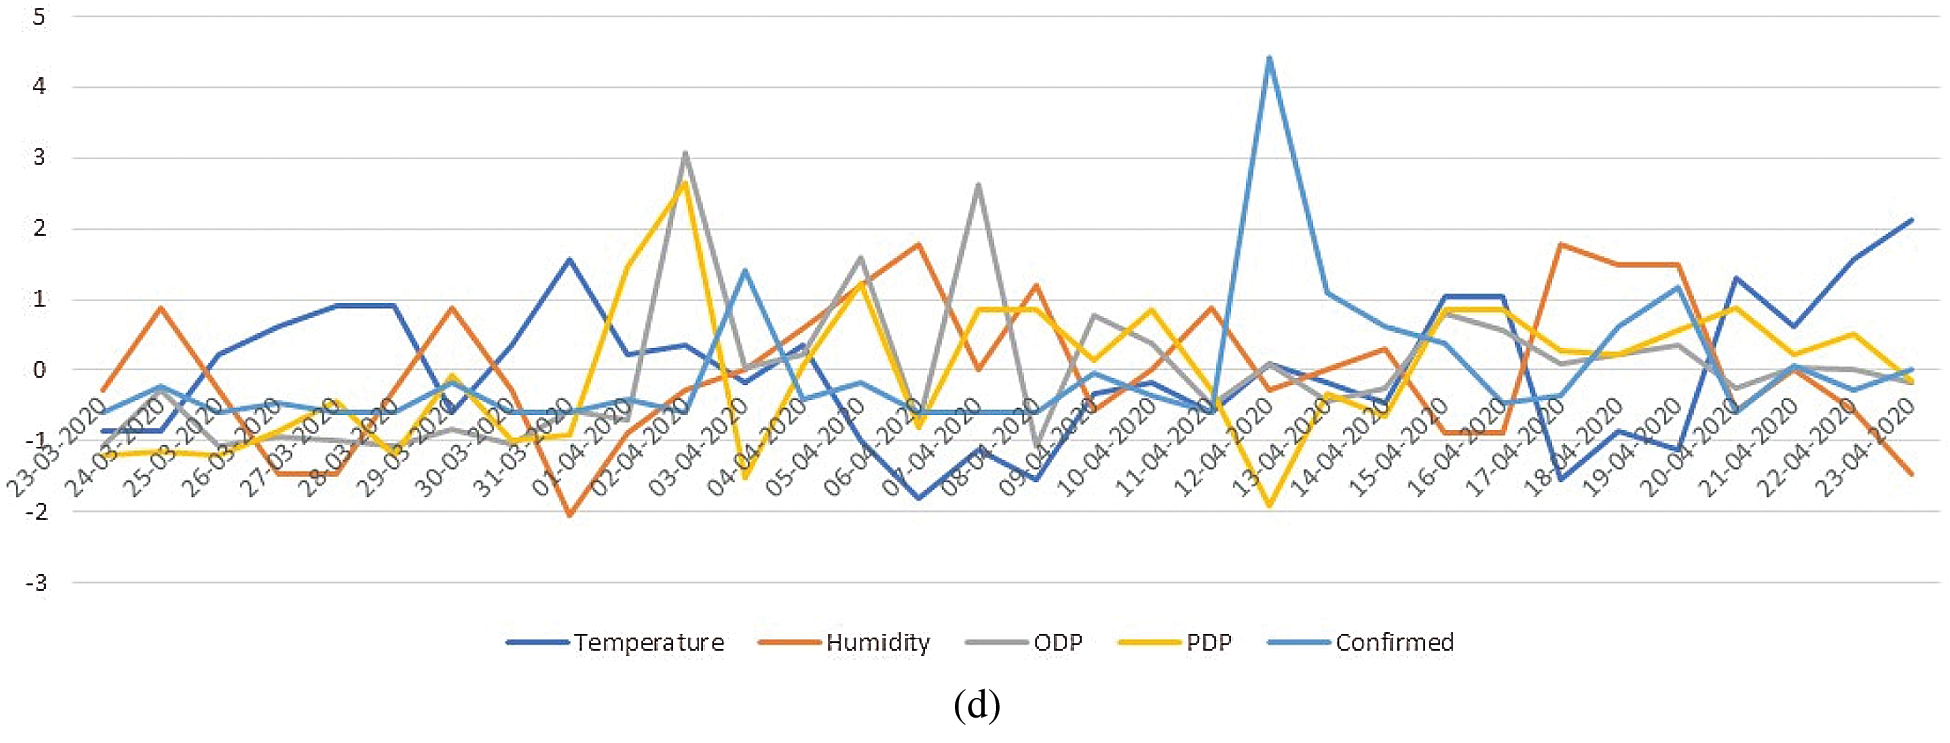
Figure 1: (a) Plots of temperature, humidity, and COVID-19 data in Bandung City; (b) Plots of temperature, humidity, and COVID-19 data in Bandung City that has been standardized; (c) Plots of temperature, humidity, and COVID-19 data in Surabaya City; (d) Plots of temperature, humidity, and COVID-19 data in Surabaya City that has been standardized
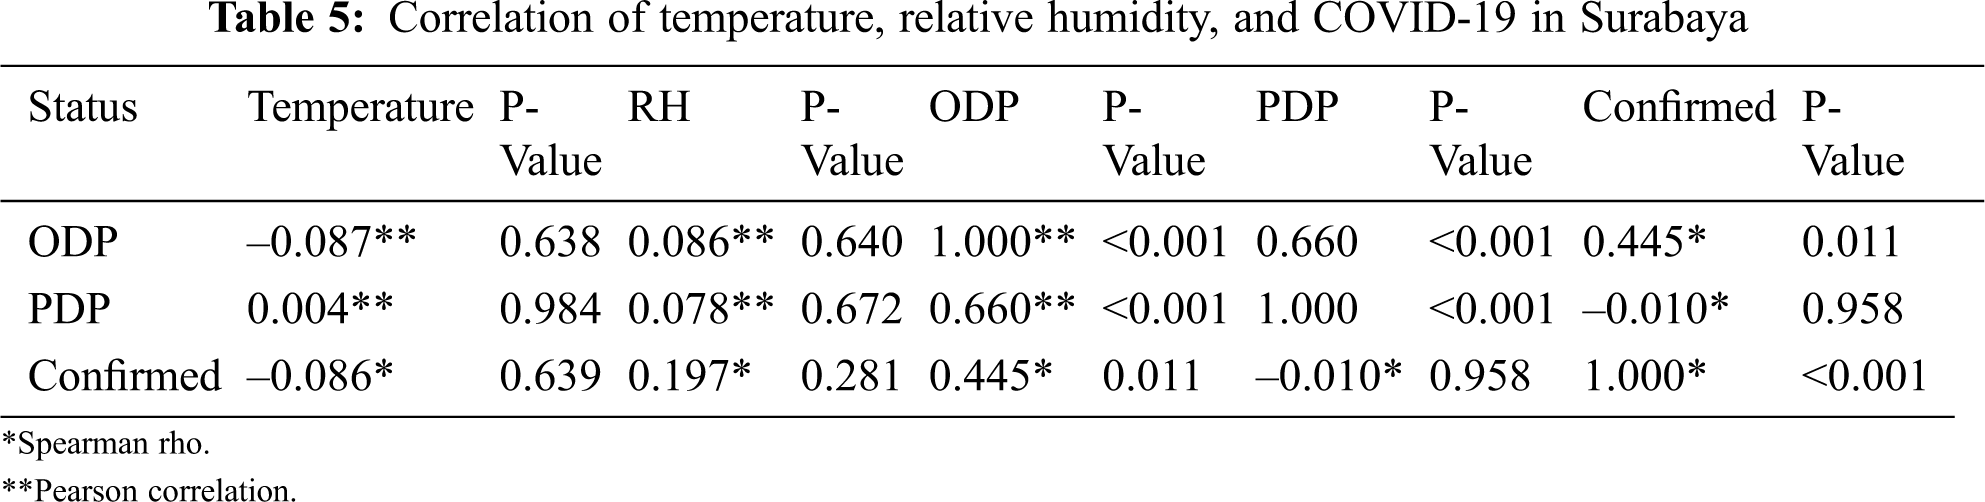
From the results of the Kolmogorov–Smirnov normality test in Figs. 2 and 3, it was found that in the city of Bandung, the data that did not meet the normality test (P-value < 0.05) were humidity, ODP, PDP, and confirmed cases, while the temperature data met the normality test (P-value > 0.05). This is inversely proportional to the city of Surabaya, whereby it was only the confirmed data that did not meet the normality assumption. The details of the correlation test are presented in Tab. 3 and the results of the correlation between temperature, humidity, and COVID-19 for the city of Bandung and the city of Surabaya are presented in Tabs. 4 and 5.
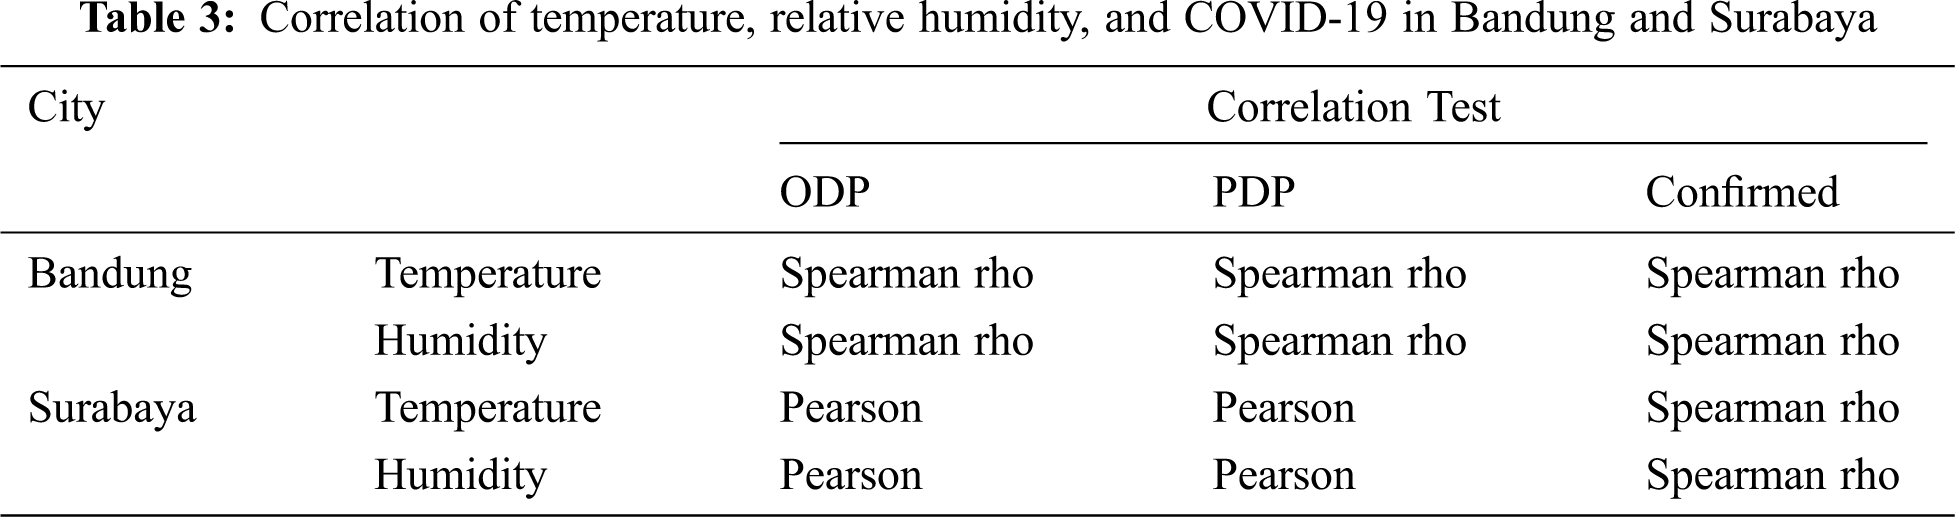
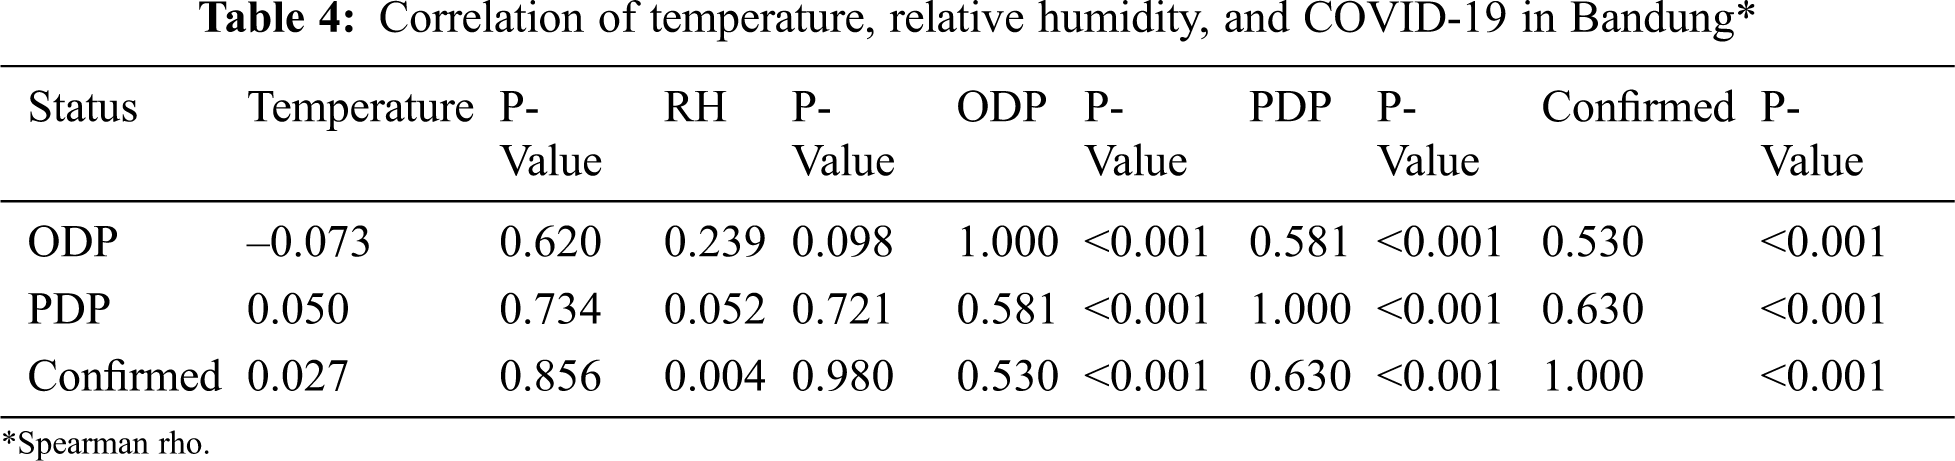
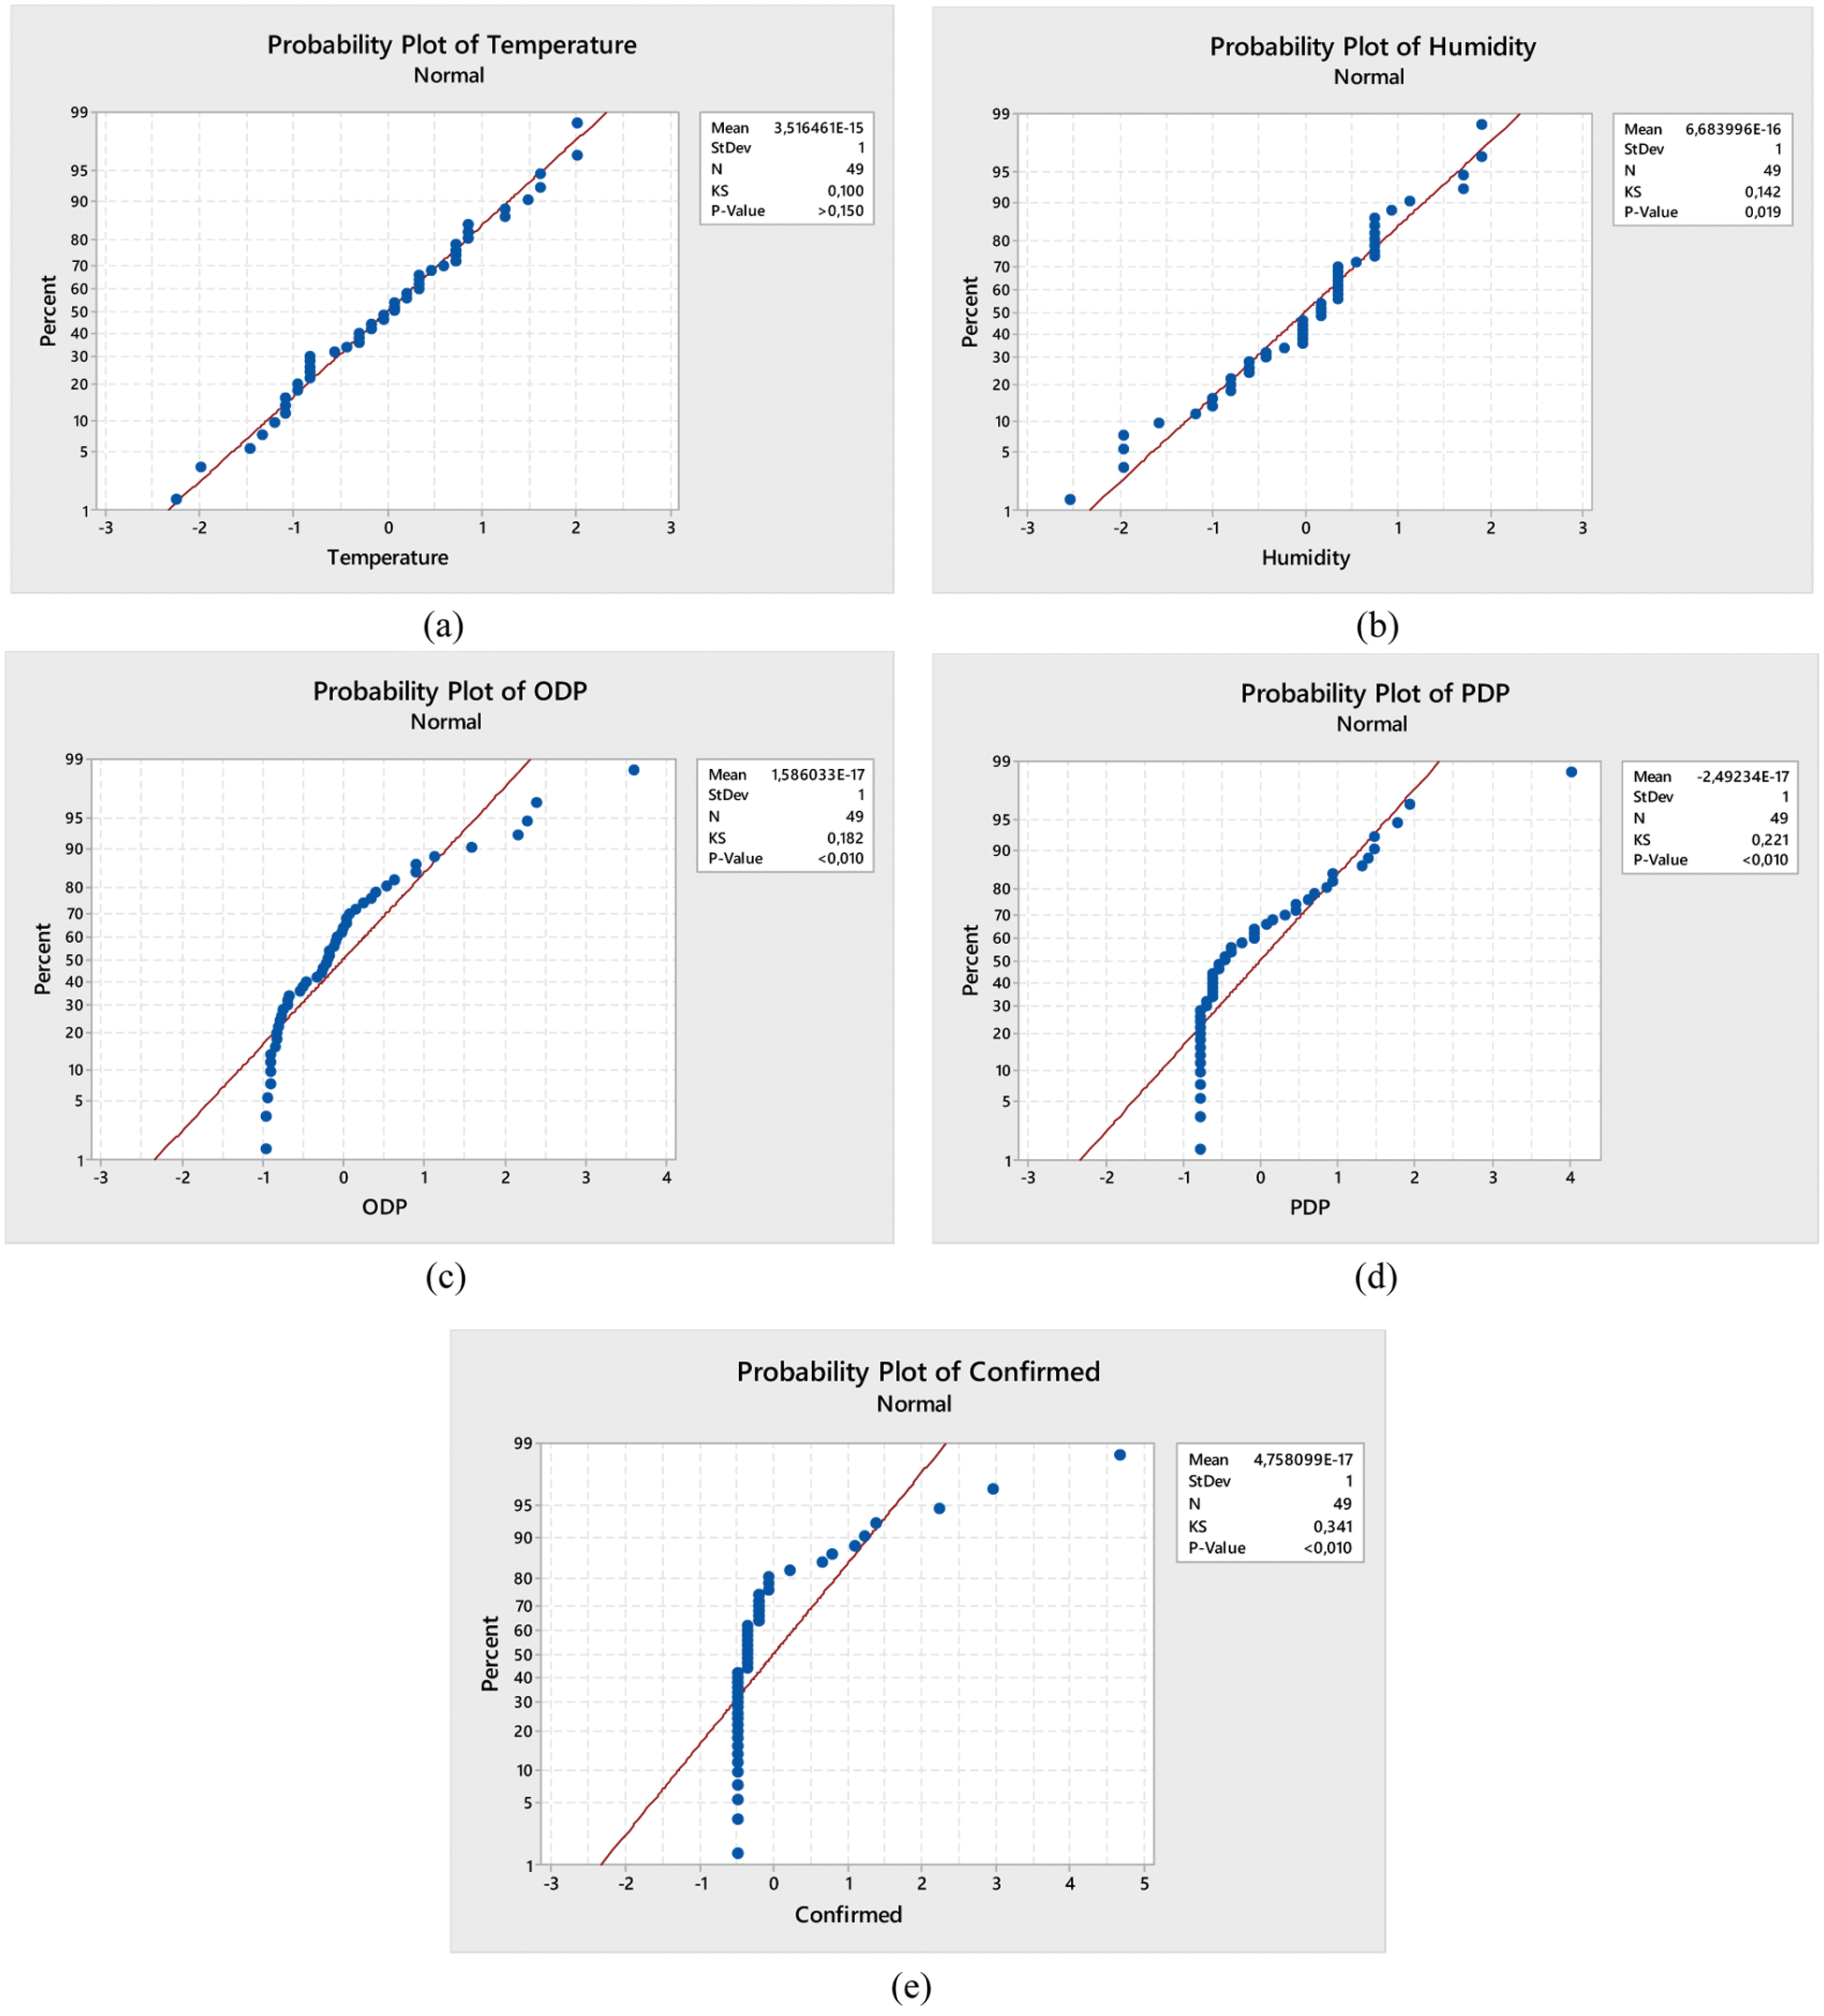
Figure 2: Kolmogorov–Smirnov normality test (a) Temperature data, (b) Humidity, (c) ODP, (d) PDP, and (e) Confirmed cases in Bandung
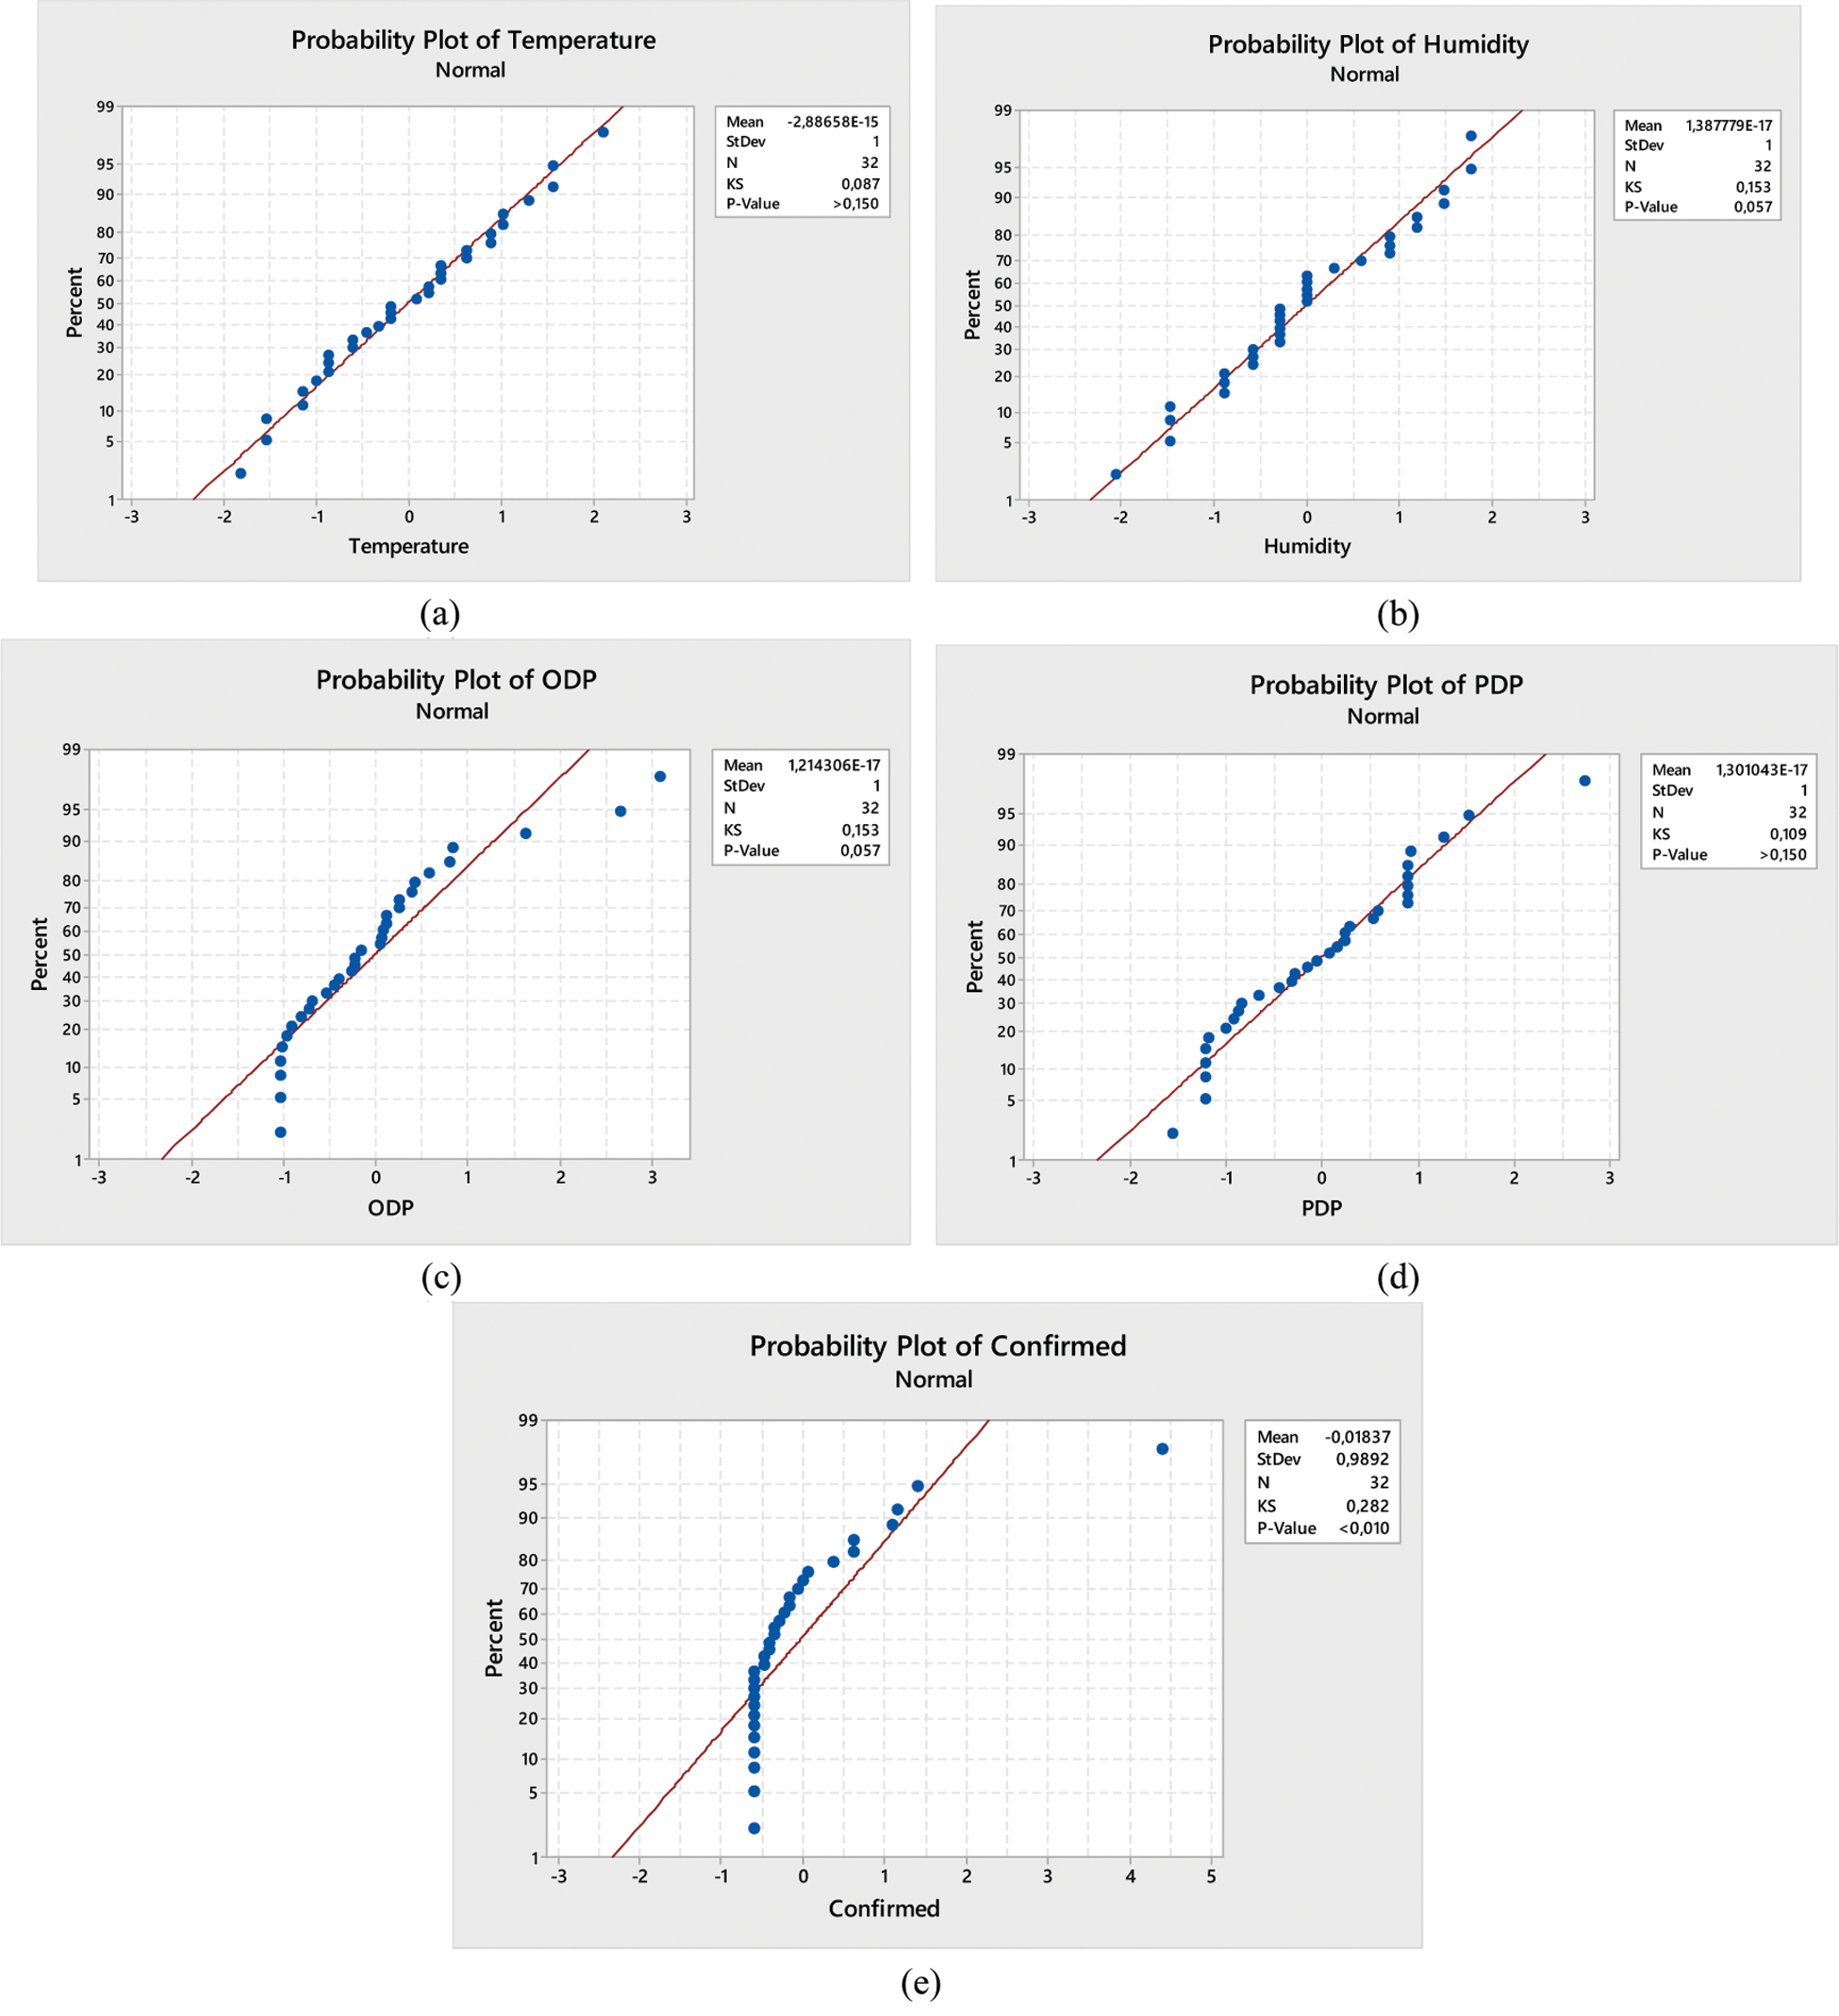
Figure 3: Kolmogorov–Smirnov normality test (a) Temperature data, (b) Humidity, (c) ODP, (d) PDP, and (e) Confirmed cases in Surabaya
Tabs. 4 and 5 show that there is no relationship between ODP, PDP, COVID-19 confirmed cases with temperature and humidity. This is seen from the P-value of each variable which is > α = 0.05. The results of this study are also in accordance with the opinion expressed by Yao et al. [20] whereby the average daily temperature was over 20°C (maximal temperature >30°C) and could not reduce the spread of COVID-19. Furthermore, Chan et al. [21] also stated that the transmission of SARS coronaviruses could be facilitated in low temperature and humidity environments in subtropical regions (such as Hong Kong). Furthermore, during spring and in air-conditioned environments, and some Asian countries located in tropical regions such as Indonesia, Thailand, or Malaysia which has high temperature and relative humidity, they do not have a large SARS outbreak in their community. Tabs. 4 and 5 also show that ODP, PDP, and Confirmed cases have positive correlations, but are included in the category of moderate (correlations around 0.4–0.6) for Bandung City. However, this is different in Surabaya City, whereby PDP and Confirmed cases had no correlation.
There was no relationship between temperature and humidity with ODP, PDP, and COVID-19 confirmed cases in the cities of Bandung and Surabaya. This is because these two cities have a comfortably wet category (RH > 70%). Temperature and humidity could have a relationship with COVID-19 when the temperature of the area is about 3°C and have a low humidity. Furthermore, the results of the study is expected to provide information to the government that weather cases in Indonesia (temperatures around 26°C to 30°C with humidity > 60%) do not affect the spread of COVID-19. It is expected that further studies would be conducted on other factors that influence the spread of COVID-19 In Indonesia. For example, how the level of alternating flow in and/or out of the population into an area. Although the results of the study showed that there was no relationship. However, it is important to be careful of high humidity in the two cities, because it would trigger asthma and allergies.
Funding Statement: This research received funding from Taif University, Researchers Supporting and Project number (TURSP-2020/207), Taif University, Taif, Saudi Arabia.
Conflicts of Interest: The authors declare that they have no conflicts of interest to report regarding the present study.
1. WHO, Situation report—77 coronavirus disease 2019 (COVID-19). USA, 2020. [Online]. Available: https://www.who.int/emergencies/diseases/novel-coronavirus-2019/situation-reports/. (accessed April 7, 2020). [Google Scholar]
2. Y. Yang, F. Peng, R. Wang, K. Guan, T. Jiang et al., “The deadly coronaviruses: The 2003 SARS pandemic and the 2020 novel coronavirus epidemic in China,” Journal of Autoimmunity, vol. 109, no. 102434, pp. 1–6, 2020. [Google Scholar]
3. The Novel Coronavirus Pneumonia Emergency Response Epidemiology Team, “The epidemiological characteristics of an outbreak of 2019 novel coronavirus diseases (COVID-19)—China, 2020,” China CDC Weekly, vol. 2, no. 8, pp. 113–122, 2020. [Google Scholar]
4. A. S. Ahmar, “Correlation between COVID-19 and weather/climate indicators: A response,” JINAV: Journal of Information and Visualization, vol. 1, no. 1, pp. 34–35, 2020. [Google Scholar]
5. M. A. El Safty and S. AlZahrani, “Topological modeling for symptom reduction of coronavirus,” Punjab University Journal of Mathematics, vol. 53, no. 3, pp. 47–59, 2021. [Google Scholar]
6. S. A. Alblowi, M. El Sayed and M. A. El Safty, “Decision making based on fuzzy soft sets and its application in COVID-19,” Intelligent Automation & Soft Computing, Accepted 2021. [Google Scholar]
7. A. S. Ahmar and E. Boj, “SutteARIMA: Short-term forecasting method, a case: COVID-19 and stock market in Spain,” Science of the Total Environment, vol. 729, no. 138883, pp. 1–6, 2020. [Google Scholar]
8. A. S. Ahmar and E. Boj, “The date predicted 200.000 cases of COVID-19 in Spain,” Journal of Applied Science, Engineering, Technology, and Education, vol. 2, no. 2, pp. 188–193, 2020. [Google Scholar]
9. A. S. Ahmar and R. Rusli, “Will COVID-19 cases in the world reach 4 million? A forecasting approach using SutteARIMA,” JOIV International Journal on Informatics Visualization, vol. 4, no. 3, pp. 159–161, 2020. [Google Scholar]
10. S. Atuahene, Y. Kong and G. Bentum-Micah, “COVID-19 pandemic, economic loses and education sector management,” Quantitative Economics and Management Studies, vol. 1, no. 2, pp. 103–109, 2020. [Google Scholar]
11. J. Xie and Y. Zhu, “Association between ambient temperature and COVID-19 infection in 122 cities from China,” Science of the Total Environment, vol. 724, no. 138201, pp. 1–5, 2020. [Google Scholar]
12. P. Shi, Y. Dong, H. Yan, X. Li, C. Zhao et al., “The impact of temperature and absolute humidity on the coronavirus disease 2019 (COVID-19) outbreak-evidence from China,” MedRxiv, 2020. [Google Scholar]
13. Y. Ma, Y. Zhao, J. Liu, X. He, B. Wang et al., “Effects of temperature variation and humidity on the death of COVID-19 in Wuhan,” China Science of the Total Environment, vol. 724, no. 138226, pp. 1–7, 2020. [Google Scholar]
14. J. Wang, K. Tang, K. Feng and W. Lv, High temperature and high humidity reduce the transmission of COVID-19. SSRN, 2020. [Online]. Available: https://papers.ssrn.com/sol3/papers.cfm?abstract_id=3557152. [Google Scholar]
15. Gugus Tugas Percepatan Penanganan COVID-19 Indonesia, Hub InaCOVID-19, 2020. [Online]. Available: https://www.covid19.go.id/situasi-virus-corona/. (Accessed April 19, 2020). [Google Scholar]
16. BMKG, Prakiraan Cuaca Makassar Provinsi Sulawesi Selatan, 2020. [Online]. Available: https://www.bmkg.go.id/cuaca/prakiraan-cuaca.bmkg?Kota=Makassar&AreaID=501495&Prov=35. (accessed April 7, 2020). [Google Scholar]
17. F. Isbaniah, D. Kusumowardhani, P. A. Sitompul, A. Susilo, R. Wihastuti et al., “Pedoman Pencegahan dan Pengendalian Coronavirus Disease (COVID-19),” in Direktorat Jenderal Pencegahan dan Pengendalian Penyakit (P2P) Kementerian Kesehatan RI. Jakarta, Indonesia, pp. 13–44, 2020, Available: https://infeksiemerging.kemkes.go.id/document/download/KpvOAX9r3j [Google Scholar]
18. F. Landwehr, Humidity at home: What you need to know this, 2017. [Online]. Available: https://www.ac-heatingconnect.com/homeowners/cold-weather-home-humidity/. (accessed April 24, 2020). [Google Scholar]
19. National Asthma Council Australia, Indoor humidity level, 2015. [Online]. Available: https://www.sensitivechoice.com/indoor-humidity/. (accessed April 24, 2020). [Google Scholar]
20. Y. Yao, J. Pan, Z. Liu, X. Meng, W. Wang et al., “No association of COVID-19 transmission with temperature or UV radiation in Chinese cities,” European Respiratory Journal, vol. 55, no. 5, pp. 1–3, 2020. [Google Scholar]
21. K. H. Chan, J. M. Peiris, S. Y. Lam, L. L. M. Poon, K. Y. Yuen et al., “The effects of temperature and relative humidity on the viability of the SARS coronavirus,” Advances in Virology, vol. 2011, no. 734690, pp. 1–7, 2011. [Google Scholar]
 | This work is licensed under a Creative Commons Attribution 4.0 International License, which permits unrestricted use, distribution, and reproduction in any medium, provided the original work is properly cited. |