DOI:10.32604/iasc.2021.017989
| Intelligent Automation & Soft Computing DOI:10.32604/iasc.2021.017989 | |
| Article |
A Comparative Analysis of Machine Learning Algorithms to Predict Liver Disease
1Khulna University of Engineering and Technology, Khulna-9203, Bangladesh
2North Western University, Khulna, Bangladesh
3Computer Science and Engineering Discipline, Khulna University, Khulna-9208, Bangladesh
4Department of Information Technology, College of Computers and Information Technology, Taif University, Taif, 21944, Saudi Arabia
5Department of Computer Science, College of Computers and Information Technology, Taif University, Taif, 21944, Saudi Arabia
*Corresponding Author: Mehedi Masud. Email: mmasud@tu.edu.sa
Received: 20 February 2021; Accepted: 02 May 2021
Abstract: The liver is considered an essential organ in the human body. Liver disorders have risen globally at an unprecedented pace due to unhealthy lifestyles and excessive alcohol consumption. Chronic liver disease is one of the principal causes of death affecting large portions of the global population. An accumulation of liver-damaging factors deteriorates this condition. Obesity, an undiagnosed hepatitis infection, alcohol abuse, coughing or vomiting blood, kidney or hepatic failure, jaundice, liver encephalopathy, and many more disorders are responsible for it. Thus, immediate intervention is needed to diagnose the ailment before it is too late. Therefore, this work aims to evaluate several machine learning algorithm outputs, namely logistic regression, random forest, XGBoost, support vector machine (SVM), AdaBoost, K-NN, and decision tree for predicting and diagnosing chronic liver disease. The classification algorithms are evaluated based on various measurement criteria, such as accuracy, precision, recall, F1 score, an area under the curve (AUC), and specificity. Among the algorithms, the random forest algorithm showed better performance in liver disease prediction with an accuracy of 83.70%. Furthermore, the random forest algorithm also showed better precision, F1, recall, and AUC metrics. Hence, random forest is considered the best algorithm for early liver disease prediction.
Keywords: Machine learning; liver disease; prediction; classification; logistic regression; random forest
The liver assumes a central part in the coagulation cycle and the upkeep of hemostasis [1]. It is considered one of the significant organs in the human body and the major vital organ with internal functions, such as creating compounds, handling waste items, and eliminating destroyed tissues or cells. The liver presents with different illnesses that inevitably can cause it harm and other sorts of related illnesses. Approximately 35 million individuals died because of chronic infections, as indicated by the World Gastroenterology Organization (WGO) and the World Health Organization (WHO), and liver disorder is one of the illnesses mentioned [2]. Because of high alcohol consumption, breathing of harmful gases, and ingesting spoiled food, pickles, and medications, patients with liver sickness have persistently worsened. An early analysis of liver issues may raise a patient’s recovery rate. Liver ailments can be analyzed by examining the enzyme levels in the blood [3]. Presently, the prevalence of alcoholic liver disease (ALD) has been growing. In some studies, age-standardized mortality associated with HCV is shown to have risen from 7.17 per 100,000 people in 2007 to 8.14 per 100,000 people in 2013, accompanied by a stamped decline when patients started direct-acting antiviral therapy treatments. Here, HCV represents the hepatitis C infection. Even though HCV contamination has improved, the appearance of ALD has increased, specifically in non-Hispanic Asians. There was a higher death rate for hepatitis B infection contamination among non-Hispanic Asians.
Minorities in the United States have higher fatalities related to ongoing liver ailments [4]. Sometimes, liver disease is challenging to diagnose in its early stages. We cannot discover the disease until the liver function is partially damaged. Early diagnosis can be life-saving [5]. Currently, the examination of predicting liver illness has been broadly contemplated. Several studies on artificial immune and genetic algorithms have been reported for liver disease diagnosis [6]. Different classifiers with different data sets indicate differences in diagnoses [7].
Globally, liver disease has become an alarming and life-threatening issue. Machine learning algorithms can early help in early diagnosis to reduce risk. Analyzing the previous studies showed low performance. Hence this research aims to achieve more satisfactory performance.
This research aims to determine the accuracy of several popular machine algorithms—XGBoost, SVM, logistic regression, random forest, AdaBoost, Decision Tree, and K-NN—to predict liver diseases by analyzing different data sets and comparing their performances. The main contributions are to find out (a) the correlation matrix with the outcome, (b) the model performance of the lowest split to the higher split of the training set, and (c) the best split of the training set.
The paper is organized as follows: Section 2 discusses related works, Section 3 presents the methodology of the research, Section 4 demonstrates the outcomes of different machine learning algorithms, and finally, the paper concluded in Section 5.
Several machine learning models have been used for predicting liver illness. The goal is to research the information mining calculations to predict liver infections on imbalanced information through periodic testing. Each of the algorithms has been investigated based on different metrics such as accuracy and the ROC index. K-Nearest Neighbor outflanked other calculations. Logistic regression, Auto Neural, and random forest achieved well with the accuracy. A system was proposed to assess the efficiency and accuracy of the used models to predict chronic liver disease (CLD). The study focused on structured data. XGBoost Classifier, random forest, decision tree, and logistic regression were used for the best possible output classification and prediction. The accuracies of logistic regression and XGBoost Classifier were quite satisfactory. For the random forest model, the accuracy was approximately 74.57% [8]. Four meta-learning algorithms were utilized to arrange the information for liver sickness. For clinical assessment, diverse information mining strategies were available. In that examination, meta-learning algorithms were investigated based on correct classification. For the AdaBoost algorithm, the correct classification rate was 70.3259%. Logit boost and bagging both offered a 70.4974% correct classification rate [9]. Several data sets were used for constructing classification models for the prediction of liver illness. Data mining classification algorithms were applied to the data sets, and the efficiency of all classifiers was balanced in terms of precision, accuracy, and recall. The AP data set showed promising performance with the support vector machine (SVM), with an accuracy of 71.24% [10], distinguishing the manifestation of liver infection and power of liver harm when combined with appropriate imaging modalities, such as ultrasound, CT scan, or MRI check to utilize decision tree, random forest, and support vector machine algorithms. They utilized a current world data set and binary classification, which is fundamentally classifying the elements of a given set into two groups—patients suffering from liver sickness or not. They also used an ensemble-based approach to determine the best forecast accuracy [11]. The observational measurable investigation to analyze the liver disease by applied machine learning models for expectations of liver sicknesses used 1,640 instances. The data set contains individual and clinical data. This study utilized machine learning models: K-NN, SVM, random forest, naïve Bayes, and AdaBoost. The K-NN and AdaBoost models perform exceptionally, compared to other models, with 100% accuracy for predicting LDs [12]. A new classifier was proposed by extending the classifiers with genetic algorithms. Several classification models and visualization techniques were compared and used to predict liver disease and feature selection. The classifiers’ performances were measured based on accuracies, recall precisions, f-measures, and time complexities. Among classifiers, logistic regression showed an accuracy of 76%. It improves the accuracy of classification from experiments and comparative studies, contributes to a reduction in classification time, and helps predict the disease. To assess several machine learning algorithms’ performances and decrease the cost of protracted liver disease, this study used algorithms, such as logistic regression, K-NN, decision tree, random forest, and SVM. The algorithms were analyzed in the accuracy, precision, recall, F1 score, and specificity. The accuracies were 75%, 74%, 69%, 64%, and 62% for logistic regression, random forest, decision tree, SVM, and K-NN, respectively. Among those algorithms, logistic regression showed the highest accuracy.
The collected data set included 583 instances with 10 attributes and one outcome. Data sets were trained with a division of 10 increments from 50% to 90%. Instances and data set features, data set training, feature scaling, and application of the machine learning algorithms are explained in this section. The operational flow of this study is shown in Fig. 1.
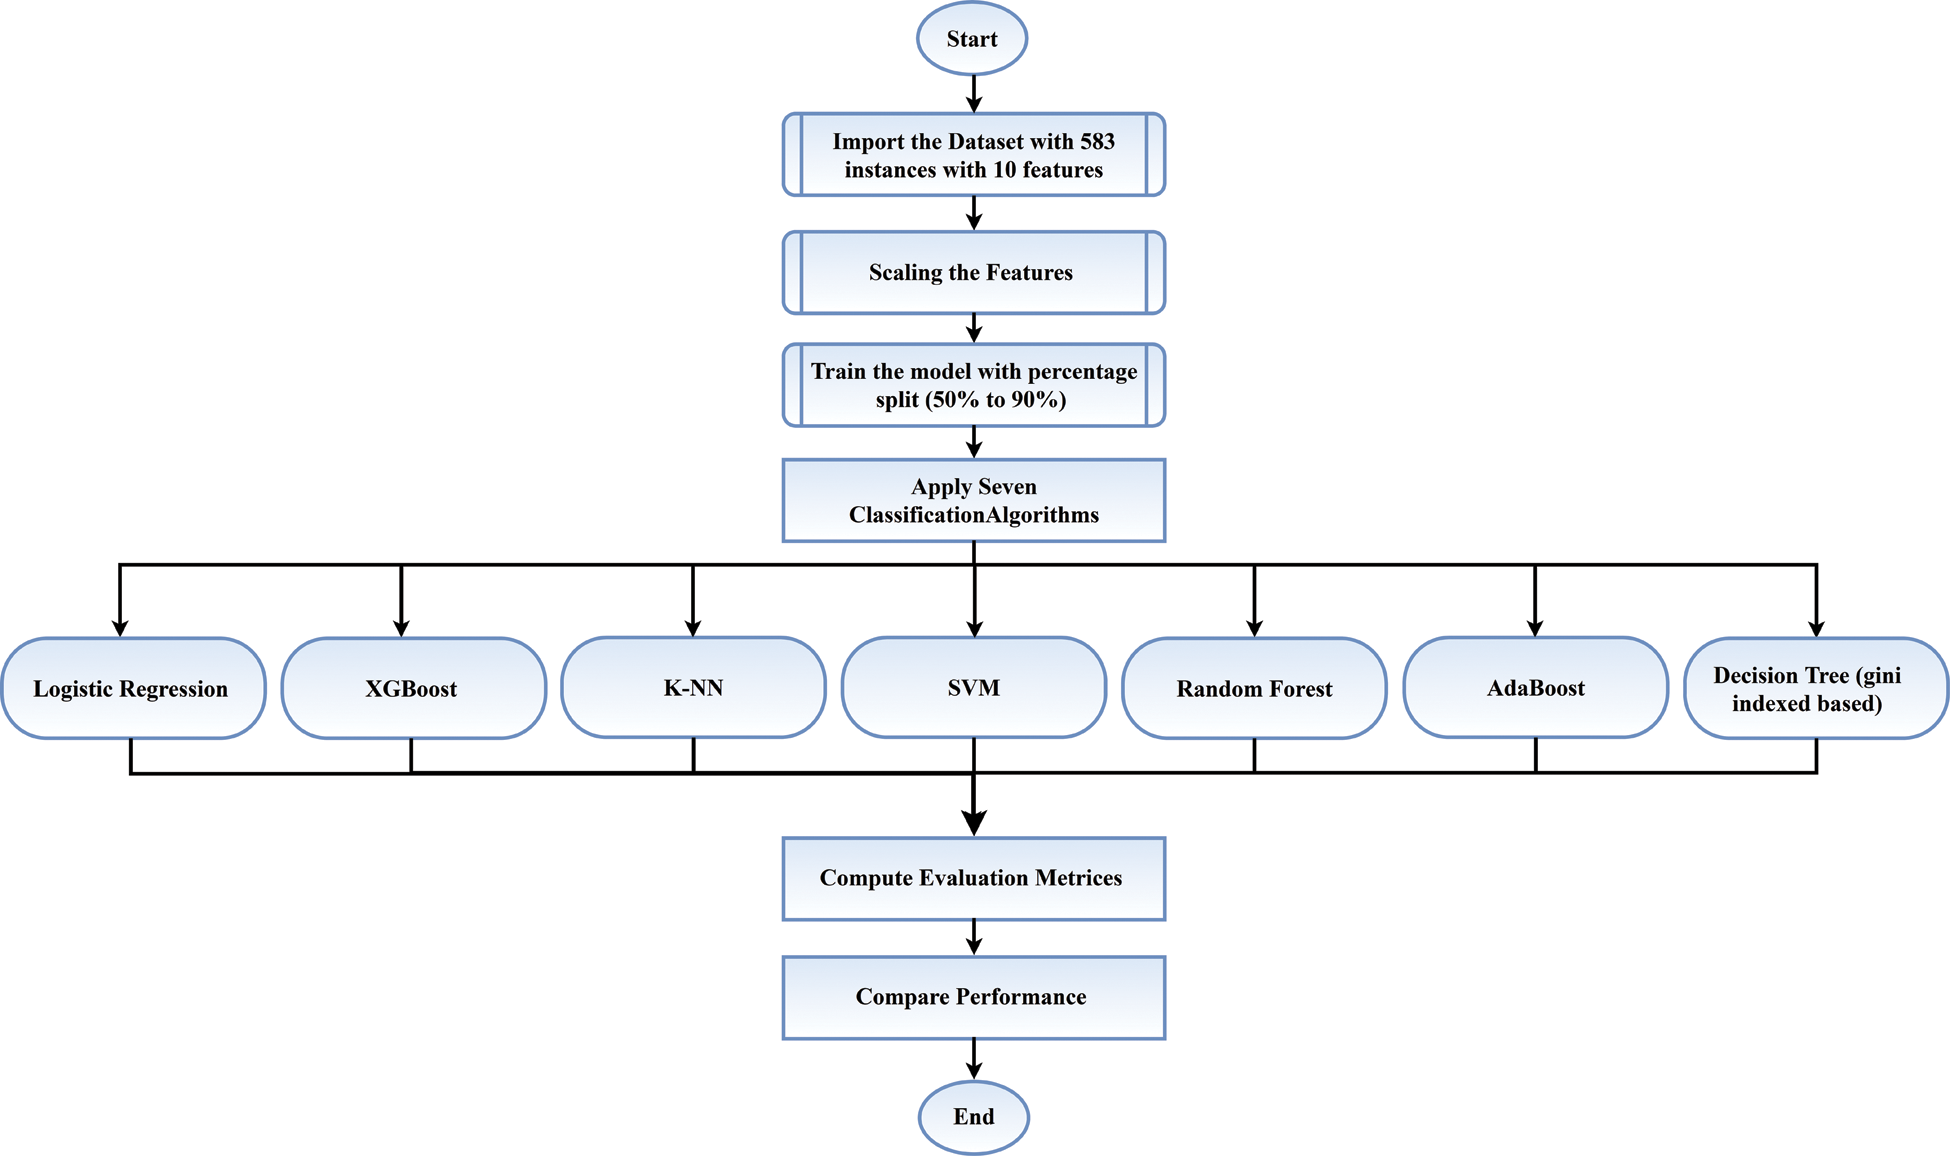
Figure 1: Flow chart of this study
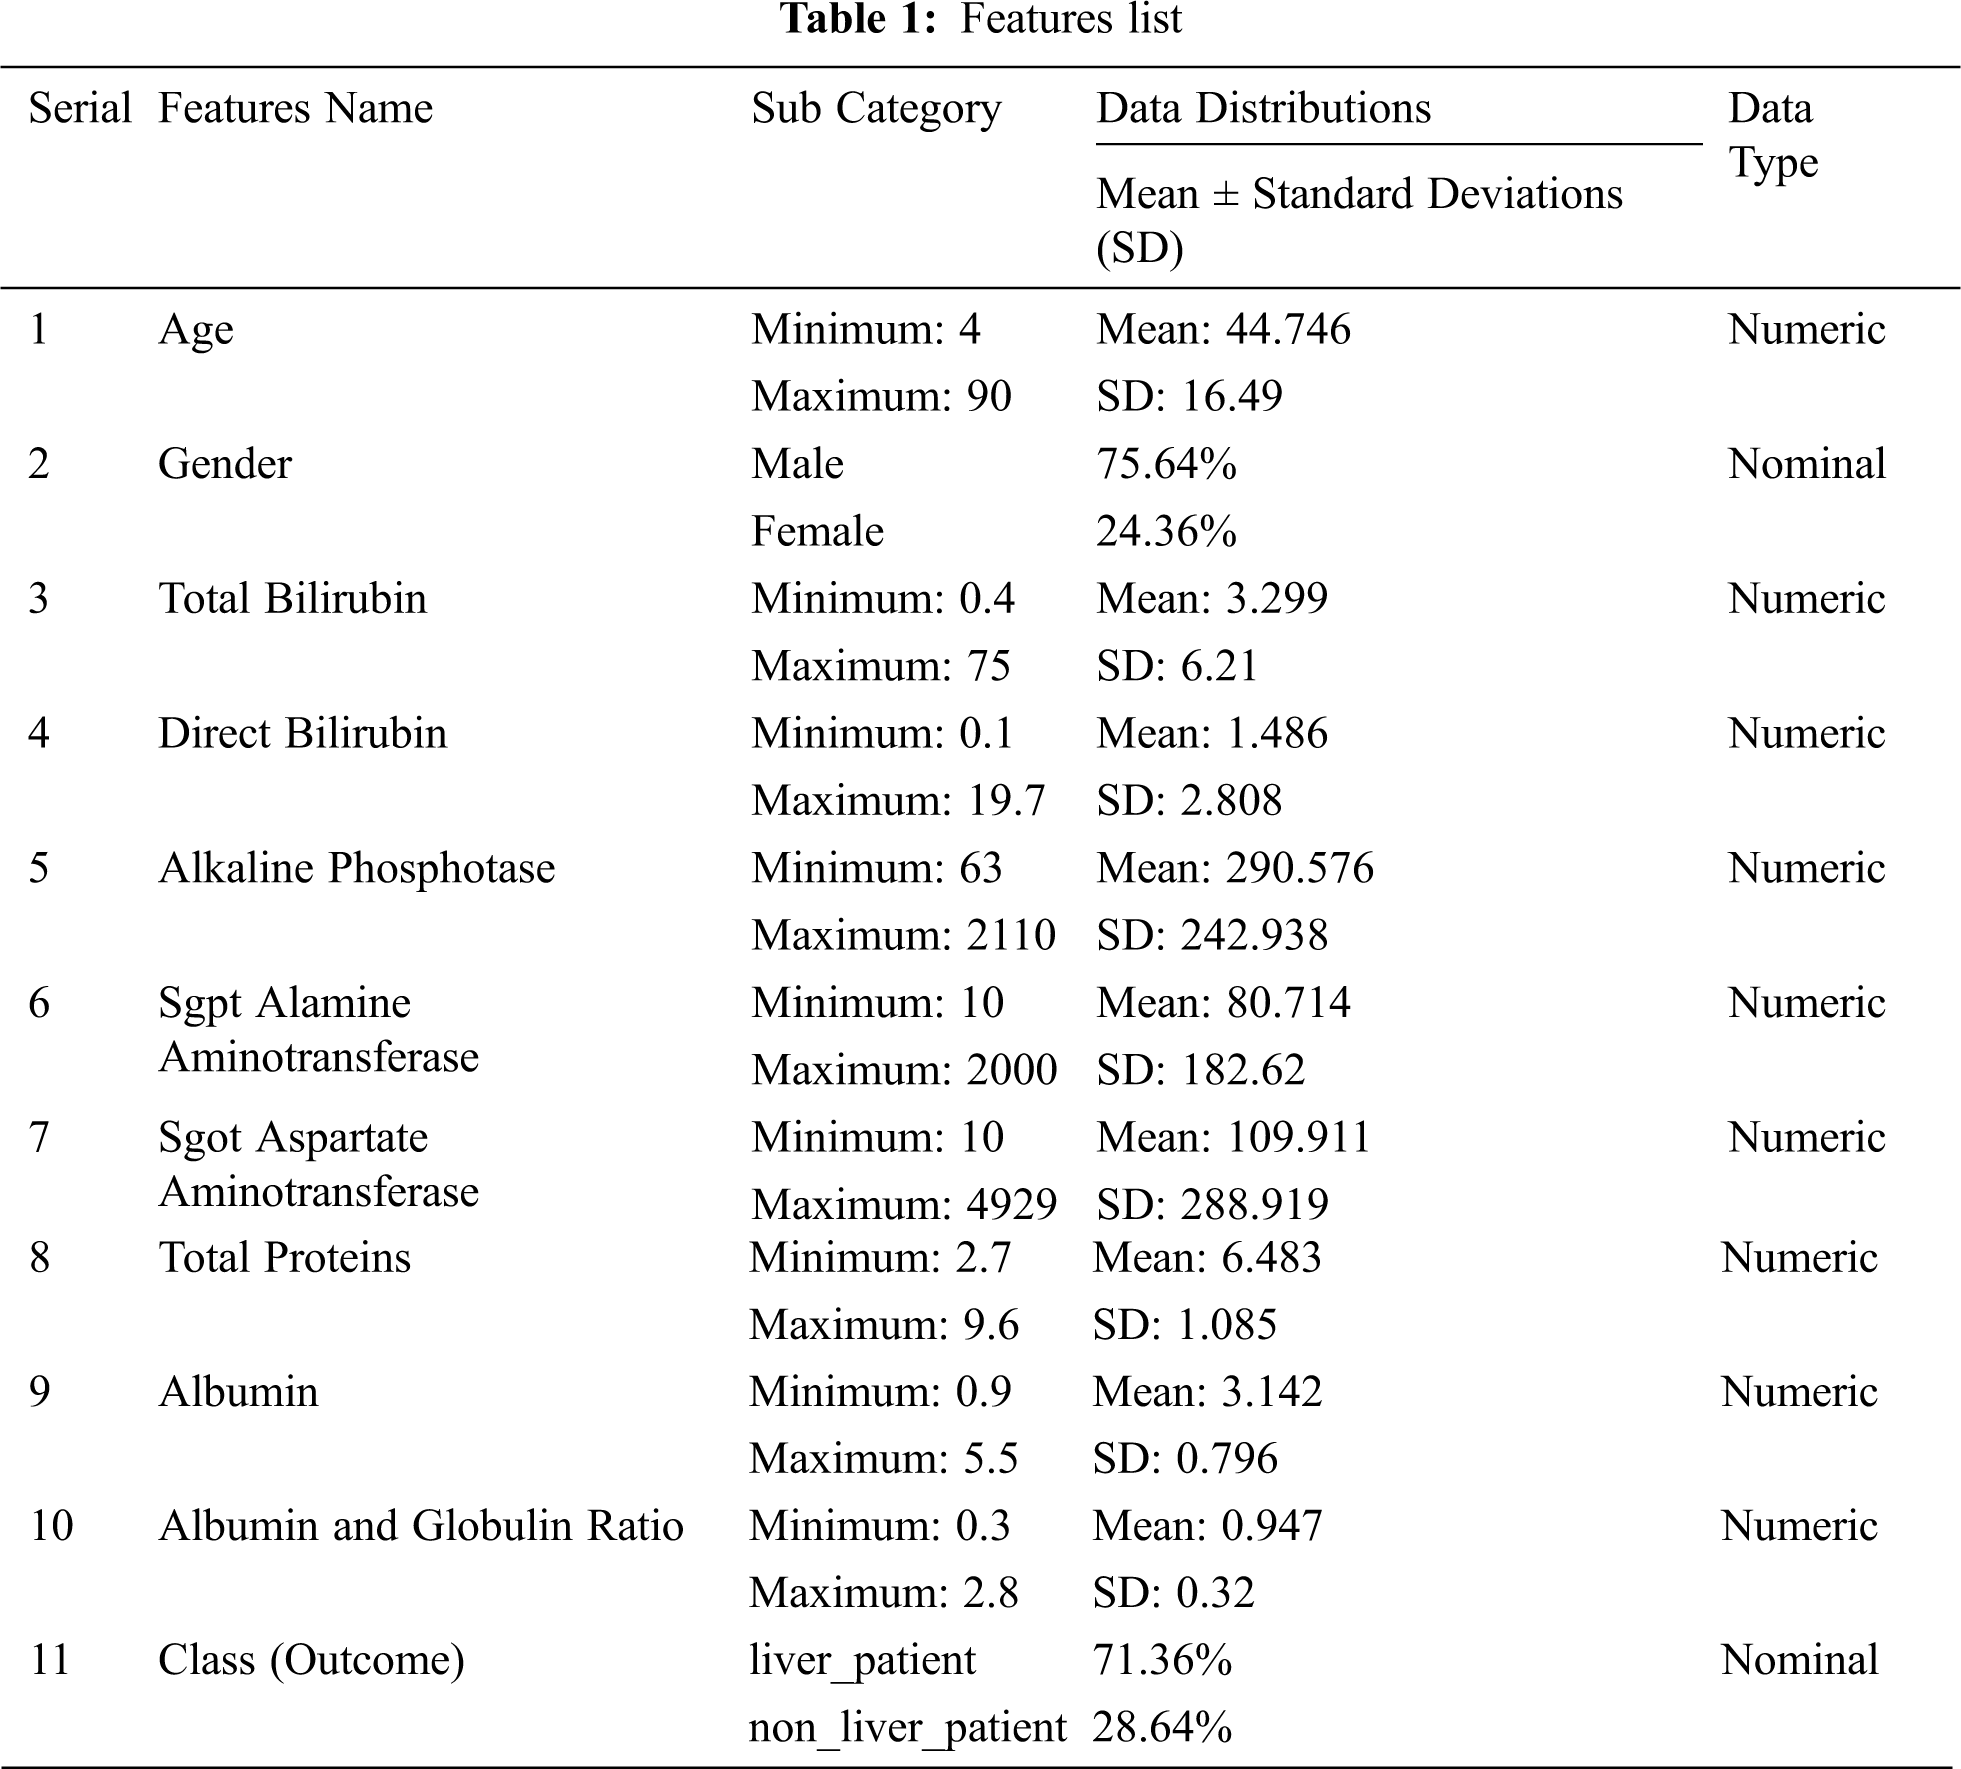
We gathered CLD information From the UCI Machine Learning Repository. The data set contains 583 instances and 10 attributes. Tab. 1 presents the features or attributes, with mean and standard deviations. Approximately 71.36% (416) of the data set is affected by liver disease. Out of these 583 people, 441 are male.
In machine learning, feature scaling is considered an essential step during preprocessing information before creating an AI model [13].
For repairing all the highlights of the appearing data set in Fig. 1, 10-increment data sets were trained with train sizes of 50% to 90%.
3.4 Application of the Machine Learning Algorithms
This study applied logistic regression, K-NN, SVM, decision tree, random forest, XGBoost, and AdaBoost algorithms. The algorithms are briefly described as follows.
3.4.1 Logistic Regression (LR)
Logistic regression (LR) is generally a linear model that is used for predicting binary variables. LR technique is used for classifying a new observation of an unknown group. LR is a unique system for gathering data into two random and exhaustive data collections [14].
3.4.2 K-Nearest Neighbors (K-NN)
K-NN is an elementary classification algorithm of machine learning. It gives an example of the most preferred class among the neighboring K. K is a constraint for changing the classification algorithms [15]. In this study, we used 47 K neighbors and uniformly used weights. Uniform is a function where all kinds of neighbored points are appropriately weighted. We also used leaf size 30. The leaf size affects the speed of the implementation and the required memory. We used p = 2 and metric = ‘Minkowski’. Here, “p” indicates the power parameter, and Minkowski is the default matrix.
3.4.3 Support Vector Machine (SVM)
SVM is a supervised measure of learning that can be used for classification and relapse problems, but it is commonly used for characterization problems. SVM functions work admirably and can grasp linear and nonlinear problems [16]. This study used an “RBF” kernel, which specifies the arrays or shapes used in the algorithm.
A decision tree (DT) is a data excavation model to tackle alliancing and categorizing issues. The DT is generally a prime recursive block to cohere a continuous reckoning implementation. DT includes nodes (parent) and leaves (child) [17]. This study used three max-leaf nodes and three criteria for DTs, for which the random state was 0. The random state controls the estimator’s randomness, and 0 means that the randomness was false in this case.
Random forest (RF) is a versatile, convenient model that exhibits different outputs. RF obstructs the overfitting problem. It is one of the main versions of ensemble learning. Ensemble learning is defined by using the same algorithm multiple times or using numerous algorithms [18]. In this study, we used 166 estimators. Estimators refer to existing tree numbers in a forest. We used the “entropy” criterion, which is a function for measuring the quality. Here, the random state was zero. A random state is used for controlling the randomness of the samples when building trees.
3.4.6 Extreme Gradient Boosting (XGBoost)
XGBoost is a supervised learning algorithm that implements a method to generate accurate models called boosting. Supervised learning applies from a series of notable training examples to the task of inferencing a predictive model [19]. Here, we used 40 estimators. Estimators are the number of performing boosting stages. The subsample used here was 0.7, and the depth was 12. Subsample refers to the fraction of samples to fit the base learners.
AdaBoost is short for adaptive boosting. Fundamentally, AdaBoosting is a genuinely efficient prediction of first boosting generated for a double order. For intellect boosting, it is the superior starting point. With short DTs, AdaBoost is used. In addition, the primary tree is created, using the tree display on each preparation event. It is used to weigh how much the following tree takes into account [20]. In this study, we used 30 estimators, and the learning rate was 1. Estimator means the overall collection of sub-estimators.
Accuracy is the measurement used for classification evaluation. Accuracy is usually the portion of forecasting authentic prediction.
Precision is the dimension of positive predictions that define good predictions.
The recall is the component of the accumulated number of actual examples that have already been retrieved.
The F1 score is an acceptable measure to take advantage of the event. An analogy between precision and recall is found for observing the F1 score, and there remains a jagged class propagation.
The greater the ROC of the AUC, the stronger the portrayal of the model for separating the positive from the negative classes.
Fig. 2 shows the results and accuracies of the implemented machine learning algorithms. Fig. 2 represents the average accuracy of different trained data sets. With an increment, we trained several data sets for the prediction of liver disease. We trained the models with 50% to 90% of data sets, and from the trained data sets, the overall accuracy is obtained. RF shows the best performance, with an average accuracy of 77.21%. Fig. 3 shows the mutation of trained data with accuracy. We trained different data with different size ranges of 50% to 90%. Fig. 3 shows that, at the 80% range of data training, the peak value is obtained for all the applied algorithms. Only AdaBoost shows increased accuracy with the increasing trained size.
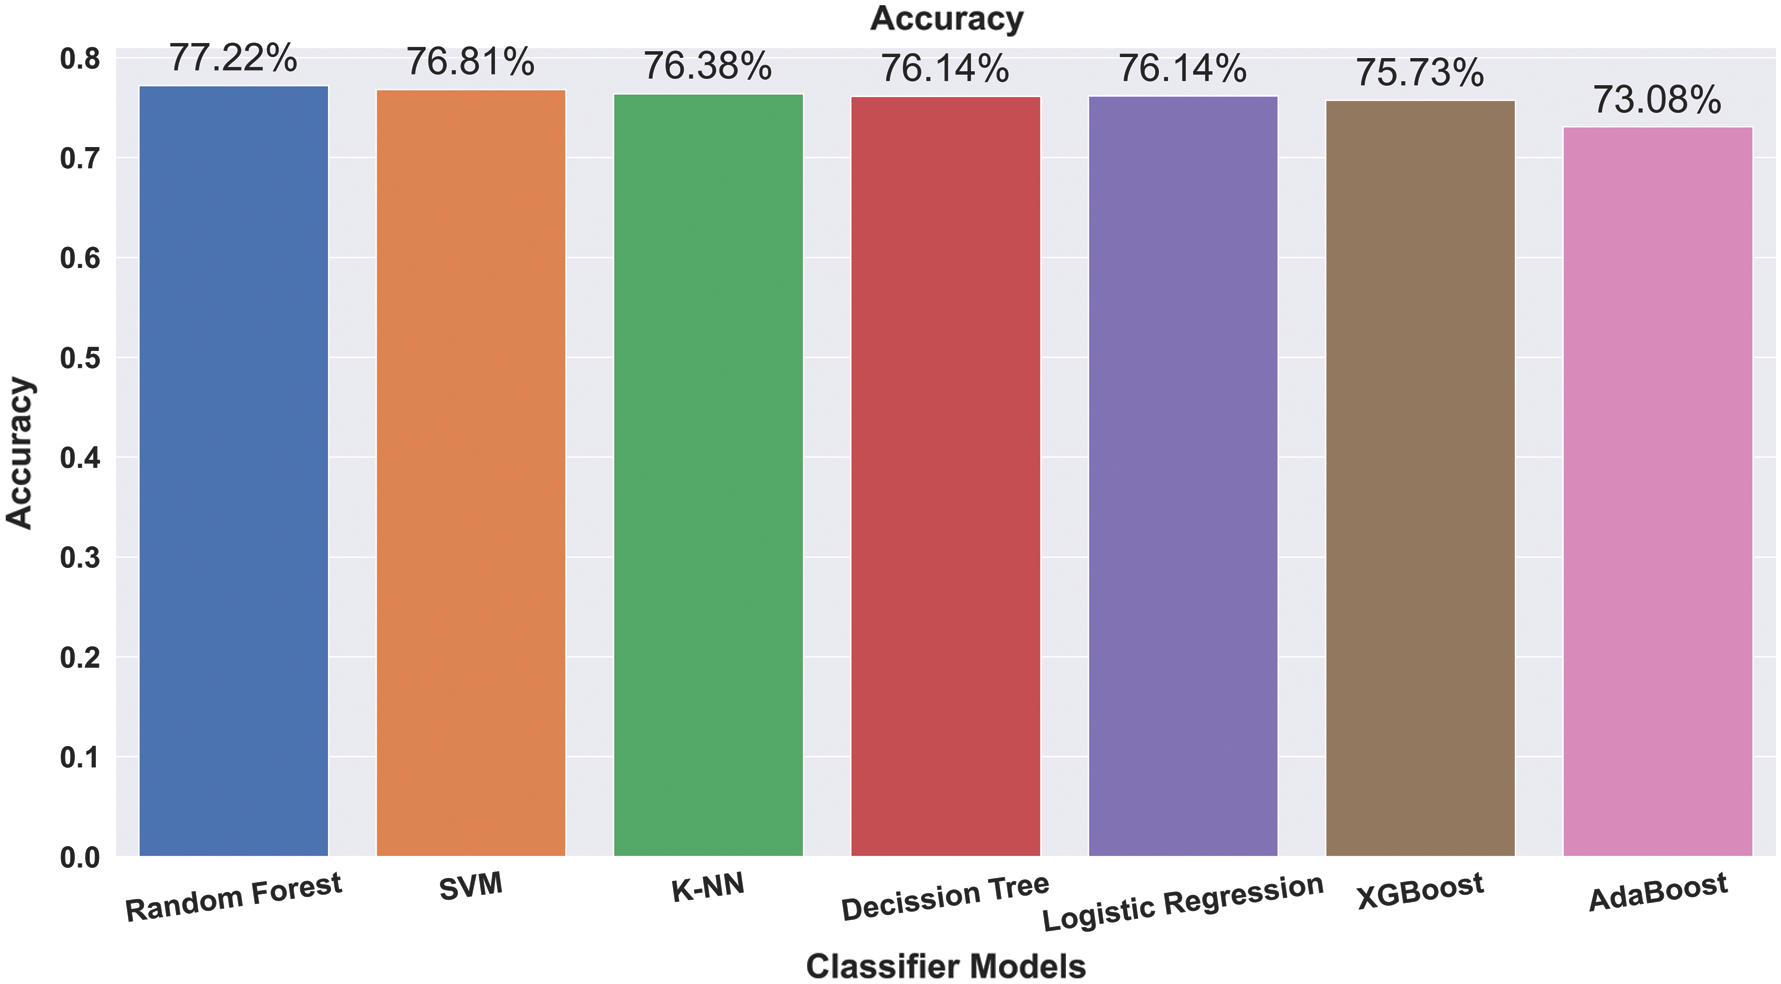
Figure 2: Average accuracy of applied algorithms in various train sizes
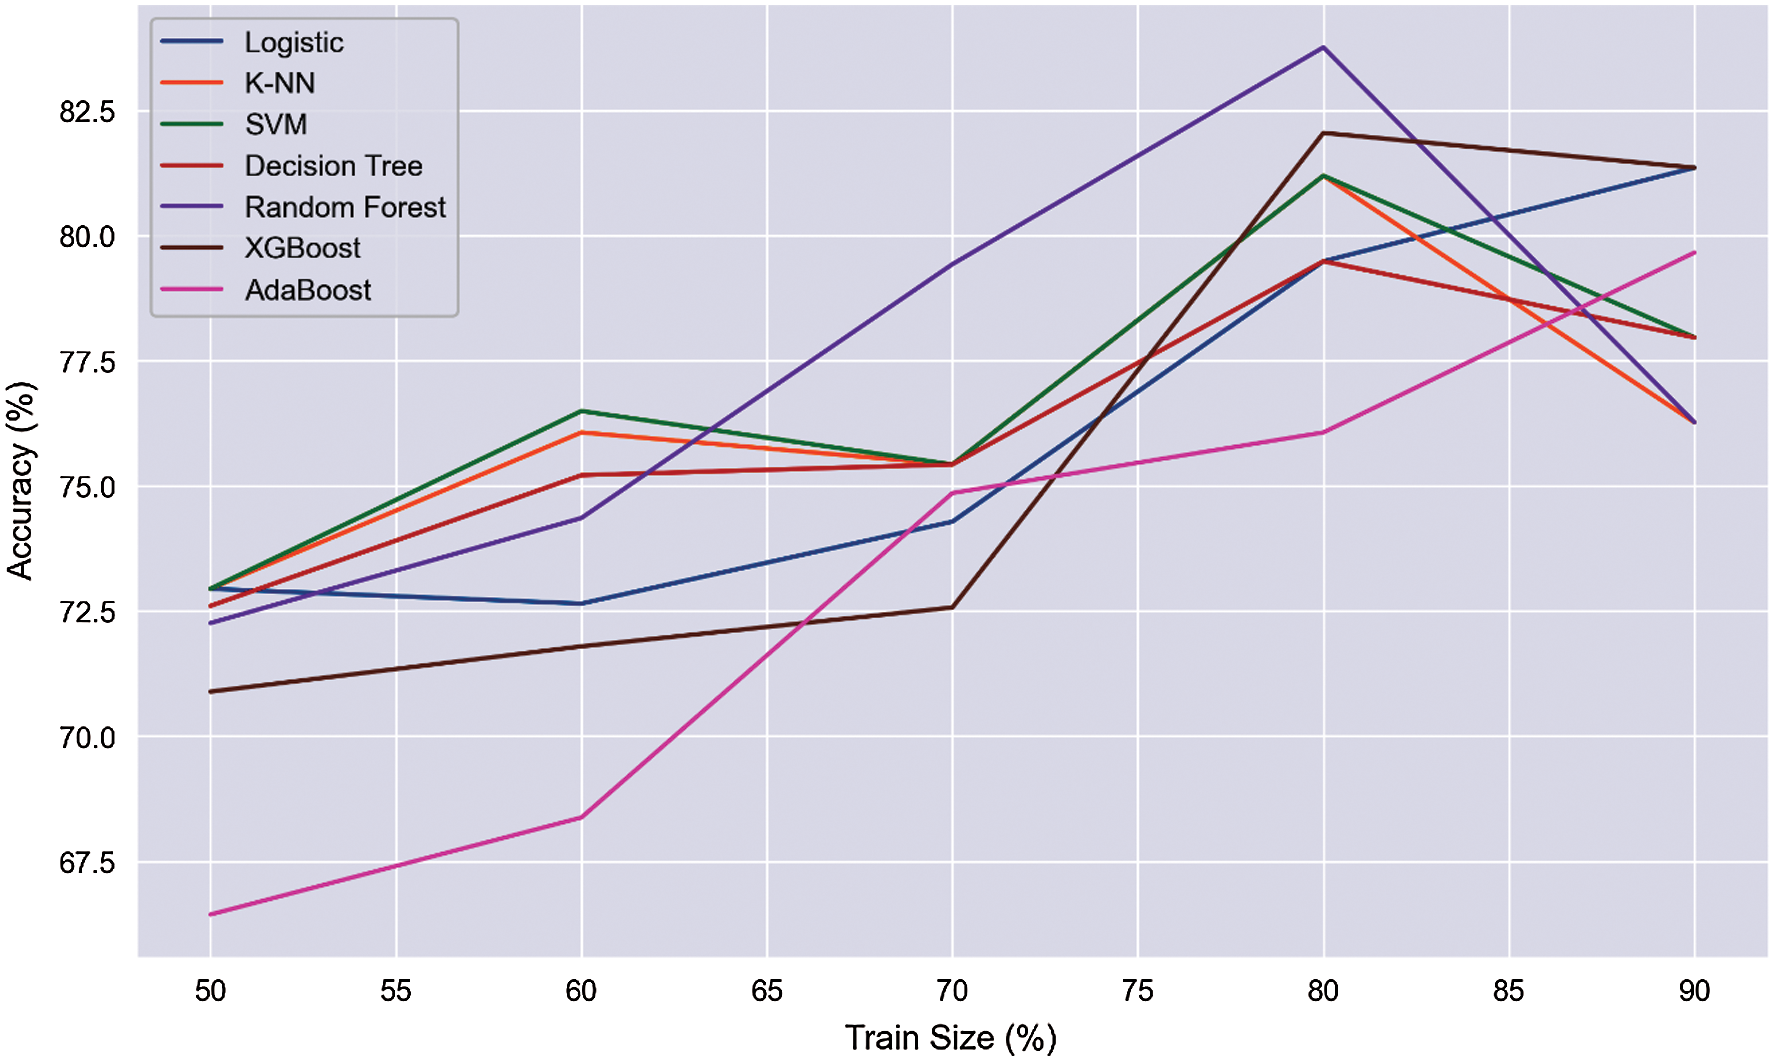
Figure 3: Train size (%) vs. accuracy (%)
In contrast, the remaining algorithms give paramount performances and peak accuracy values in the trained size realm at 80%. We considered 80% train size as the ideal size range for predicting the ailment and obtained the accuracy, precision, recall, and F1 score at this size range for showing the maximum peak value. In a 50% split, there is a higher chance of underfitting. On the other hand, 90% split overfitting can occur. Applying the 80% split, this scenario can be overcome. Several researchers used 80% split to train their models [21,22].
From Tab. 2, we obtain the accuracy, precision, recall, and F1 score for those proposed algorithms. The accuracy, precision, recall, and F1 score were 79.49%, 82.90%, 93.50%, and 87.80%, respectively, in the LR algorithm. K-NN showed an accuracy, precision, recall, and F1 score of 81.20%, 82.60%, 96.80%, and 89.10%, respectively. SVM had an accuracy, precision, recall, and F1 score of 81.20%, 81.40%, 98.90%, and 89.30%, respectively. The DT exhibits an accuracy, precision, recall, and F1 score of 79.40%, 79.50%, 100.00%, and 89.30%, respectively. RF shows an accuracy, precision, recall, and F1 score of 83.76%, 87.00%, 93.50%, and 90.10%, respectively. The accuracy, precision, recall, and F1 score were 82.00%, 87.00%, 90.30%, and 88.80%, respectively, for the XGBoost algorithm. AdaBoost showed an accuracy, precision, recall, and F1 score of 76.00%, 84.90%, 84.90%, and 90.10%, respectively. From the results of those applied algorithms, the RF showed satisfactory results among all applied algorithms. The study found that RF showed extraordinary performance among the seven algorithms based on different statistical performance measurements. Fig. 4 represents the AUC scores of the proposed algorithms from the ROC curve. We observed that RF showed the highest AUC score from the obtained AUC scores, which was 81.3%, and SVM showed the lowest score, which was 58.2%, among those seven algorithms. From all the statistical results, this analysis showed that the RF algorithm had the highest accuracy with precision, recall, F1 score, and AUC score of 83.76%, 87%, 93.5%, 90.1%, and 81.3%, respectively.

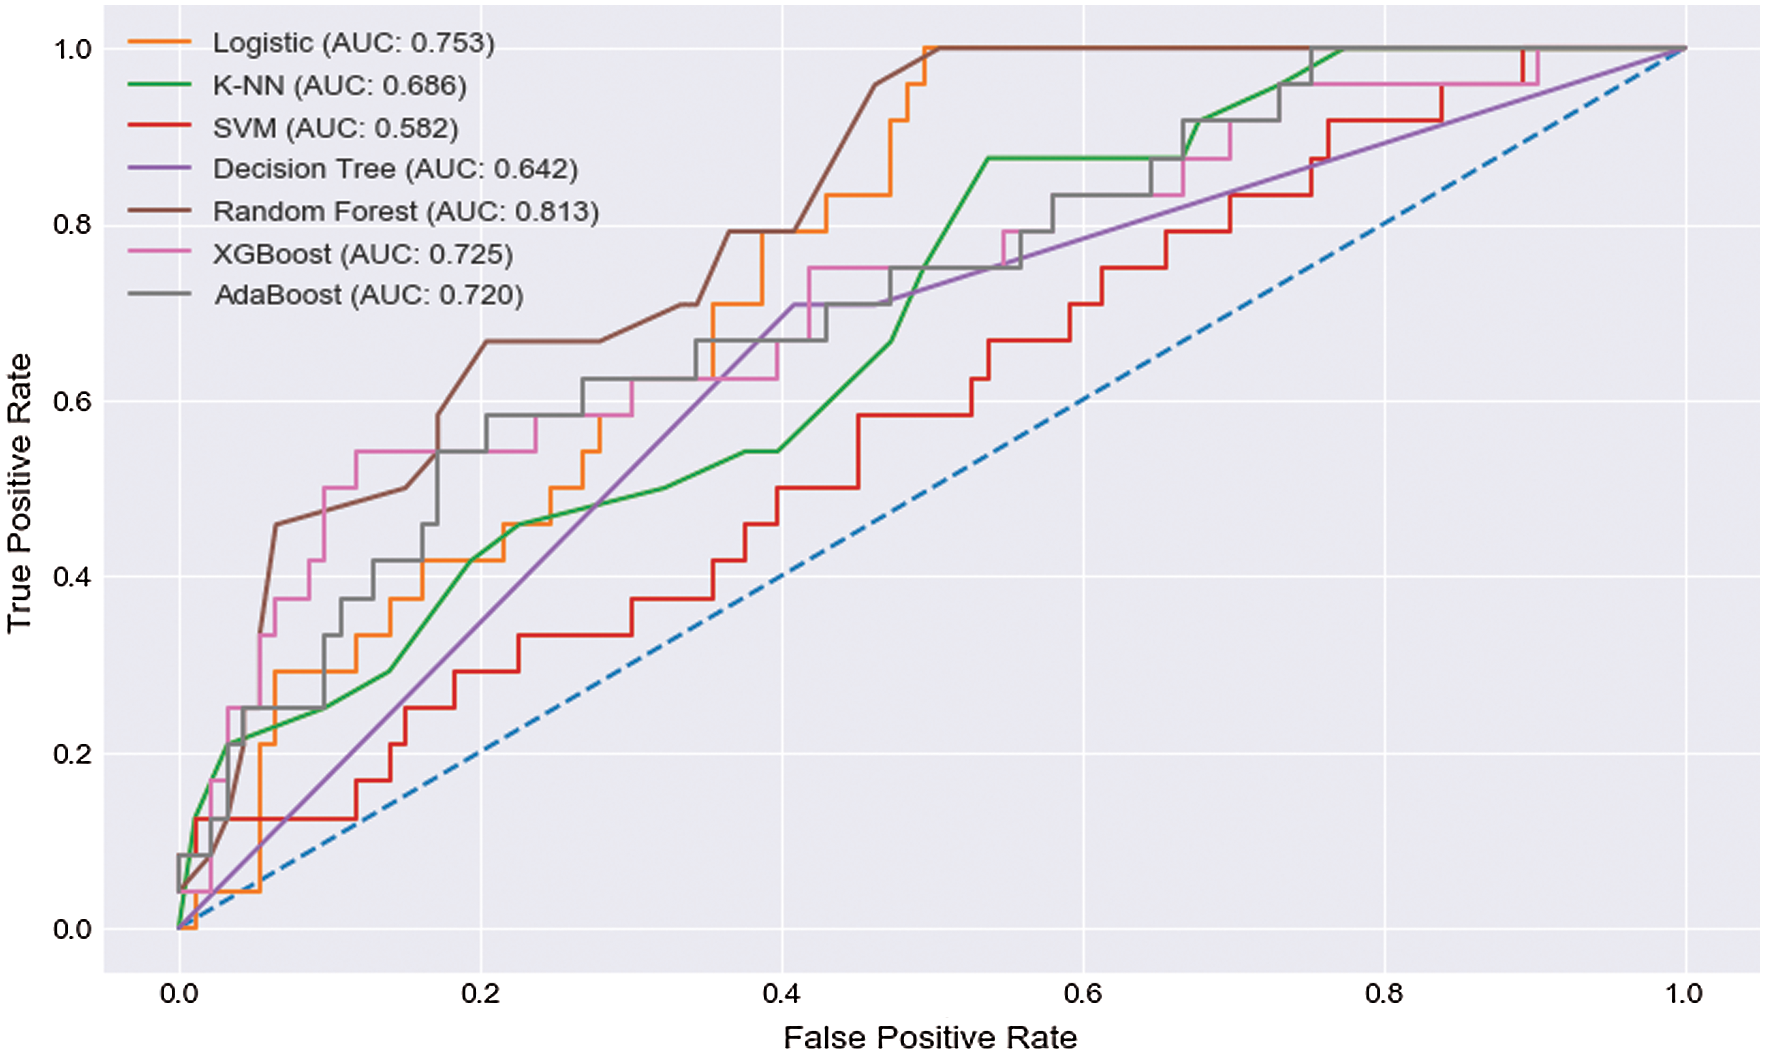
Figure 4: ROC curve
Tab. 3 shows a comparative analysis. The algorithms, such as LR, SVM, K-NN, AdaBoost, LogitBoost, BeggJ48, BeggRep, RF, naïve Bayes, DT (J48), multi-layer perceptron (MLP), BayesNet, and so forth, were applied and achieved the highest accuracy score 81%. This study used the same data set as the previous study but obtained better satisfactory performance. Among our applied algorithms, RF showed significant performance, with an accuracy of 83.76%. However, other algorithms showed moderate performance for the prognosis of liver disease at an earlier stage.

It is observed that the RF algorithms provided the best performance result compared to other algorithms. RF is an ensemble machine learning technique, and it creates several DT-based models, choosing the best model to show a satisfactory outcome compared to other classifiers. This technique reduces the overfitting problem and works for categorical and numeral values. This algorithm is a rule-based approach, which is why data normalization is not mandatory. Several parameters are tuned in the python machine library; for example, 166 estimators refer to existing tree numbers in a forest. The entropy function is used for measuring the tree quality, which increases the model performance.
We used the same algorithm with the same data set in the abovementioned studies. In Singh et al. [23] and [26], the authors used the same data set with the RF algorithm, with 71.87% and 69.26% accuracy, respectively. They used a tenfold, cross-validation testing option, and the RF algorithm parameters were missing in both papers. In Auxilia [24] and [28], the authors also used the RF algorithm, and the accuracies were 77% and 70.32%, respectively. The authors did not mention the data set’s training and test option. The algorithm parameter information was also missing in those studies. This study used the same data set with RF and other popular algorithms and obtained a higher accuracy, precision, recall, and F1 score. The methodology and algorithm parameters were mentioned in the Methodology section.
The study results indicate that machine learning models can be used for liver disease prediction. The RF model showed better results, compared to other models, for classification and prediction. RF had an accuracy of 83%, whereas the precision, recall, and F1 scores of RF were 83.76%, 87%, 93.5%, and 90.1%, respectively. The AUC score of RF was 81.3%. Though logistic showed a good recall of 93.5%, it had comparatively a lower accuracy of 79.4% and an AUC score of 75.3%, which were lower than RF.
Similarly, SVM showed a high recall of 98.9%, but its overall accuracy was unsatisfactory. It showed a lower AUC score of 58.2%. K-NN also showed a pleasant recall score of 96.8%, but it also showed comparatively less accuracy, precision, and an AUC score of 81.2%, 81.4%, and 68.6%, respectively, which were relatively lower than RF. AdaBoost showed a moderate performance, with an accuracy, recall, F1 score, and AUC score of 76.7%, 84.9%, 84.94%, and 72.0%, respectively, which were sloppier than RF. The recall value of the XGBoost algorithm was satisfactory, with a range of 90.3%, but it showed less pleasant overall accuracy than RF. Lastly, the DT had a major recall of 100%, but its overall performance was not satisfactory compared to RF. It showed comparatively low precision of 79.5% and an accuracy of 79.4%, which was fewer than RF. Although we found the highest recall scores in SVM and K-NN algorithms, both algorithms failed to reach the average accuracy, recall, precision, and F1 scores; RF showed the best performance at every mentioned phase. From the analytical study and comparisons of the performance according to average accuracy, precision, F1 score, and recall, RF showed the performance beyond expectation. RF showed superior performance among all of the exoteric algorithms. Therefore, RF is considered the best algorithm for the prediction of liver disease at an early stage.
This paper demonstrated multiple prediction algorithms to predict and diagnose the liver disease at an early stage. The data set showed different input parameters gathered, and we verified and trained the models for the input parameters given. The prediction of liver disease was tested with greater precision by evaluating the algorithms with an attribute collection and data set training. These findings identify novel factors to be used specifically at an early stage by classifiers to detect liver disease. LR, RF, XGBoost, SVM, AdaBoost, K-NN, and DT are constructed to predict liver disease. These findings showed that the RF model accurately predicted patients with liver disease. Some of the algorithms performed well at some specific parameters, but RF gave an excellent performance at every phase. Hence, RF is considered the best and most promising algorithm for liver disease prognosis.
Funding Statement : Taif University Researchers are supporting project number (TURSP-2020/215), Taif University, Taif, Saudi Arabia.
Conflicts of Interest: The authors declare that they have no conflicts of interest to report regarding the present study.
1. M. Peck-Radosavljevic, “Review article: coagulation disorders in chronic liver disease,” Alimentary Pharmacology & Therapeutics, vol. 26, pp. 21–28, 2007. [Google Scholar]
2. A. N. Arbain and B. Y. P. Balakrishnan, “A comparison of data mining algorithms for liver disease prediction on imbalanced data,” International Journal of Data Science and Advanced Analytics, vol. 1, no. 1, pp. 1–11, Feb. 2019. [Google Scholar]
3. B. V. Ramana, M. P. Babu and N. Venkateswarlu, “A critical study of selected classification algorithms for liver disease diagnosis,” International Journal of Database Management Systems, vol. 3, no. 2, pp. 101–114, 2011. [Google Scholar]
4. D. Kim, A. A. Li, C. Gadiparthi, M. A. Khan, G. Cholankeril et al., “Changing trends in etiology-based annual mortality from chronic liver disease, from 2007 through 2016,” Gastroenterology, vol. 155, no. 4, pp. 1154–1163, 2018. [Google Scholar]
5. S. Sontakke, J. Lohokare and R. Dani, “Diagnosis of liver diseases using machine learning,” in International Conference on Emerging Trends & Innovation in ICT (ICEIPune, India, pp. 129–133, 2017. [Google Scholar]
6. C. Liang and L. Peng, “An automated diagnosis system of liver disease using artificial immune and genetic algorithms,” Journal of Medical Systems, vol. 37, no. 2, pp. 1–10, 2013. [Google Scholar]
7. B. V. Ramana and P. M. P. Babu, “A critical comparative study of liver patients from USA and INDIA: an exploratory analysis,” IJCSI International Journal of Computer Science Issues, vol. 9, no. 2, Issue 3, pp. 506–516, May 2012. [Google Scholar]
8. S. Katiyar, “Predictive analysis on diabetes, liver and kidney diseases using machine learning,” International Journal for Research in Applied Science and Engineering Technology, vol. 8, no. 5, pp. 2285–2292, 2020. [Google Scholar]
9. M. Pasha and M. Fatima, “Comparative analysis of meta learning algorithms for liver disease detection,” Journal of Software, vol. 12, no. 12, pp. 923–933, 2017. [Google Scholar]
10. S. Bahramirad, A. Mustapha and M. Eshraghi, “Classification of liver disease diagnosis: a comparative study,” in Second International Conference on Informatics & Applications (ICIALodz, Poland, pp. 42–46, 2013. [Google Scholar]
11. B. Muruganantham, R. Mahapatra, K. Taparia and M. Kumar, “Liver disease prediction using an ensemble based approach,” Intelligent Computing and Applications, vol. 1172, pp. 507–518, 2020. [Google Scholar]
12. A. Praveen, T. Vital, D. Jayaram and L. Satyanarayana, “Intelligent liver disease prediction (ILDP) system using machine learning models,” Lecture Notes in Electrical Engineering, vol. 702, pp. 609–625, 2021. [Google Scholar]
13. D. Paper, “Scikit-learn regression tuning,” in Hands-on Scikit-Learn for Machine Learning Applications, 1st edition, APress, New York, USA, pp. 189–213, 2019. [Google Scholar]
14. A. Palmer, R. Jimenez and E. Gervill, “Data mining: machine learning and statistical techniques,” in Knowledge-Oriented Applications in Data Mining, Intechopen, London, UNITED KINGDOM, pp. 1–26, 2011. [Google Scholar]
15. M. L. Zhang and Z. H. Zhou, “ML-KNN: A lazy learning approach to multi-label learning,” Pattern Recognition, vol. 40, no. 7, pp. 2038–2048, 2007. [Google Scholar]
16. C.-C. Yao and P. T. Yu, “Effective training of support vector machines using extractive support vector algorithm,” in International Conference on Machine Learning and Cybernetics, Hong Kong, China, pp. 1808–1814, 2007. [Google Scholar]
17. N. Nadar and R. Kamatchi, “Information and communication-based collaborative learning and behavior modeling using machine learning algorithm,” in Social Media and Machine Learning, Intechopen, London, UNITED KINGDOM, pp. 1–20, 2019. [Google Scholar]
18. S. Grampurohit and C. Sagarnal, “Disease prediction using machine learning algorithms,” in International Conference for Emerging Technology (INCETBelgaum, India, pp. 1–7, 2020. [Google Scholar]
19. R. Mitchell and E. Frank, “Accelerating the XGBoost algorithm using GPU computing,” PeerJ Computer Science, vol. 3, no. e127, pp. 1–15, 2017. [Google Scholar]
20. T. Hastie, S. Rosset, J. Zhu and H. Zou, “Multi-class AdaBoost,” Statistics and Its Interface, vol. 2, no. 3, pp. 349–360, 2009. [Google Scholar]
21. M. M. S. Raihan, A. B. Shams and R. B. Preo, “Multi-class electrogastrogram (EGG) signal classification using machine learning algorithms,” in International Conference on Computer and Information Technology (ICCITDhaka, Bangladesh, pp. 1–6, 2020. [Google Scholar]
22. A. Viloria, Y. Herazo-Beltran, D. Cabrera and O. Pineda, “Diabetes diagnostic prediction using vector support machines,” Procedia Computer Science, vol. 170, pp. 376–381, 2020. [Google Scholar]
23. J. Singh, S. Bagga and R. Kaur, “Software-based prediction of liver disease with feature selection and classification techniques,” Procedia Computer Science, vol. 167, pp. 1970–1980, 2020. [Google Scholar]
24. L. A. Auxilia, “Accuracy prediction using machine learning techniques for indian patient liver disease,” in 2nd International Conference on Trends in Electronics and Informatics (ICOEITirunelveli, India, pp. 45–50, 2018. [Google Scholar]
25. K. Thirunavukkarasu, A. S. Singh, M. Irfan and A. Chowdhury, “Prediction of liver disease using classification algorithms,” in 4th International Conference on Computing Communication and Automation (ICCCAGreater Noida, India, pp. 1–3, 2018. [Google Scholar]
26. N. Nahar, F. Ara, Md. A. Neloy, V. Barua, M. Shahadat et al., “A comparative analysis of the ensemble method for liver disease prediction,” in International Conference on Innovation in Engineering and Technology (ICIETDhaka, Bangladesh, pp. 23–24, 2019. [Google Scholar]
27. M. S. Vijayarani, “Liver disease prediction using SVM and Naïve Bayes algorithms,” International Journal of Science, Engineering and Technology Research (IJSETR), vol. 4, no. 4, pp. 2278–7798, 2015. [Google Scholar]
28. M. Banu Priya, P. Laura Juliet and P. R. Tamilselvi, “Performance analysis of liver disease prediction using machine learning algorithms,” International Research Journal of Engineering and Technology (IRJET), vol. 5, no. 1, pp. 2395–0072, 2018. [Google Scholar]
 | This work is licensed under a Creative Commons Attribution 4.0 International License, which permits unrestricted use, distribution, and reproduction in any medium, provided the original work is properly cited. |