DOI:10.32604/iasc.2021.018039
| Intelligent Automation & Soft Computing DOI:10.32604/iasc.2021.018039 | |
| Article |
Machine Learning-based Detection and Classification of Walnut Fungi Diseases
1Department of Information Technology, Hazara University, Mansehra, Pakistan
2Department of Telecommunication, Hazara University, Mansehra, Pakistan
3Department of Computer Science, National Textile University, Faisalabad, Pakistan
4Department of Information Systems, Faculty of Computer Science & Information Technology, Universiti Malaya, 50603, Kuala Lumpur, Malaysia
5School of Computer Science and Engineering, SCE, Taylor’s University, Subang Jaya, Malaysia
6Electrical and Electronics Engineering, Xiamen University Malaysia, Bandar Sunsuria, 43900 Sepang, Selangor, Malaysia
7Department of Computer Science, Faculty of Computing and Information Technology, King Abdulaziz University, Jeddah, 21589, Saudi Arabia
*Corresponding Author: Mohammad Arif Sobhan Bhuiyan. Email: arifsobhan.bhuiyan@xmu.edu.my
Received: 22 February 2021; Accepted: 09 May 2021
Abstract: Fungi disease affects walnut trees worldwide because it damages the canopies of the trees and can easily spread to neighboring trees, resulting in low quality and less yield. The fungal disease can be treated relatively easily, and the main goal is preventing its spread by automatic early-detection systems. Recently, machine learning techniques have achieved promising results in many applications in the agricultural field, including plant disease detection. In this paper, an automatic machine learning-based detection method for identifying walnut diseases is proposed. The proposed method first resizes a leaf’s input image and pre-processes it using intensity adjustment and histogram equalization. After that, the detected infected area of the leaf is segmented using the Otsu thresholding algorithm. The proposed method extracts color and shape features from the leaf’s segmented area using the gray level co-occurrence matrix (GLCM) and color moments. Finally, the extracted features are provided to the back-propagation neural network (BPNN) classifier to detect and classify walnut leaf diseases. Experimental results demonstrate that the proposed method’s detection accuracy is 95.3%, which is significantly higher than those of the state-of-the-art techniques. The proposed method assists farmers in detecting diseases affecting walnut trees and thus enables them to generate more revenue by improving the productivity and quality of their walnuts.
Keywords: Machine learning; walnut disease; fungi disease; color image features; texture image features
Agriculture plays a vital role in the economy and general development of a country. Particularly, in Pakistan, agriculture represents the second-largest branch of the economy, contributing to more than 21% of the gross domestic products (GDP), and 62% of the country’s population earn their livelihood in the agriculture sector [1,2]. Currently, fungal diseases are a significant problem in the agriculture field worldwide, substantially decreasing the quantity and quality of agricultural products. Therefore, the fungal diseases that affect trees, particularly walnut trees, must be cured. The Khyber Pakhtunkhwa province of Pakistan has 226 indigenous types of walnuts, mainly infected by fungal diseases [3]. Walnut production declined sharply in Pakistan from 2000 to 2017 because tree diseases, such as anthracnose, leaf blotch, and bacteria blight, affected the walnut trees.
Anthracnose is the most well-known leaf disease of walnut trees, and it is caused by the fungus Gnomonia Leptospira. The Gnomonic Leptostyla spreads due to rain in the spring season. The anthracnose disease reduces the size, mass, and actual crop of nuts and the falling of leaves before time. The first symptom of the anthracnose disease on a walnut leaf is circular brown lesions on the leaves. Initially, this symptom is visible only on the leaf’s underside, which eventually spreads on both the upper and the lower leaf surfaces as time passes. Walnut anthracnose affects only walnuts and butternuts, which belong to the same genus of Juglans. There are also forms of anthracnose that can cause damage to maples, oaks, shade trees, and other plants, such as tomatoes, beans, cucumbers, and squash during the plant growing season [4,5].
Walnut leaf blotch is caused by the fungus Marssonina Juglandis, which changes in severity yearly. Initially, small, round, brown-color spots of a few millimeters in size appear on a leaf surface, and then these spots merge to larger blotches. The symptoms of anthracnose and leaf blotch on a walnut leaf are shown in Fig. 1.
Fig. 1 shows the symptoms of anthracnose and leaf blotch on a walnut leaf.
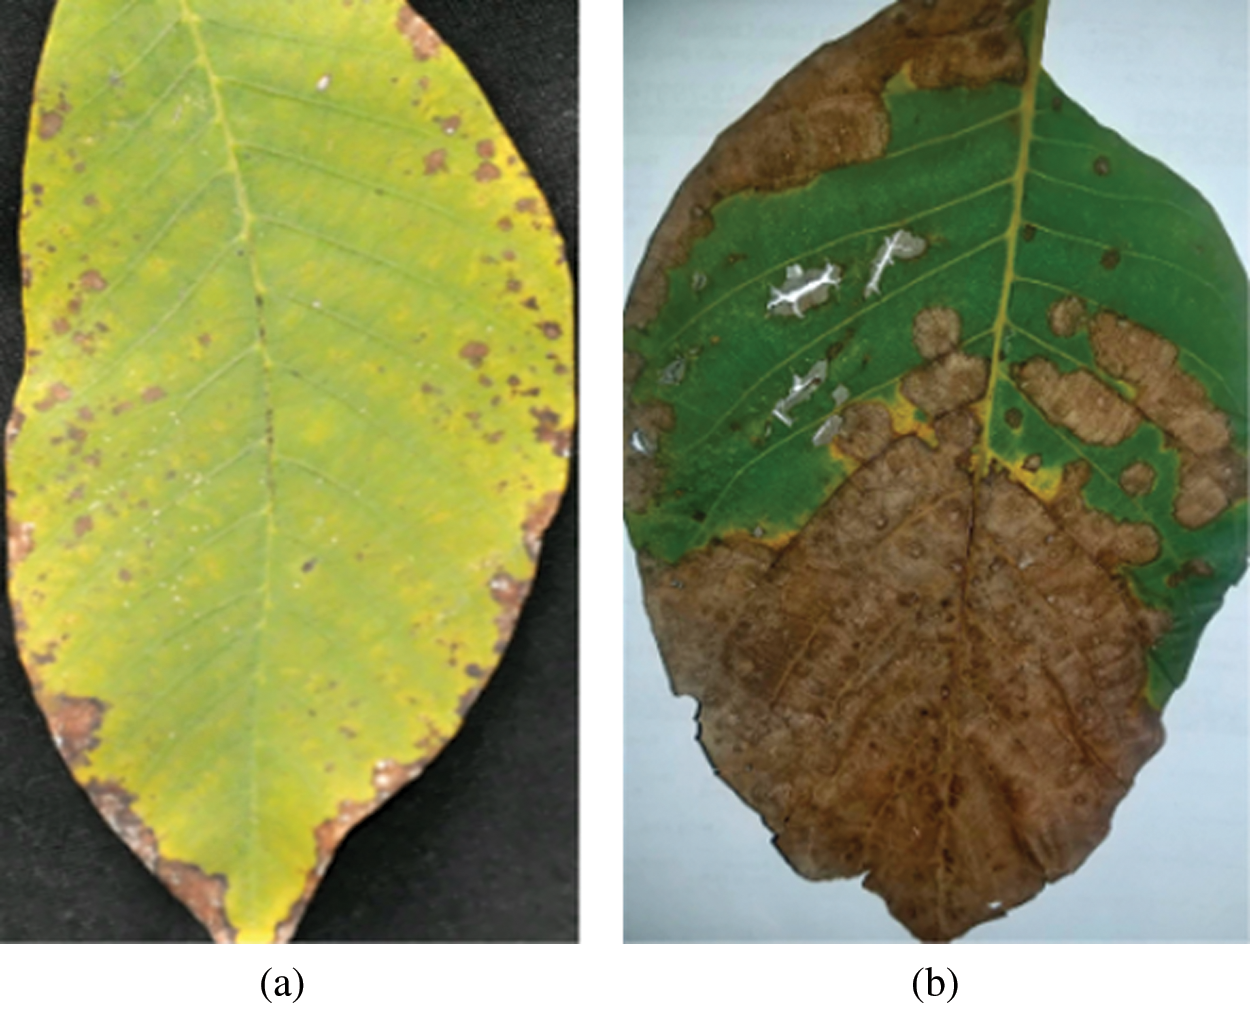
Figure 1: (a) Leaf image containing the symptom of anthracnose (b) Leaf image containing the symptom of blotch
Most of the existing walnut disease detection methods are based on naked-eye observation. However, the naked eye-based detection of diseases is time-consuming and prone to errors. Therefore, it is crucial to detect the disease on time. An automatic walnut disease detection system can be used to detect the disease in its early stage. In the past years, machine learning techniques have played a significant role in the agricultural field. To improve the accuracy and speed of diagnostic results, many machine learning-based algorithms have been used, such as k-mean cluster, support vector machine (SVM), K-nearest neighbor, naive Bayesian, and artificial neural networks (ANNs) [6,7]. This paper proposes an automatic detection method of walnut diseases, such as anthracnose and leaf blotch. The proposed method is deployed using a machine learning approach. The proposed model takes a walnut leaf image as an input to predict and identify diseases precisely.
The main contributions of this study can be summarized as follows:
• A back-propagation neural network (BPNN) model is proposed to identify and classify walnut leaf diseases.
• A leaf disease dataset, including the anthracnose and leaf blotch diseases, is designed to train and test the BPNN model.
• The BPNN is compared with a multi-support vector machine (mSVM) in terms of accuracy, and the result shows that the BPNN model is comparatively better than the mSVM.
Leaf disease identification has been a crucial problem and a significant concern in the agricultural sector for a long time. Machine learning algorithms have been widely used for disease detection in the agriculture field in recent years.
Khalesi et al. [8] used an automatic system to classify the Kaghazi and Sangi genotypes of Iranian walnuts. The features were extracted using the fast Fourier transform (FFT), and the principal component analysis (PCA) was applied to the extracted features. Finally, a multilayer feedforward neural network was used for classification. This method’s detection accuracies of Sangi and Kaghazi genotypes were 99.64% and 96.56%, respectively.
Chuanlei et al. [6] developed an automatic method to diagnose apple leaf diseases using image processing techniques and pattern recognition methods. The RGB image was first converted to the HSI gray image as a pre-processing step. The image of an infected leaf was segmented by the region growing algorithm (RGA). Then, the RGA extracted features from the leaf image segmented area, including texture, shape, and color features. Finally, the SVM classifier was used for classification and detection, achieving high accuracy of 90%. Tigadi et al. [9] proposed an automatic method for detecting banana plant diseases, such as Yellow Sigatoka, Black Sigatoka, Panama Wilt, Bunchy top, and Streak virus, by applying the image processing techniques. Initially, images of banana leaves with various diseases were captured by a digital camera. The pre-processing techniques, such as image resizing, cropping, and color conversion, were used. Further, two types of features, the color features and the template’s histogram (HOT), were extracted. Finally, the banana diseases were classified by the trained artificial neural network. Bhange et al. [10] used a web-based tool for the identification of pomegranate fruit disease. First, a leaf image was resized, and then features, such as morphology, color, and concave-convex variation (CCV), were extracted. Next, the disease area was segmented by the k-means cluster algorithm. Finally, the SVM was used for classification and detection. The proposed system achieved an accuracy of 82% in pomegranate disease identification. Waghmare et al. [11] proposed an automatic system for detecting major grape diseases, such as downy mildew and black rot, from a grape leaf image. The pre-processing steps were applied to the input image to make the image suitable for further processing. Additionally, the background was removed from the image, and the RGB color space was converted to the HSV color space. Further, the affected area was segmented from the leaf image, and the texture, color, shape, and edge features were extracted by the first- and second-order statistical methods and the gray level co-occurrence matrix (GLCM). Finally, the extracted features were processed by the SVM classifier for classification. Detection accuracy of 96% was achieved. Awate et al. [12] proposed a fruit disease detection and diagnosis method based on image processing techniques. In this method, the K-means clustering algorithm was used for image segmentation, and the color, morphology, and texture were extracted from the segmented image. Finally, an ANN-based classifier was used to identify and classify fruit diseases. Kusumandari et al. [13] presented a strawberry plant disease detection method. In their method, the input image quality was improved by pre-processing, and the RGB color space was converted into the HSV color space. After that, the regional method was used for the segmentation of the infected area of plant leaves. Detection accuracy of 85% was achieved.
Areni et al. [14] introduced an early detection image processing-based method of symptoms of pest attacks on cocoa fruits. First, the pre-processing step was conducted to enhance the input image quality and to convert the RGB model into the grayscale model. Further, image features were extracted using the Gabor kernel and stored in the database for the comparison of the test sample. The results show 70% accuracy on the testing dataset.
The flowchart of the proposed method is shown in Fig. 2. The proposed method uses a leaf image as an input and pre-processes it to enhance the image contrast. Next, it segments the leaf image using the image segmentation technique. The image features are then extracted from the segmented image and fed to the classifier to identify and categorize walnut leaf diseases. The proposed architecture consists of five modules. The details of each of the three modules are given in the following.
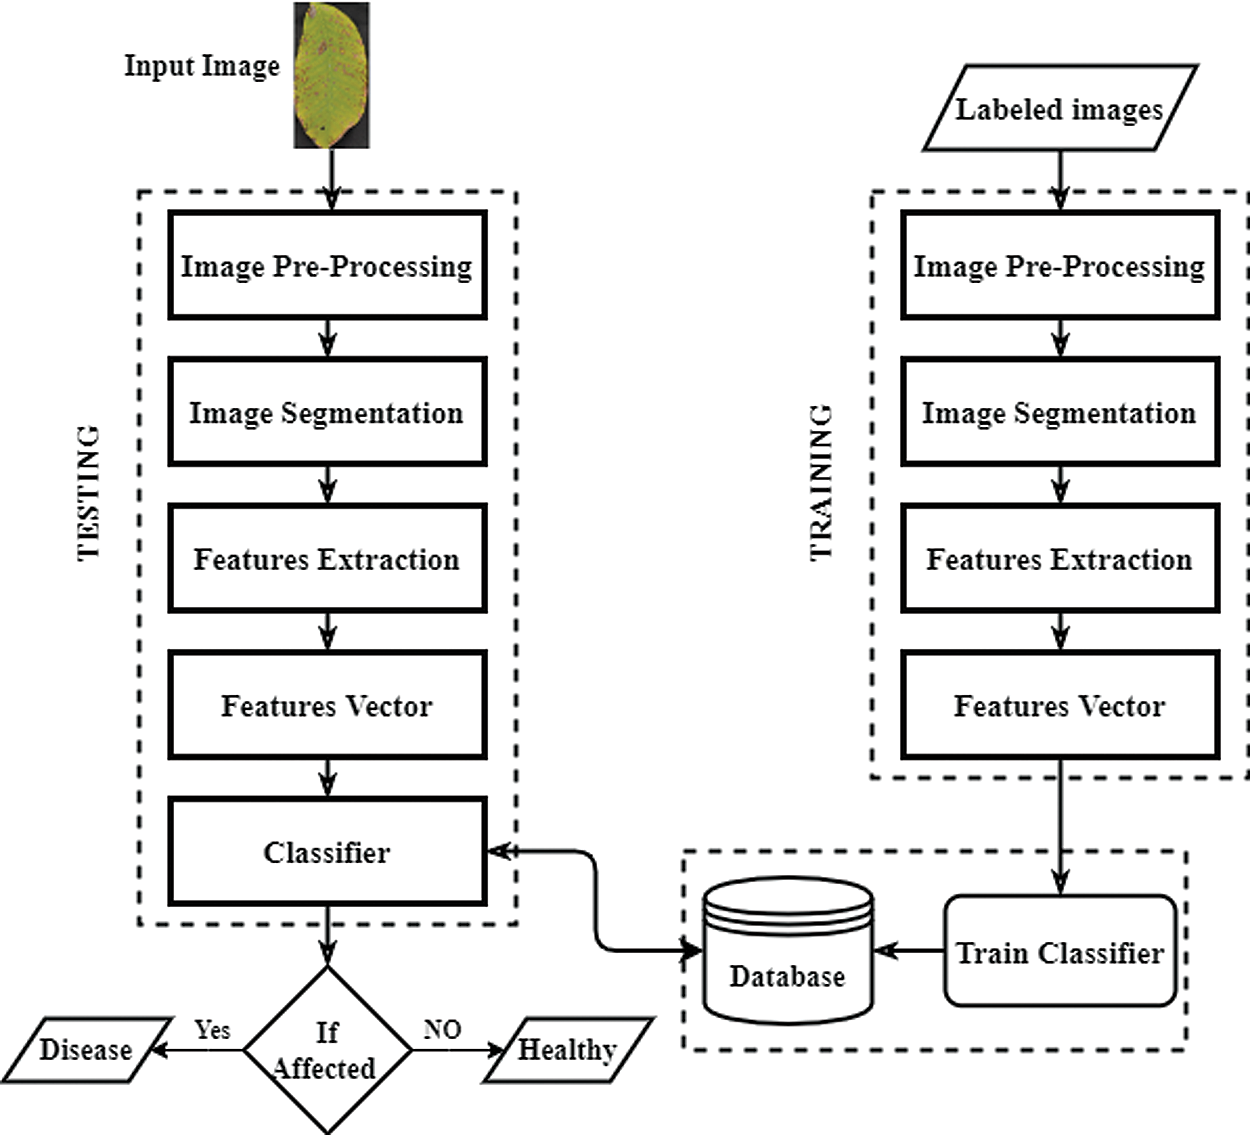
Figure 2: Architecture of our proposed technique
3.1 Image Pre-processing Module
This module aims to resize an RGB leaf image, improve its contrast, and transform the enhanced RGB image into the YUV color space. The proposed method requires images of the same size, whereas raw input image size may vary. In addition, training performs faster on smaller images. Therefore, all raw images are resized to 256 × 256 pixels, as shown in Fig. 3. After the image resizing process, two techniques are separately applied to enhance image contrast, intensity adjustment, and histogram equalization technique. The results of the two enhancement techniques are shown in Fig. 4, where it can be seen that the result of the histogram equalization technique is better than the intensity adjustment. Therefore, histogram equalization is adopted to eliminate the noise and enhance image features of the leaf’s surface, such as line, edges, and maladies particles of the leaf. Next, the enhanced RGB color image is converted into a YUV color space using Eqs. (1)–(3). The results of the RBG-to-YUV color transformation of the walnut leaf images are presented in Fig. 5.
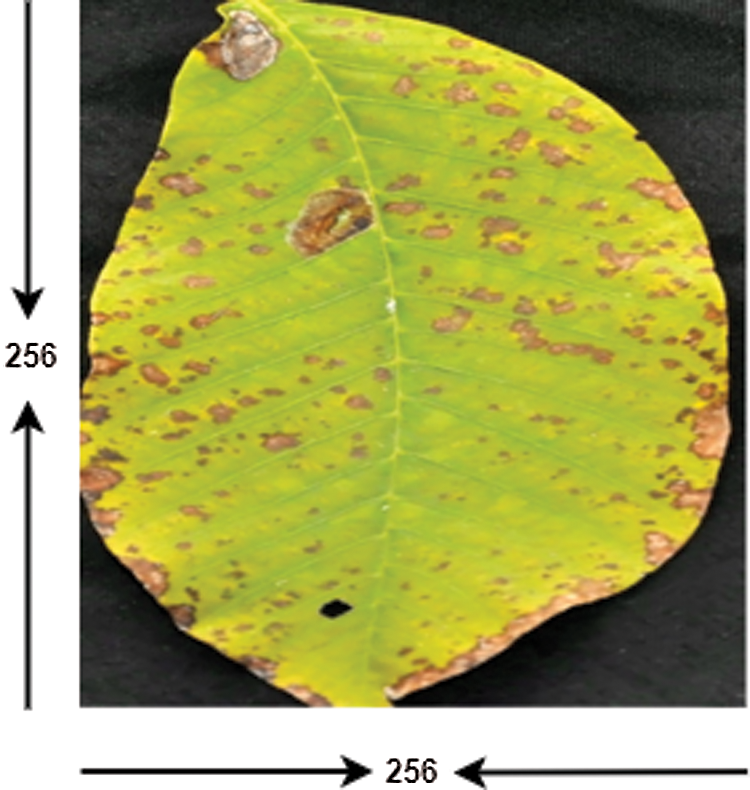
Figure 3: Resize image
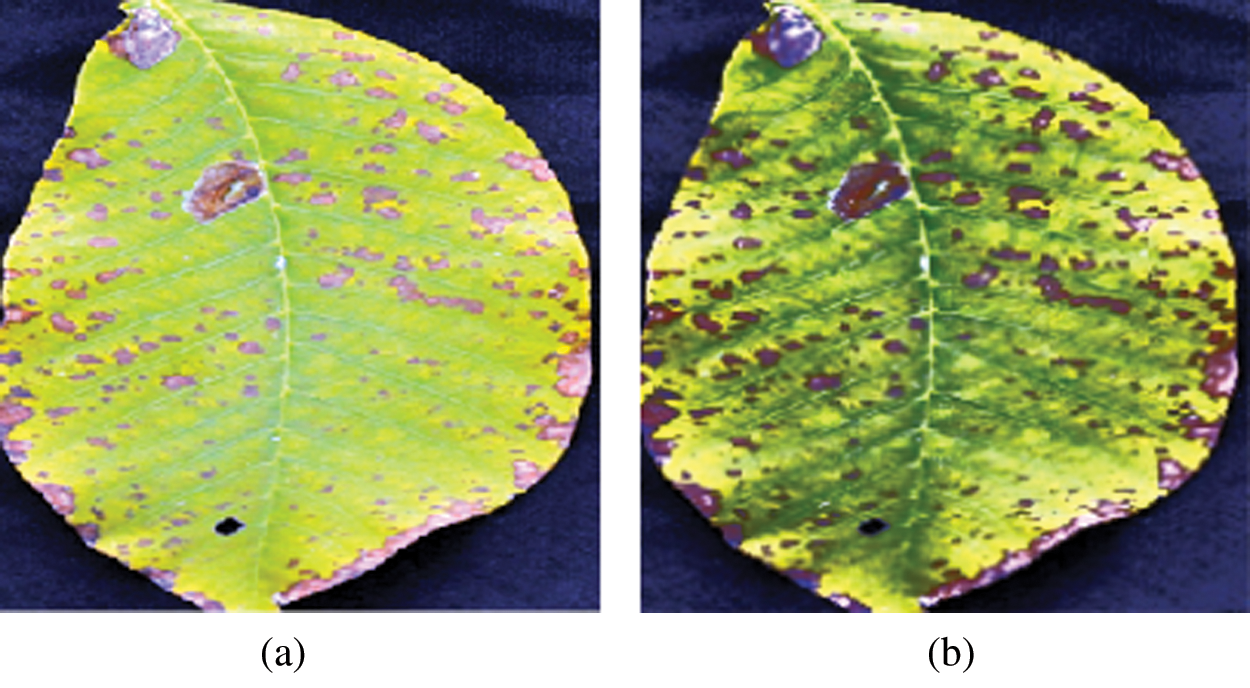
Figure 4: (a) Result of intensity adjustment (b) Result of histogram equalization
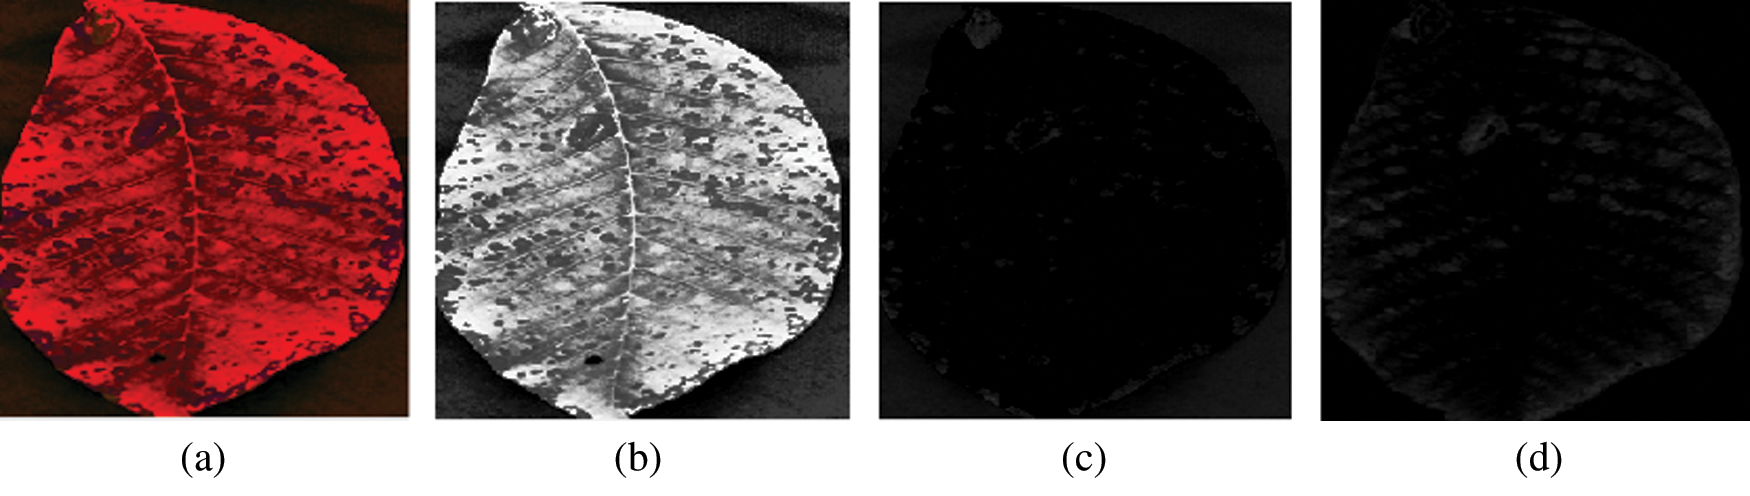
Figure 5: (a) YUV color image (b) Y channel (c) U channel (d) V channel
This module aims to segment the infected regions in the V channel of a YUV leaf image. Different methods, including the k-means clustering, fuzzy algorithm, region base, convolution neural network, wavelength transform, and thresholding algorithm, have been used for image segmentation [15]. In the proposed method, the infected regions in a leaf image are segmented using the Otsu thresholding algorithm [16]. This algorithm restores a single intensity range that separates pixels into two classes: foreground and background [17,18]. The input image, that is, the V channel obtained from the YUV model, and its segmented image are shown in Fig. 6.
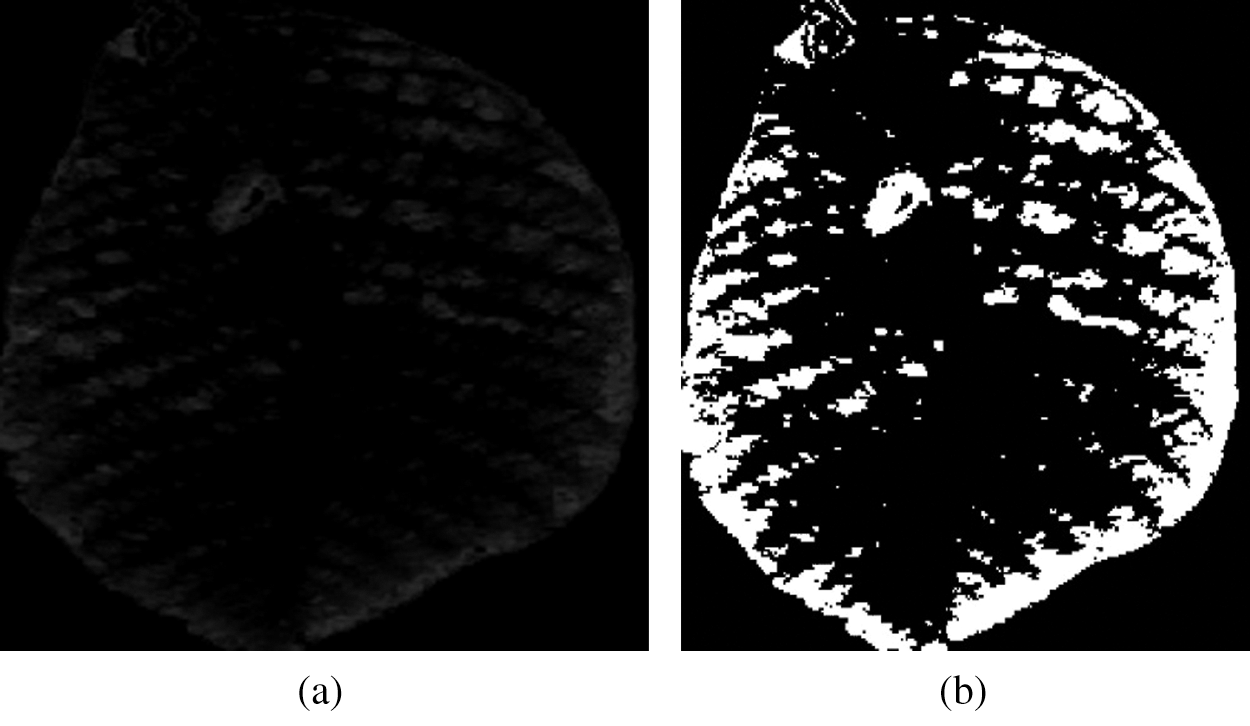
Figure 6: (a) Input image and (b) Result of segmentation
In pattern recognition and image processing, a feature extraction represents a special form of dimensionality reduction. The main feature extraction goal is to obtain the most relevant information from the original data represented in a lower dimensionality space. The input data are transformed into a reduced representation set of features named the feature vector. In this process, relevant features are extracted from objects to form the feature vectors. Then, classifiers use the feature vectors to recognize the input unit with the target output unit. There are various features in the input images, and they are extracted to detect and classify leaf diseases. A feature often contains data relative to color, shape, context, or texture. In this paper, the color, texture, and shape features are extracted from the leaf images’ segmented affected area.
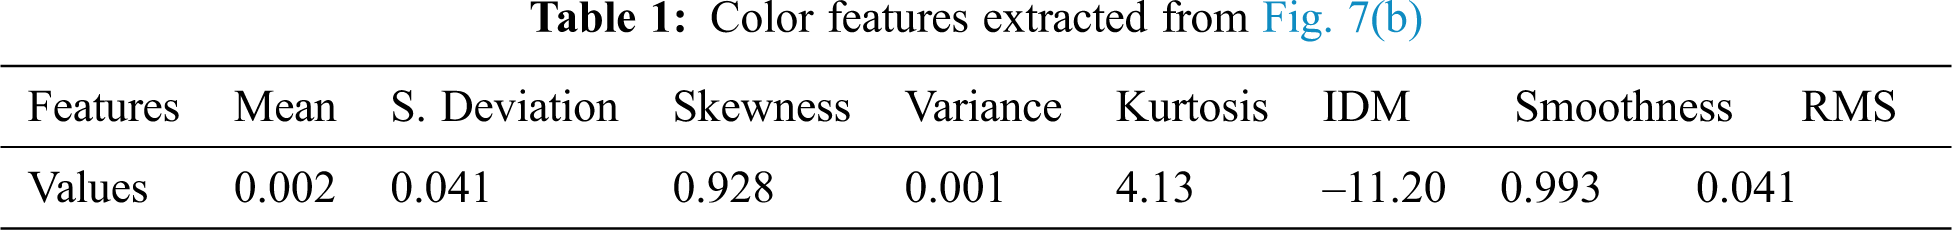
A color feature is one of the most widely used features in plant disease detection. The human vision system is more sensitive to color information than to the gray surface. The color of an image can be represented through a few color models. The most commonly used color models are RGB, HSV, and YUV. The color feature can be described by color histogram [19], color correlogram, and a color moment [20]. In this paper, the color moment is used to represent color features from the V channel of the YUV model. The color moments include the mean, standard deviation, skewness, variance, kurtosis, and inverse difference moment (IDM). The extracted color features of the image presented in Fig. 6(b) are illustrated in Tab. 1. Following are the features that are extracted from the input images.
The mean of an image denotes the average color in an image, which can be computed as follows:
where N denotes the total number of pixels in the image,
Standard deviation The variance or deviation between pixels of an input image is represented with the standard deviation, which can be computed by taking the square root of the variance of the color distribution, which is calculated as follows:
where σ denotes the standard deviation.
The skewness is a measure of the degree of asymmetry mean probability distribution, which provides the information on the color distribution shape. It can be computed as follows:
The variance is used as a measure of the gray level contrast to establish the relative component descriptors and is calculated as follows:
The kurtosis denotes a measure of the peak value of the real-valued random variable; it shapes the descriptor of a probability distribution and can be calculated as follows:
The IDM is inversely related to the contrast measure. For similar pixel values, the IDM value is high. Its value can be calculated as follows:
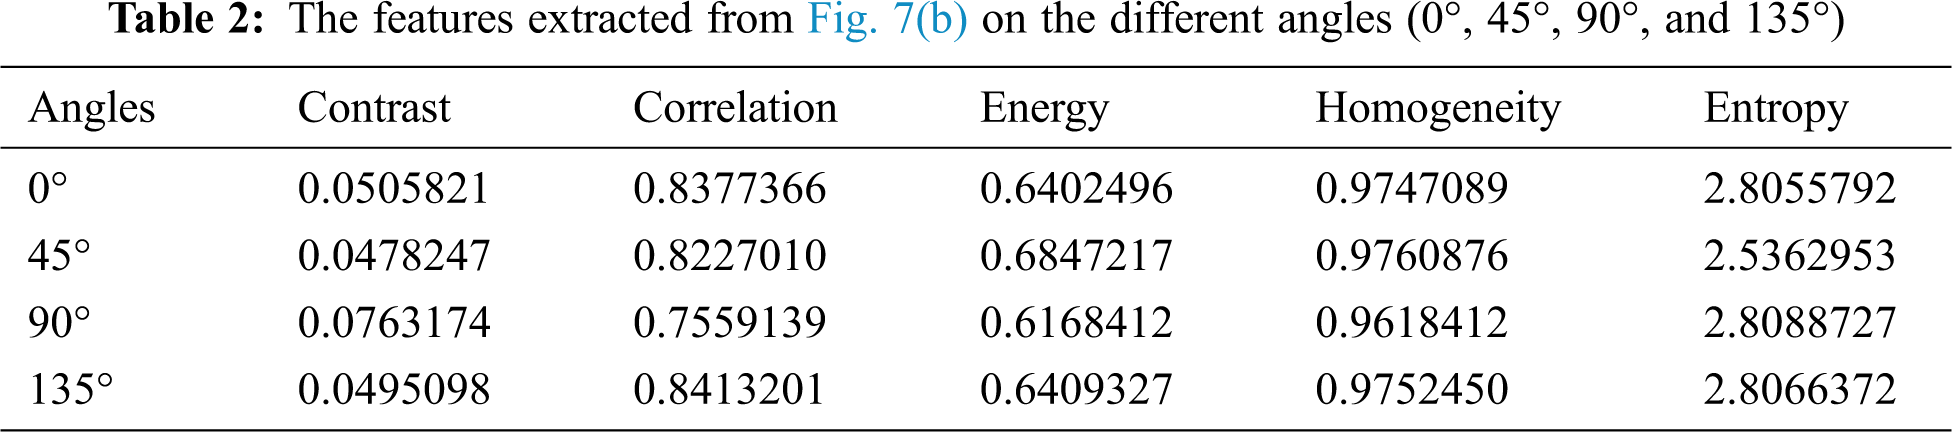
Texture feature is an important low-level feature that divides an image into the region of interests (ROIs) for classification. It provides more details about a specific region in the image. Several methods can be used to describe the main texture features, such as coarseness and regularity. The GLCM measure is one of the most important measures that can be used to describe the texture and to estimate the special dependency of the gray level of an image [21]. In this paper, the texture features, including the contrast, correlation, energy, homogeneity, and entropy, are extracted from the walnut leaf through the GLCM. The GLCM features extracted from the image shown in Fig. 6(b) are given in Tab. 2. The formal definitions of the texture features used in this work are as follows.
The contrast measures the intensity between a pixel and its neighboring pixel over the whole image, and it is considered to be zero for a constant image; it is also known as a variance or a moment of inertia and is computed as follows:
where, gi,j represents the GLCM, and
Correlation represents the estimation of the correlation of a pixel and its neighboring pixel over the entire image and can be computed as follows:
where,
Energy denotes the sum of squared elements in the GLCM, and by default, it is one for a constant image. The energy is also known as the angular second moment, and it is calculated by
Homogeneity is a measure of the closeness of the distribution of elements in the GLCM to the GLCM diagonal. The homogeneity is calculated by
Entropy is a measure of image complexity, and it also measures the disorder of the GLCM. The value of energy is calculated by
Shape features are significant because they describe an object in an image using its most important characteristics. The shape is one of the most important features for detecting infected walnut leaf images. In the walnut leaf disease images, it can be seen that the shapes of various types of diseases differ significantly. After the image segmentation process, the proposed model obtains the infected regions of the target disease, and then the areas of the infected regions are computed.
The percentage of the infected area of the walnut leaf image is the ratio of the area of the infected region in the leaf to that of the whole leaf. The following equation is used for computing the percentage of the infected region in a walnut leaf image.
where, A1 and A2 denote the total number of white pixels in a leaf’s infected area and the total number of pixels in the whole leaf image, respectively.
A BPNN is the most widely used neural network type for classification and prediction. The back-propagation algorithm searches for the minimum value of the error function in the weight space, utilizing gradient descent. The BPNN is a multilayer network consisting of an input layer, one or more hidden layers, and an output layer. Further, the BPNN plays an active role in agriculture disease recognition, and significant results have been achieved in this field [22,23]. In this work, the BPNN algorithm is used for walnut disease identification and classification.
The BPNN model is trained using a dataset comprised of 70% of all images. Various techniques, including pre-processing, segmentation, and features extraction, are applied to all images, and a feature vector presented in Tab. 3 is obtained. The feature vector is fed to the network input layer. The input layer consists of 14 neurons; this number of neurons is used because 14 features are used as the input data. After being processed by the input layer, the features are fed to the hidden layer that consists of 50 neurons. The sigmoid activation function is used in the output layers. The structure of the BPNN is shown in Fig. 7.
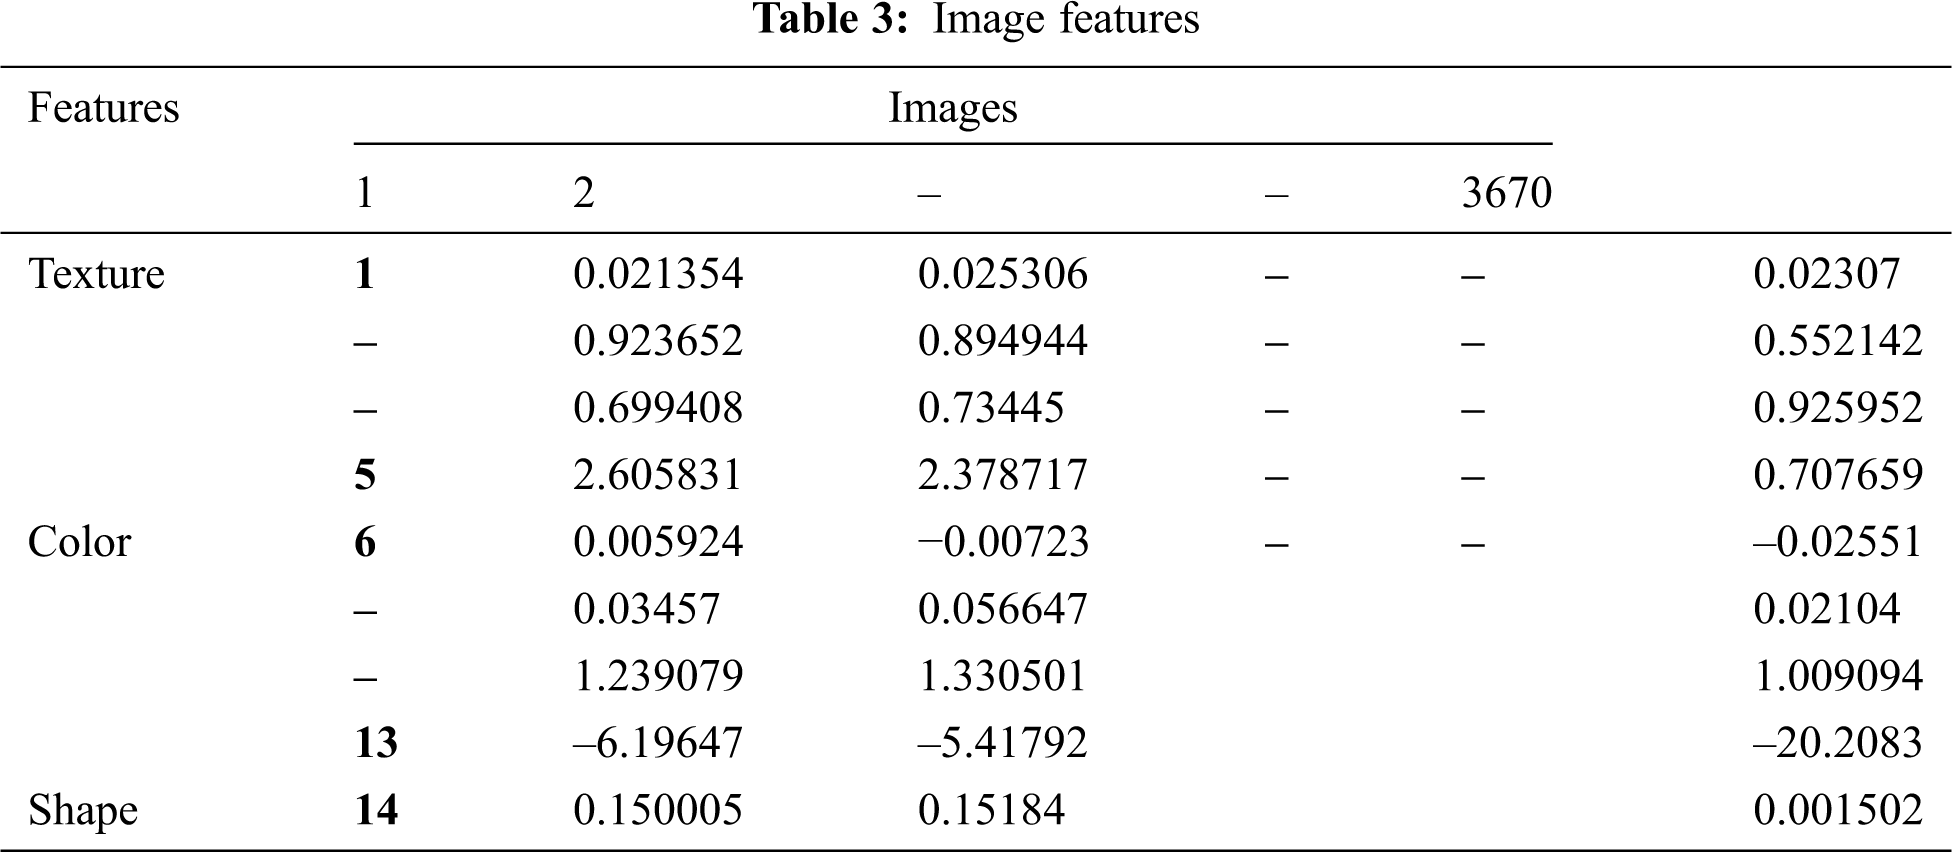
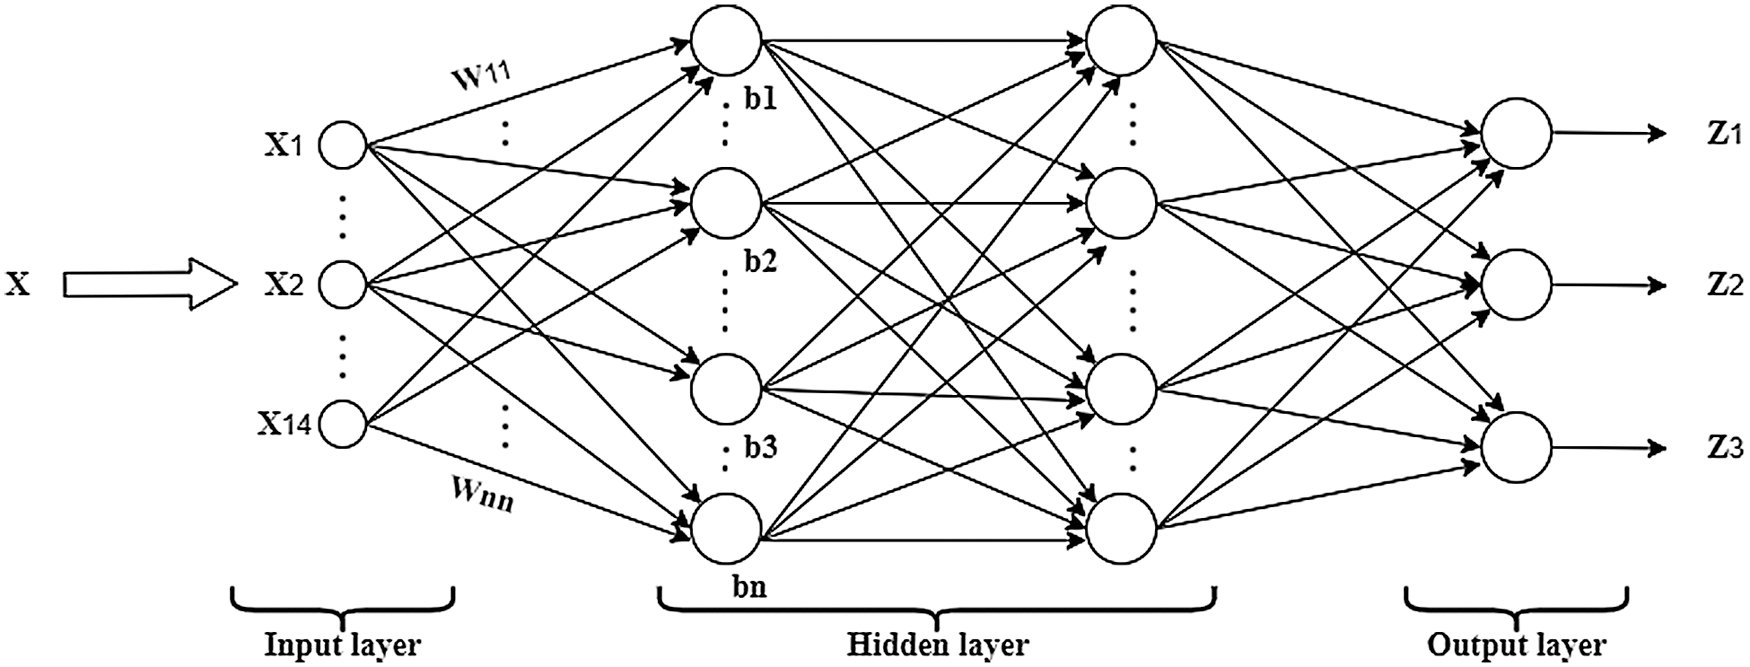
Figure 7: Structure of the BPNN
In the training process, the maximum number of training epochs was set to 1000, the inertia coefficient was set to 0.8, and the learning efficiency was set to 0.01.
The weighted output (XiWij) of the hidden layer’s neuron j is added to the bias value of a neuron j in the output layer(????????) to obtain the output of the neuron j in the output layer (Ij) r, which is expressed as:
where Xi represents the input data of the output layer, which is the output data of the hidden layer; Wij represents the weight value of the connection between neuron i in the hidden layer and neuron j in the output layer, and θj represents the bias value of neuron j.
The input Ij passes through an activation function f of the output layer to produce the desired network output Zj. In the present work, the sigmoid activation function has been used as an activation function, and it is expressed by
The proposed model was developed using the MATLAB® 2016 software environment. The trained network was stored in the form of .net1 file in MATLAB® 2016. The trained network was tested using the test dataset.
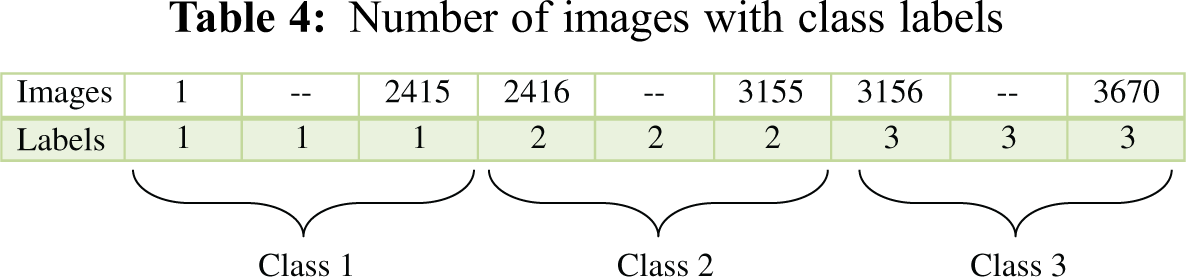
The SVM is one of the most popular supervised machine learning algorithms for object detection and image classification [24]. The SVM divides the training dataset into two classes and forms the optimum separating hyperplanes. The feature vector of images in the first-class lies on one side of the hyperplane, and the feature vector of images in the second class lies on the opposite side of the hyperplane. The number of hyperplanes in the SVM depends on the number of classes. In this paper, the mSVM is used for walnut leaf disease detection and classification using a linear kernel function. The number of iterations was set to 500 during the training process of mSVM l. The same process is applied for training the BPNN on the training dataset to obtain the feature vector, which is presented in Tab. 3. The feature vector was used as an input to the mSVM. By applying the mSVM, the feature vector was used to classify images into three classes: infected images I, infected images II, and non-infected images. The training set of the proposed model included images of three classes. The first class included the images of walnut leaves infected by the anthracnose, the second class included the images of walnut leaves infected by the leaf blotch disease, and the third class included images of healthy walnut leaves. The first, second, and third classes were labeled as 1, 2, and 3, respectively, as presented in Tab. 4. The training set contained 70% of all the images of walnut leaves.
The walnut leaf images were processed, and the image features were extracted using the GLCM and the color moment. The extracted features were fed to the classifier to predict the walnut leaf diseases, namely, the anthracnose and blotch diseases. The collection of images for model development was the foremost and crucial task in this work. Images of infected walnut leaves were captured on the black background using a high-resolution camera, having a 180-dpi resolution. The images were stored in a JPG or PNG format. First, an infected leaf was put on the black background under an appropriate light source. To improve the image’s view and brilliance, it was ensured that reflection was eliminated and that the light was uniformly dispersed. The leaf images were appropriately zoomed to ensure that an image included a leaf and the background. The total data consisted of 3670 images of walnut leaves with a resolution of
4.1 Classifier Performance Analysis
The detection accuracy was used to test the trained network’s performance on the test set, and it was calculated by:
where
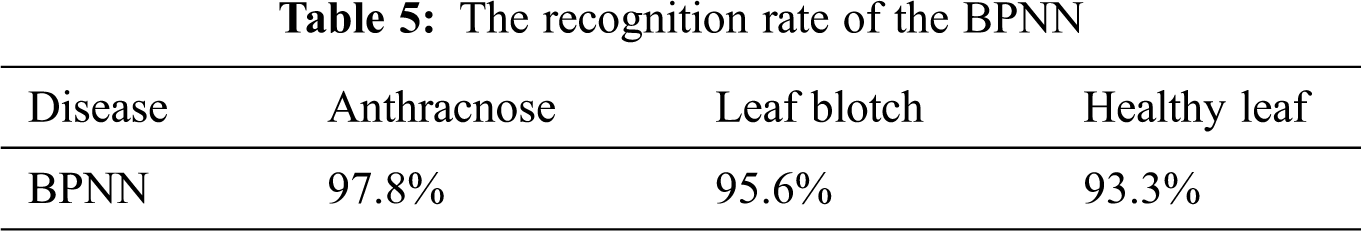
BPNN classifier: The accuracy of the BPNN is presented in Fig. 8, where it can be seen that the BPNN achieved the highest accuracy of 97.8% for anthracnose disease, while the accuracy values for the other two image classes were lower. The overall accuracy of the BPNN in the walnut leaf disease detection was 95.3%. The accuracy values of the BPNN for the three image classes are given in Tab. 5.
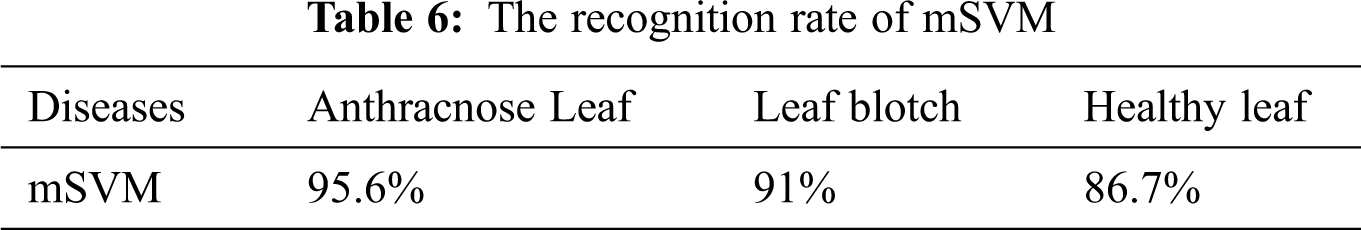
Multiclass SVM: The accuracy of the mSVM in the walnut leaf disease detection is shown in Fig. 9. The overall accuracy of mSVM was 91.1%. The accuracy values of the mSVM for the three image classes are given in Tab. 6.
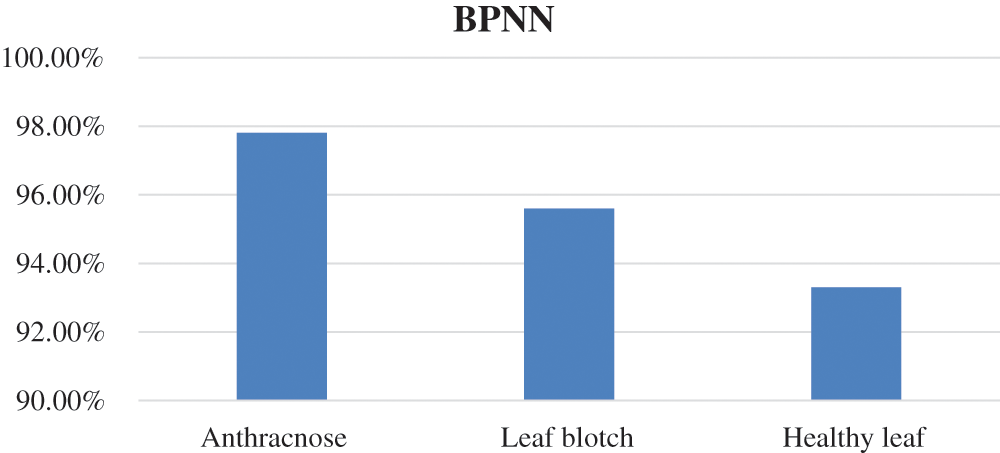
Figure 8: Represent accuracy of BPNN
4.2 Comparison of BPNN and mSVM
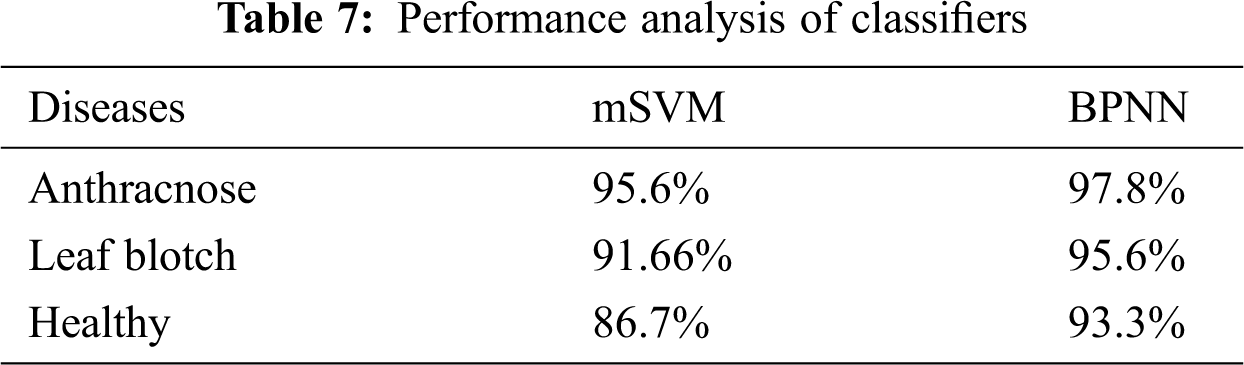
The accuracies of the two classifiers expressed in percentage are given in Tab. 7. The recognition rates of the BPNN classifier for the anthracnose, leaf blotch and healthy leaves were 97.8%, 95.6%, and 93.33%, respectively; the overall accuracy of the BPNN was 95.3%. The recognition rates of the mSVM for the anthracnose, leaf blotch and healthy leaves were 95.6%, 91%, and 86.7%, respectively. The overall accuracy of the mSVM was 91.1%. The accuracy comparison of the two models is shown in Fig. 10, where it can be seen that the BPNN outperformed the mSVM. This could be because the BPNN learned the loss function parameters and changed their values in each iteration. In contrast, in the mSVM, the detection result was mostly based on a fixed value and could not be changed by calculating the error rate. Furthermore, the BP neural networks had strong self-learning and self-adaptive abilities and fast calculation speeds for large samples, which allows the best prediction models in the walnut leaf diseases. Due to the mentioned reasons mentioned above, the BPNN model result was comparatively better than that of the mSVM.
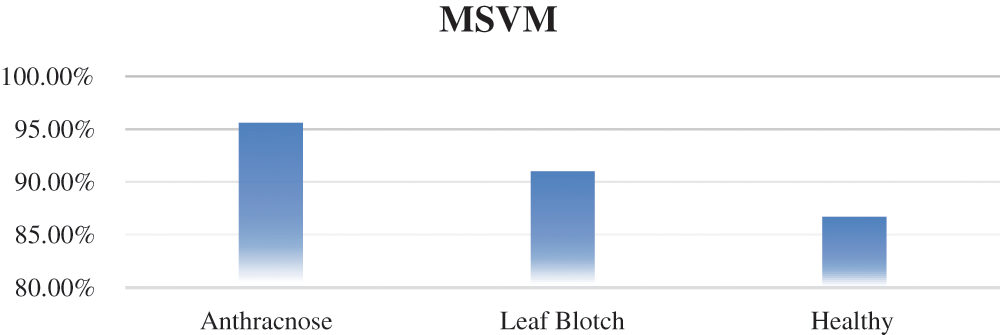
Figure 9: Accuracy of mSVM
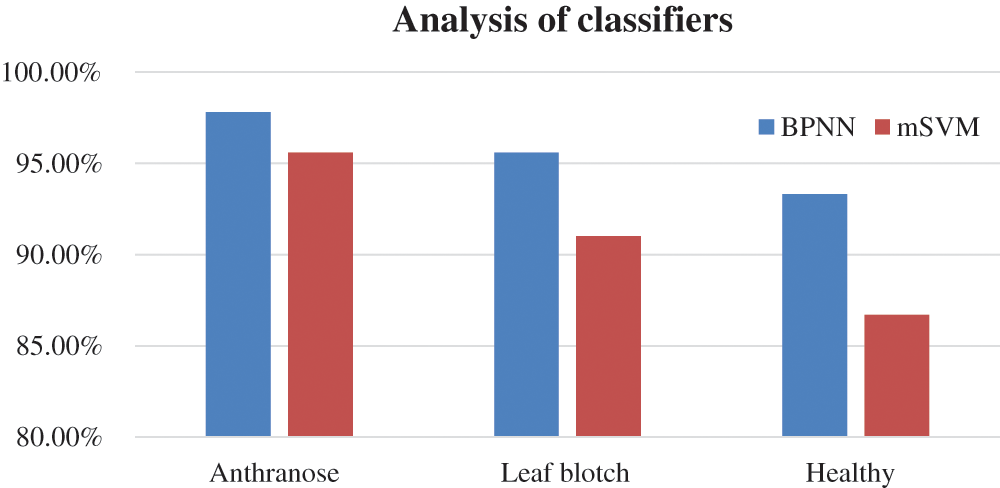
Figure 10: Comparison of classifiers
This paper proposes a machine learning-based method for image-based detection and classification of fungi diseases, such as anthracnose and leaf blotch in walnut leaves. In the proposed method, the input image is pre-processed first, and then the RBG image is converted to the YUV color space. Next, the image is segmented by the Otsu thresholding algorithm, and the color and texture features and an affected area are extracted from the segmented images. The proposed model is trained using 70% of all images and tested using the remaining 30% of the images. In order to illustrate the applicability and performance of the proposed detection model, it is compared with the mSVM model. The experimental results prove the superiority of the BPNN over the mSVM in walnut leaf disease identification and classification. Farmers can use our proposed method for the detection of walnut diseases. Besides the two machine learning-based models analyzed in this study, several other deep learning-based methods have been used in the related literature [25–29]. In future studies, the proposed BPNN model will be compared with these methods.
Funding Statement: This research was financially supported by the Xiamen University Malaysia (Project code: [XMUMRF/2018-C2/IECE/0002]).
Conflicts of Interest: The authors declare that they have no conflicts of interest to report regarding the present study.
1. A. Rehman, L. Jingdong, B. Shahzad, A. A. Chandio, I. Hussain et al., “Economic perspectives of major field crops of Pakistan: An empirical study,” Pacific Science Review B: Humanities and Social Sciences, vol. 1, no. 3, pp. 145–158, 2015.
2. A. Azam and M. Shafique, “Agriculture in Pakistan and its impact on economy. A review,” International Journal of Advanced Science and Technology, vol. 103, pp. 47–60, 2017.
3. M. Sameeullah and T. Karadenİz, “Walnut production status in Pakistan,” Bahçe, vol. 46, no. 2, pp. 113–115, 2017.
4. H. Mudasir and K. Ahmad, “Anthracnose disease of walnut—A review,” International Journal of Environment, Agriculture and Biotechnology, vol. 2, no. 5, pp. 238908, 2017.
5. P. Pollegioni, G. V. Linden, A. Belisario, M. Gras, N. Anselmi et al., “Mechanisms governing the responses to anthracnose pathogen in Juglans spp,” Journal of Biotechnology, vol. 159, no. 4, pp. 251–264, 2012.
6. Z. Chuanlei, Z. Shanwen, Y. Jucheng, S. Yancui and C. Jia, “Apple leaf disease identification using genetic algorithm and correlation-based feature selection method,” International Journal of Agricultural and Biological Engineering, vol. 10, no. 2, pp. 74–83, 2017.
7. T. G. Devi and P. Neelamegam, “Image processing-based rice plant leaves diseases in Thanjavur, Tamilnadu,” Cluster Computing, vol. 22, no. 6, pp. 13415–13428, 2019.
8. S. Khalesi, A. Mahmoudi, A. Hosainpour and A. Alipour, “Detection of walnut varieties using impact acoustics and artificial neural networks (ANNs),” Modern Applied Science, vol. 6, no. 1, pp. 43, 2012.
9. B. Tigadi and B. Sharma, “Banana plant disease detection and grading using image processing,” International Journal of Engineering Science, vol. 6, no. 6, pp. 6512–6516, 2016.
10. M. Bhange and H. Hingoliwala, “Smart farming: Pomegranate disease detection using image processing,” Procedia Computer Science, vol. 58, pp. 280–288, 2015.
11. H. Waghmare, R. Kokare and Y. Dandawate, “Detection and classification of diseases of grape plant using opposite colour local binary pattern feature and machine learning for automated decision support system,” in Proc. 3rd Int. Conf. on Signal Processing and Integrated Networks (SPINNoida: Amity University, pp. 513–518, 2016.
12. A. Awate, D. Deshmankar, G. Amrutkar, G. Amrutkar, U. Bagul et al., “Fruit disease detection using color, texture analysis and ANN,” in Proc. ICGCIoT, Greater Noida, Delhi, India, pp. 970–975, 2015.
13. D. E. Kusumandari, M. Adzkia, S. P. Gultom, M. Turnip and A. Turnip, “Detection of strawberry plant disease based on leaf spot using color segmentation,” In Proc. 2nd Int. Conf. on Mechanical, Electronics, Computer, and Industrial Technology, vol. 1230, no. 1, pp. 012092, 2019.
14. I. S. Areni and R. Tamin, “Image processing system for early detection of cocoa fruit pest attack,” in Proc. 3rd Int. Conf. on Mathematics, Sciences, Technology, Education and Their Applications, vol. 1244, Sulawesi, Selatan, Indonesia, pp. 1, 2019.
15. J. Zhu, A. Wu, X. Wang and H. Zhang, “Identification of grape diseases using image analysis and BP neural networks,” Multimedia Tools and Applications, vol. 79, pp. 14539–14551, 2019.
16. Y. Feng, H. Zhao, X. Li, X. Zhang and H. Li, “A multi-scale 3D Otsu thresholding algorithm for medical image segmentation,” Digital Signal Processing, vol. 60, pp. 186–199, 2017.
17. D. Liu and J. Yu, “Otsu method and k-means,” in Proc. of the 2009 Ninth Int. Conf. on Hybrid Intelligent Systems, Washington, DC, United States, 1, pp. 344–349, 2009.
18. J. Yousefi, Image binarization using Otsu thresholding algorithm. Ontario, Canada: University of Guelph, 2011.
19. P. S. Suhasini, K. S. Krishna and I. M. Krishna, “Content based image retrieval based on different global and local color histogram methods: A survey,” Journal of the Institution of Engineers (IndiaSeries B, vol. 98, no. 1, pp. 129–135, 2017.
20. S. M. Singh and K. Hemachandran, “Image retrieval based on the combination of color histogram and color moment,” International Journal of Computer Applications, vol. 58, no. 3, pp. 27–34, 2012.
21. P. S. Kumar and V. Dharun, “Extraction of texture features using GLCM and shape features using connected regions,” International Journal of Engineering and Technology, vol. 8, no. 6, pp. 2926–2930, 2016.
22. J. Zhu, W. Ang, W. Xiushan and Z. Hao, “Identification of grape diseases using image analysis and BP neural networks,” Multimedia Tools and Applications, vol. 79, no. 21, pp. 14539–14551, 2020.
23. B. Prakash and A. Yerpude, “Identification of mango leaf disease and control prediction using image processing and neural network,” International Journal for Scientific Research & Development, vol. 3, no. 5, pp. 794–799, 2015.
24. S. Suthaharan, “Support vector machine,” in Machine Learning Models and Algorithms for Big Data Classification, Boston, MA: Springer, pp. 207–235, 2016.
25. M. H. Saleem, S. Khanchi, J. Potgieter and K. M. Arif, “Image-based plant disease identification by deep learning meta-architectures,” Plants, vol. 9, no. 11, pp. p.–1451, 2020.
26. K. P. Ferentinos, “Deep learning models for plant disease detection and diagnosis,” Computers and Electronics in Agriculture, vol. 145, pp. 311–318, 2018.
27. S. B. Jadhav, V. R. Udupi and S. B. Patil, “Identification of plant diseases using convolutional neural networks,” International Journal of Information Technology, vol. 2020, no. 1, pp. 1–10, 2020.
28. S. Sladojevic, M. Arsenovic, A. Anderla, D. Culibrk and D. Stefanovic, “Deep neural networks based recognition of plant diseases by leaf image classification,” Computational Intelligence and Neuroscience, vol. 2016, no. 1, pp. 1–11, 2016.
29. K. Subhadra and N. Kavitha, “A hybrid leaf disease detection scheme using gray co-occurance matrix support vector machine algorithm,” International Journal of Recent Technology and Engineering (IJRTE), vol. 8, no. 2S11, pp. 2277–3878, 2019.
 | This work is licensed under a Creative Commons Attribution 4.0 International License, which permits unrestricted use, distribution, and reproduction in any medium, provided the original work is properly cited. |