DOI:10.32604/iasc.2021.018382
| Intelligent Automation & Soft Computing DOI:10.32604/iasc.2021.018382 | |
| Article |
Predicting Heart Disease Based on Influential Features with Machine Learning
Institute of Engineering and Technology, JK Lakshmipat University, Jaipur, 302026, India
*Corresponding Author: Animesh Kumar Dubey. Email: animeshdubey123@gmail.com
Received: 06 March 2021; Accepted: 11 May 2021
Abstract: Heart disease is a major health concern worldwide. The chances of recovery are bright if it is detected at an early stage. The present report discusses a comparative approach to the classification of heart disease data using machine learning (ML) algorithms and linear regression and classification methods, including logistic regression (LR), decision tree (DT), random forest (RF), support vector machine (SVM), SVM with grid search (SVMG), k-nearest neighbor (KNN), and naive Bayes (NB). The ANOVA F-test feature selection (AFS) method was used to select influential features. For experimentation, two standard benchmark datasets of heart diseases, Cleveland and Statlog, were obtained from the UCI Machine Learning Repository. The performance of the machine learning models was examined for accuracy, precision, recall, F-score, and Matthews correlation coefficient (MCC), along with error rates. The results indicated that RF and SVM with grid search algorithms performed better on the Cleveland dataset, while the LR and NB classifiers performed better on the Statlog dataset. Outcomes improved significantly when classification was performed after applying AFS, except for NB, for both datasets.
Keywords: LR; DT; RF; KNN; SVM
Heart disease is a one of the onerous health issues, and several people worldwide are suffering from this disease [1]. According to the World Health Organization (WHO), heart or cardiovascular diseases are responsible for the highest number of deaths worldwide of any disease. Current trends indicate that India will soon rank first in the number of heart disease cases [2]. According to the National Center for Biotechnology Information (NCBI), 23.2 million deaths occurred due to heart disease in the United States (US) in 1990, increasing to 37 million in 2010, an increase of 59% [3]. Heart disease is the preeminent cause of death among those over 30 years of age in Africa [4]. More than 3.8 million deaths in Europe and 1.7 million deaths in the European Union occurred because of heart disease [5]. Large volumes of heart disease data are collected from hospitals globally and can be used to manually estimate disease rates. Nonetheless, the data so far regarding the risk of diseases and their symptoms have not been efficiently translated [6]. Heart disease is commonly accompanied by breathlessness, weakness in the body, and swollen feet [7]. Researchers have attempted to develop techniques for its early detection. Early diagnoses continue to be less effective due to lower accuracy and longer execution time [8]. A diagnosis of heart disease is made by analysis of a patient’s medical history, physical examination, and related symptoms, and the results are not accurate. A computational analysis is accurate but expensive [9]. Deaths due to heart disease are directly proportional to age, signifying that its probability of occurrence increases with age [10]. Several researchers have used the Cleveland and Statlog datasets of the UCI Machine Learning (ML) Repository to detect heart disease [11−12]. The accuracy of ML algorithms can be enhanced through proper balancing of training and testing datasets. Feature selection reduces dimensionality and increases the efficiency and accuracy of classification [13]. Li et al. [14] proposed feature selection methods for different sample sizes. Cai et al. [15] discussed evaluation measures of feature selection to improve the performance of ML algorithms, and highlighted the future challenges of feature selection. Li et al. [16] highlighted the feature selection challenges in big data and discussed its importance in enhancing learning performance.
Various data mining and ML algorithms have been suggested for the early detection of heart disease. Khateeb et al. [17] applied k-nearest neighbor (KNN) classification to predict heart disease with 80% accuracy. Olaniyi et al. [18] proposed a three-phase method based on an artificial neural network (ANN) for heart disease detection in angina, with accuracy of 88.89%. Jabbar et al. [19] developed an ML-based diagnosis system using ANN with feature selection algorithms, and reported good accuracy. Selvakumar et al. [20] developed a structure risk minimum support-based vector machine to predict heart disease that performed better than support vector machine (SVM). Palanappan et al. [21] suggested an expert medical diagnosis system to detect heart disease, using ML prediction models including naïve Bayes (NB), decision tree (DT), and ANN. The highest accuracy, 88.12%, was achieved by ANN. El et al. [22] compared the performance of the Bayesian network, NB, SVM, neural network, C4.5, and DT classifiers as applied to a heart disease dataset, and found NB to perform best. Samuel et al. [23] applied ANN with the fuzzy approach in a medical decision support system for heart disease prediction, and reported 91% accuracy. Liu et al. [24] used relief and rough set techniques to classify heart disease with 92% accuracy. Bharati et al. [25] concluded that different data-mining techniques, such as classification, clustering, association rules, and hybrid algorithms, led to better performance and higher accuracy rates. Haq et al. [26] used a sequential backward selection algorithm for feature selection, and KNN for classification to predict heart disease, with good performance in terms of accuracy. Several researchers have used feature selection algorithms along with classifiers. Wijaya et al. [27] improved the performance of the NB, DT, and KNN classifiers to detect heart disease by applying particle swarm optimization (PSO) for feature selection, using experimental data from the UCI repository. Similarly, Feshki et al. [28] applied PSO with neural network feedforward backpropagation to the diagnosis of heart disease, using the Cleveland Heart Disease Dataset from the UCI ML Repository for validation, and considering 14 of its attributes. An accuracy of 91.94% was achieved. Jabbar et al. [29] used NB classification, with a genetic optimization algorithm to remove redundant features, to predict heart disease. This method achieved the highest accuracy compared to all other methods. Ali et al. [30] refined the features and resolved the problems of overfitting and underfitting with the model, using deep neural networks to eliminate irrelevant features. The accuracy was 93.33%. Yang et al. [31] proposed a prediction model for heart disease using an optimized fuzzy inference system based on an adaptive network with linear discriminant analysis. Yekkala et al. [32] analyzed methods, such as bagged tree, AdaBoost, and random forest (RF) with PSO to predict the occurrence of heart disease, with bagged tree and PSO achieving the highest accuracy. Paul et al. [33] used a genetic algorithm to diagnose heart disease, with the assistance of a fuzzy decision support system, with 80% accuracy. Dubey et al. [34,35] suggested different variations of clustering algorithms for disease detection.
The present research work proposes an ML-based method to predict heart disease. Linear regression and classification methods, such as logistic regression (LR), DT, RF, SVM, SVM with grid search (SVMG), KNN, and NB, are used, and ANOVA F-test feature selection (AFS) is applied for feature selection. The major objectives of this research are:
• the study and analysis of the effect of various ML algorithms in the classification of heart diseases;
• to analyze and predict the effects of attributes and their correlation on heart disease datasets;
• to analyze the combined performance of ML algorithms and feature selection (FS).
We achieved these objectives by studying the implications of ML models and prediction strategies, based on the model design and implementation with the feature disease classification.
Experiments were performed on two standard benchmark heart disease datasets, Cleveland (303 instances) and Statlog (270 instances), from the UCI ML Repository [36]. Some 14 of their 76 attributes are used in most published studies [37]. These are age, sex, chest pain (cp), resting blood pressure (trestbps), cholesterol (chol), fasting blood sugar (fbs), resting electrocardiogram (restecg), maximum heart rate achieved (thalach), exercise-induced angina (exang), ST depression induced by exercise relative to rest (oldpeak), slope of peak exercise ST segment (slope), number of major vessels (ca), thalassemia (thal), and predicted value (target). Target values of 0 and 1 respectively indicate the non-appearance and appearance of heart disease. For accurate prediction and analysis, the following classification methods were applied to the datasets. Regression was used to determine the correlation between attributes, and the AFS method [38] to select influential features.
2.1 Linear and Nonlinear Regression
Linear regression describes the relation between the target and predictors using a straight line. LR is a supervised learning method of classification used to predict target variables [39,40].
DT can resolve regression and classification problems using a tree representation. Each leaf node in a tree represents a class label, and internal nodes represent attributes [41].
In RF, multiple decision trees are created during training, and the final prediction is based on the predictions obtained from all of them [42].
KNN is an ML algorithm that be used for both classification and regression [43]. Its performance relies mainly on the value of k and the distance between neighbors.
SVM is a supervised learning method that can be used for classification and regression [44]. An optimal combination of parameters will enhance its performance. This can be achieved by a grid search, which also helps to avoid overfitting [45].
NB classification utilizes the concept of Bayes’ theorem of probability, which is based on the concept of conditional probability, such as an event (E) will happen given that another event (E’) has already happened [46]. Fig. 1 shows a flow diagram of our approach.
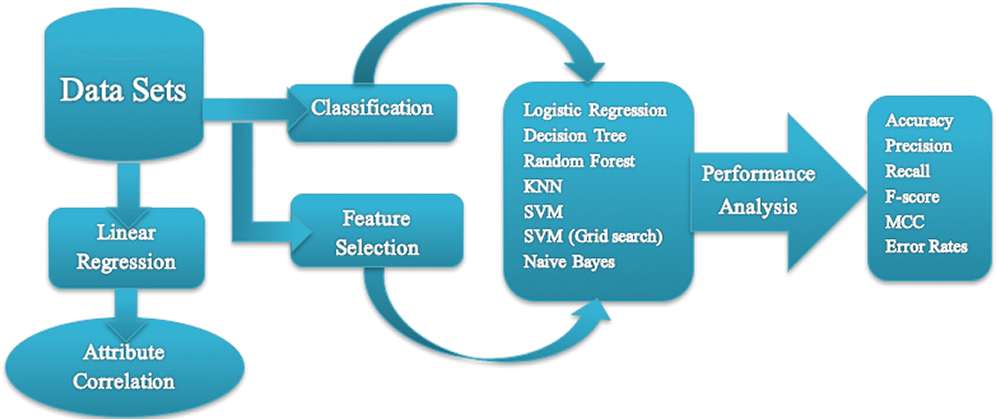
Figure 1: Flowchart of the proposed work
3 Experimental Results and Analysis
Classification algorithms were evaluated on the heart disease datasets mentioned above. Experiments were performed on an Intel Pentium G3220T CPU at 2.20 GHz, with a 32-bit Windows 7 operating system. Python and tkinter were used for analysis and graphical representation. We present the experimental results from the application of linear regression and classification methods such as LR, DT, RF, KNN, SVM, SVMG, and NB, along with AFS, on the heart disease datasets.
3.1 Result Based on Linear Regression
The heat maps in Fig. 2 show the correlations between the features of datasets. A heat map is a two-dimensional representation of data using colors to indicate values, which helps in visualizing the data. Linear regression uses coefficients to define the relationship between independent and dependent variables. Fig. 3 presents the coefficient of each attribute corresponding to the target attribute of both datasets. Coefficients of attributes can be either positive or negative, where a positive coefficient indicates a proportional relationship, and a negative value indicates inverse proportionality. Hence the target value increased with cp in both datasets, and it decreased with the increase in fbs in the Statlog dataset. The performance of the linear regression model was evaluated based on the coefficient of determination (R2), mean absolute error (MAE), mean squared error (MSE), and root mean squared error (RMSE).
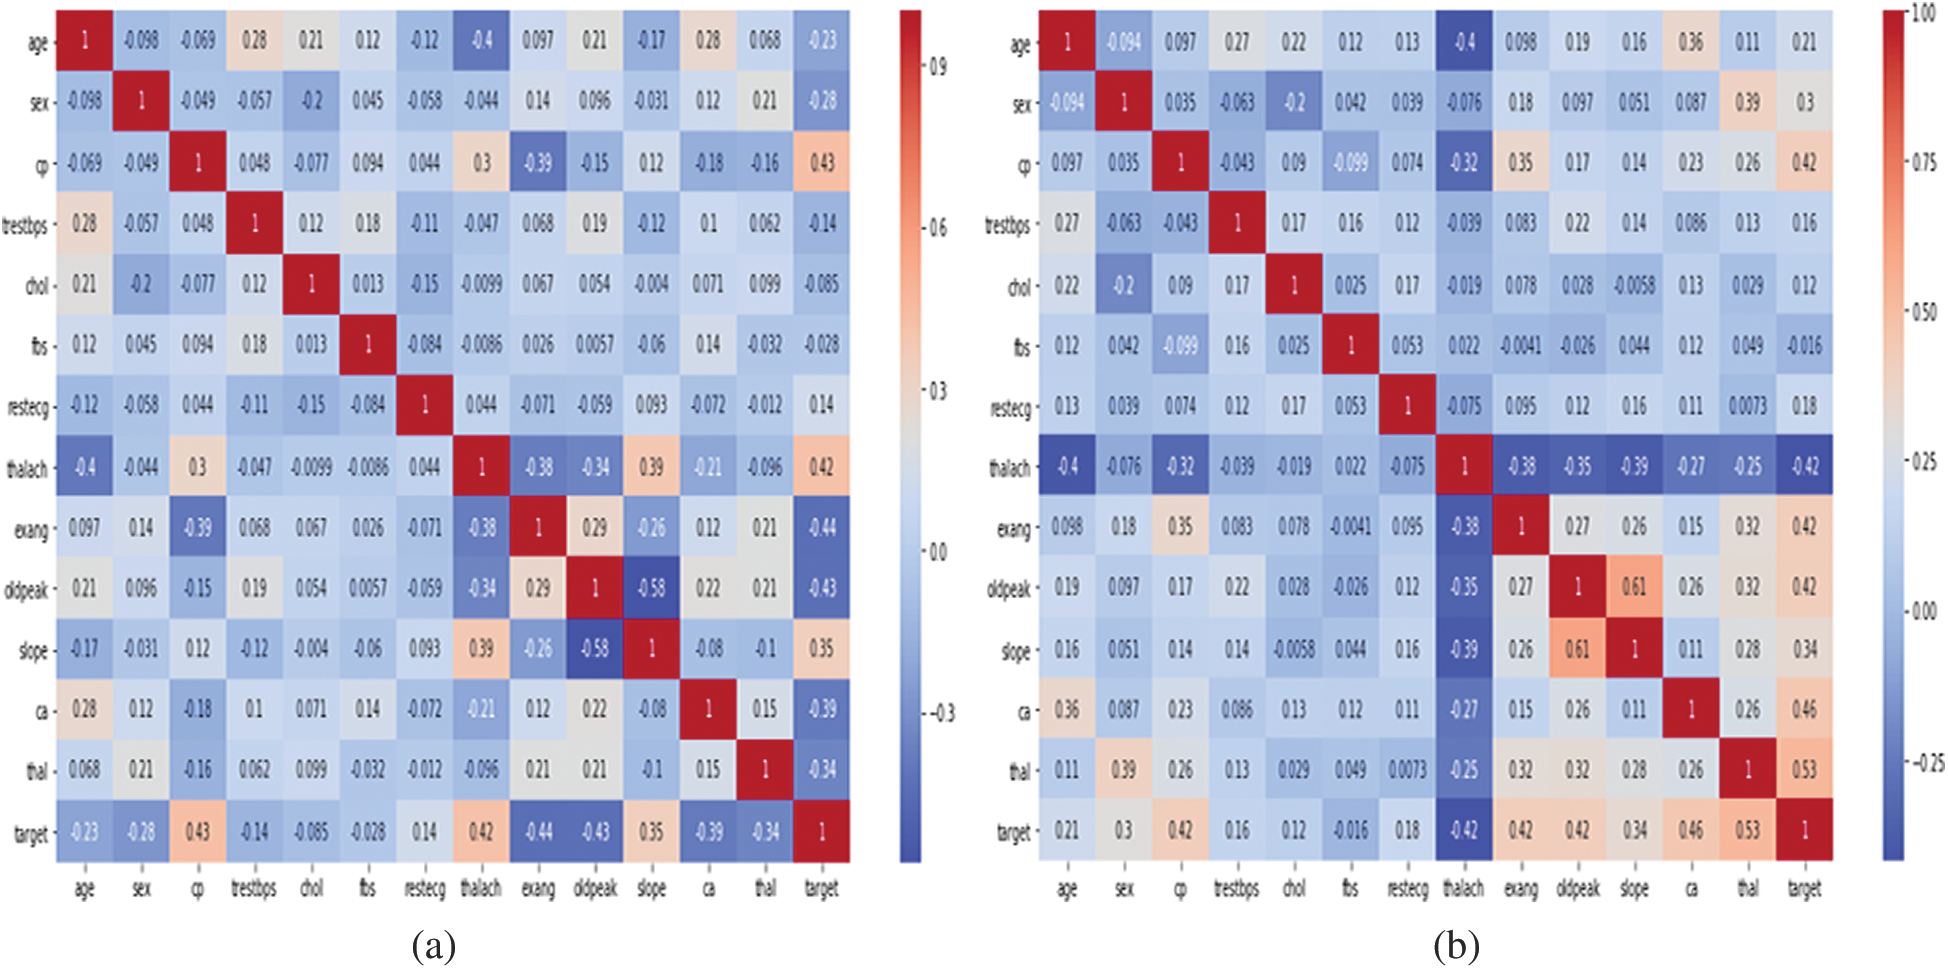
Figure 2: Representation of correlation features of cleveland and statlog dataset through heat map. (a) Cleveland. (b) Statlog
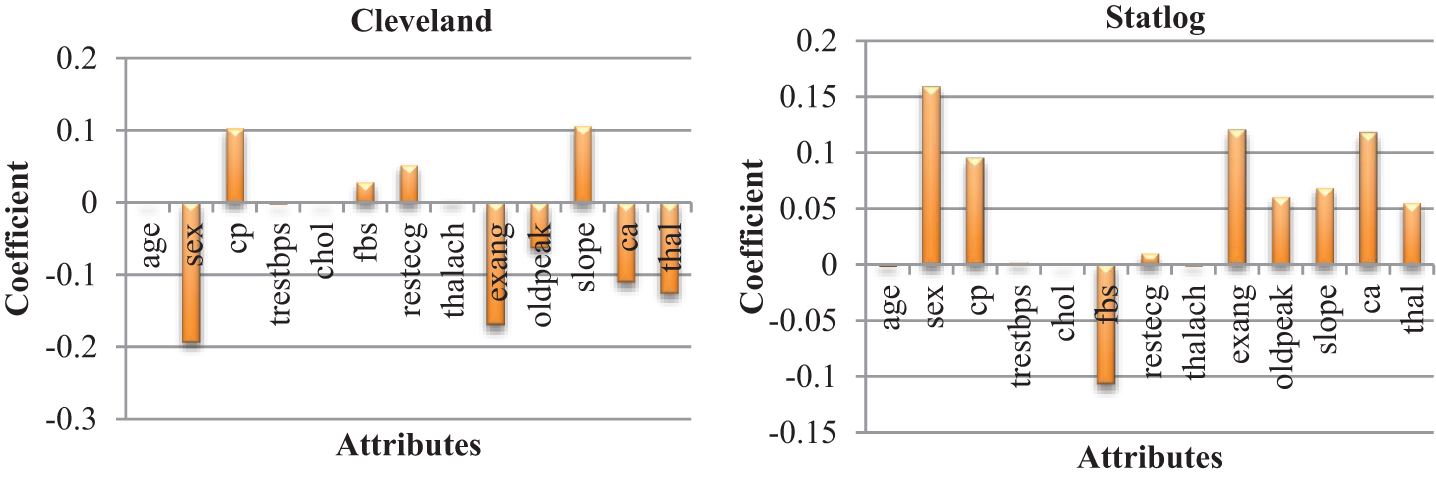
Figure 3: Coefficient of each attributes of heart diseases datasets
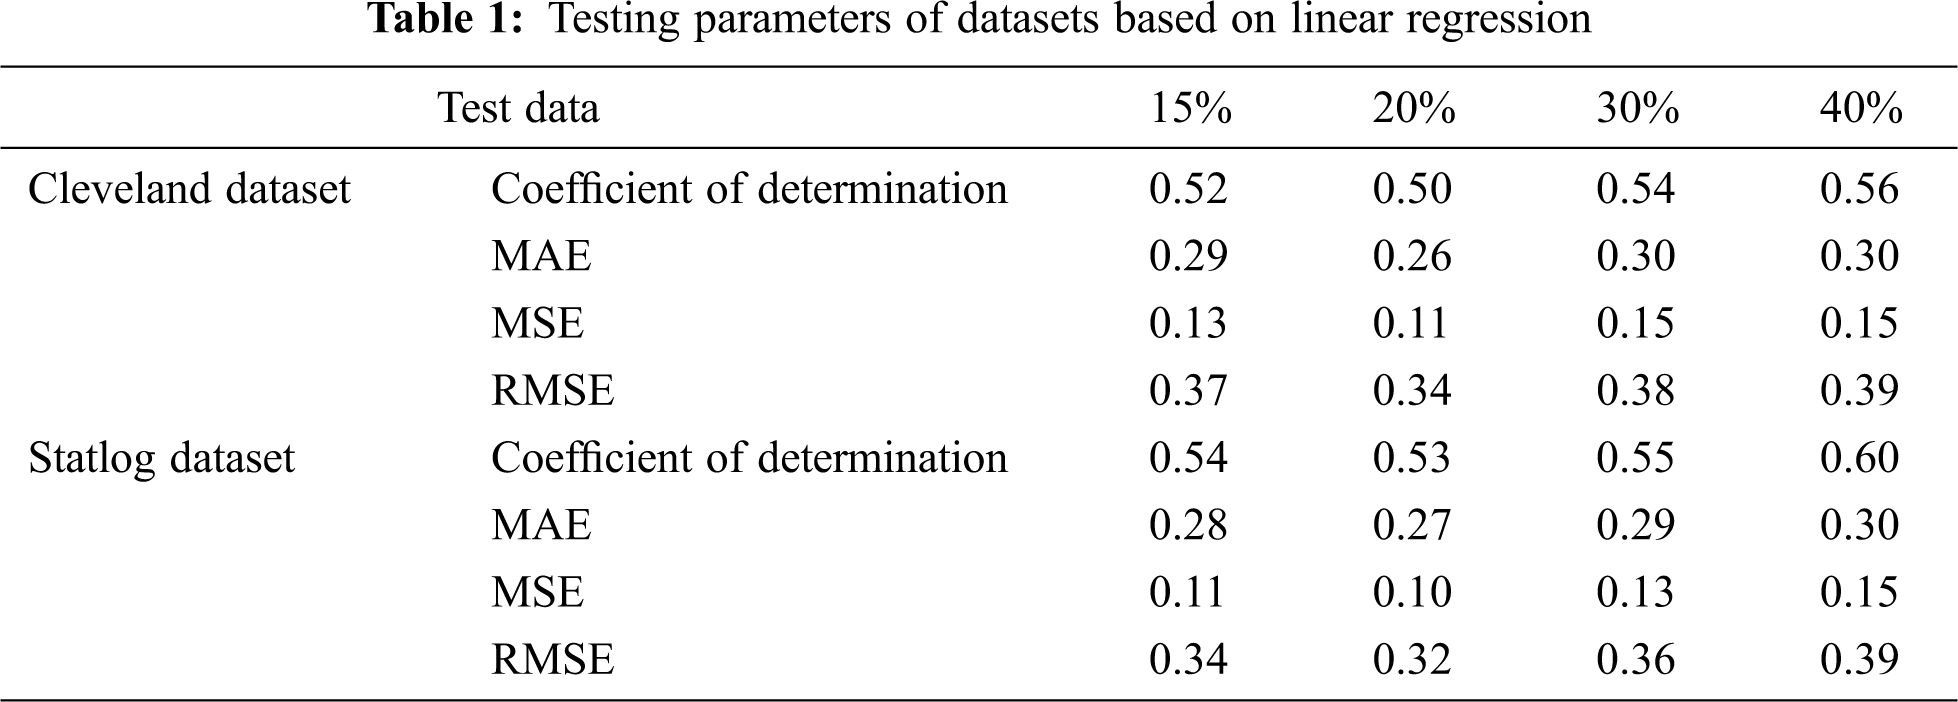
The coefficient of determination represents how strong the values fit compared to the original values. Its value ranges from 0 to 1; the higher the better. MAE is the variation between the original and forecast values, obtained by averaging the absolute difference over the dataset. RMSE is the square root of the mean squared error.
Tab. 1 presents the testing parameters of linear regression based on both datasets, where the test data was considered from 15% to 40%. The highest coefficient of determination of 56% for the Cleveland dataset and 60% for the Statlog dataset was obtained for 40% of the test data, whereas the minimum error was observed for 20% of the test data.
3.2 Result Based on Classification Methods Without AFS
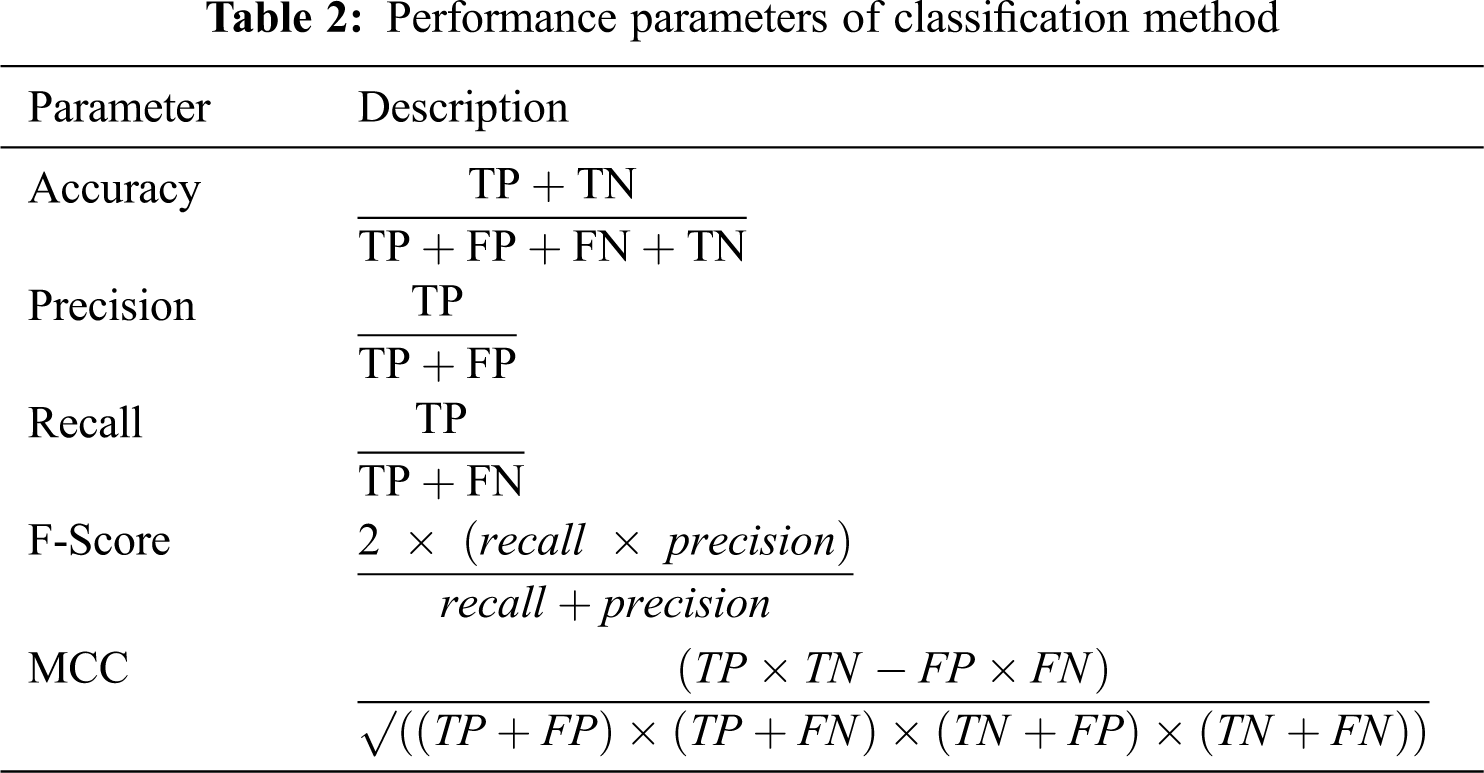
We evaluated the performance of the classification model by accuracy, precision, recall, F-Score, and Matthews correlation coefficient (MCC), as described in Tab. 2. TP indicates true positive, TN is true negative, FP is false positive, and FN is false negative.
Tabs. 3 and 4 present the accuracy, precision, recall, F-score, MCC values, and error rates (MAE and RMSE). Precision, recall, and F-score values are either 0 or 1, with 0 representing the non-appearance of heart disease and 1 representing its appearance. Here, the test data were considered from 15% to 40%. LR performed well on both datasets. In terms of classification reports and error rates, LR performed better when the test data were closer to 20%. Similar to LR, DT performed better with the 20% test data in terms of both classification and error rates. RF performed better than DT in all aspects for both datasets. Using this method, the highest accuracies of 87% for the Cleveland dataset and 89% for the Statlog dataset were obtained with 20% test data. The classifier performed better with the 20% test data on both datasets. SVM performed well, with the highest accuracy value, 87% (with 20% testing data), for both datasets. Tab. 4 shows that the performance of SVM may be improved by adding grid search. NB performed well with 20% test data, achieving 87% accuracy and 74% MMC for the Cleveland dataset, and 91% accuracy, and 81% MMC for Statlog. Because the value of k in KNN plays an important role, different values were selected based on their error rates, as presented in Figs. 4 and 5. The minimum error containing the K value corresponding to the test data percentage was used for classification in both datasets to achieve the maximum accuracy. As seen in Figs. 4 and 5, the minimum error rates containing k values were 16, 11, 10, and 19 for 15%, 20%, 30%, and 40% testing data, respectively, for the Cleveland dataset, with corresponding values of 19, 19, 17, and 3 for the Statlog dataset.
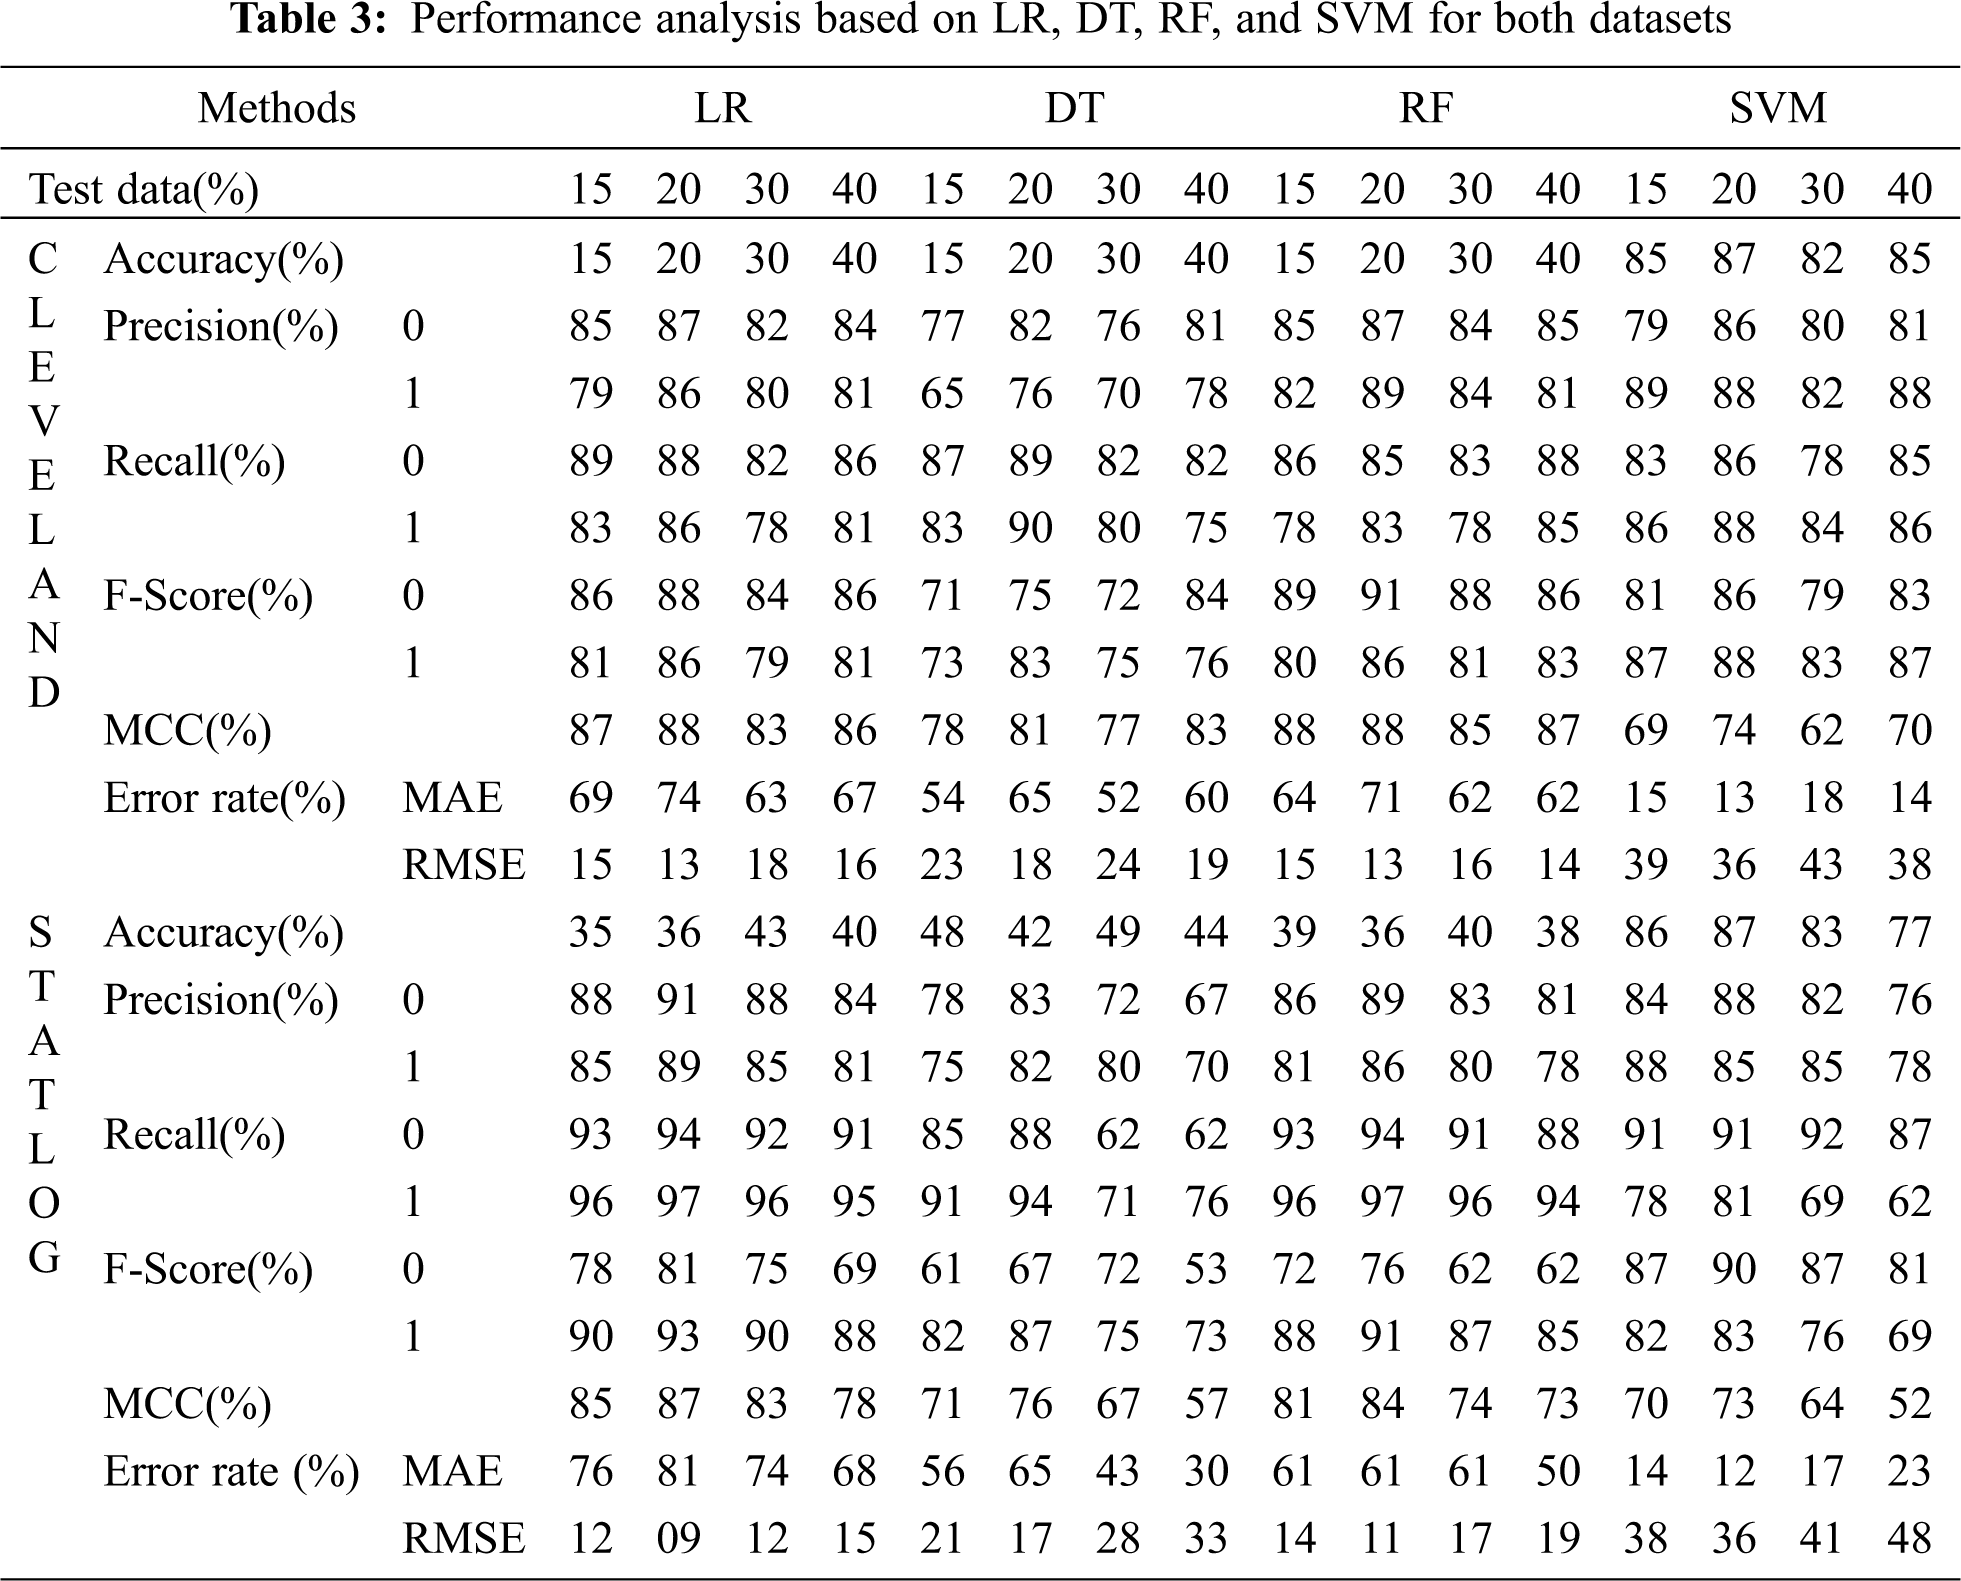
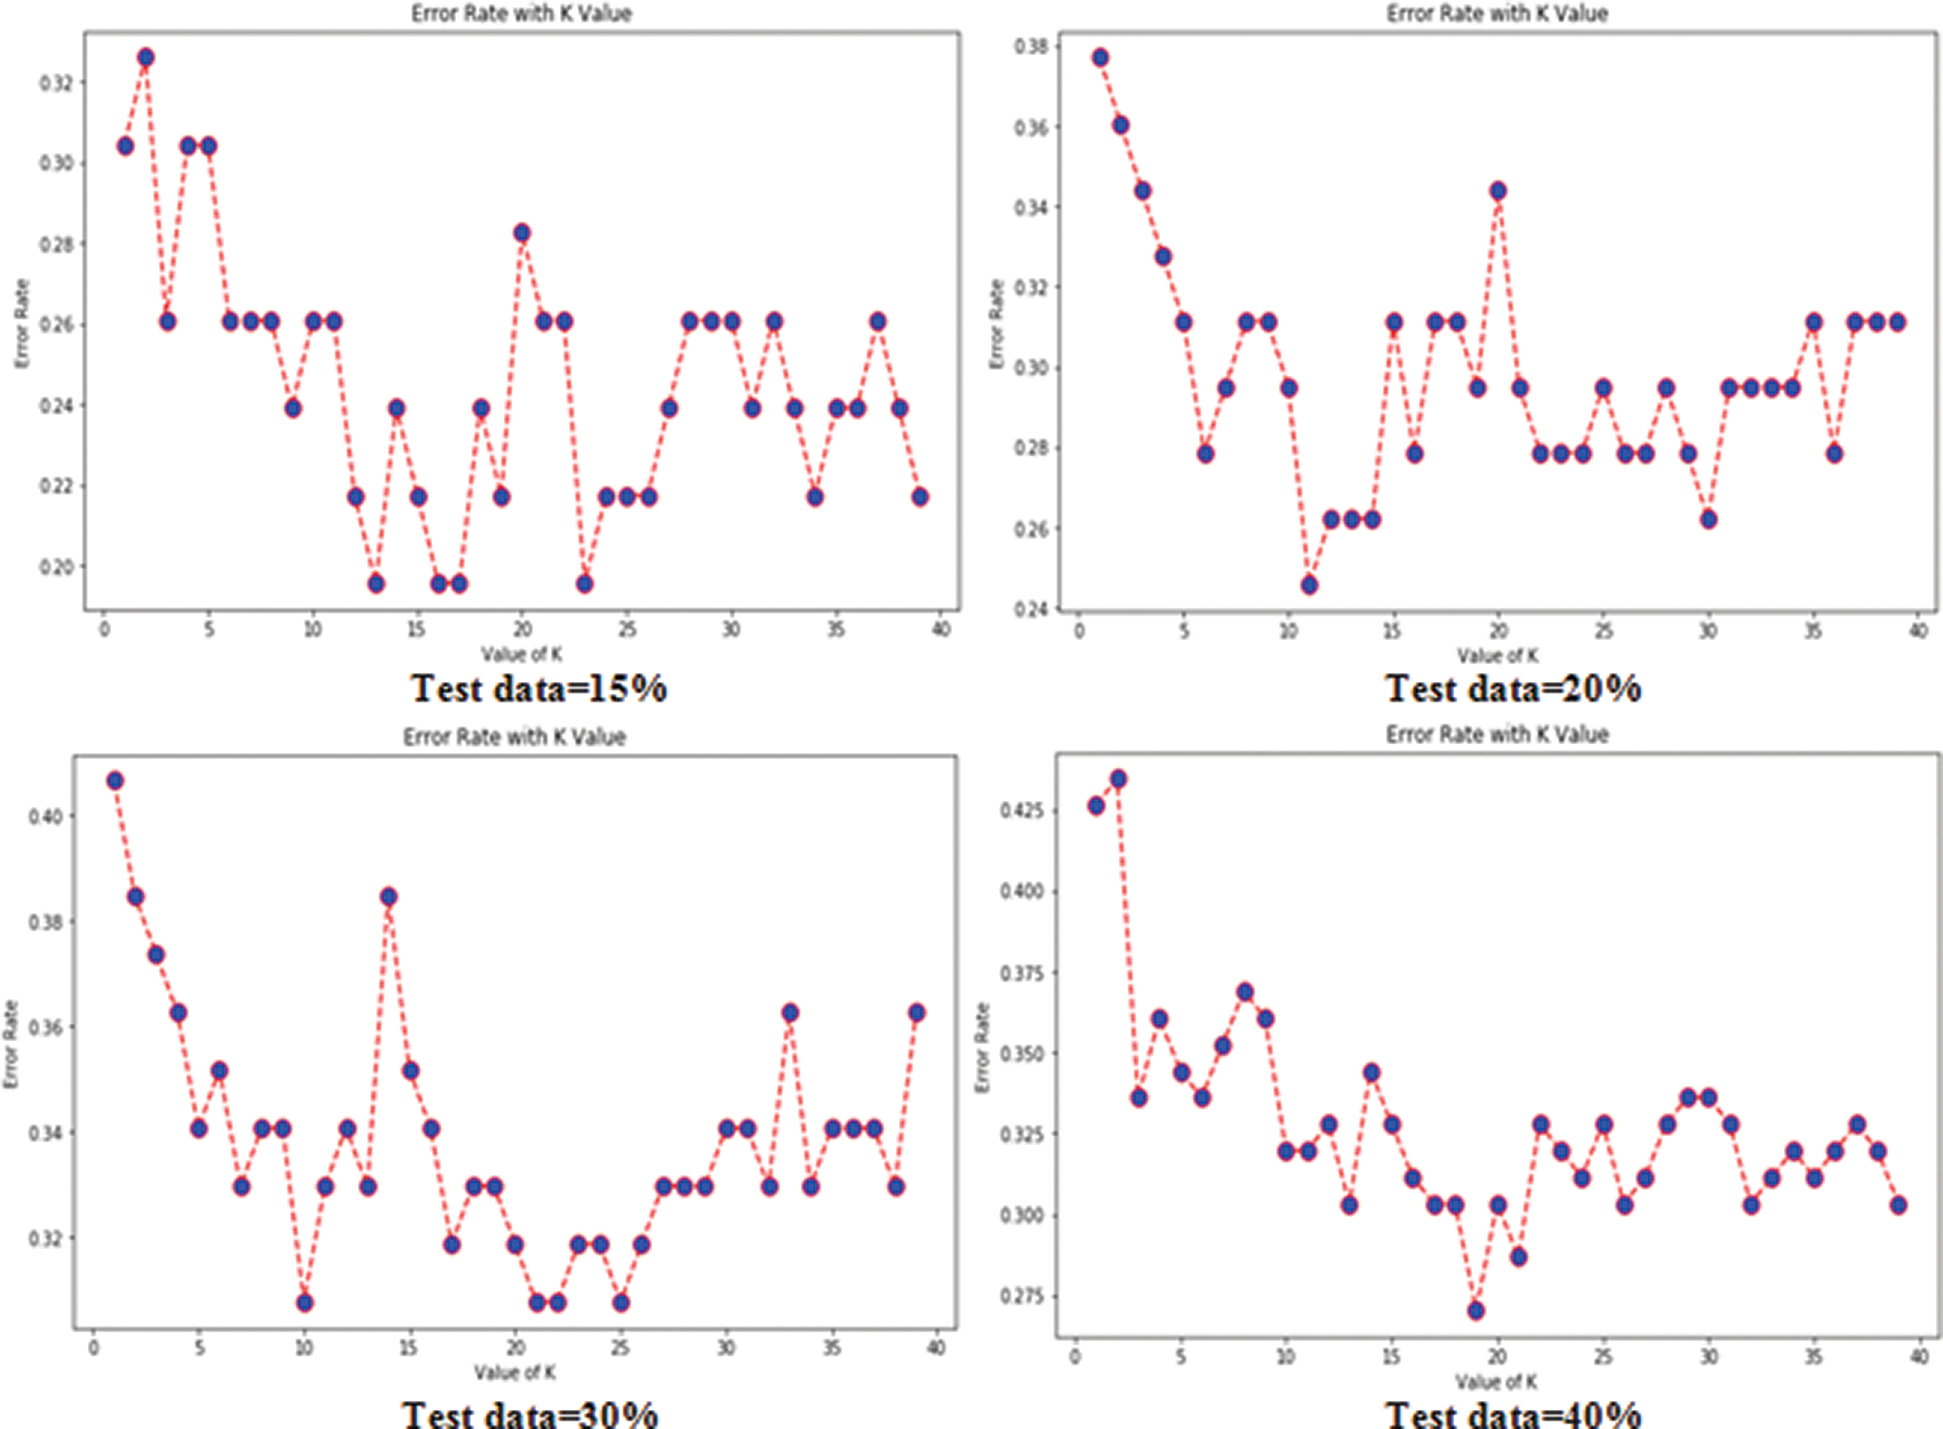
Figure 4: Error rates with value of K in cleveland dataset in case of KNN
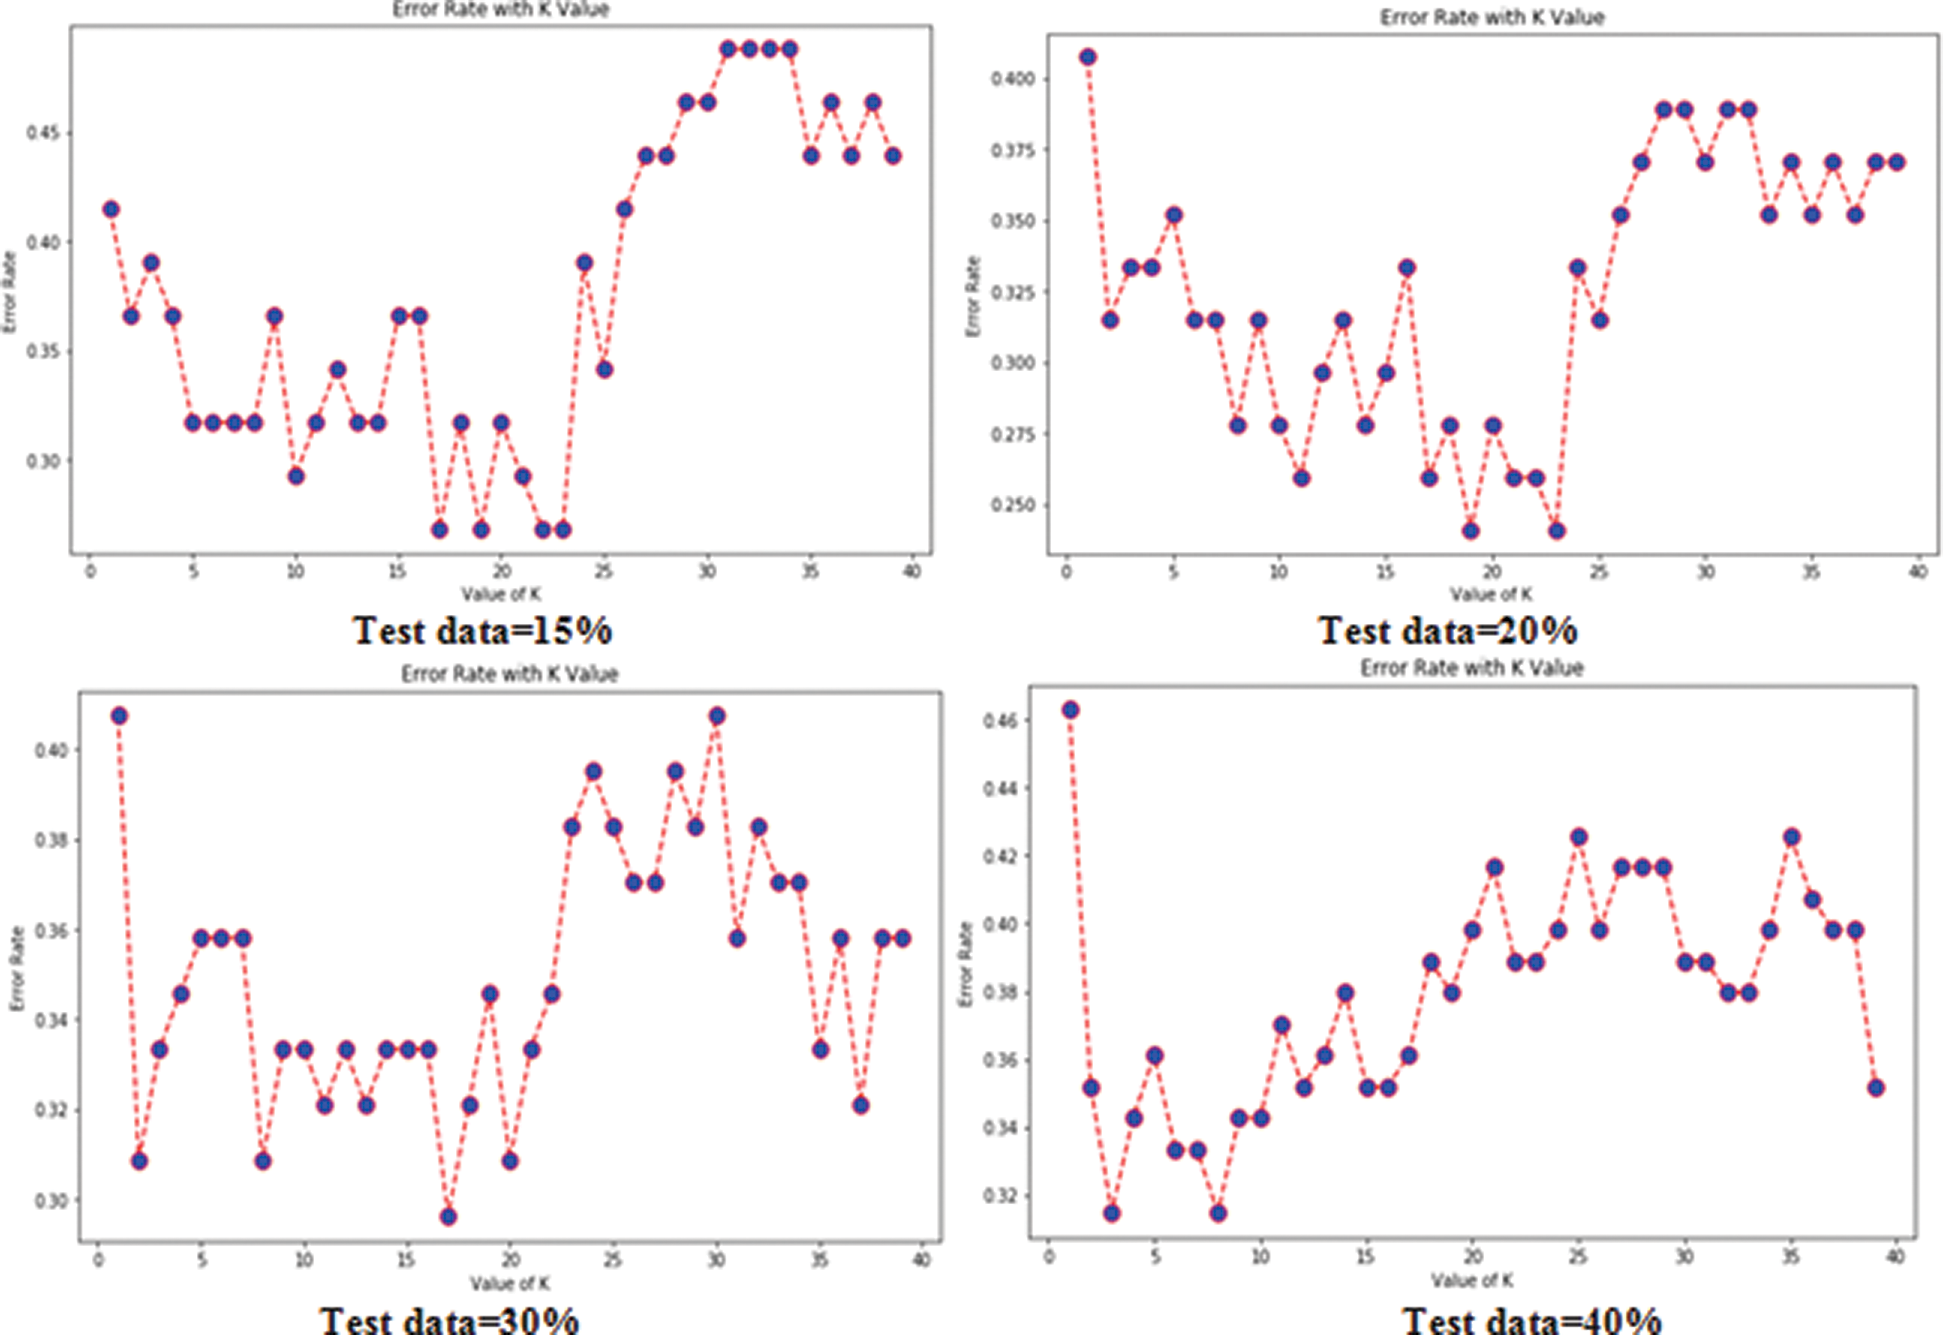
Figure 5: Error rates with value of K in statlog dataset in case of KNN
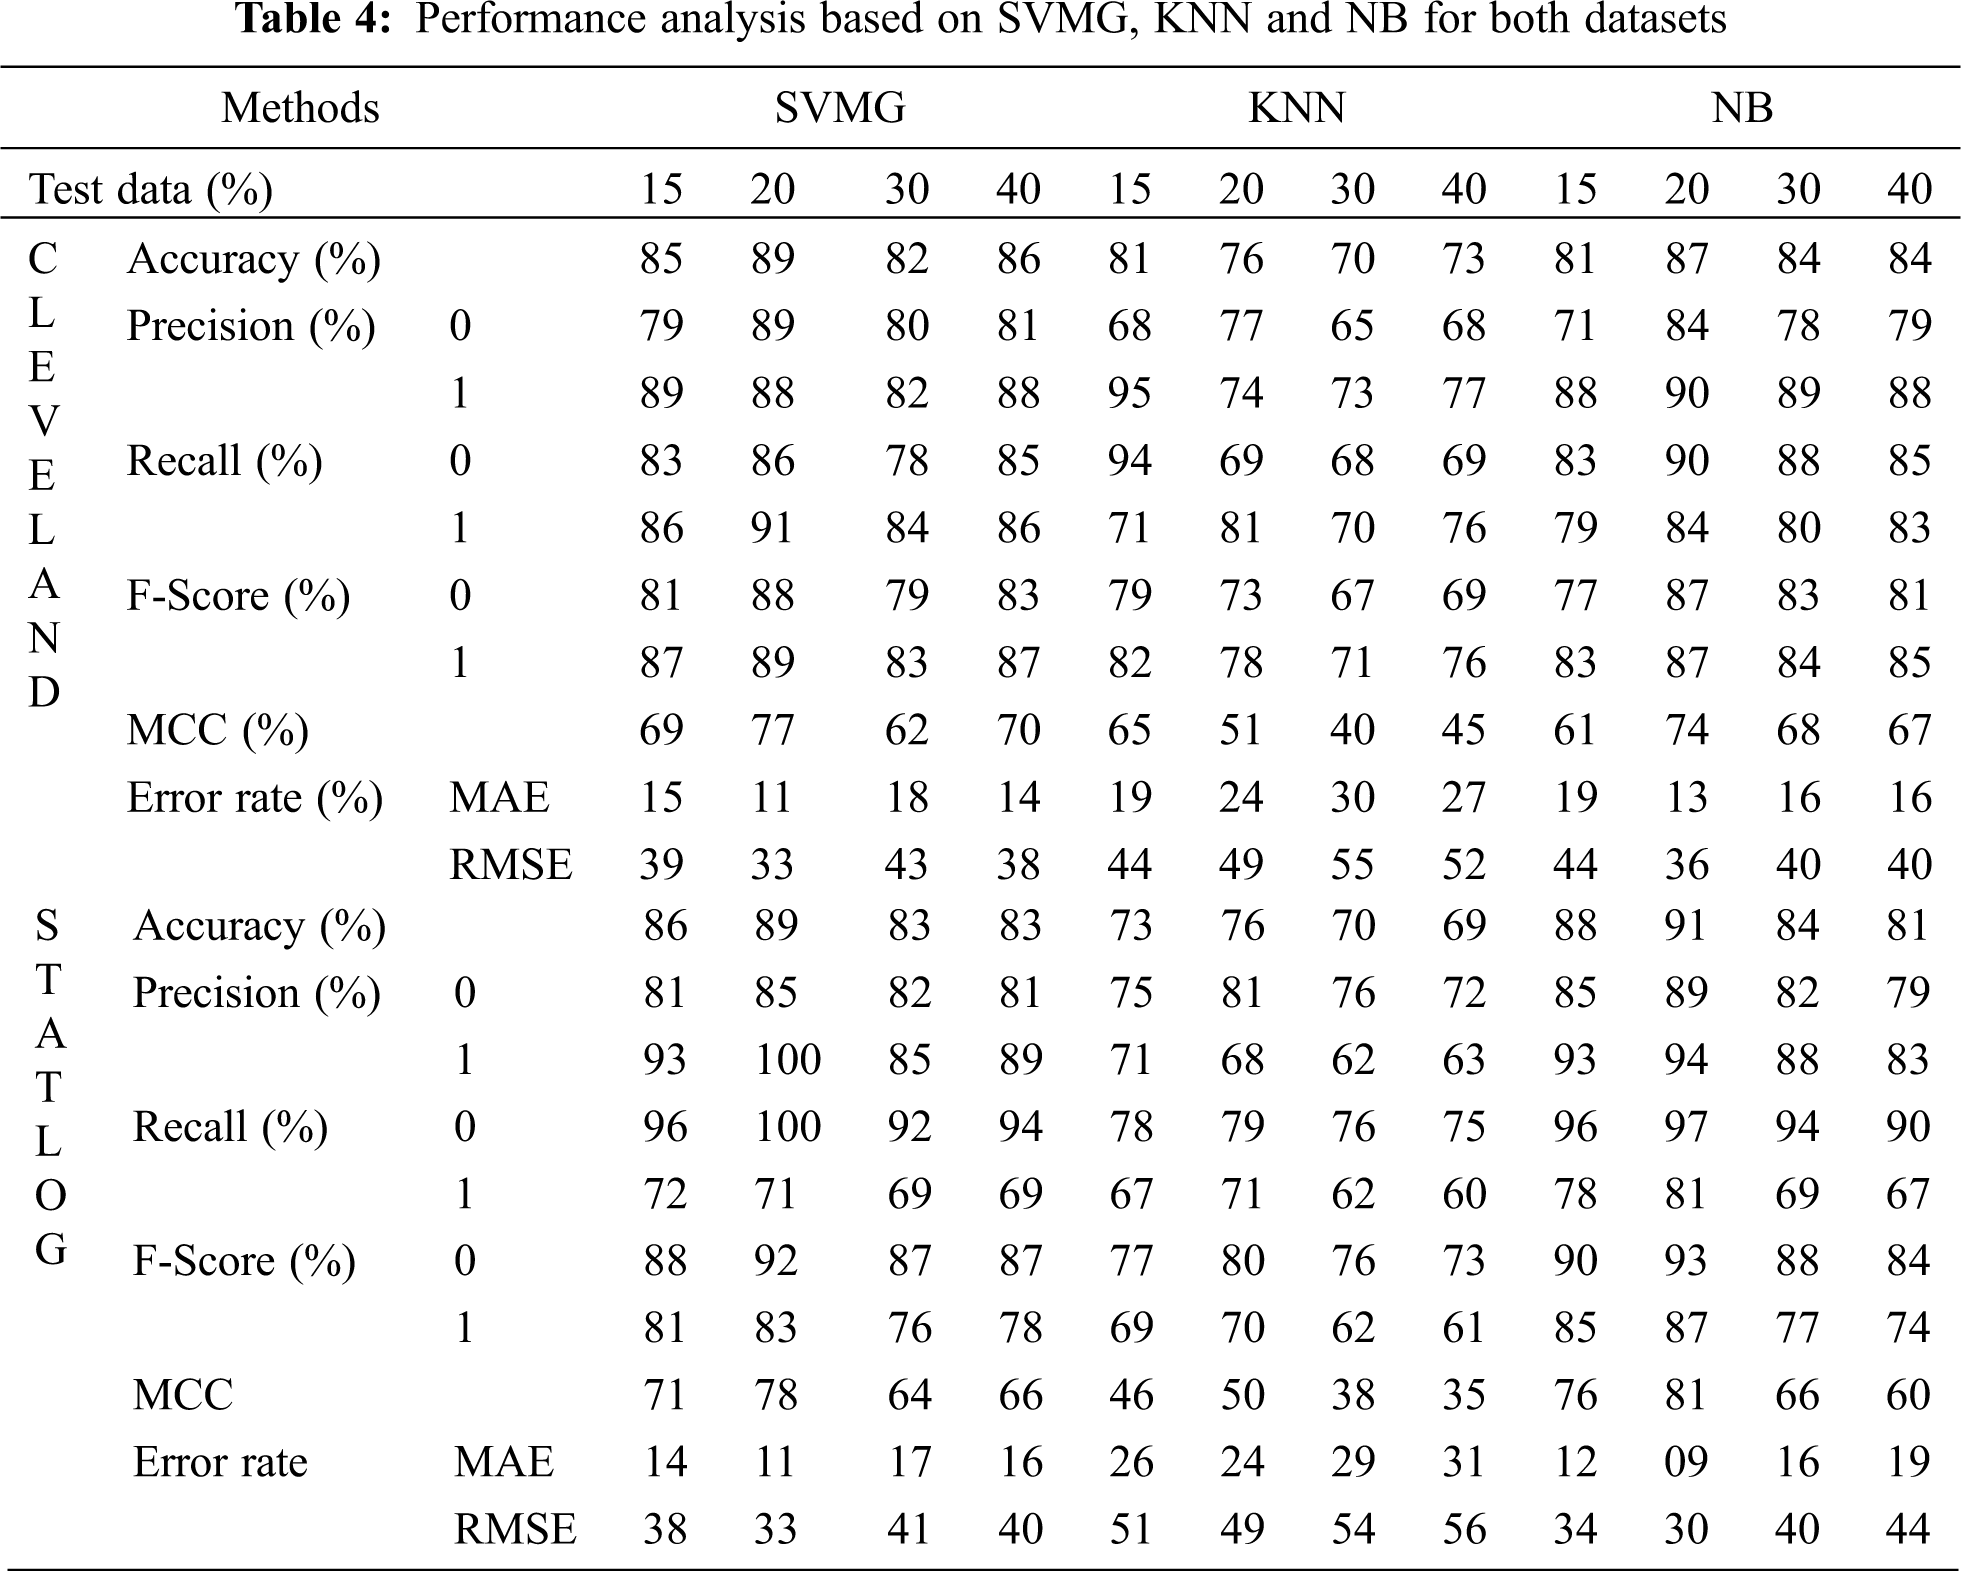
Fig. 6 compares the classification algorithms on accuracy. The highest accuracy was achieved by SVM with grid search, and was 89% (with 20% testing data) for the Cleveland dataset. LR and NB had 91% accuracy for the Statlog dataset. Fig. 6 shows that suitable accuracy was achieved by all algorithms except KNN on both datasets with 20% test data. Only KNN demonstrated superior accuracy with the test data of 15% for the Cleveland dataset.
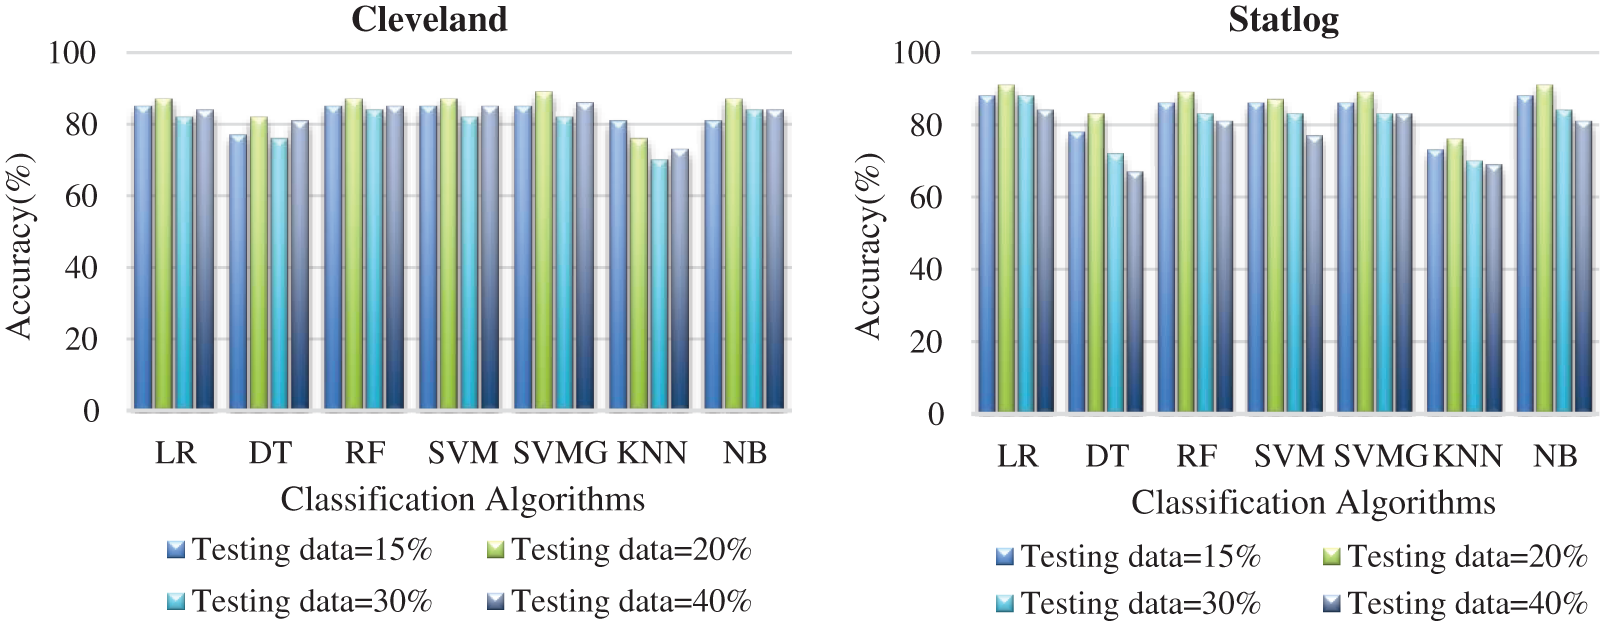
Figure 6: Comparison of classification algorithms with their accuracy for both datasets
Fig. 7 compares the classification algorithms in terms of precision. The highest precision was the 89% achieved by SVM with grid search (with 20% testing data) for the Cleveland data. SVM with grid search, LR, and NB achieved the highest precision of 91% for the Statlog dataset. Fig. 8 compares the classification algorithms in terms of recall. SVM with grid search achieved the highest recall, 89% (with 20% testing data), for the Cleveland data. LR and NB achieved the highest recall of 91% for the Statlog dataset. Fig. 9 compares the classification algorithms in terms of error rates. SVM with grid search achieved the minimum error rate, 0.11 (with 20% testing data), for the Cleveland dataset, and the minimum error rate of 0.09 was achieved by LR and NB on the Statlog dataset. All classification algorithms except KNN performed well with 20% testing data on the Cleveland dataset.
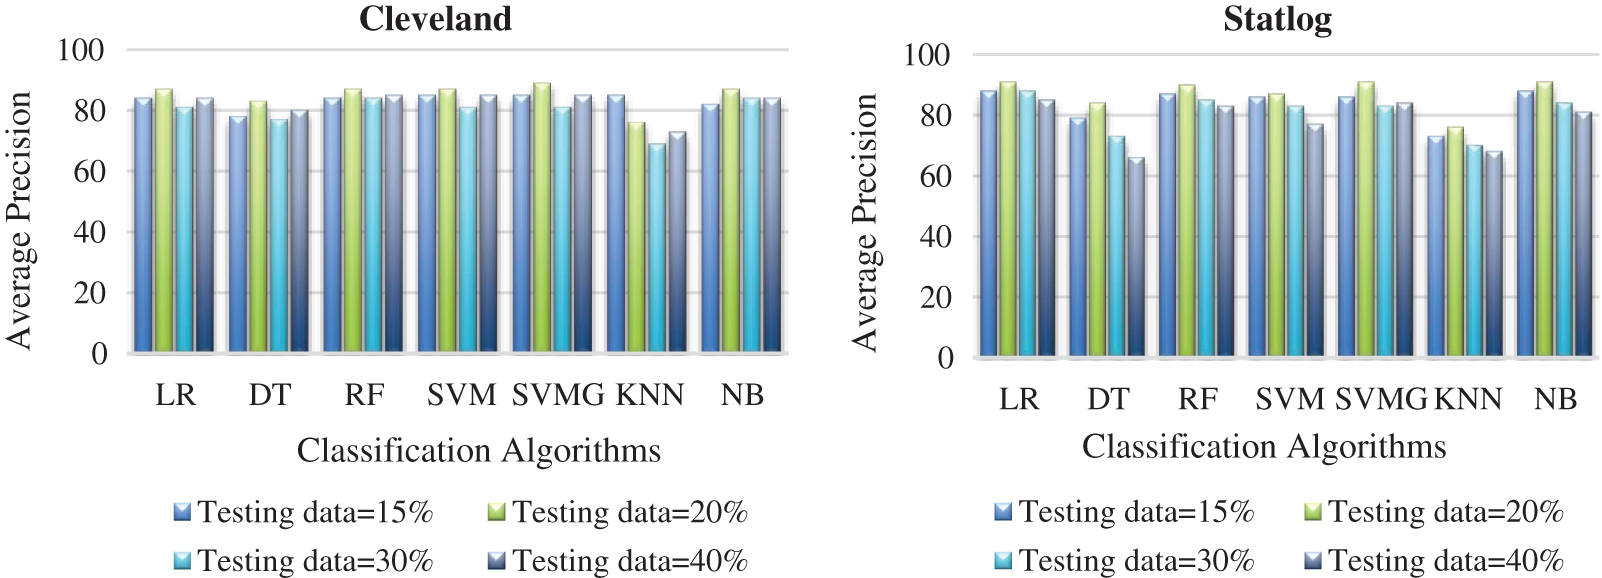
Figure 7: Comparison of classification algorithms with their average precision for both datasets
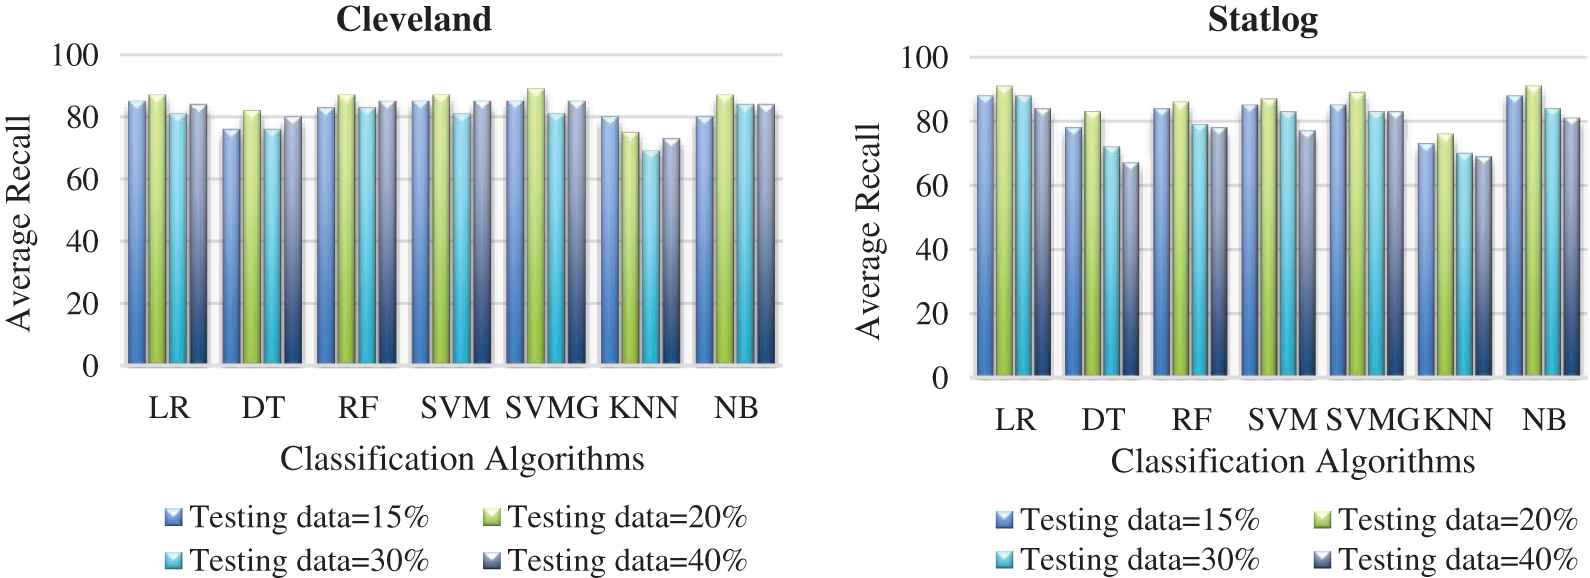
Figure 8: Comparison of classification algorithms with their average recall for both datasets
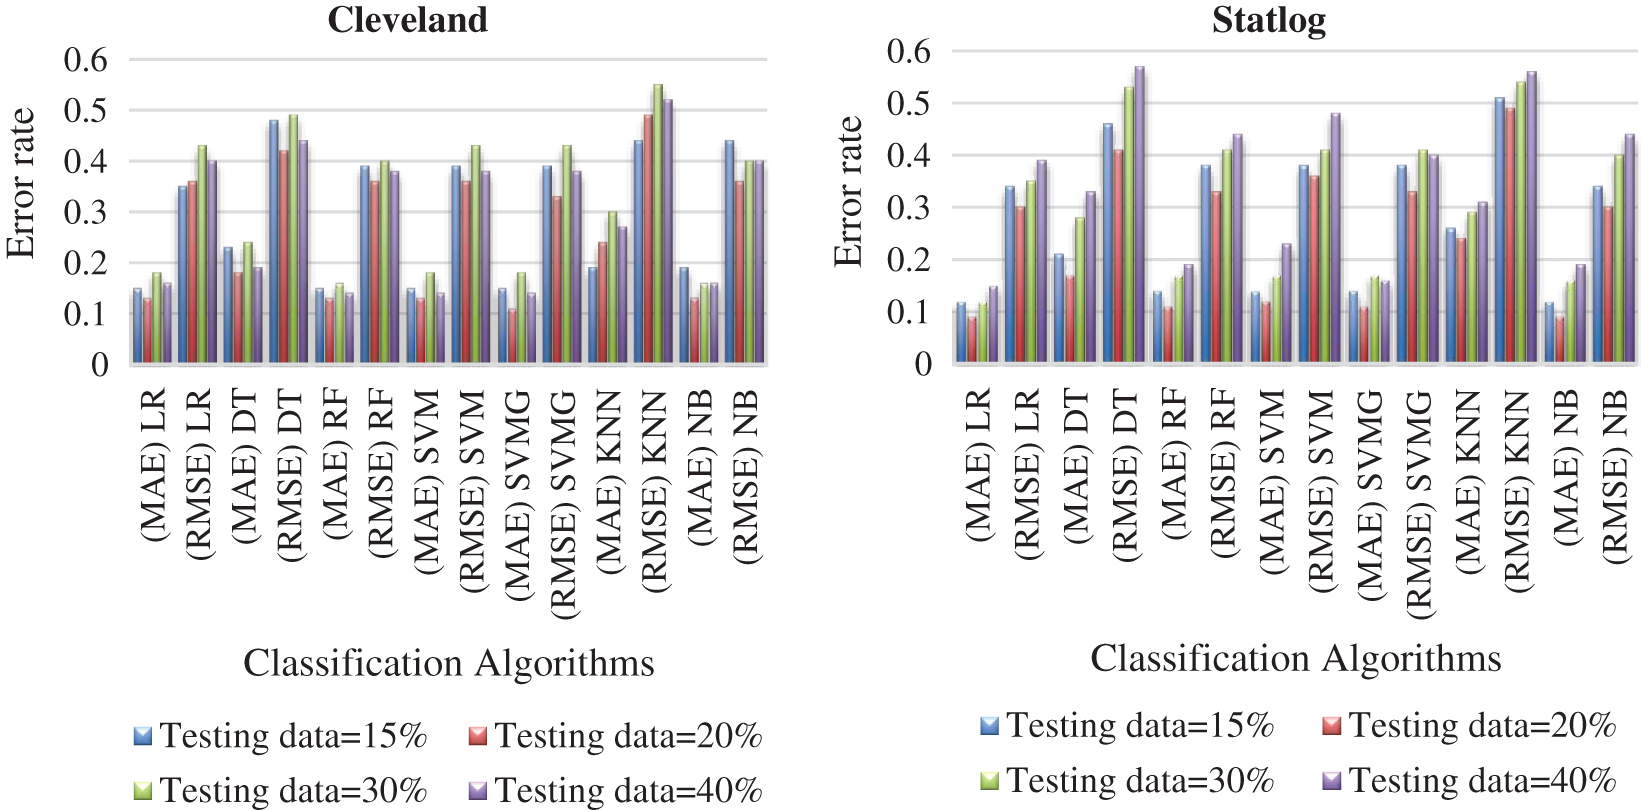
Figure 9: Comparison of algorithms with their error rate for both datasets
3.3 Results Based on the Classification Methods With AFS
Fig. 10 presents the score of each feature calculated using the AFS method for both datasets. The top seven features were cp, restecg, thalach, exang, oldpeak, slope, ca, and thal, which were selected to predict heart diseases. High-scoring features were more effective than low-scoring features.
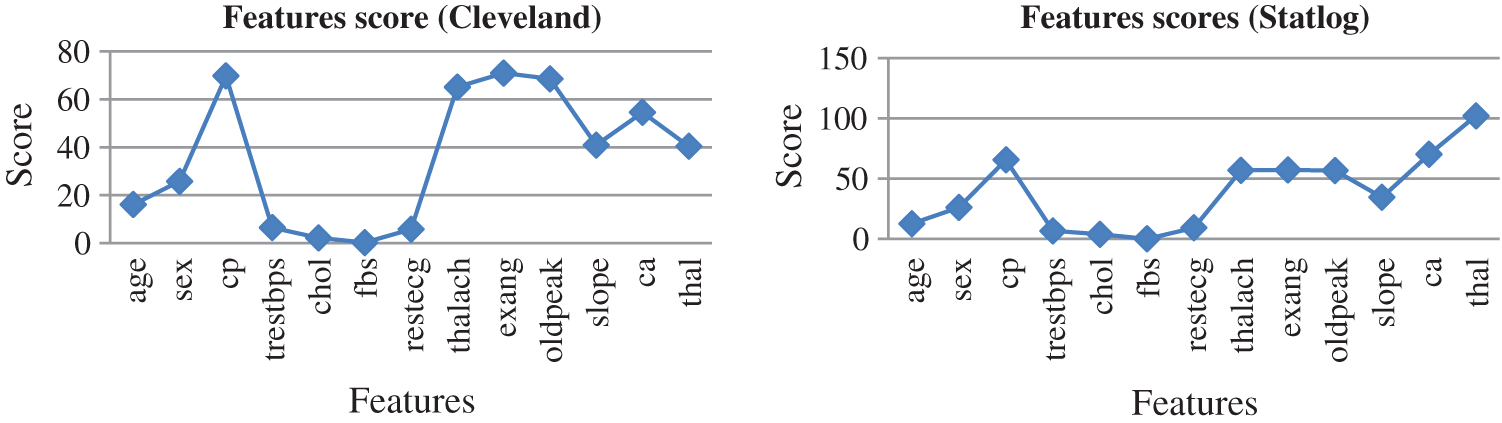
Figure 10: Feature scores for both dataset by using AFS method
Tab. 5 presents the accuracy, precision, recall, F-score, MCC values, and error rates (MAE and RMSE) for the top seven selected features on both datasets. With 89% accuracy, LR and SVM performed better than DT, RF, KNN, and NB on the Cleveland dataset with the selected features. For the Statlog dataset, LR performed better, with an accuracy of 93% with the selected features. Here, 20% of the data was considered as the test data. Different K values were selected based on their error rates, as shown in Fig. 11, and the minimum error containing k value was used for classification in both datasets to achieve the maximum accuracy. We used k = 18 for the Cleveland dataset and k = 3 for the Statlog dataset.
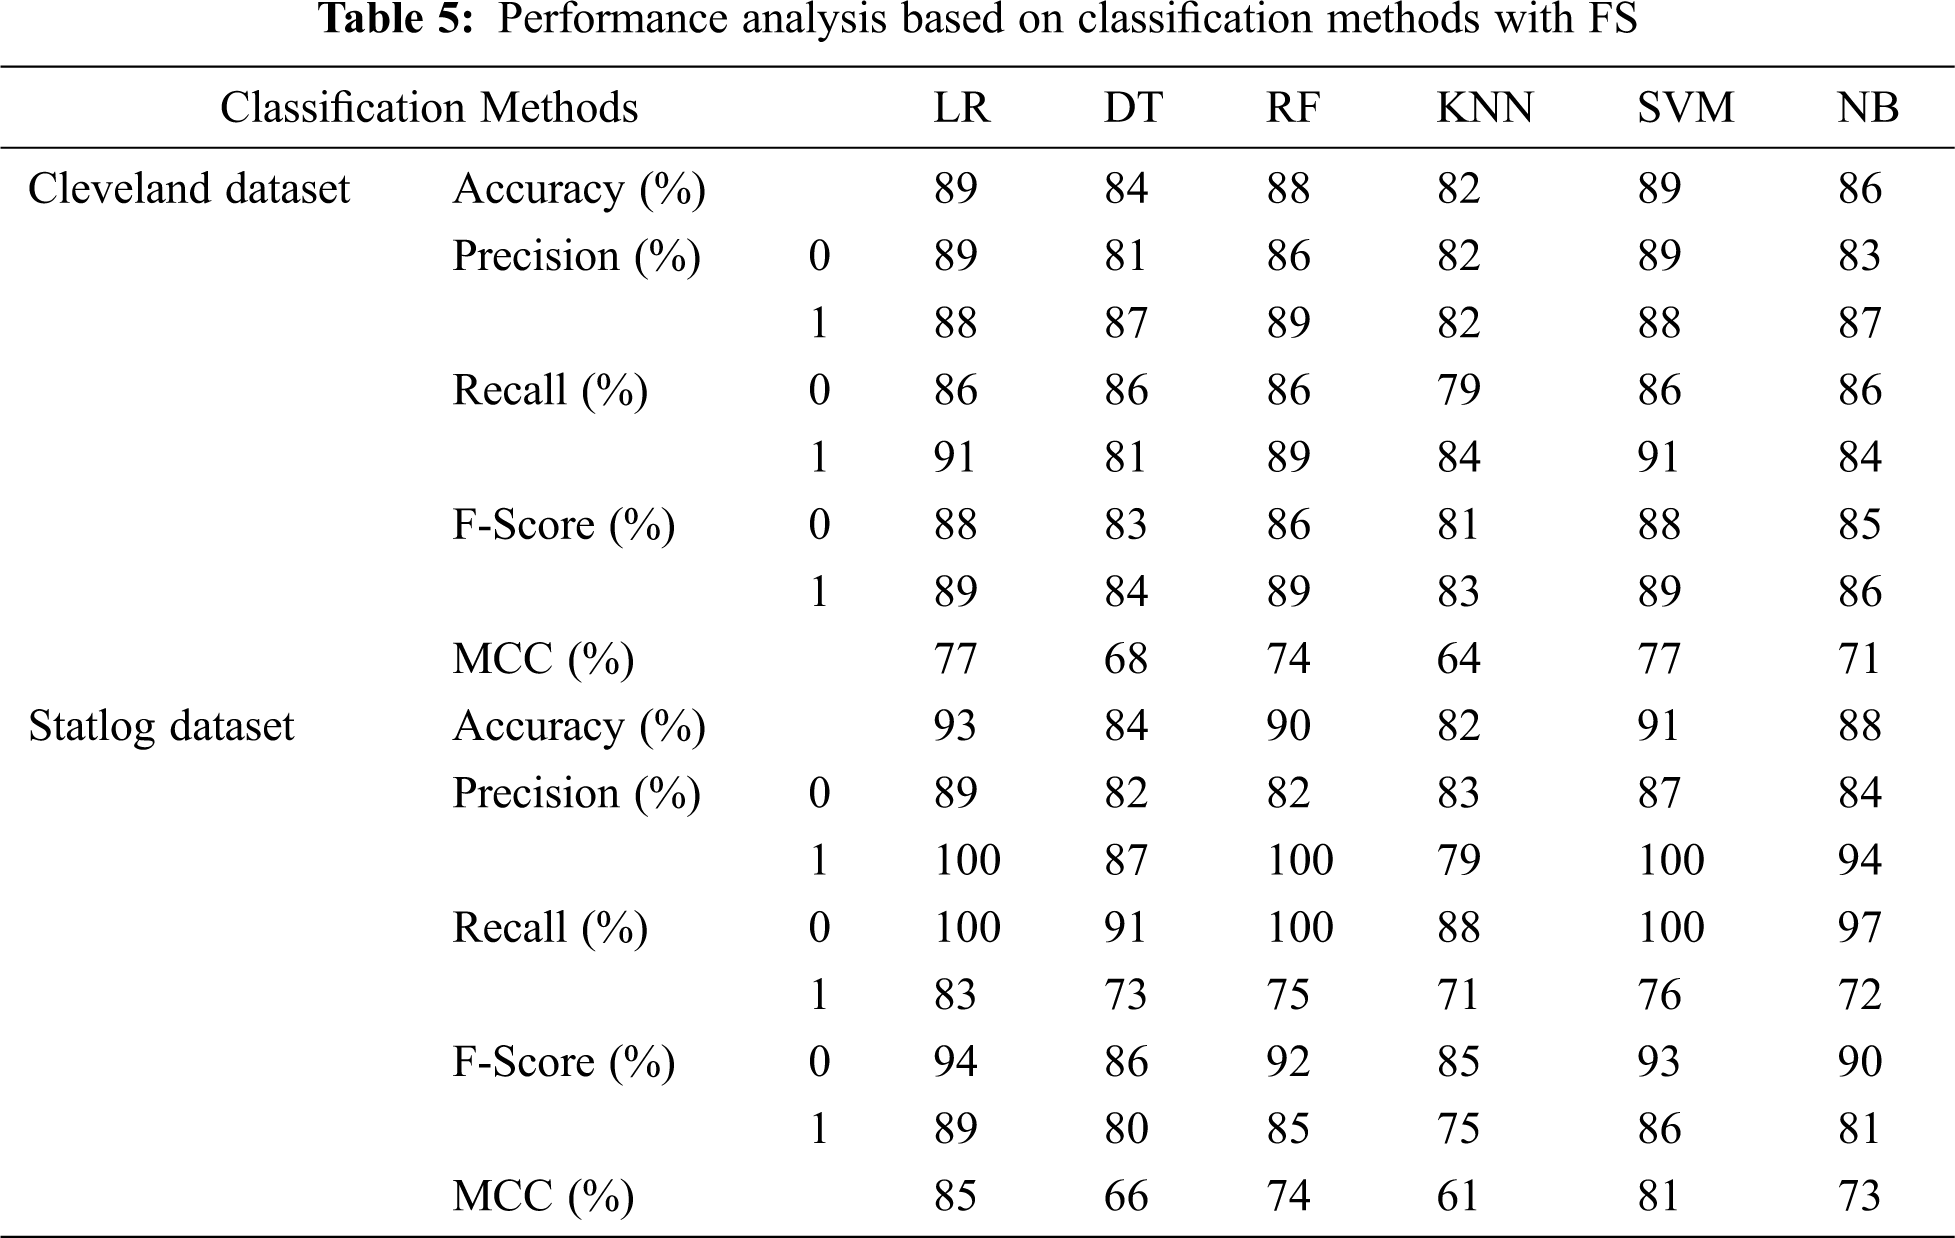
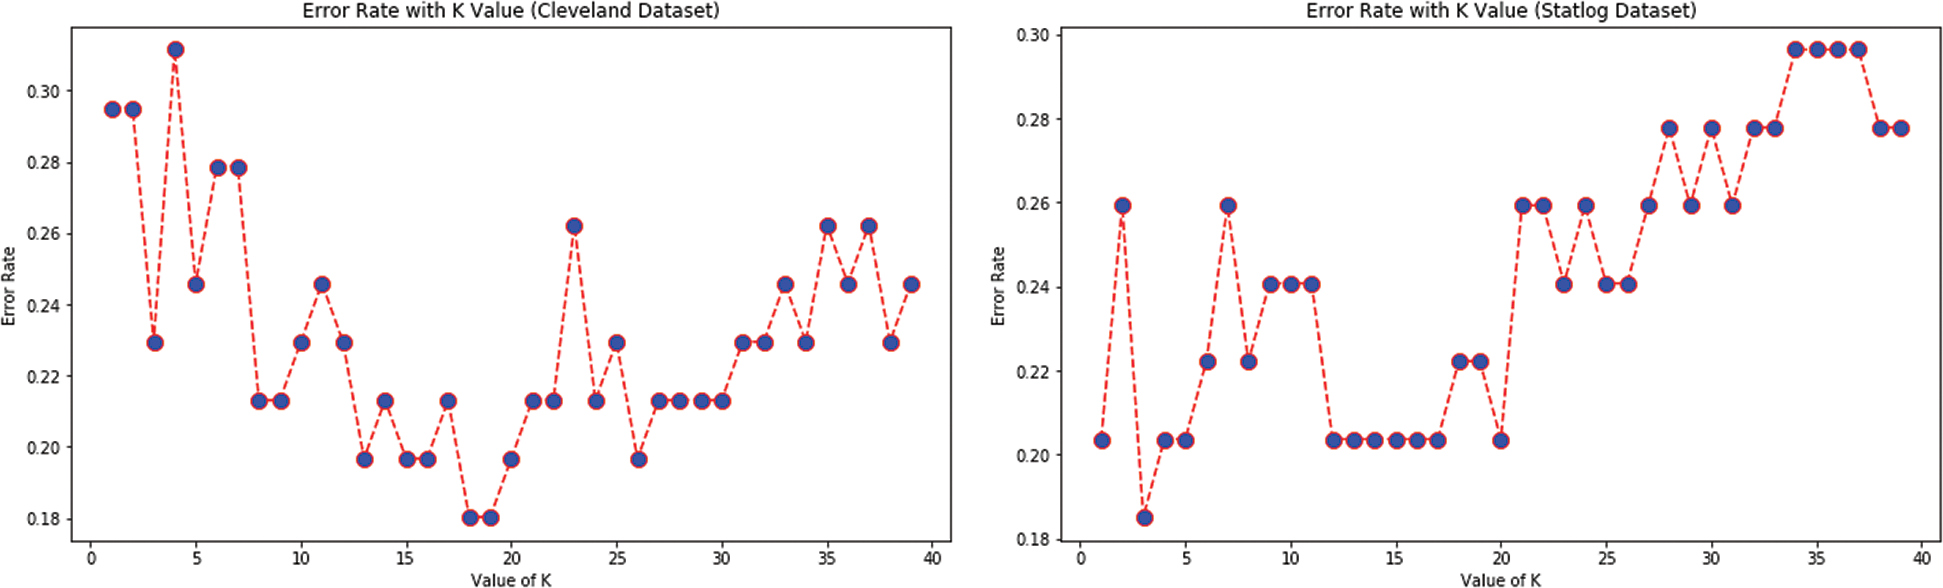
Figure 11: Error rate with K value for KNN with FS for both datasets
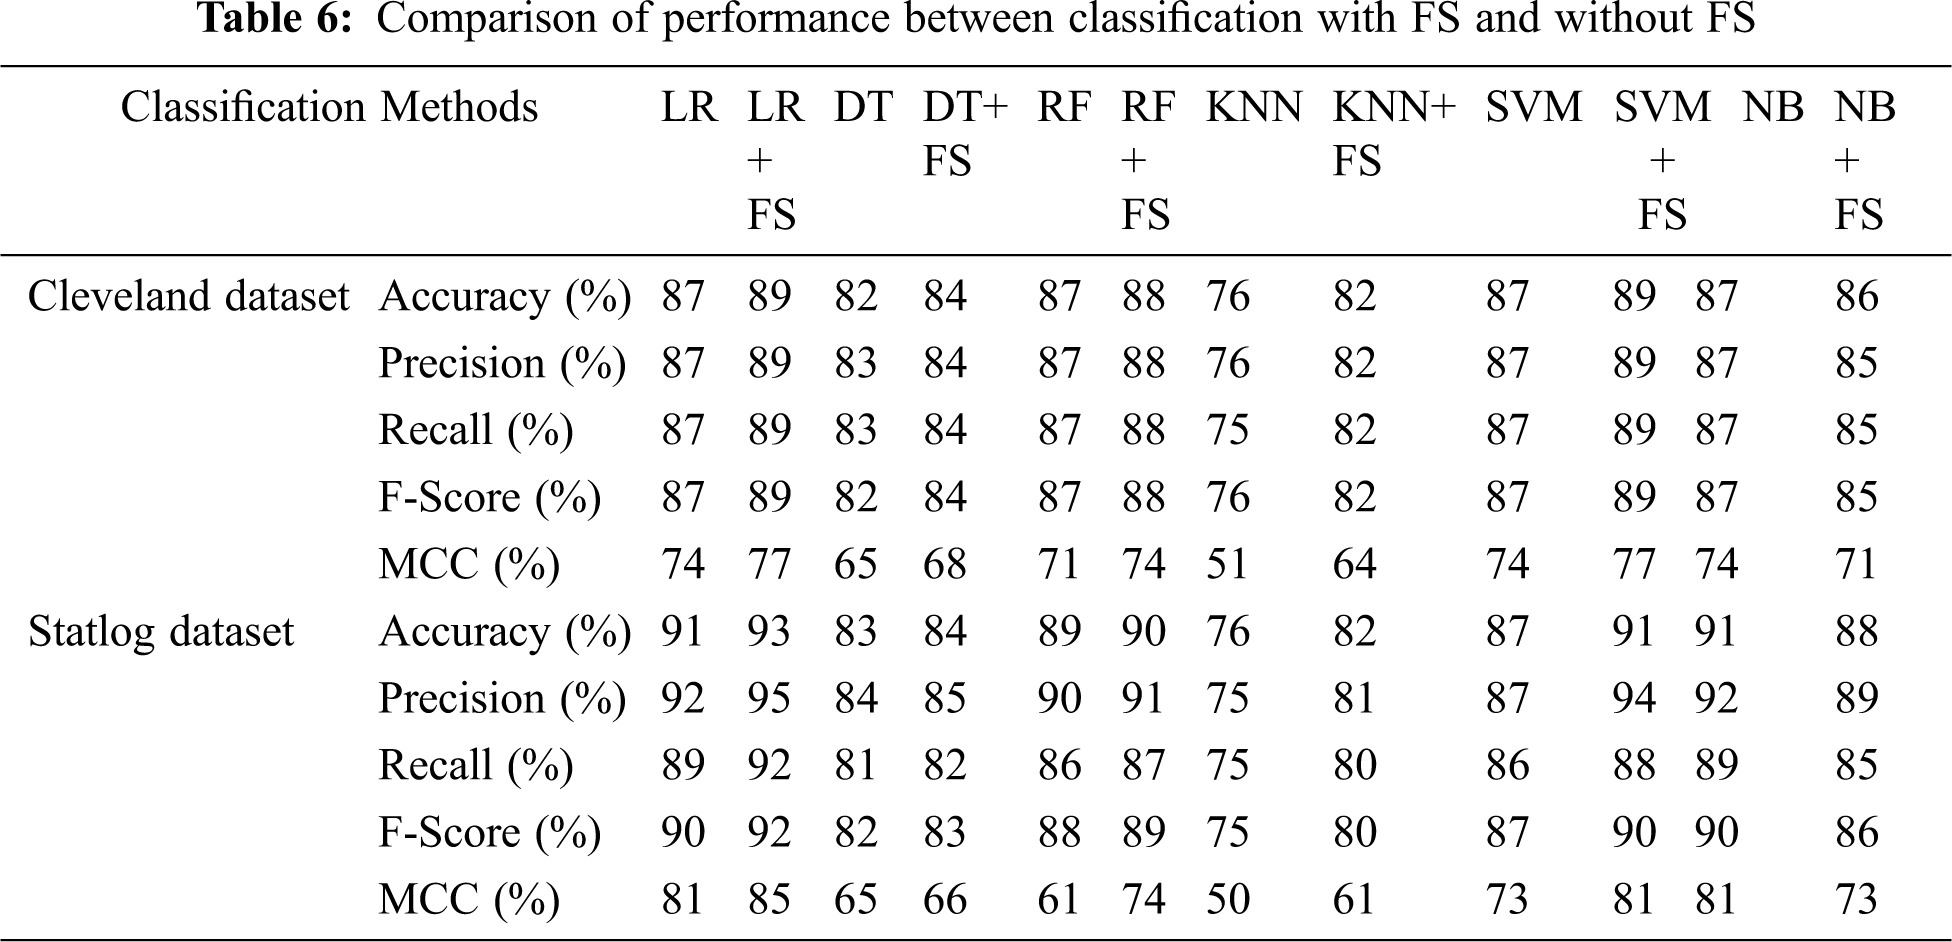
Tab. 6 compares classification results, including accuracy, MCC, average precision, recall, and F-score, without and with FS. Classification algorithms with FS performed better than those without FS on all parameters except NB.
We investigated ML algorithms including LR, DT, RF, KNN, SVM, SVMG, and NB. The AFS method was applied to select influential features to increase classification accuracy. The major findings were as follows:
a) The highest coefficient of determination was obtained with 40% test data, and the minimum error was observed with 20% test data for both datasets, implying better goodness of fit with 40% test data.
b) SVM with grid search outperformed in terms of accuracy on the Cleveland dataset, and LR and NB performed better on the Statlog dataset. With 20% test data, better accuracy was obtained for all algorithms except KNN on both datasets, demonstrating superior accuracy with 15% test data on the Cleveland dataset.
c) SVM with grid search had better recall and precision on the Cleveland dataset, as LR and NB did on the Statlog dataset. Like accuracy, better recall and precision were obtained for all algorithms except KNN on both datasets with 20% test data, demonstrating the highest recall and precision with 15% test data in the Cleveland dataset.
d) Better error rates were shown by SVM with grid search for the Cleveland dataset, and LR and NB for the Statlog dataset. All these algorithms outperformed in terms of error rates (MAE and RMSE) on both datasets with the selection of test data at or close to 20%.
e) The classifiers performed well in terms of early prediction of heart diseases based on previous data. Based on the parameters discussed in the above points, SVM with grid search performed better for the Cleveland dataset, whereas SVM with grid search, LR, and NB classifiers performed better for the Statlog dataset. Therefore, the overall performance of the classification algorithms was better with the selection of test data at or close to 20%.
f) In classification with AFS, the LR and SVM algorithms outperformed in terms of accuracy, precision, and recall on the Cleveland dataset, and LR performed better on the Statlog dataset.
g) Overall, classification algorithms with AFS performed better than those without it, for all parameters except NB.
h) ML classification approaches assisted in predicting heart diseases at an early stage using previous data, with an impactful selection of features leading to better predictive results.
This study had certain limitations. We did not consider attribute optimization, which can help to select a limited number of attributes that are impactful and may improve the classification, and we did not use a real dataset.
An efficient and accurate ML-based system to predict heart disease was developed. Linear regression and classification methods, such as LR, DT, RF, SVM, SVM with grid search, KNN, and NB, were used, and AFS was applied to select influential features. The proposed prediction system was tested on the Cleveland and Statlog datasets and evaluated based on the parameters of, accuracy, precision, recall, F-score, MCC, and error rates. We analyzed and compared classification without and with AFS, and found the latter better, with the exception of NB. The proposed approach of machine learning assisted in predicting heart diseases at an early stage using previous data and an impressive selection of features could lead to better prognosis results. This work can be replicated with more parameters and different other thresholding mechanisms in the direction of attribute utilization to detect different diseases.
Funding Statement: The authors received no specific funding for this study.
Conflicts of Interest: The authors declare that they have no conflicts of interest to report regarding the present study.
1. A. L. Bui, T. B. Horwich and G. C. Fonarow, “Epidemiology and risk profile of heart failure,” Nature Reviews Cardiology, vol. 8, no. 1, pp. 30–41, 2011. [Google Scholar]
2. “Alarming Statistics from India,” 2019. [Online]. Available: http://neocardiabcare.com/alarming-statistics-india.htm. [Google Scholar]
3. D. Prabhakaran, P. Jeemon and A. Roy, “Cardiovascular diseases in India: Current epidemiology and future directions,” Circulation, vol. 133, no. 16, pp. 1605–1620, 2016. [Google Scholar]
4. H. Ouyang, “Africa’s top health challenge: cardiovascular disease,” Atlantic Journal, 2014. Available: http://www.theatlantic.com/health/archive/2014/10/africas-top-health-challenge-cardiovascular-disease/381699/. [Google Scholar]
5. E. Wilkins, L. Wilson, K. Wickramasinghe, P. Bhatnagar, J. Leal et al., “European cardiovascular disease statistics: European Heart Network,” 2017. [Online]. Available: http://www.ehnheart.org/images/CVD-statistics-report-August-2017.pdf. [Google Scholar]
6. H. Kahramanli and N. Allahverdi, “Mining classification rules for liver disorders,” International Journal of Mathematics and Computers in Simulation, vol. 3, no. 1, pp. 9–19, 2009. [Google Scholar]
7. M. Durairaj and N. Ramasamy, “A comparison of the perceptive approaches for preprocessing the data set for predicting fertility success rate,” International Journal of Control Theory and Applications, vol. 9, no. 27, pp. 255–260, 2016. [Google Scholar]
8. L. A. Allen, L. W. Stevenson, K. L. Grady, N. E. Goldstein, D. D. Matlock et al., “Decision making in advanced heart failure: a scientific statement from the American heart association,” Circulation, vol. 125, no. 15, pp. 1928–1952, 2012. [Google Scholar]
9. A. Tsanas, M. A. Little, P. E. McSharry and L. O. Ramig, “Nonlinear speech analysis algorithms mapped to a standard metric achieve clinically useful quantification of average Parkinson’s disease symptom severity,” Journal of the Royal Society Interface, vol. 8, no. 59, pp. 842–855, 2011. [Google Scholar]
10. A. K. Dubey and K. Choudhary, “A systematic review and analysis of the heart disease prediction methodology,” International Journal of Advanced Computer Research, vol. 8, no. 38, pp. 240–256, 2018. [Google Scholar]
11. J. Singh, A. Kamra and H. Singh, “Prediction of heart diseases using associative classification,” in Proc. IEEE, WECON, India, pp. 1–7, 2016. [Google Scholar]
12. R. El-Bialy, M. A. Salamay, O. H. Karam and M. E. Khalifa, “Feature analysis of coronary artery heart disease data sets,” Procedia Computer Science, vol. 65, pp. 459–468, 2015. [Google Scholar]
13. J. Chen, H. Huang, S. Tian and Y. Qu, “Feature selection for text classification with Naïve Bayes,” Expert Systems with Applications, vol. 36, no. 3, pp. 5432, 2009. [Google Scholar]
14. Y. Li, T. Li and H. Liu, “Recent advances in feature selection and its applications,” Knowledge and Information Systems, vol. 53, no. 3, pp. 551–577, 2017. [Google Scholar]
15. J. Cai, J. Luo, S. Wang and S. Yang, “Feature selection in machine learning: a new perspective,” Neurocomputing, vol. 300, pp. 70–79, 2018. [Google Scholar]
16. J. Li and H. Liu, “Challenges of feature selection for big data analytics,” IEEE Intelligent Systems, vol. 3, no. 2, pp. 9–15, 2017. [Google Scholar]
17. N. Khateeb and M. Usman, “Efficient heart disease prediction system using K-nearest neighbor classification technique,” in Proc. ACM, ICBDIT, London, United Kingdom, pp. 21–26, 2017. [Google Scholar]
18. E. O. Olaniyi, O. K. Oyedotun and K. Adnan, “Heart diseases diagnosis using neural networks arbitration,” International Journal of Intelligent Systems and Applications, vol. 7, no. 12, pp. 75–82, 2015. [Google Scholar]
19. M. A. Jabbar, B. L. Deekshatulu and P. Chandra, “Classification of heart disease using artificial neural network and feature subset selection,” Global Journal of Computer Science and Technology Neural & Artificial Intelligence, vol. 13, no. 3, pp. 4–8, 2013. [Google Scholar]
20. P. Selvakumar and S. P. Rajagopalan, “SSH—Structure risk minimization based support vector machine for heart disease prediction,” in Proc. IEEE, ICCES,India, pp. 84–91, 2017. [Google Scholar]
21. S. Palaniappan and R. Awang, “Intelligent heart disease prediction system using data mining techniques,” in Proc. IEEE, ICCSA, Qatar, pp. 108–115, 2008. [Google Scholar]
22. R. Bialy, M. A. Salama and O. Karam, “An ensemble model for heart disease data sets: A generalized model,” in Proc. ACM, ICIS, Giza, Egypt, pp. 191–196, 2016. [Google Scholar]
23. O. W. Samuel, G. M. Asogbon, A. K. Sangaiah, P. Fang and G. Li, “An integrated decision support system based on ANN and Fuzzy AHP for heart failure risk prediction,” Expert Systems with Applications, vol. 68, pp. 163–172, 2017. [Google Scholar]
24. X. Liu, X. Wang, Q. Su, M. Zhang, Y. Zhu et al., “A hybrid classification system for heart disease diagnosis based on the RFRS method,” Computational and Mathematical Methods in Medicine, vol. 2017, pp. 1–17, 2017. [Google Scholar]
25. S. Bharti and S. N. Singh, “Analytical study of heart disease prediction comparing with different algorithms,” in Proc. IEEE, ICCCA, India, pp. 78–82, 2015. [Google Scholar]
26. A. U. Haq, J. Li, M. H. Memon, J. Khan and S. M. Marium, “Heart disease prediction system using model of machine learning and sequential backward selection algorithm for features selection,” in Proc. IEEE, I2CT, India, pp. 1–4, 2019. [Google Scholar]
27. S. H. Wijaya, G. T. Pamungkas and M. B. Sulthan, “Improving classifier performance using particle swarm optimization on heart disease detection,” in Proc. IEEE, ISATIC, Indonesia, pp. 603–608, 2018. [Google Scholar]
28. M. G. Feshki and O. S. Shijani, “Improving the heart disease diagnosis by evolutionary algorithm of PSO and feed forward neural network,” in Proc. IEEE, IRANOPEN, Iran, pp. 48–53, 2016. [Google Scholar]
29. M. A. Jabbar, B. L. Deekshatulu and P. Chandra, “Computational intelligence technique for early diagnosis of heart disease,” in Proc. IEEE, ICETECH, India, pp. 1–6, 2015. [Google Scholar]
30. L. Ali, A. Rahman, A. Khan, M. Zhou, A. Javeed et al., “An automated diagnostic system for heart disease prediction based on ${\\\\chi^{2}} $ statistical model and optimally configured deep neural network,” IEEE Access, vol. 7, pp. 34938–34935, 2019. [Google Scholar]
31. J. G. Yang, J. K. Kim, U. G. Kang and Y. H. Lee, “Coronary heart disease optimization system on adaptive-network-based fuzzy inference system and linear discriminant analysis (ANFIS-LDA),” Personal and Ubiquitous Computing, vol. 18, no. 6, pp. 1351–1362, 2014. [Google Scholar]
32. I. Yekkala, S. Dixit and M. A. Jabbar, “Prediction of heart disease using ensemble learning and particle swarm optimization,” in Proc. IEEE, ICSTSN, Bengaluru, India, pp. 691–698, 2017. [Google Scholar]
33. A. K. Paul, P. C. Shill, M. R. Rabin and M. A. Akhand, “Genetic algorithm based fuzzy decision support system for the diagnosis of heart disease,” in Proc. IEEE, ICIEV, Dhaka, Bangladesh, pp. 145–150, 2016. [Google Scholar]
34. A. K. Dubey, U. Gupta and S. Jain, “Analysis of k-means clustering approach on the breast cancer Wisconsin dataset,” International Journal of Computer Assisted Radiology and Surgery, vol. 11, no. 11, pp. 2033–2047, 2016. [Google Scholar]
35. A. K. Dubey, U. Gupta and S. Jain, “Comparative study of K-means and fuzzy C-means algorithms on the breast cancer data,” International Journal on Advanced Science, Engineering and Information Technology, vol. 8, no. 1, pp. 18–29, 2018. [Google Scholar]
36. A. Arthur, and D. Newman, “UCI machine learning repository,” 2007. [Online]. Available: http://www.ics.uci.edu/~mlearn/MLRepository.html. [Google Scholar]
37. J. Nahar, T. Imam, K. S. Tickle and Y. P. Chen, “Association rule mining to detect factors which contribute to heart disease in males and females,” Expert Systems with Applications, vol. 40, no. 4, pp. 1086–1093, 2013. [Google Scholar]
38. N. O. Elssied, O. Ibrahim and A. H. Osman, “A novel feature selection based on one-way anova f-test for e-mail spam classification,” Research Journal of Applied Sciences, Engineering and Technology, vol. 7, no. 3, pp. 625–638, 2014. [Google Scholar]
39. S. Sperandei, “Understanding logistic regression analysis,” Biochemia Medica, vol. 24, no. 1, pp. 12–18, 2014. [Google Scholar]
40. J. C. Stoltzfus, “Logistic regression: a brief primer,” Academic Emergency Medicine, vol. 18, no. 10, pp. 1099–1104, 2011. [Google Scholar]
41. X. Wu, V. Kumar, J. R. Quinlan, J. Ghosh, Q. Yang et al., “A top 10 algorithms in data mining,” Knowledge and Information Systems, vol. 14, no. 1, pp. 1–37, 2008. [Google Scholar]
42. P. C. Austin, J. V. Tu, J. E. Ho, D. Levy and D. S. Lee, “Using methods from the data-mining and machine-learning literature for disease classification and prediction: a case study examining classification of heart failure subtypes,” Journal of Clinical Epidemiology, vol. 66, no. 4, pp. 398–407, 2013. [Google Scholar]
43. L. Yang, R. Jin, Distance metric learning: a comprehensive survey. Michigan State University, United States, 2006. [Online]. Available: http://www.cs.cmu.edu/~./liuy/frame_survey_v2.pdf. [Google Scholar]
44. C. M. Bishop, Pattern recognition and machine learning. Springer, New York, 2006. [Online]. Available: https://cds.cern.ch/record/998831. [Google Scholar]
45. S. W. Lin, K. C. Ying, S. C. Chen and Z. J. Lee, “Particle swarm optimization for parameter determination and feature selection of support vector machines,” Expert Systems with Applications, vol. 35, no. 4, pp. 1817–1824, 2008. [Google Scholar]
46. J. F. Easton, C. R. Stephens and M. Angelova, “Risk factors and prediction of very short term versus short/intermediate term post-stroke mortality: a data mining approach,” Computers in Biology and Medicine, vol. 54, pp. 199–210, 2014. [Google Scholar]
 | This work is licensed under a Creative Commons Attribution 4.0 International License, which permits unrestricted use, distribution, and reproduction in any medium, provided the original work is properly cited. |