DOI:10.32604/iasc.2022.016392
| Intelligent Automation & Soft Computing DOI:10.32604/iasc.2022.016392 | |
| Article |
Leaf Blights Detection and Classification in Large Scale Applications
1Department of Computer Science, COMSATS University Islamabad, Wah Campus, Pakistan
2Department of Information and Computer Science, College of Computer Science and Engineering, University of Ha'il, Hail, Saudi Arabia
3Department of IT and Computer Science, PAF-Institute of Applied Sciences and Technology, Mang, Haripur, Pakistan
4Department of Information and Communication Engineering, Yeungnam University, Gyeongsan 38541, Korea
*Corresponding Author: Jin-Ghoo Choi. Email: jchoi@yu.ac.kr
Received: 30 December 2020; Accepted: 02 June 2021
Abstract: Crops are very important to the financial needs of a country. Due to various diseases caused by different pathogens, a large number of crops have been destroyed. As humanoids, our basic need is food for survival, and the most basic foundation of our food is agriculture. For many developing countries, it is mainly an important source of income. Bacterial diseases are one of the main diseases that cause improper production and a major economic crisis for the country. Therefore, it is necessary to detect the disease early. However, it is not easy for humans to analyze the different leaves of plants by themselves when recognizing diseases. In this article, a variety of machine learning methods are used to classify and detect leaf blight. We use the fusion of deep convolutional neural network (CNN) models obtained from SqueezeNet and ShuffleNet to improve the accuracy and robustness of large-scale applications. We use entropy to reduce the complexity of the calculation process and reduce the features in the deep learning process. In addition, we use a support vector machine (SVM) classifier to obtain the classification. We use the CIELAB color space to capture the entire color range to improve accuracy. Our results are very promising because we have achieved 98% accuracy in the early detection of leaf blight.
Keywords: CIELAB; support vector machine; squeezenet; shufflenet
As human beings, we need food to survive, and our main source of food is agriculture. It is mainly an important source of income, especially in many developing countries. In crops, infections or bacterial diseases have caused major financial crises in various countries [1]. Therefore, good crop quality is very important. Since agricultural plants are usually unprotected and exposed to sunlight in open areas, they are susceptible to many bacterial and fungal diseases. In the end, due to fluctuations in intensity exposure, plants cannot perform normal photosynthesis processes [2]. For many years, scientists and farmers have been working hard to improve the quality of crops and protect them from various diseases. There are many crop-related diseases [3,4], but in the proposed method, the main work focuses on leaf blight. Leaf blight is a disease caused by bacteria and is characterized by black lesions or brown spots. In order to prevent further loss of plants, it must be discovered as soon as possible. Therefore, a new method to discover its early detection is proposed. The normal and diseased images of the leaves are shown in Fig. 1.
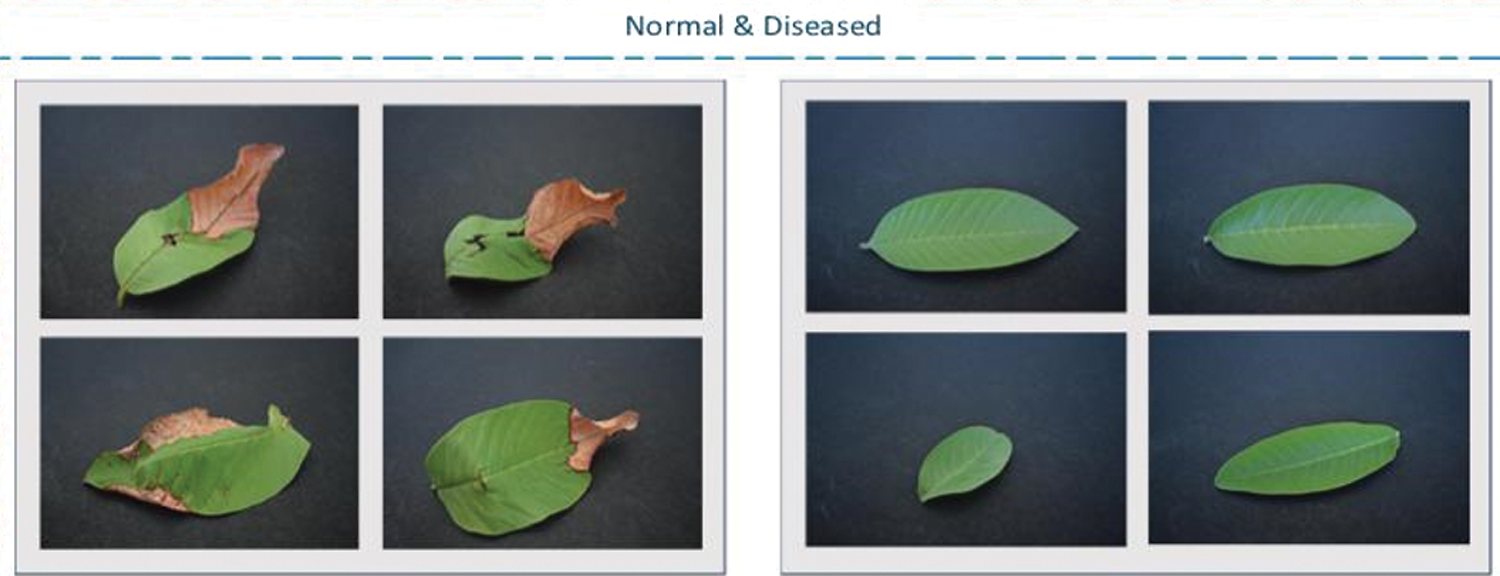
Figure 1: Compression of the diseased and normal images
The traditional method of diagnosing agricultural problems involves the physical study of specimens by skilled farmers or crop analysts. However, this takes a lot of time and therefore affects the total output of crops. Sometimes due to physical limitations and limited knowledge of farmers, the disease cannot be detected correctly [5]. Conventional methods require a lot of time to analyze diseases, and at the same time, crops may suffer more damage due to actual diseases. As a result, this has led to an increase in the number of imports, thereby stimulating demand in the country. This led to rising prices and rising inflation, which affected the country's economy, especially for developing countries. Another problem with imports is that the quality of imported materials has been frozen for many days, so their quality is not as good as fresh produce. The latest developments in learning methods allow us to diagnose possible problems in agricultural plants early. Therefore, compared with traditional methods, the time of physical analysis is saved and higher accuracy is provided. Researchers are trying to improve these methods by improving the accuracy of early disease detection [6]. In addition, these advanced technologies also contribute to precision agriculture, which is a technology that uses drones to spray pesticides in specific areas. Machine learning methods include obtaining specimens (data sets) of healthy and affected agricultural plants, then extracting their features, and finally classifying them using benchmark classifiers such as support vector machine (SVM). Through deep learning methods involving multiple levels of complexity, we can simply distinguish healthy plants from affected plants with high accuracy. We can also change the parameters of each layer and find the ideal parameter settings to achieve accuracy [6].
In this article, we propose a method to detect and classify leaf fusarium wilt images from healthy images. The key contributions of this paper are as follows:
• We first use CIE L * a * b * color threshold to detect leaf blight to enhance image quality because it specifies all colors visible to the human eye.
• We perform preprocessing to resize the entire dataset of 128 X 64 dimensions into a single insulated pixel. We perform preprocessing to adjust the size of the data set (i.e., 128 X 64 dimensions) to a single insulated pixel. We also use additional feature mapping channels for feature extraction through Squeezenet and Shufflent in order to reduce communication between services and encode additional information.
• We use entropy for feature reduction and optimization because it provides feature independence and avoids discretization. After that, we perform feature fusion, in which deep convolutional neural network (CNN) model features are fused for classification.
The rest of this article is structured as follows. Section 2 summarizes the literature review. Section 3 presents the proposed method. Section 4 discusses test cases and experimental results. Finally, the last section draws our conclusion.
Agriculture is the main source of food in the country. Therefore, it is very important to detect diseases caused by bacteria, fungi and viruses as early as possible. In the literature, methods based on machine learning have been found to detect diseases on agricultural plants. In [6], the authors emphasized automated methods for early detection of the disease on various plants. They used an image dataset of various plants containing images of healthy and affected leaves. Three feature descriptors such as Hu moment, Haralick and color histogram are used to detect the color, shape and texture of healthy and affected plant leaves. Then use different classifiers (such as SVM, decision tree, Navies Bayes) to classify the leaves, and found that the random forest classifier gives the best results. The classification result of various plant data sets is reported as 98%. In [7], research shows that machine learning and computer vision technology can classify healthy plant leaves from affected leaves. Therein, unnecessary data is deleted from the image in the preprocessing step, and then K-means clustering and Round Hough transform are used to segment the diseased part. After feature extraction, a multi-support vector machine is applied for classification, which exceeds 90% of the classification accuracy of tomatoes and peppers.
Plant reflections can be used as a measure to detect diseases using machine learning methods. For example, capsicum annuum (pepper) is used to detect diseases [8]. A spectroradiometer can be used to record the reflections of peppers, and each reflection contains special properties, such as a specific wavelength in a specific range. The feature vector is calculated from the wavelength, and then classifiers such as K-nearest neighbor (KNN), naive Bayes, and artificial neural networks (ANN) are used for classification. The study shows that KNN can provide 100% accuracy for pepper diseases, while the detection and discrimination of the four diseases can reach almost 98%. Some studies have shown that among all other classifiers, the random forest classifier can best prove the discovery of different diseases. In [9], a set of 8000 images (including images of healthy leaves and diseased leaves) was used to evaluate different classifiers (e.g., random forest trees, decision trees, and naive Bayes) for classification. Then, the authors converted the images to HSV color space and used K-means clustering and HSV value changes to segment the image. In this study, statistical method i.e., gray-level co-occurrence matrix is used for feature extraction. The author proves that the random forest tree is the best among all classifiers.
Studies have proved that the performance of SVM classifier is better than other classifiers [10]. Among them, 8000 free image data sets from Kaggle were used, which contained 9 kinds of plant leaves. First, the Otsu's method for adaptive thresholding was sued. Then authors performed functional engineering to make the data into the same format. In this study, we can see that the SVM classifier is found superior to other classifiers. On the contrary, some studies also show that compared with existing methods such as SVM, the KNN classifier provides higher accuracy [11]. Therein, it is proved that the accuracy of KNN is 98.56%, while the existing plant classification system is linear SVM with an accuracy of 97.6%. Similarly, in addition to KNN, PNN is also used for classification [12]. We can find performance comparisons between deep learning models for agricultural disease classification in the literature. The performance of the Inception V3 model is better than other models with an accuracy of 98% [13]. Many researchers used deep learning methods to develop smartphone applications to classify plant diseases in real time [14].
In the literature [15–17], extensive research has been conducted on precision agriculture using machine learning technology, in which 500 tomato images from real fields and 2100 images from online resources can be divided into three categories using CNN. For this purpose, transfer learning performed by Google's initial model can be used. In [15], the accuracy of using 90–10 train testers is about 98%. Therefore, after classification, drones can be used to accurately spray pesticides on the most severely affected crops. In precision agriculture [16], a similar method can also be used by using transfer learning in VGG16 instead of GoogleNet, in which 125 pearl millet images were used to detect mildew. More precisely, 98 of them are used for training and 25 are used for testing. The accuracy of the verification data set is 95%. Similarly, some studies discuss that weeds are affecting crops as in [17]. Therefore, precision farming has used CNN methods (especially optimized Resnet18) to detect weeds in crops through unsupervised learning, and unmanned aerial vehicles (UAV) to obtain real-time data. After unsupervised learning, the two categories are classified into weeds and usable crops at the end of the study. Experiments show that the correct rate after evaluation reaches 90%. In [18], we can see that researchers are using some well-known deep learning models (such as Inception, Xception, MobileNets, DenseNet, and VGGNets) to solve weed and crop classification problems, and through general regression such as SVM. However, the combinations of DenseNet and SVM results in an F1 score of 98.29%.
Northern leaf blight is a disease caused by Exserohilum Turcicum, which is characterized by damage to corn crops. Research shows that northern leaf blight is affecting corn crops. In [19], a deep convolutional neural network is applied to the optimization layer, and an accuracy of about 98.40% is achieved. This research enabled an optimized version of the Deep CNN model, which can be tested in real time on Internet of Things (IoT) devices such as Raspberry Pi-3, and reached an accuracy of about 88.66%. The author conducted various experiments on the improved Google Net and Cifar10 models to detect diseases in corn leaves [20]. A data set containing 500 corn leaf images from Plant Village and some online sources is used, which is divided into 9 categories, of which 8 are diseased and one is healthy. The author reported 98.9% and 98.8% accuracy by using the enhanced version of Google Net and CIFAR10, respectively. Similarly, the author in [21] discussed the deep forest method of corn leaf classification. Deep Forest is a method based on decision trees, which can partially build deep models. The literature on the use of CNN to detect pests in crops can also be found in [22]. The author divides the data set into 16 categories, of which 15 are affected by pests and 1 is healthy. The study shows that ResNet34 has an F value of 0.98 compared to all other deep networks.
Some studies have solved the problem of using CNN to detect three diseases in rice leaves, including rice blast, fusarium wilt and brown spot [23]. Since the rice data set is not easily available, the author took photos from a local farm and then used transfer learning to increase the data set. Their data set contains 1649 images containing the disease and 507 healthy leaf images of rice, with an accuracy of 92.46%. Similarly, the CNN model is used to detect rice diseases in [24]. The author used the data set in the UCI machine learning repository, which achieved 95.83% accuracy through the Deep Residual network.
In [25], the adjustment of hyperparameters in different deep networks (such as AlexNet and ResNet) in the classification of crop-related diseases has been studied. In [26], researchers have proved the early detection of the disease by using Inception V3 and VGG16 models. The data is divided into three categories according to the severity of the disease. The VGG16 model achieved the highest accuracy in the laboratory i.e., 93.75%, and 81.25% in the field environment. In contrast, the highest accuracy of the initial model v3 is 92.30% in the laboratory and 93.20% in the field environment. Authors in [27] discussed that the use of deep models for crop classification requires a large amount of data for training and computational overhead. Therefore, the author introduces a fast learning (FSL) algorithm for disease classification. The FSL algorithm requires a small amount of data set, rather than the big data used in traditional deep models. The Plant Village data set with labelled data can achieve 91.4% accuracy.
In [28], the use of the Deep model to classify apple plant diseases has been studied. The authors applied different technologies of the deep model DenseNet-121, and obtained 93.71% accuracy. In [29] and [30], different computer vision methods are discussed, and machine learning models are used to detect diseases early in the agricultural plants. In [31], deep learning methods in plant disease detection have been proposed. Similarly, we can use AI-Tools to detect early diseases and help farmers improve agricultural growth to obtain location-based information for precision agriculture [32]. In [33], the author used the SVM classifier to classify lesion images from healthy leaf images with a maximum accuracy of 91%. Their process involves extracting different features (such as shapes and colors) and then using machine learning models for classification. The authors use the L*a*b color model with three classifiers including KNN, SVM, and DT (decision tree), and find that SVM is superior to other color classifiers.
Smart agriculture is a new agricultural technology that allows farmers to use computer-assisted methods to improve the quality and quantity of crops. In the past, machine learning methods have been helping scientists improve smart agricultural technology, but after the introduction of deep neural networks, DNN has been helping scientists use this technology. We can find many deep technologies for smart agriculture in [34]. Plant diseases are classified in four steps [35]. The first step is normalization, which uses a median filter to eliminate noise. The second step is feature extraction. They extracted HOG, LBP and SFTA features. The third step is feature fusion, and these fusions are completed serially. Using SVM, the accuracy of potato late blight is 96%, and the accuracy of potato early blight is 97%. In [36], the author discussed statistical methods of machine learning to improve agricultural plants, including disease detection, precision agriculture, and plant reduction per unit area. Statistical indicators include supervised and unsupervised machine learning methods, which have been briefly introduced in this white paper about agricultural plants. Tea tree disease was detected using a convolutional neural network [37]. Therein, common methods are used, including image acquisition, detection and enhancement to extract features, and then diseased images and healthy images are classified. More precisely, 93.75% of the images can be obtained using CNN, which is much higher than SVM. In [38], authors discussed machine learning methods to solve the problem of grape downy mildew (GDM). They collected data from local farms and applied different machine learning algorithms (for example, gradient enhancement, random forest and LASSO), and found that the effect of gradient enhancement was better than all other methods.
Color space is the process of making a large number of logos from a small number of key colors. Each model has a different logo/color, which we call a color space. However, the color spaces in different schemes are not completely similar [39]. In this article, we can use CIELAB (L * a * b *) color space to detect leaf blight. The CIELAB space is composed of a luminosity “L*” or lighting layer, a chromaticity layer “a*” representing the shade reduction along with the red and green axis, and a chromaticity layer “b*” representing the shade reduction along the Blue-Yellow axis. In this method, we used image enhancement techniques called guided filters and Gaussian blur to eliminate noise in the image. The L*a*b* space is realized by the threshold for detecting leaf blight. In this work, there are two types of results: one is detection using classification, and the other is detection without classification. For classification, we have some pre-processing techniques called resizing and unit8 conversion. In addition, we extract features from the SqueezeNet Deep CNN model and ShuffleNet Deep CNN model. Entropy is used to simplify features to achieve better calculations and results. As shown in Fig. 2a support vector machine (SVM) is used to fuse these selected features of two Deep CNN models for classification.
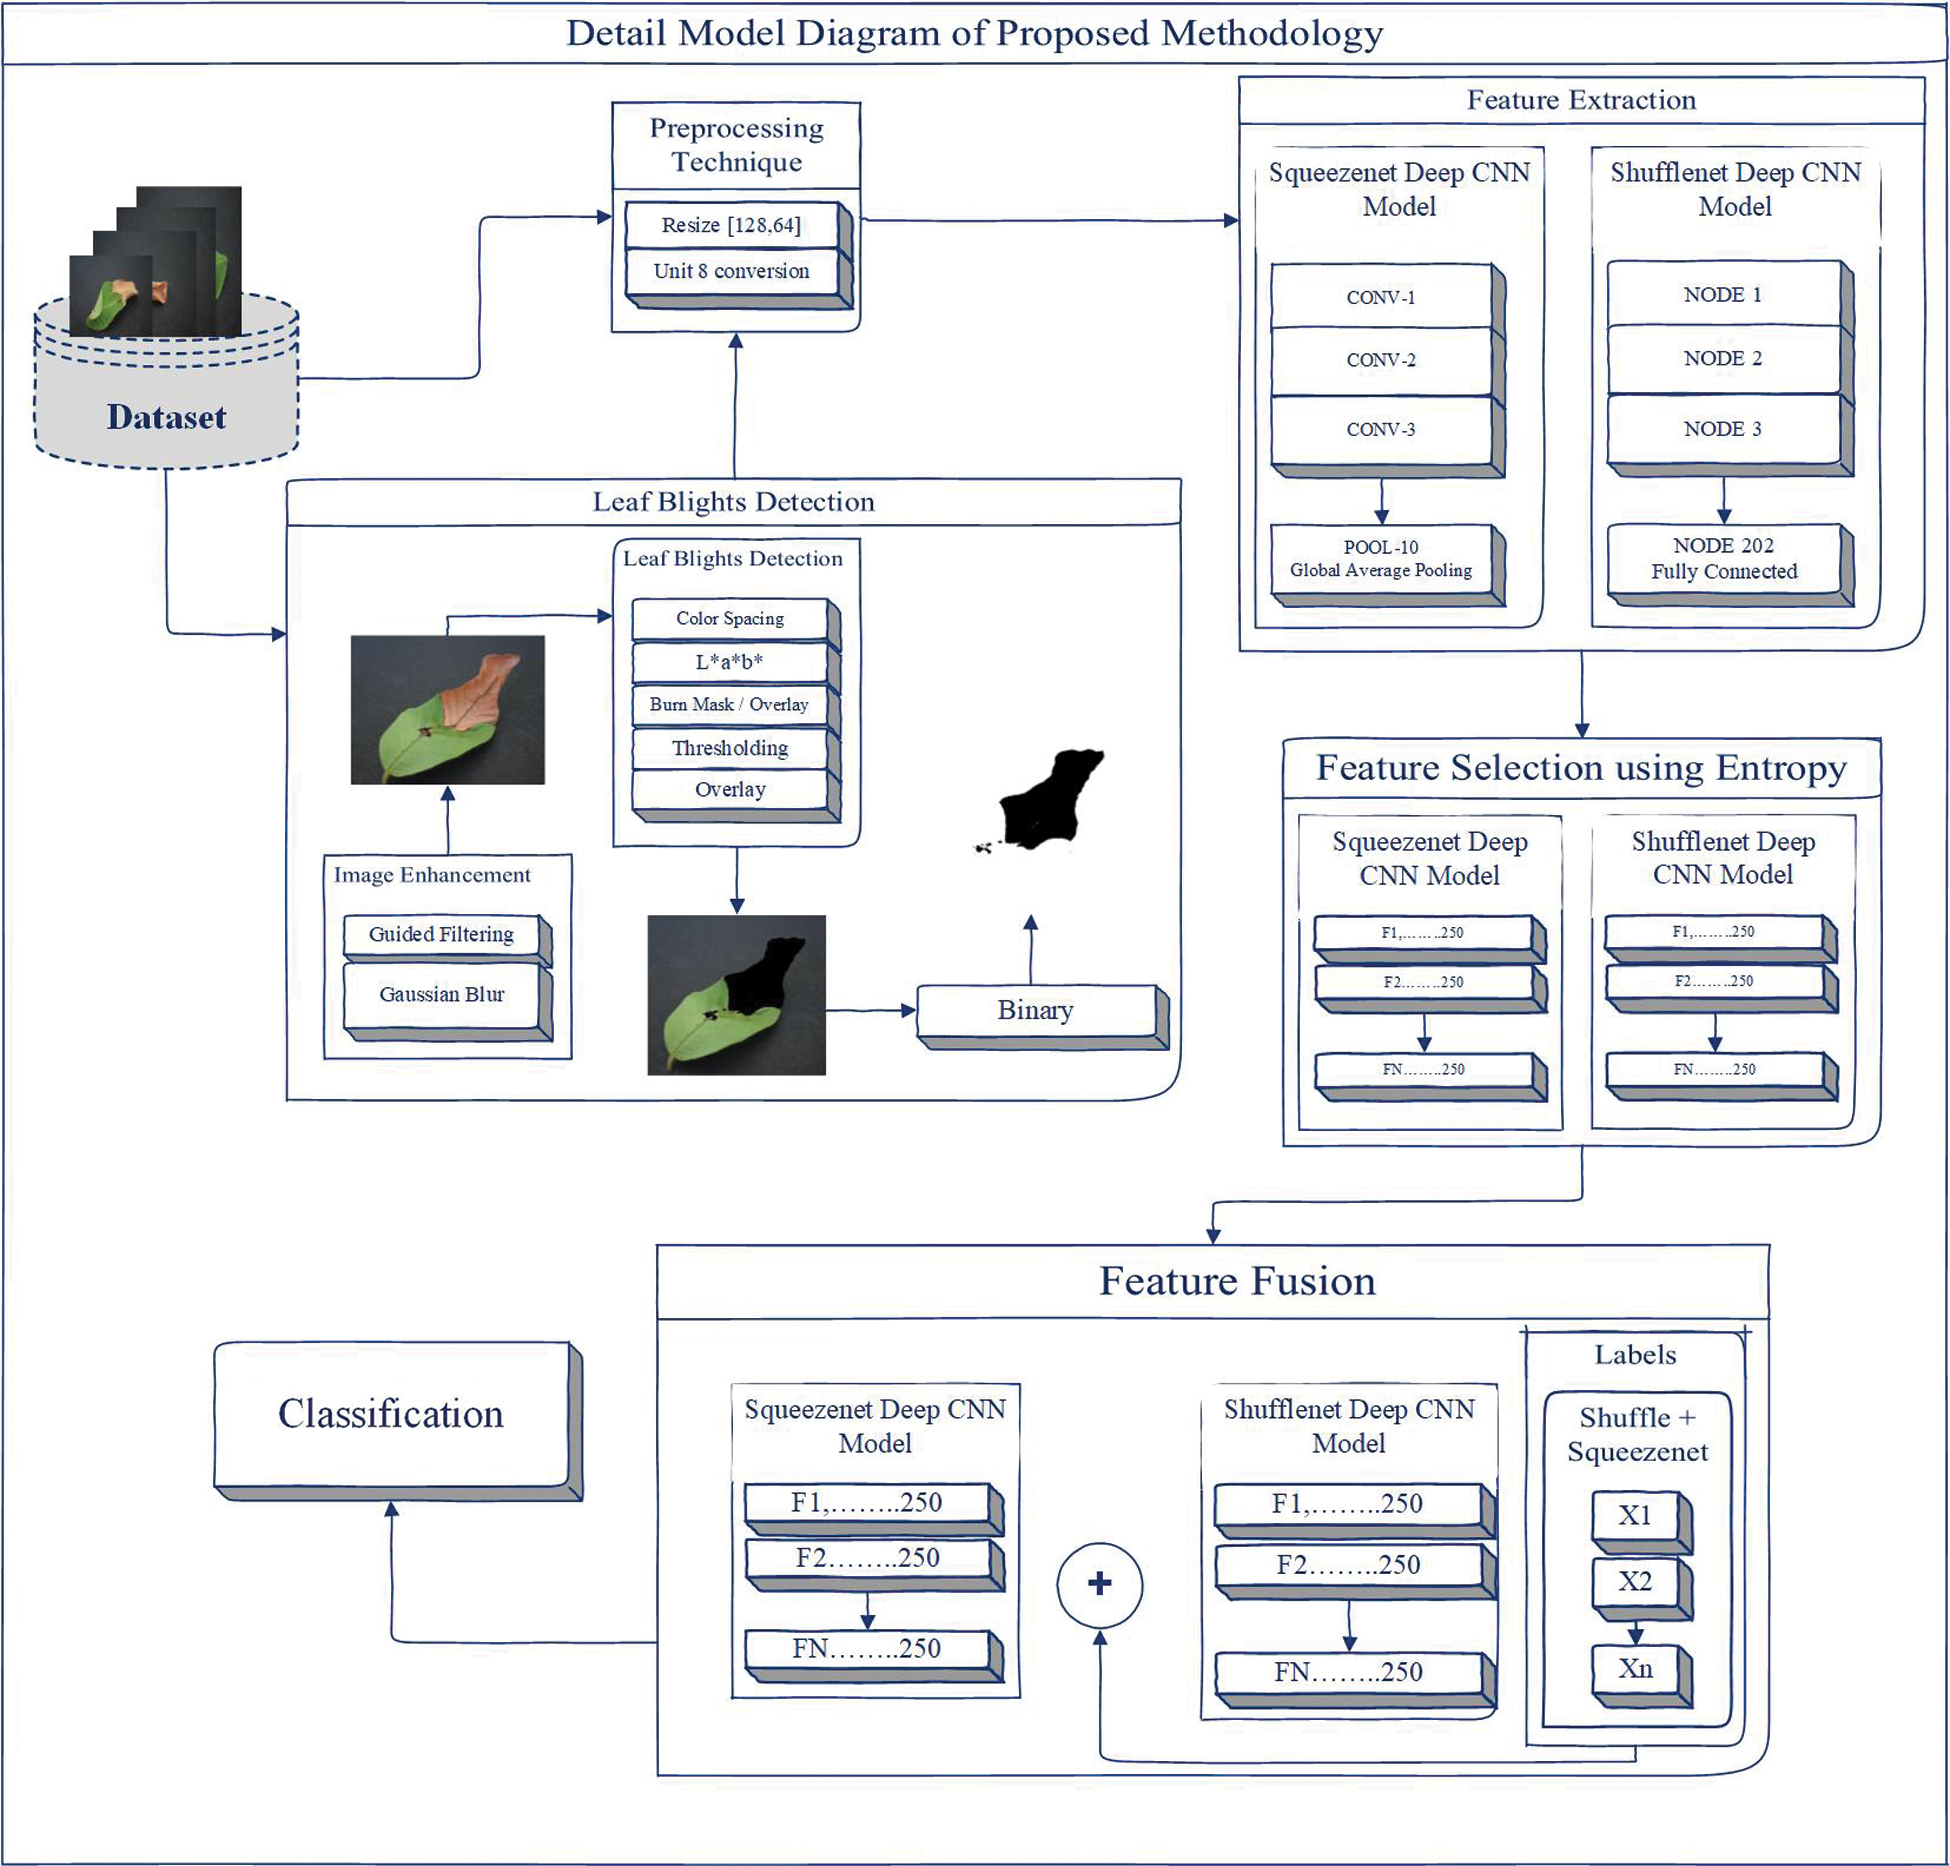
Figure 2: Proposed methodology
Image enhancement technology is being applied to data sets to improve image information. Guided filters and Gaussian blur are used to enhance the image. The purpose of the guide filter is to complete the smoothing of the preserved edges on the image [40]. The guide filter can be used to maintain the flattening operation of the disposable edge, because its closed-end performance is also very good [41]. In computer vision, Gaussian blur is also considered to be able to compress image noise and reduce details through Gaussian function [42]. The representation of the steering filter and Gaussian blur is shown in Fig. 3. The steering filter is mathematically defined d in the binary basic step of multi-point filtering [43]. We can calculate the multipoint evaluation (fi 0) of each pixel (i) in the image domain according to the linear transformation (fi 0 = yeIi + ze), where the guidance image (ye, ze) is the minimizer, and (q) is the filtering input, and (ɛ́) is a constant, Hi (x) and Ji (x) represent the variance of x [43], as shown below,
where (i) has multiple evaluations through e ∈ I, the filtering outcome g is clearly defined, because the average multipoint approximation can be written as,
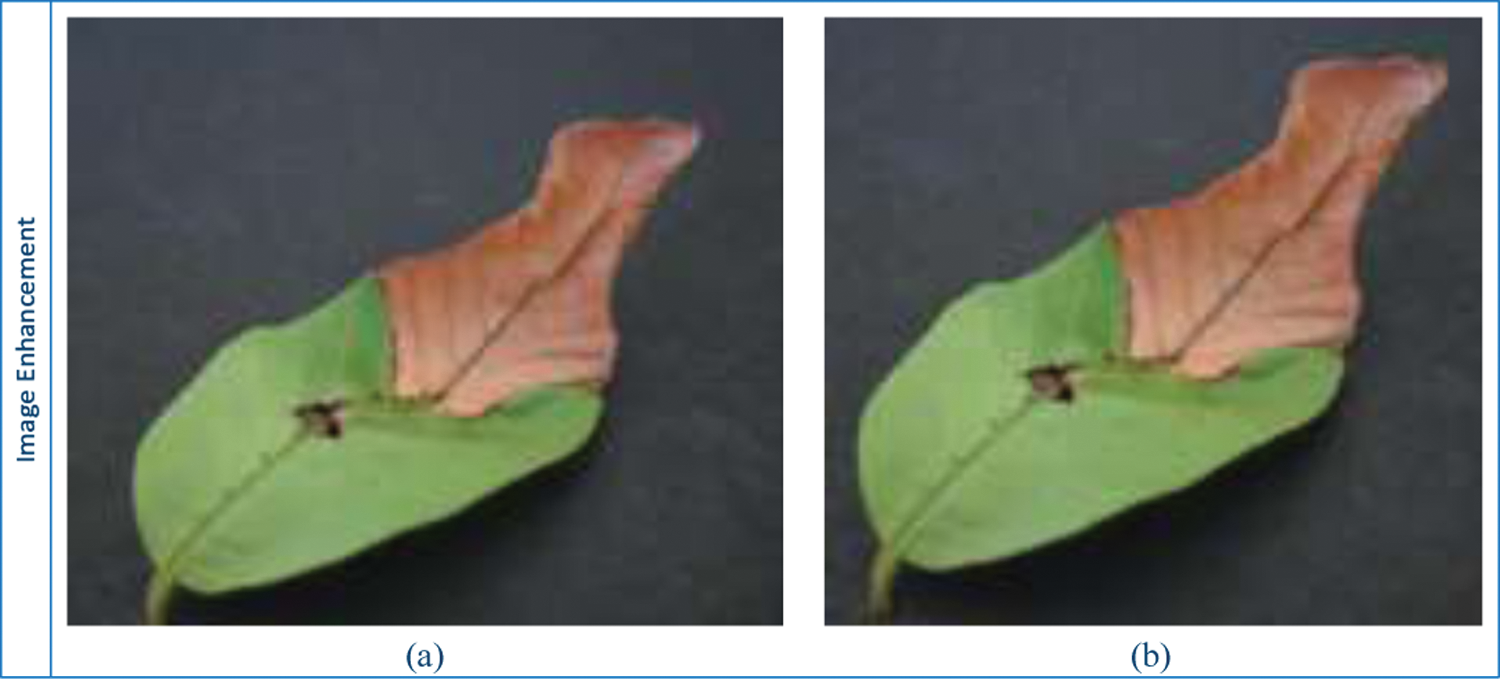
Figure 3: Image enhancement under Guided Filter and Gussian Blur methods
A threshold is applied in the L*a*b* space to detect leaf blight. Color detection based on the color characteristics of image pixels assumes that similar colors in the image are similar to separate groups, so the communication objects in the image are similar. In other words, each bundle describes a session that shares pixels of similar color. The detection result depends on the cast-off color space, so the color spaces in different schemes are not completely similar. We detect the target area and convert the images into binary images to achieve better visualization, as shown in Fig. 4. L * a * b * color conversion in color pitch ΔCp * ab refers to the degree of color [44] as follows,
The ΔL*, Δa*, and Δb* conversions in the L*, a*, and b* values are between the sample color and the mark color. Grace L* is similar to L* in the L*a*b* color space, Chroma c* and Metric Angle are,
a*, b* are the coordinates in the L*a*b* color space. We do not consider the metric angle variance for transformation quantities. W, however, calculate the “indicator modification” based on the following:
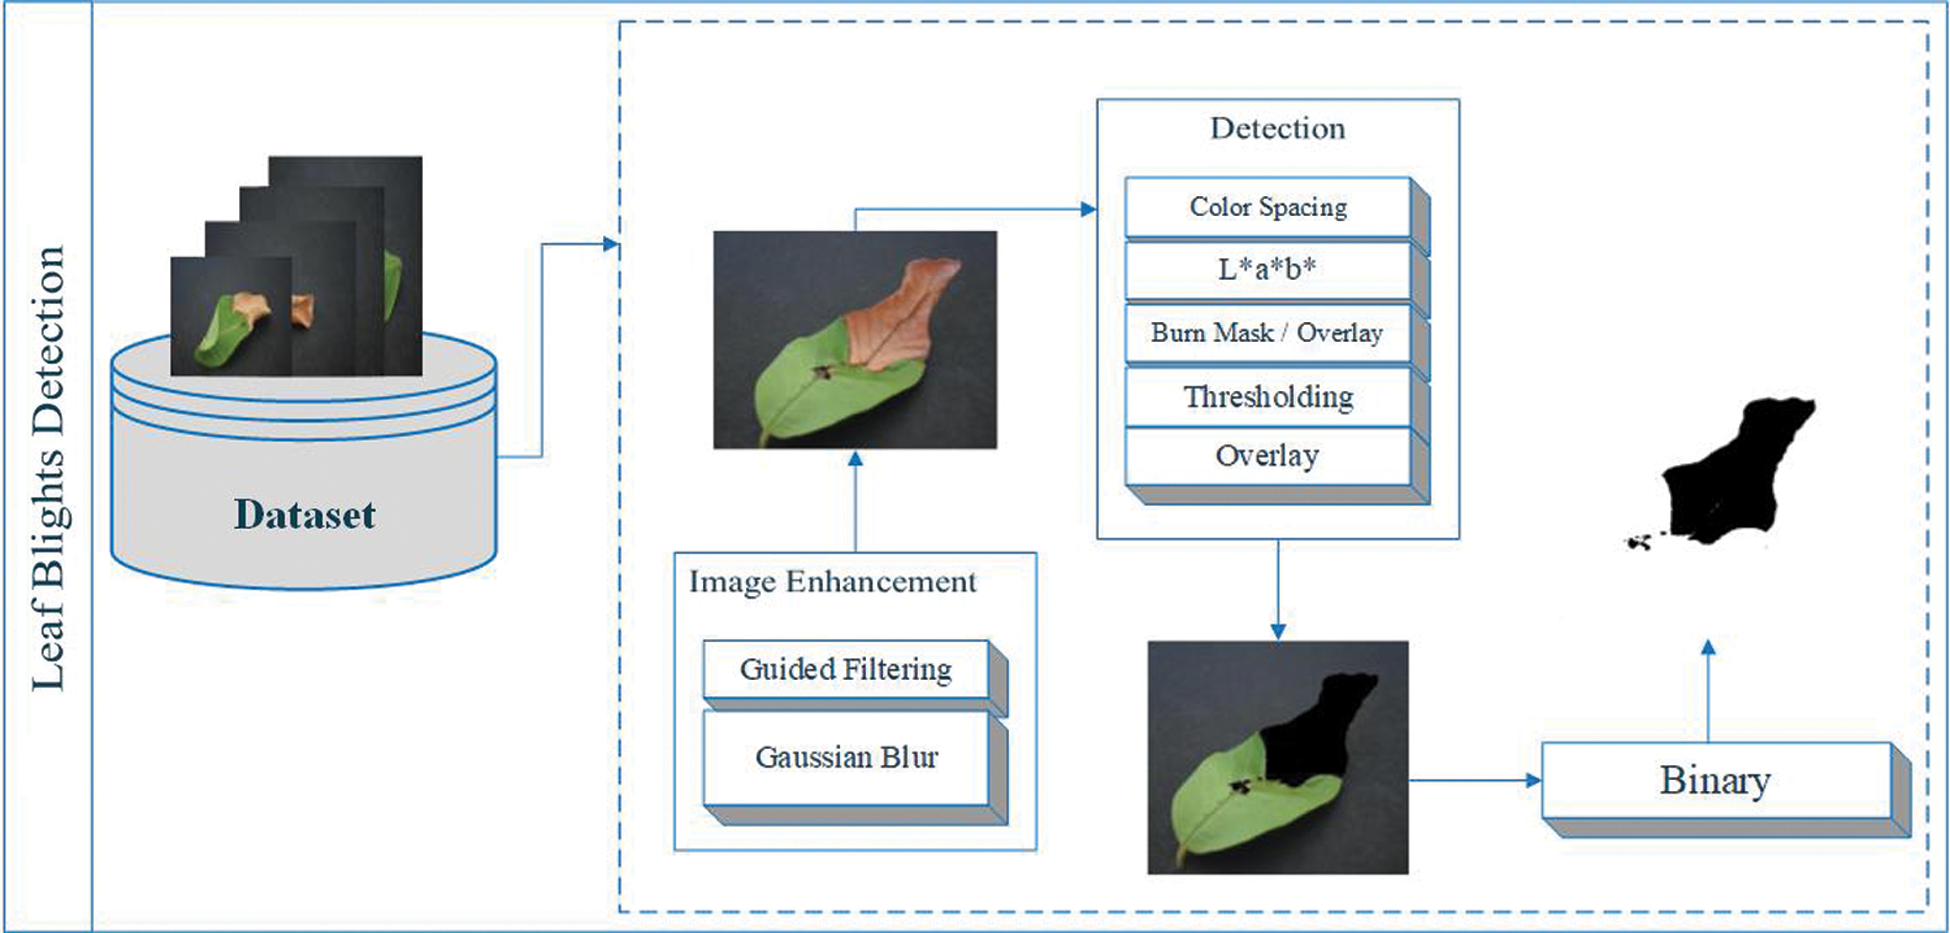
Figure 4: Leaf blights detection using L*a*b* color spacing
In the preliminary process, resizing and unit8 conversion are the preprocessing part of our proposed method. Resizing is a technique in which all slices of the matrix look like single insulated pixels in the displayed image. Several pictures (such as true color images) use super-dimensional arrays to represent the images. In a true color image, the first plane of extra size represents the intensity of red pixels, the second level represents the intensity of green pixels, and the third level represents the intensity of blue pixels. In order to adjust the size of the image quality, we use this technique to show two behaviours in the column. If the input image has additional dimensions, only the first two dimensions will be adjusted. In this article, we scale the size of each image in a 64 x 64 ratio [45], as follows,
The next part of the method is to use a deep CNN model for classification. In addition, we classified whether there is an implementation of L * a * b *. In this classification, we used SqueezeNet and ShuffleNet deep CNN models for feature extraction. SqueezeNet is a convolutional neural network (CNN) with a depth of 18 layers, while the ShuffleNet network has a depth of 50 layers. The CNN deep network container organizes images into 1000 object categories. Suppose X-ray and CT scan images contain categories, including color, shape, area of interest, etc. Therefore, the system has learned the satire function with a wide range of images. The image input size of the network is 256 × 256 [46–47]. We assume that the dimensional points are the contribution data of the feature extraction problems. For classification, we extract features from the deep CNN model SqueezeNet, which does not contain any features. The SqueezeNet imodel is mainly composed of convolutional sequences, which includes functions in the convolution and pooling layers. SqueezeNet is a CNN deep model with 18th layer depth. We load the pre-training type of the network that trains the image from the database, as shown in Fig. 5. SqueezeNet creates a smaller neural network with fewer constraints, which can fit directly into mainframe memory and can propagate in the network more easily [48].
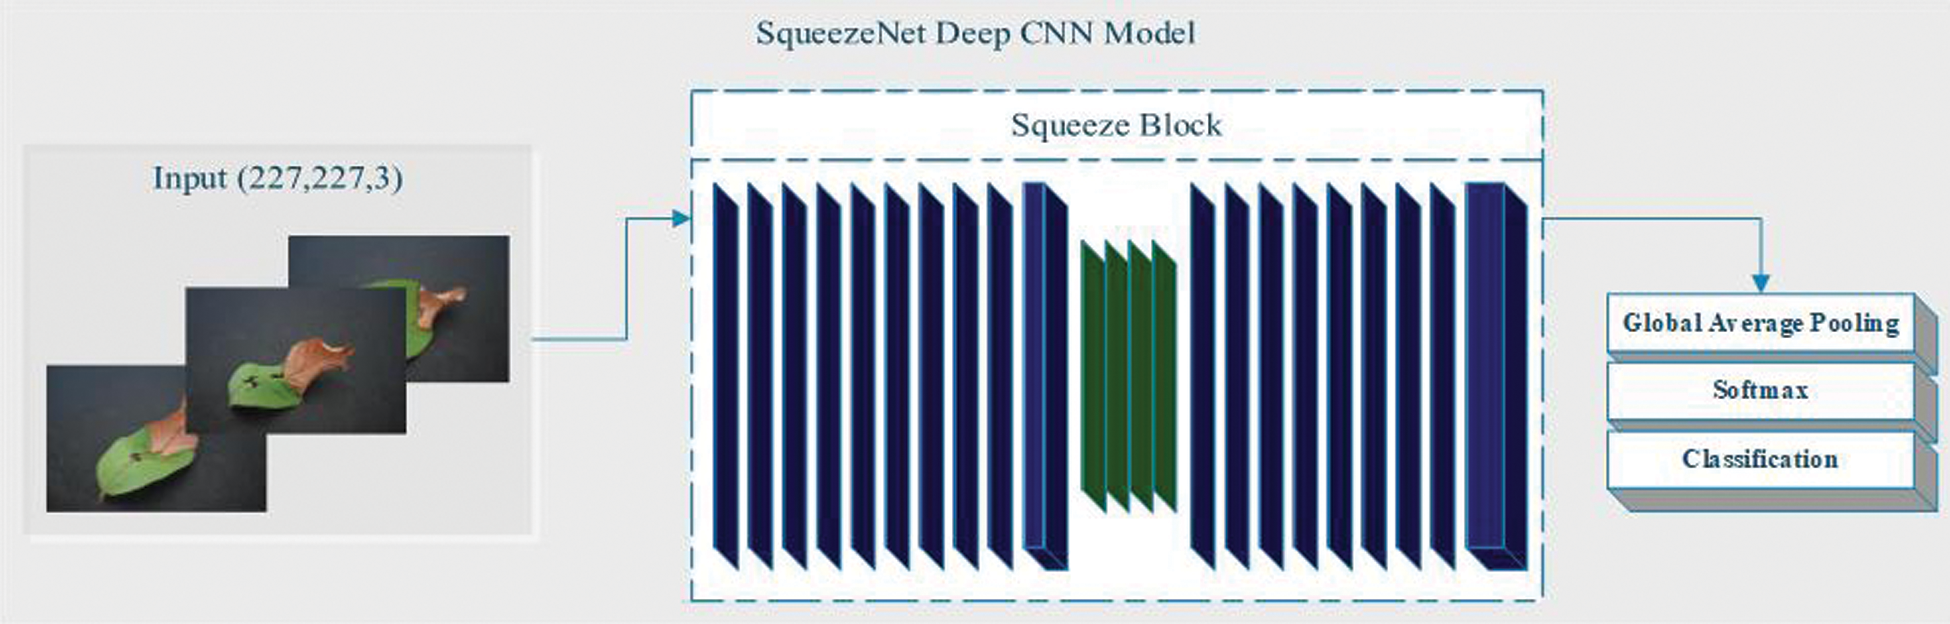
Figure 5: SqueezeNet Deep CNN Model
We also extract features from the ShuffleNet deep CNN model, which does not contain any features. The ShuffleNet model contains 1000 elements from the convolution and pooling layers. The final classification layer can supervise and propagate error signals, as shown in Fig. 6. Structure design operates two new processes, namely group convolution and channel shuffling. Classification and target detection experiments confirm the higher performance of ShuffleNet on other structures [49].
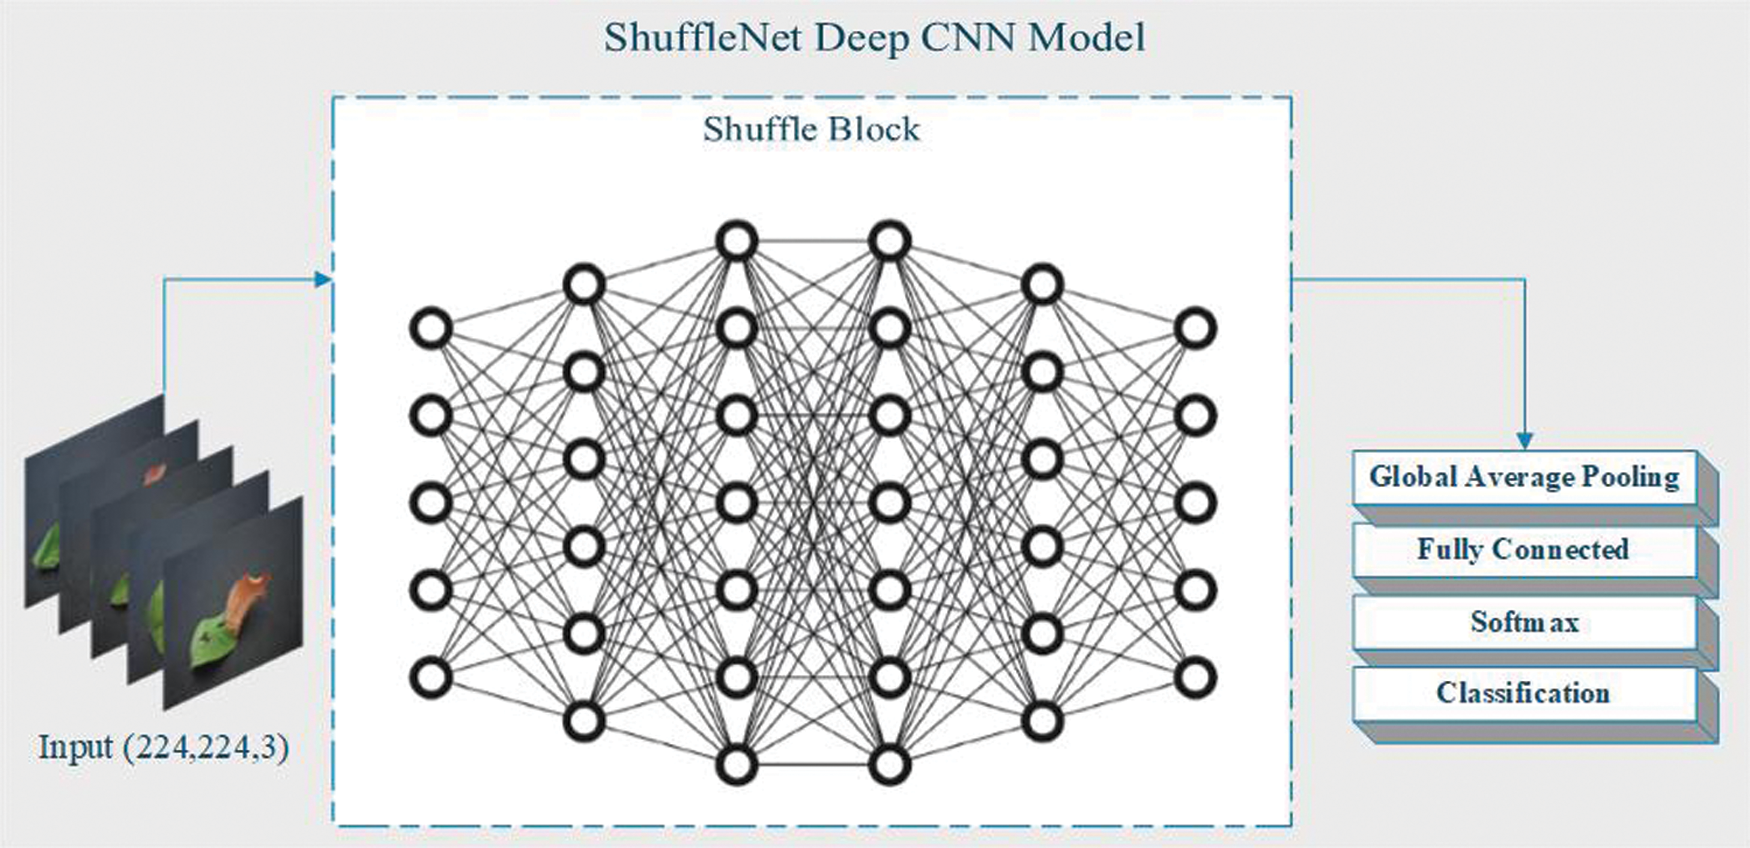
Figure 6: ShuffleNet Deep CNN model
After performing the preprocessing technique, entropy is used for feature reduction, which is pre-considered on some feature values in a single discretization container [50]. Interpretability continues to improve, but at the same time data loss is reduced. This can be done by creating novel, unrelated variables that are constantly changing. We use SqueezeNet and ShuffleNet Deep CNN models. These models contain layers that represent no images. Deep learning models are usually developed by neural networks, in which the weight can be adjusted to find the prediction mode [51]. In entropy mathematics (E(fn|e) and E(e|fn)) is the entropy represented by Shannon [52],
where additional standard founded on biased joint entropy presented by Chi [52] is:
After using entropy for feature selection, these selected features of the deep CNN model are merged. Feature fusion is a crucial technology in computer vision, which can be recognized as a special design classification problem, and many experiments have been carried out on this technology. Feature fusion technology can use multiple features of the image and compensate each other to obtain stronger and more accurate results. The feature fusion algorithm based on deep learning strengthens the feature learning process of deep neural network models. Feature fusion is expressed mathematically as,
In this section, we discuss experiments and test cases as proof of robust technology. All of these experiments were performed on data sets publicly available on Mendeley [53]. In this data set, we use guava leaves to detect and classify leaf blight. All these results are from a personal computer Lenovo T440 s, i7, 8GB Ram, and 500GB SSD. A large number of tests are being performed using isolated multiple functions. This article gives the results and proves that our contribution/method is reliable. This compression test is based on LEAF BLIGHTS Binary. A complete description of the test cases and experiments is given in Tab. 1.

There are several performance measurement techniques that can be used to analyze the performance of our system. Performance measurement is a process of analyzing system accuracy based on data collection. The error matrix is a measure used to analyze system performance based on classes. There are four types of conditional exits in the error matrix, that is, the statement is positive means the observation is positive, the statement is negative means the observation is incorrect, the statement is positive and the prediction is positive means that the observation and the prediction are both positive and the analysis is correct. Finally, one is that the statement is not affirmative, but the prediction is affirmative, which means that the observation is incorrect but the prediction is correct. These four conditions are denoted by TP, TN, FP, FN [54]. These conditions are expressed mathematically as,
We performed a number of the tests using the isolation number. Only the best results are presented in this article, proving that our contribution/method is reliable. This compression test is based on “leaf blight”. A complete description of the test cases and experiments is given in Tab. 1, which shows the detailed information of the test case, such as class, number of functions, etc.
This article introduces various experiments/test cases. The experiment was performed on the original data set and the enhanced data set to classify leaf blight with and without L*a*b* implementation. In these experiments, a 50:50 ratio was used in the training and testing process. The fold cross-10 is used to evaluate and estimate all results. In each test case, we choose the best SVM classifier result with training and prediction time. Using entropy, we selected 250 features of two deep CNN models. In these test cases, we selected 250 SqueezeNet functions and 250 ShuffleNet functions, and merged these functions together (250 SqueezeNet functions + 250 ShuffleNet functions) for classification, as shown in Tab. 2.

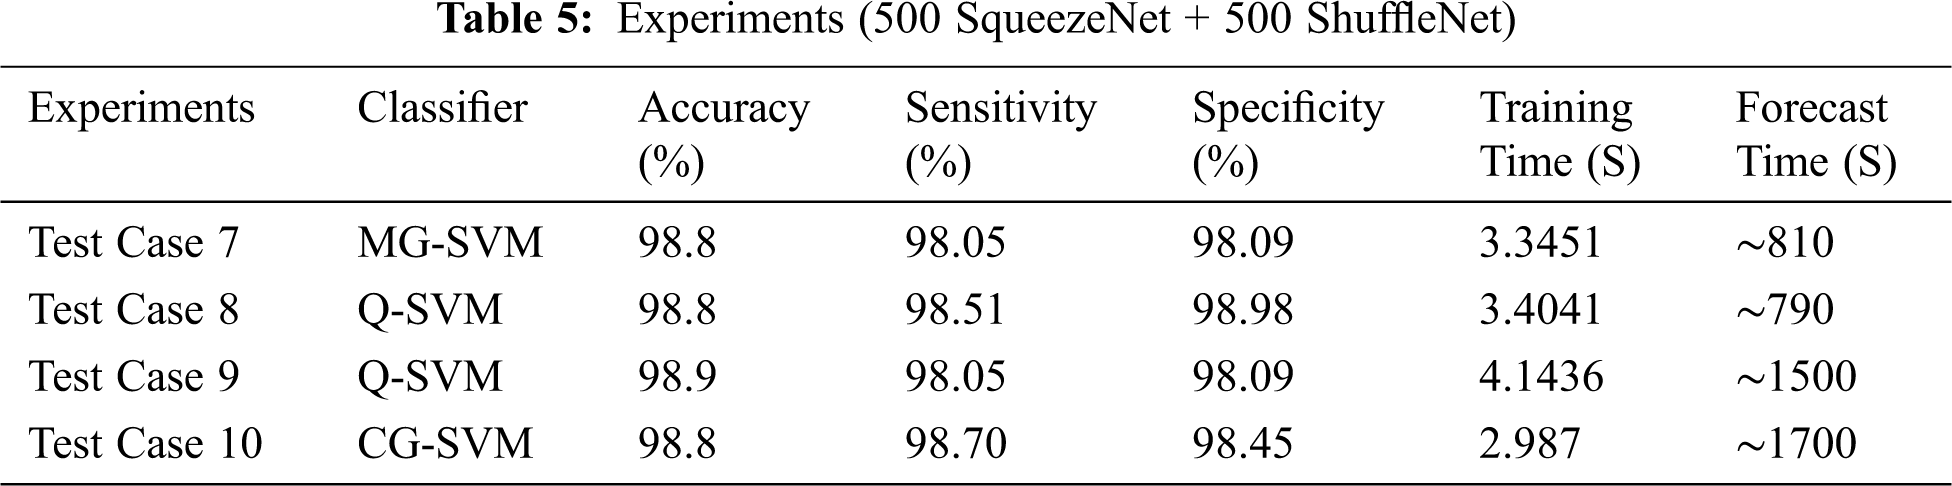
In individual test cases, we chose the best SVM classifier result with training and prediction time. Using entropy, we specified 500 features of two deep CNN models. In these test cases, we selected 500 SqueezeNet functions and 500 ShuffleNet functions, and merged these functions together (500 SqueezeNet functions + 500 ShuffleNet functions) for classification, as shown in Tab. 3.

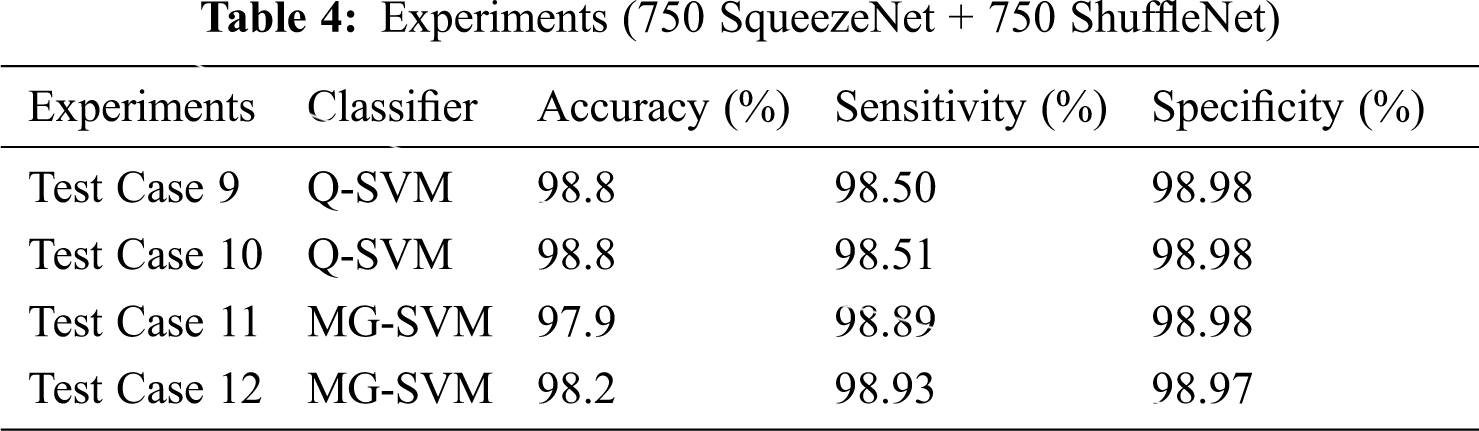
In more tests, we selected 750 features of two deep CNN models through entropy, and selected the best SVM classifier with training and prediction time. We use the original and the enhanced data sets, which are classified based on leaf blight, with or without L * a * b * implementation. We use the same 50:50 ratio for training and testing and evaluated the results using the fold cross-10. This time, we selected 750 SqueezeNet functions and 750 ShuffleNet functions, and merged these functions together (750 SqueezeNet functions + 750 ShuffleNet functions) for classification. The results are shown in Tab. 4.
We discussed different test cases based on the randomness of functions. We show the operating characteristic curve (ROC) of the receiver in Fig. 7. We noticed that by selecting the fusion of 500 features of SqueezeNet and ShuffleNet deep CNN models, we found the best results, as shown in Tab. 5. For feature selection, we use entropy because it is the best technique for dimensionality reduction and can provide the best results, proving that the proposed method is reliable.
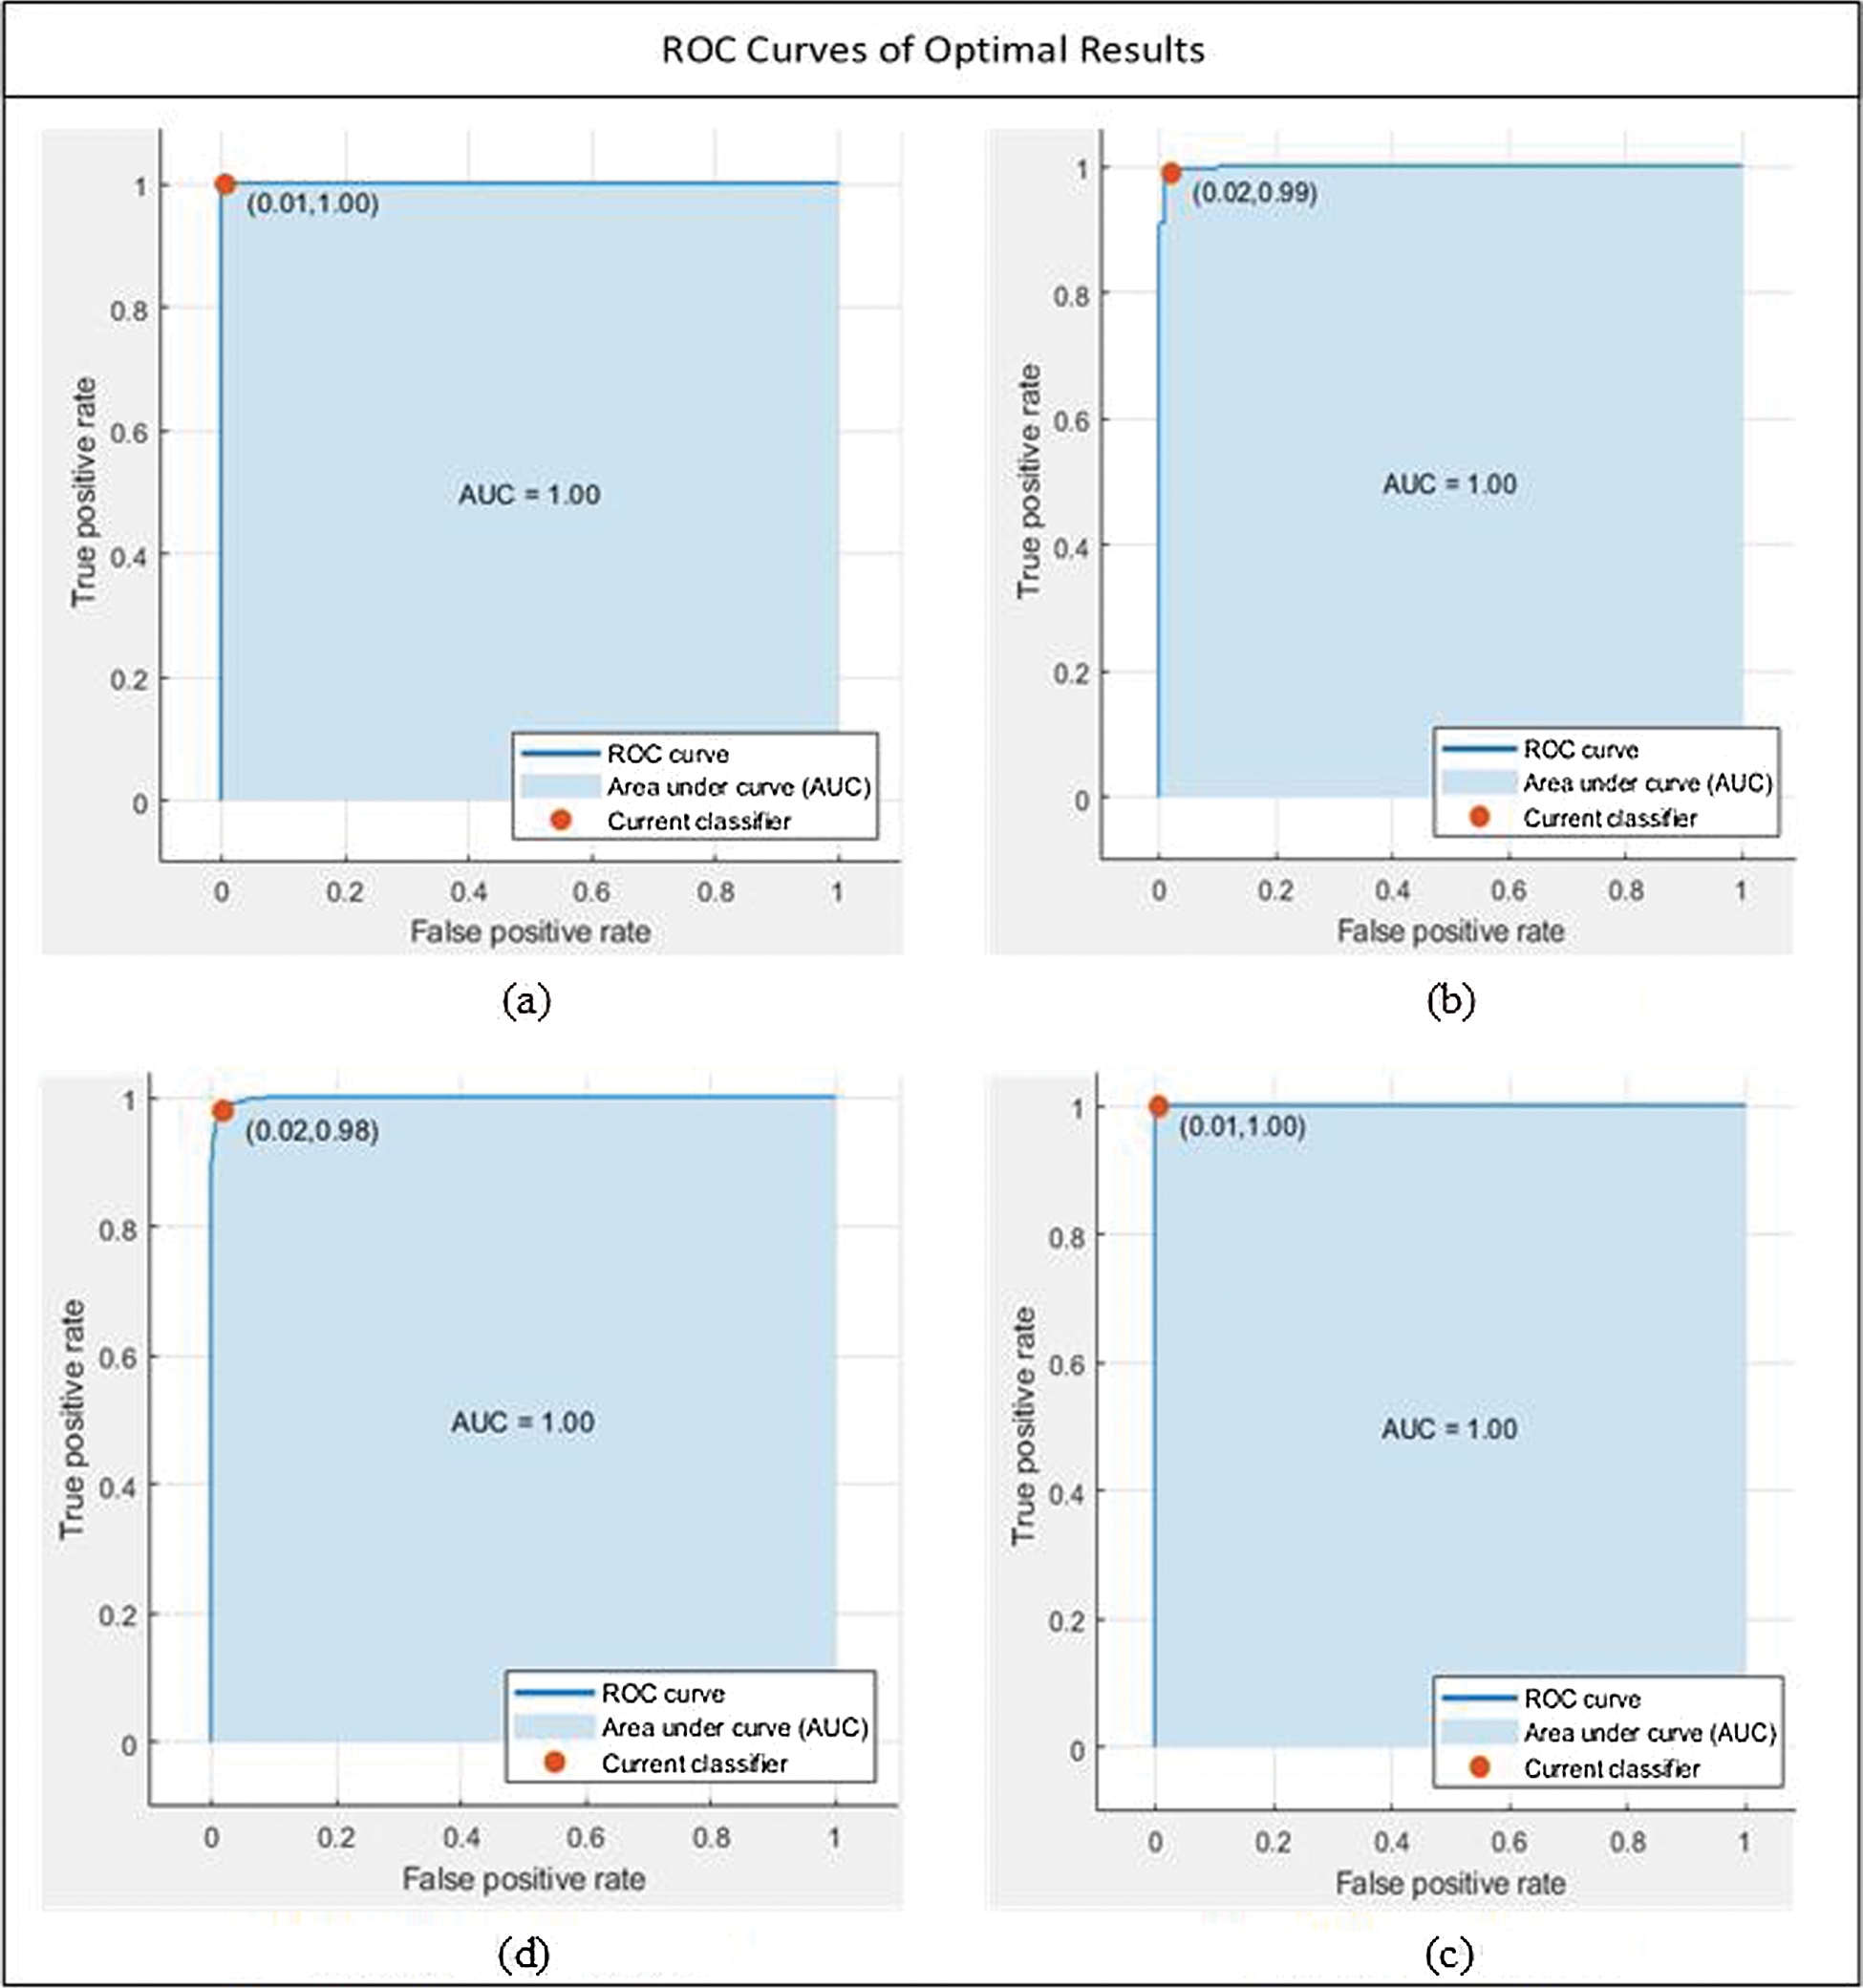
Figure 7: Optimal results under all of the cases. (a) MG-SVM, Test case 7, (b) Q-SVM, Test case 8, (c) CG-SVM, Test case 10, (d) Q-SVM, Test case 9
In the real world, many farmers are facing huge crop losses due to various diseases caused by pathogens. Therefore, early detection of diseases in crops is very important to prevent further losses. Previously, different machine learning models were used for this purpose. However, with the development of deep learning, we have seen broad prospects for deep learning in the field of agricultural disease detection. We propose a new method based on deep learning to detect “leaf blight” in crop leaves. We managed to merge the deep functions obtained from SqueezeNet and ShuffleNet and achieved 98% accuracy. Then, we use entropy for feature selection and reduction. Therefore, our proposed method can detect “leaf blight” early and help prevent the further loss of valuable crops. In future work, we can choose more features by optimizing different depth models to improve accuracy.
Acknowledgement: Dr. Kawther A. Al-Dhlan extends her thanks to the college of computer science and engineering at University of Ha'il for the continued encouragement and support for the scientific research.
Funding Statement: This work was supported by the Basic Science Research Program through the National Research Foundation (NRF) of Korea funded by the Ministry of Education under Grant 2018R1D1A1B07048948.
Conflicts of Interest: The authors declare that they have no conflicts of interest to report regarding the present study.
1. F. Uwamahoro, A. Berlin, C. Bucagu, H. Bylund and J. Yuen, “Potato bacterial wilt in Rwanda: Occurrence, risk factors, farmers’ knowledge and attitudes,” Food Security, vol. 10, no. 5, pp. 1221–1235, 2018. [Google Scholar]
2. A. V. Ruban, “Plants in light,” Communicative & Integrative Biology, vol. 2, no. 1, pp. 50–55, 2019. [Google Scholar]
3. K. Lubis, F. J. M. Maathuis and I. Safni, “Mapping Bacterial Leaf Blight Disease of Rice (Xanthomonas Oryzae pv Oryzae ) in North Sumatra,” in Proc. IOP-EEC, vol. 454, pp. 12160, 2020. [Google Scholar]
4. F. M. Latterell, “Gray leaf spot of corn: A disease on the move,” Plant Disease, vol. 67, no. 8, pp. 842, 1983. [Google Scholar]
5. S. A. Miller, F. D. Beed and C. L. Harmon, “Plant disease diagnostic capabilities and networks,” Annual Review of Phytopatholy, vol. 47, no. 1, pp. 15–38, 2009. [Google Scholar]
6. V. Swetha and R. Jayaram, “A novel method for plant leaf malady recognition using machine learning classifiers,” in proc. CAT, Coimbatore, India, pp. 1360–1365, 2019. [Google Scholar]
7. S. Poornima, S. Kavitha, S. Mohanavalli and N. Sripriya, “Detection and classification of diseases in plants using image processing and machine learning techniques,” in Proc. AIP, vol. 2095, no. 1, pp. 30018, 2019. [Google Scholar]
8. K. Karadağ, M. E. Tenekeci, R. Taşaltın and A. Bilgili, “Detection of pepper fusarium disease using machine learning algorithms based on spectral reflectance,” Sustainable Computing: Informatics and Systems, vol. 28, pp. 100299, 2019. [Google Scholar]
9. P. Panchal, V. C. Raman and S. Mantri, “Plant Diseases Detection and Classification Using Machinelearning Models,” in Proc. Computational Systems and Information Technology for Sustainable Solution, Bengaluru, India, pp. 1–6, 2019. [Google Scholar]
10. S. Mahapatra, S. Kannoth, R. Chiliveri and R. Dhannawat, “Plant leaf classification and disease recognition using SVM, a machine learning approach,” Sustainable Humanosphere, vol. 16, no. 1, pp. 1817–25, 2020. [Google Scholar]
11. A. S. Tulshan and N. Raul, “Plant leaf disease detection using machine learning,” in proc. ICCCNT, Kanpur, India, pp. 1–6, 2019. [Google Scholar]
12. K. Balakrishna and M. Rao, “Tomato plant leaves disease classification using KNN and PNN:,” International Journal of Computer Vision and Image Processing, vol. 9, no. 1, pp. 51–63, 2019. [Google Scholar]
13. V. Vimal Adit, C. V. Rubesh, S. Sanjay Bharathi, G. Santhiya and R. Anuradha, “A comparison of deep learning algorithms for plant disease classification,” in Proc. ACCMLCT, vol. 643, pp. 153–161, 2020. [Google Scholar]
14. B. Richey, S. Majumder, M. V. Shirvaikar and N. Kehtarnavaz, “Real-time detection of maize crop disease via a deep learning-based smartphone app,” in proc. RTIPDL 2020, online only, United States, pp. 10, 2020. [Google Scholar]
15. M. Hasan, B. Tanawala and K. J. Patel, “Deep Learning Precision Farming: Tomato Leaf Disease Detection by Transfer Learning,” in proc. ACSE, Sultanpur, India, 2019. [Google Scholar]
16. S. Coulibaly, B. Kamsu-Foguem, D. Kamissoko and D. Traore, “Deep neural networks with transfer learning in millet crop images,” Computers in Industry, vol. 108, pp. 115–120, 2019. [Google Scholar]
17. M. Bah, A. Hafiane and R. Canals, “Deep learning with unsupervised data labeling for weed detection in line crops in UAV images,” Remote Sensing, vol. 10, no. 11, pp. 1690, 2018. [Google Scholar]
18. B. Espejo-Garcia, N. Mylonas, L. Athanasakos, S. Fountas and I. Vasilakoglou, “Towards weeds identification assistance through transfer learning,” Computers and Electronics in Agriculture, vol. 171, pp. 105306, 2020. [Google Scholar]
19. S. Mishra, R. Sachan and D. Rajpal, “Deep convolutional neural network based detection system for real-time corn plant disease recognition,” Proc. Computer Science, vol. 167, pp. 2003–2010, 2020. [Google Scholar]
20. X. Zhang, Y. Qiao, F. Meng, C. Fan and M. Zhang, “Identification of maize leaf diseases using improved deep convolutional neural networks,” IEEE Access, vol. 6, pp. 30370–30377, 2018. [Google Scholar]
21. J. Arora, U. Agrawal and P. Sharma, “Classification of maize leaf diseases from healthy leaves using deep forest,” Journal of Artificial Intelligence and Systems, vol. 2, no. 1, pp. 14–26, 2020. [Google Scholar]
22. A. N. Alves, W. S. R. Souza and D. L. Borges, “Cotton pests classification in field-based images using deep residual networks,” Computers and Electronics in Agriculture, vol. 174, pp. 105488, 2020. [Google Scholar]
23. S. Ghosal and K. Sarkar, “Rice leaf diseases classification using CNN with transfer learning,” in Proc. IEEE CALCON, Kolkata, India, pp. 230–236, 2020. [Google Scholar]
24. S. Patidar, A. Pandey, B. A. Shirish and A. Sriram, “Rice Plant Disease Detection and Classification Using Deep Residual Learning,” in Proc. MLIPNSDS, vol. 1240, pp. 278–293, 2020. [Google Scholar]
25. S. Verma, A. Chug and A. P. Singh, R. Ghazali in “Impact of Hyperparameter Tuning on Deep Learning Based Estimation of Disease Severity in Grape Plant,” in Proc. RASCDM, vol. 978, pp. 161–171, 2020. [Google Scholar]
26. K. Li, J. Lin, J. Liu and Y. Zhao, “Using deep learning for image-based different degrees of ginkgo leaf disease classification,” Information, vol. 11, no. 2, pp. 95, 2020. [Google Scholar]
27. D. Argüeso, A. Picon, U. Irusta, A. Medela, M. G. San-Emeterio et al., “Few-shot learning approach for plant disease classification using images taken in the field,” Computers and Electronics in Agriculture, vol. 175, pp. 105542, 2020. [Google Scholar]
28. Y. Zhong and M. Zhao, “Research on deep learning in apple leaf disease recognition,” Computers and Electronics in Agriculture, vol. 168, pp. 105146, 2020. [Google Scholar]
29. A. Paul, S. Ghosh, A. K. Das, S. Goswami, S. Das Choudhury et al., “A review on agricultural advancement based on computer vision and machine learning,” in Proc. ETMG, vol. 937, pp. 567–581, 2020. [Google Scholar]
30. U. Shruthi, V. Nagaveni and B. K. Raghavendra, “A Review on Machine Learning Classification Techniques for Plant Disease Detection,” in Proc. ICACCS, Coimbatore, India, pp. 281–284, 2019. [Google Scholar]
31. M. Loey, A. ElSawy and M. Afify, “Deep learning in plant diseases detection for agricultural crops: A survey,” International Journal of Service Science, Management, Engineering, and Technology, vol. 11, no. 2, pp. 41–58, 2020. [Google Scholar]
32. B. T. Bestelmeyer, G. Marcillo, S. E. McCord, S. Mirsky, G. Moglen et al., “Scaling up agricultural research with artificial intelligence,” IT Professional, vol. 22, no. 3, pp. 33–38, 2020. [Google Scholar]
33. N. Nandhini and R. Bhavani, “Feature extraction for diseased leaf image classification using machine learning,” in Proc. ICCCI, Coimbatore, India, pp. 1–4, 2020. [Google Scholar]
34. Z. Unal, “Smart farming becomes even smarter with deep learning—A bibliographical analysis,” IEEE Access, vol. 8, pp. 105587–105609, 2020. [Google Scholar]
35. K. Aurangzeb, F. Akmal, M. Attique Khan, M. Sharif and M. Y. Javed, “Advanced machine learning algorithm based system for crops leaf diseases recognition,” in Proc. CDMA, Riyadh, pp. 146–151, 2020. [Google Scholar]
36. T. U. Rehman, M. S. Mahmud, Y. K. Chang, J. Jin and J. Shin, “Current and future applications of statistical machine learning algorithms for agricultural machine vision systems,” Computers and Electronics in Agriculture, vol. 156, pp. 585–605, 2019. [Google Scholar]
37. X. Sun, S. Mu, Y. Xu, Z. Cao and T. Su, “Image recognition of tea leaf diseases based on convolutional neural network,” ArXiv190102694 Accessed: 14-07-2020. [Online]. Available: http://arxiv.org/abs/1901.02694. [Google Scholar]
38. M. Chen, F. Brun, M. Raynal and D. Makowski, “Forecasting severe grape downy mildew attacks using machine learning,” PLOS One, vol. 15, no. 3, pp. e0230254, 2020. [Google Scholar]
39. S. Przybylek, “Color space: Definition & conversion,” 2016. [Online]. Available: https://study.com/academy/lesson/color-space-definition-conversion.html. [Google Scholar]
40. “What is guided image filtering? - MATLAB & Simulink.” https://www.mathworks.com/help/images/what-is-guided-image-filtering.html. [Google Scholar]
41. K. He, J. Sun and X. Tang, “Guided image filtering,” IEEE Transactions on Pattern Analysis and Machine Intelligence, vol. 35, no. 6, pp. 1397–1409, 2013. [Google Scholar]
42. S. Misra, Y. Wu, “Gaussian Blur—A overview | ScienceDirect Topics,” 2020. [Online]. Available: https://www.sciencedirect.com/topics/engineering/gaussian-blur. [Google Scholar]
43. L. Dai, M. Yuan, L. Tang, Y. Xie, X. Zhang et al., “Interpreting and extending the guided filter via cyclic coordinate descent,” IEEE Transactions on Image Processing, vol. 28, no. 2, pp. 767–778, 2019. [Google Scholar]
44. “L*a*b* Color Space/Uniform Color Space - Part IV - Precise Color Communication | KONICA MINOLTA,” [Online] Available: https://www.konicaminolta.com/instruments/knowledge/color/part4/05.html. [Google Scholar]
45. “Resize image - MATLAB imresize.” [Online]. Available: https://www.mathworks.com/help/images/ref/imresize.html. [Google Scholar]
46. “DarkNet-53 convolutional neural network - MATLAB darknet53,” [Online]. Available: https://www.mathworks.com/help/deeplearning/ref/darknet53. [Google Scholar]
47. “DenseNet-201 convolutional neural network - MATLAB densenet201.” [Online]. Available: https://www.mathworks.com/help/deeplearning/ref/densenet201.html#description. [Google Scholar]
48. “SqueezeNet convolutional neural network - MATLAB squeezenet.” [Online]. Available: https://www.mathworks.com/help/deeplearning/ref/squeezenet.html. [Google Scholar]
49. “Pretrained ShuffleNet convolutional neural network - MATLAB shufflenet.” [Online]. Available: https://www.mathworks.com/help/deeplearning/ref/shufflenet.html. [Google Scholar]
50. C. M. Vastrad, “Important molecular descriptors delection using self tuned reweighted sampling method for prediction of antituberculosis activity,” arXiv preprint arXiv:1402.5360. [Google Scholar]
51. E. Allibhai, “Building a deep learning model using keras,” Medium, 2014. [Online]. Available: https://towardsdatascience.com/building-a-deep-learning-model-using-keras-1548ca149d37. [Google Scholar]
52. J. Biesiada, W. Duch, A. Kachel, K. Maczka and S. Palucha, “Feature ranking methods based on information entropy with parzen windows,” in Proc. REAI, vol. 1, pp. 1, 2005. [Google Scholar]
53. S. S. Chouhan, A. Kaul, U. P. Singh and S. Jain, “A database of leaf images: practice towards plant conservation with plant pathology,” in Proc. ISCON, vol. 4, pp. 700–707, 2020. [Google Scholar]
54. “Confusion Matrix in Machine Learning,” GeeksforGeeks, 2020. [Online]. Available: https://www.geeksforgeeks.org/confusion-matrix-machine-learning/. [Google Scholar]
 | This work is licensed under a Creative Commons Attribution 4.0 International License, which permits unrestricted use, distribution, and reproduction in any medium, provided the original work is properly cited. |