DOI:10.32604/iasc.2022.018753
| Intelligent Automation & Soft Computing DOI:10.32604/iasc.2022.018753 | |
| Article |
Determination of COVID-19 Patients Using Machine Learning Algorithms
1Department of Software Engineering, The Superior College, Lahore, 54000, Pakistan
2Department of Informatics and Systems, University of Management and Technology, Lahore, 54000, Pakistan
3INP-ENIT, University of Toulouse, 65000, France
4Department of Computer Science, The Superior College, Lahore, 54000, Pakistan
*Corresponding Author: Muhammad Waseem Iqbal. Email: waseem.iqbal@superior.edu.pk
Received: 20 March 2021; Accepted: 18 May 2021
Abstract: Coronavirus disease (COVID-19), also known as Severe acute respiratory syndrome (SARS-COV2) and it has imposed deep concern on public health globally. Based on its fast-spreading breakout among the people exposed to the wet animal market in Wuhan city of China, the city was indicated as its origin. The symptoms, reactions, and the rate of recovery shown in the coronavirus cases worldwide have been varied . The number of patients is still rising exponentially, and some countries are now battling the third wave. Since the most effective treatment of this disease has not been discovered so far, early detection of potential COVID-19 patients can help isolate them socially to decrease the spread and flatten the curve. In this study, we explore state-of-the-art research on coronavirus disease to determine the impact of this illness among various age groups. Moreover, we analyze the performance of the Decision tree (DT), K-nearest neighbors (KNN), Naïve bayes (NB), Support vector machine (SVM), and Logistic regression (LR) to determine COVID-19 in the patients based on their symptoms. A dataset obtained from a public repository was collected and pre-processed, before applying the selected Machine learning (ML) algorithms on them. The results demonstrate that all the ML algorithms incorporated perform well in determining COVID-19 in potential patients. NB and DT classifiers show the best performance with an accuracy of 93.70%, whereas other algorithms, such as SVM, KNN, and LR, demonstrate an accuracy of 93.60%, 93.50%, and 92.80% respectively. Hence, we determine that ML models have a significant role in detecting COVID-19 in patients based on their symptoms.
Keywords: Coronavirus; machine learning; naïve bayes; decision tree; disease analysis
The COVID-19 is a harmful and detrimental illness impacting the entire world. The earliest cases were found in a city named Wuhan of China, in the last week of December 2019, followed by a rapid spread globally. Most people infected by this disease undergo moderate treatment to reduce respiratory illness and improve without needing a specific method. The COVID-19 virus develops substantially from droplets of saliva and the release of the nose, and it spreads from individual to individual [1]. Even after more than a year of the generation of this disease, the most effective treatment have not been successfully launched. However, various continuous clinical experiments are assessing the best possible approaches of cure, and vaccinations are developed. Since the vaccines are not yet mature, other techniques like early detection of the disease can be effective to decrease the spread. Artificial intelligence (AI) approaches, including machine learning approaches [2] and deep learning algorithms [3], play an essential role in prediction for this disease like outbreak prediction [4,5], high-risk patients’ identification [6], COVID-19 analysis with clinical features [7], spread probability analysis [8], ways to combat this disease [9], and death risk in patients. The recent advancement in AI and data mining approaches to solve medical problems emphasize that they can improve the epidemic situation [10]. Mohamad et al. [11] developed a system that showed high accuracy in predicting the life risk of patients based on physiological conditions, symptoms, and demographics. Allae et al. [12] predicted the threshold of COVID-19 cases in a region by generating a ML model. Ardabili et al. [13] suggested that amalgamation of ML models and soft computing models can help predict outbreaks. Old-aged people, especially the ones with underlying illnesses like cardiovascular disorder, diabetes, persistent lung infection, and cancer are witnessed to be primarily harmed by this severe disease. Additionally, there are now signs that the demographics and profile of patients passing in China or one part of the world may not be equivalent to that in the other parts of the world, so it is valuable for individuals of any age to take extraordinary safety measures.
Machine learning is playing a vital role in multiple areas that were previously thought to be only human-centric tasks. They are utilized to integrate heterogeneous biomedical data sources to generate predictive models using data of symptoms obtained from clinical test data. This research aims to determine how accurately a COVID-19 positive patient can be identified based on their symptoms. The main objective of our research is to analyze the performance of supervised machine learning algorithms, including DT, KNN, NB, LR, and SVM, by examining their classification reports to determine the best performing algorithm.
In most cases, the signs of COVID-19 emerge after an incubation span of nearly 5.2 days [14]. Whereas, it has been observed that the entire span of the disease ranges between 6 to 41 days, with an average of around two weeks. It has been observed that the containment span of the disease is proportional to the age and immunity strength of the patient. Fig. 1 shows the most common symptoms found in coronavirus patients. In the COVID-19 cases, the patients show distinct signs during the incubation period or soon after that. The prevalent symptoms reported of the disease are as follows [15]:
The most common symptoms felt by potential patients are Fever, Cough, and Fatigue.
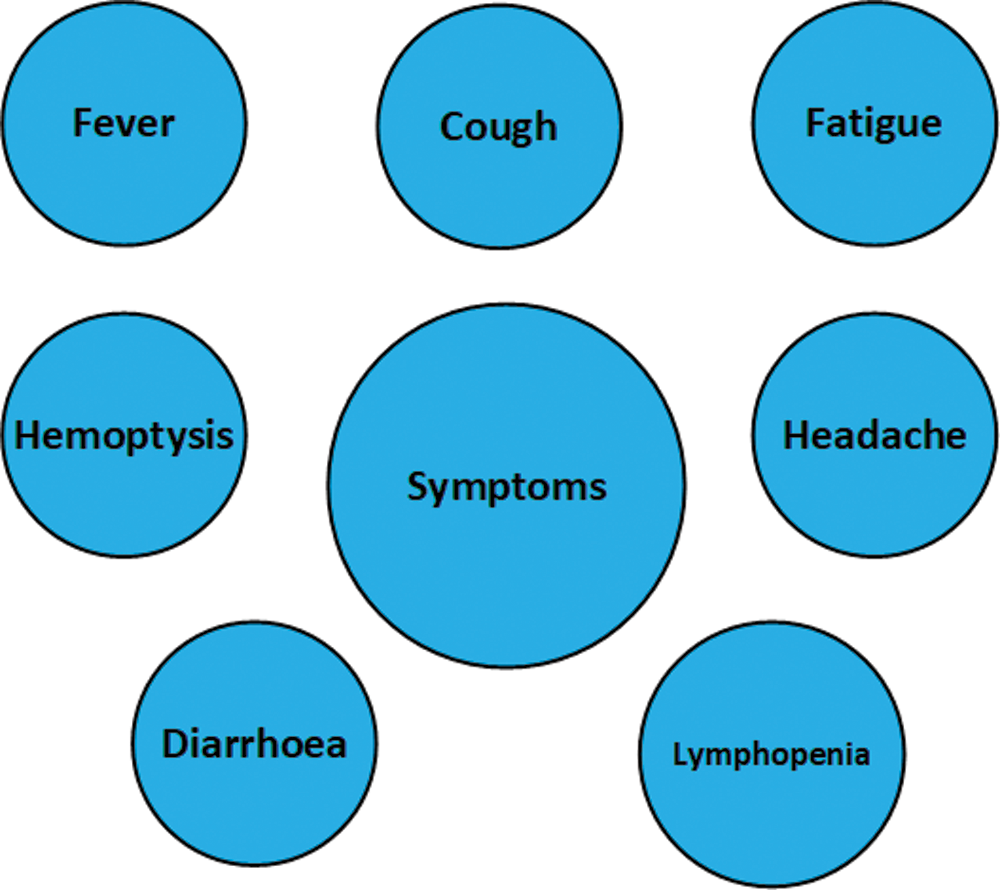
Figure 1: Symptoms of COVID-19
2.2 Other Less Common Symptoms
In some cases, the potential patients showed signs such as production of Sputum, Headache, Hemoptysis, Diarrhea, Dyspnea, and Lymphopenia.
The previous studies, examinations, or experiments to combat this severe infection are numerous and still being counted. A prominent method to regulate coronavirus toxicities is through drug administration [16]. A total of 80 cases, tested positive COVID-19 were analyzed and characterized concerning the World health organization (WHO) guidelines in grade 3 hospitals located in Jiangsu. The discovery of the disease in the respiratory trials was conducted with the help of a Reverse stranscription-polymerase chain reaction (RT-PCR). Among the total 80 patients, the number of female subjects was 41, with an average age of 46.1 years [17].
It was observed that 77 patients were mildly infected, and 3 were severely ill. A total of 38 subjects had a history of persistent diseases. 63 subjects reported symptoms of fever, and 51 subjects showed signs of cough. Observation of the patient’s lung images demonstrated atypical shadows on 55 patients’ scans, whereas 25 had no shade. No deaths were reported in the scenario, and the number of patients discharged within 8 days was 21. Hence it is seen that the cases in Jiangsu were mild as compared to that of Wuhan in terms of effects such as liver dysfunction and atypical activities in the lungs [18].
According to clinical information from 13th January till 19th February 2020, there were 28 COVID-19 patients infected in Wuhan city. In infected patients, 60.7% are male, and their age was around 65 years [19]. Seven investigations were analyzed for meta-examination. The outcomes demonstrated that the most predominant clinic manifestations were fever 91.3%, weariness 51.0%, and dyspnea 30.4% [20].
Zunyou et al. summarized the key points from a significant publication by the Chinese centre comprising a report of 72,314 cases. Of these, 44,672 were confirmed cases, 16,186 were suspected cases, and 10,567 were diagnosed based on symptoms, and 889 were asymptomatic. About 87% of the patients were aged 30 to 79, which shows that coronavirus affects older people more than younger ones [21]. In the same league, Heshui shi et al. presented a study to describe the CT scans of 81 patients and determined that a combined examination of imaging features and clinical data can help in the early diagnosis of COVID-19 disease [22]. A couple of applicants have indicated viability in vitro investigations, and not many have advanced to a randomized creature or human preliminaries, subsequently may have restricted use to counter COVID-19 contamination [23]. Ying et al. [24] analyzed the reproduction number (R0) that points out the transmissibility of the disease from one person to another person. The results showed that the value of R0 is substantially higher than the value estimated by WHO.
Qiurong ruan et al. conducted a multicenter study of 68 deaths and 82 discharged reports of COVID-19 diagnosed patients. They concluded that fatal outcome was observed in cases of older people with the presence of secondary infections and increased inflammatory indicators in the blood. They also stated that the risk of mortality is higher in cases of cytokine storm syndrome [25]. Neurological side effects fall into three classes: focal sensory system that is the side effects of Central nervous system (CNS), ailments (migraine, discombobulation, disabled awareness, ataxia, intense cerebrovascular infection, and epilepsy), and fringe sensory system, peripheral nervous system (PNS) side and skeletal muscle injury [26].
It is determined that RT-PCR testing is the most practical and efficient diagnosis test for COVID-19 determination, but Chest CT scan analysis is also a competent diagnosis method. For comparing the diagnostic value and consistency, Tao et al. [27] conducted a study and the results showed that Chest CT scans are highly sensitive for COVID-19 detection and can be used as the main tool. Analysis of symptoms and patients’ history shows that COVID-19 spreads through direct contact [28]. Although the cases reported in Jiangsu are comparatively moderate as compared with Wuhan [29].
Detection of COVID-19 carriers is critically important because, with an absence of a potential vaccine, only effective method to cope with spread of this disease is by detecting the potentially infected people and isolating them from healthy people [30]. Mizner et al. [31] presented a review of the existing detection methods showing that each method has its shortcoming, hence amore efficient system needs to be created.
Prabira et al. analyzed 11 different Convolutional neural networks (CNN) systems and suggested an accurate support vector framework that incorporates SVM with classification models like Residual neural network (ResNet50) to the class of patients showing signs of coronavirus from X-Ray scans of potential sufferers. The ResNet50 plus model showed higher accuracy on the data that they obtained from multiple online data repositories [32].
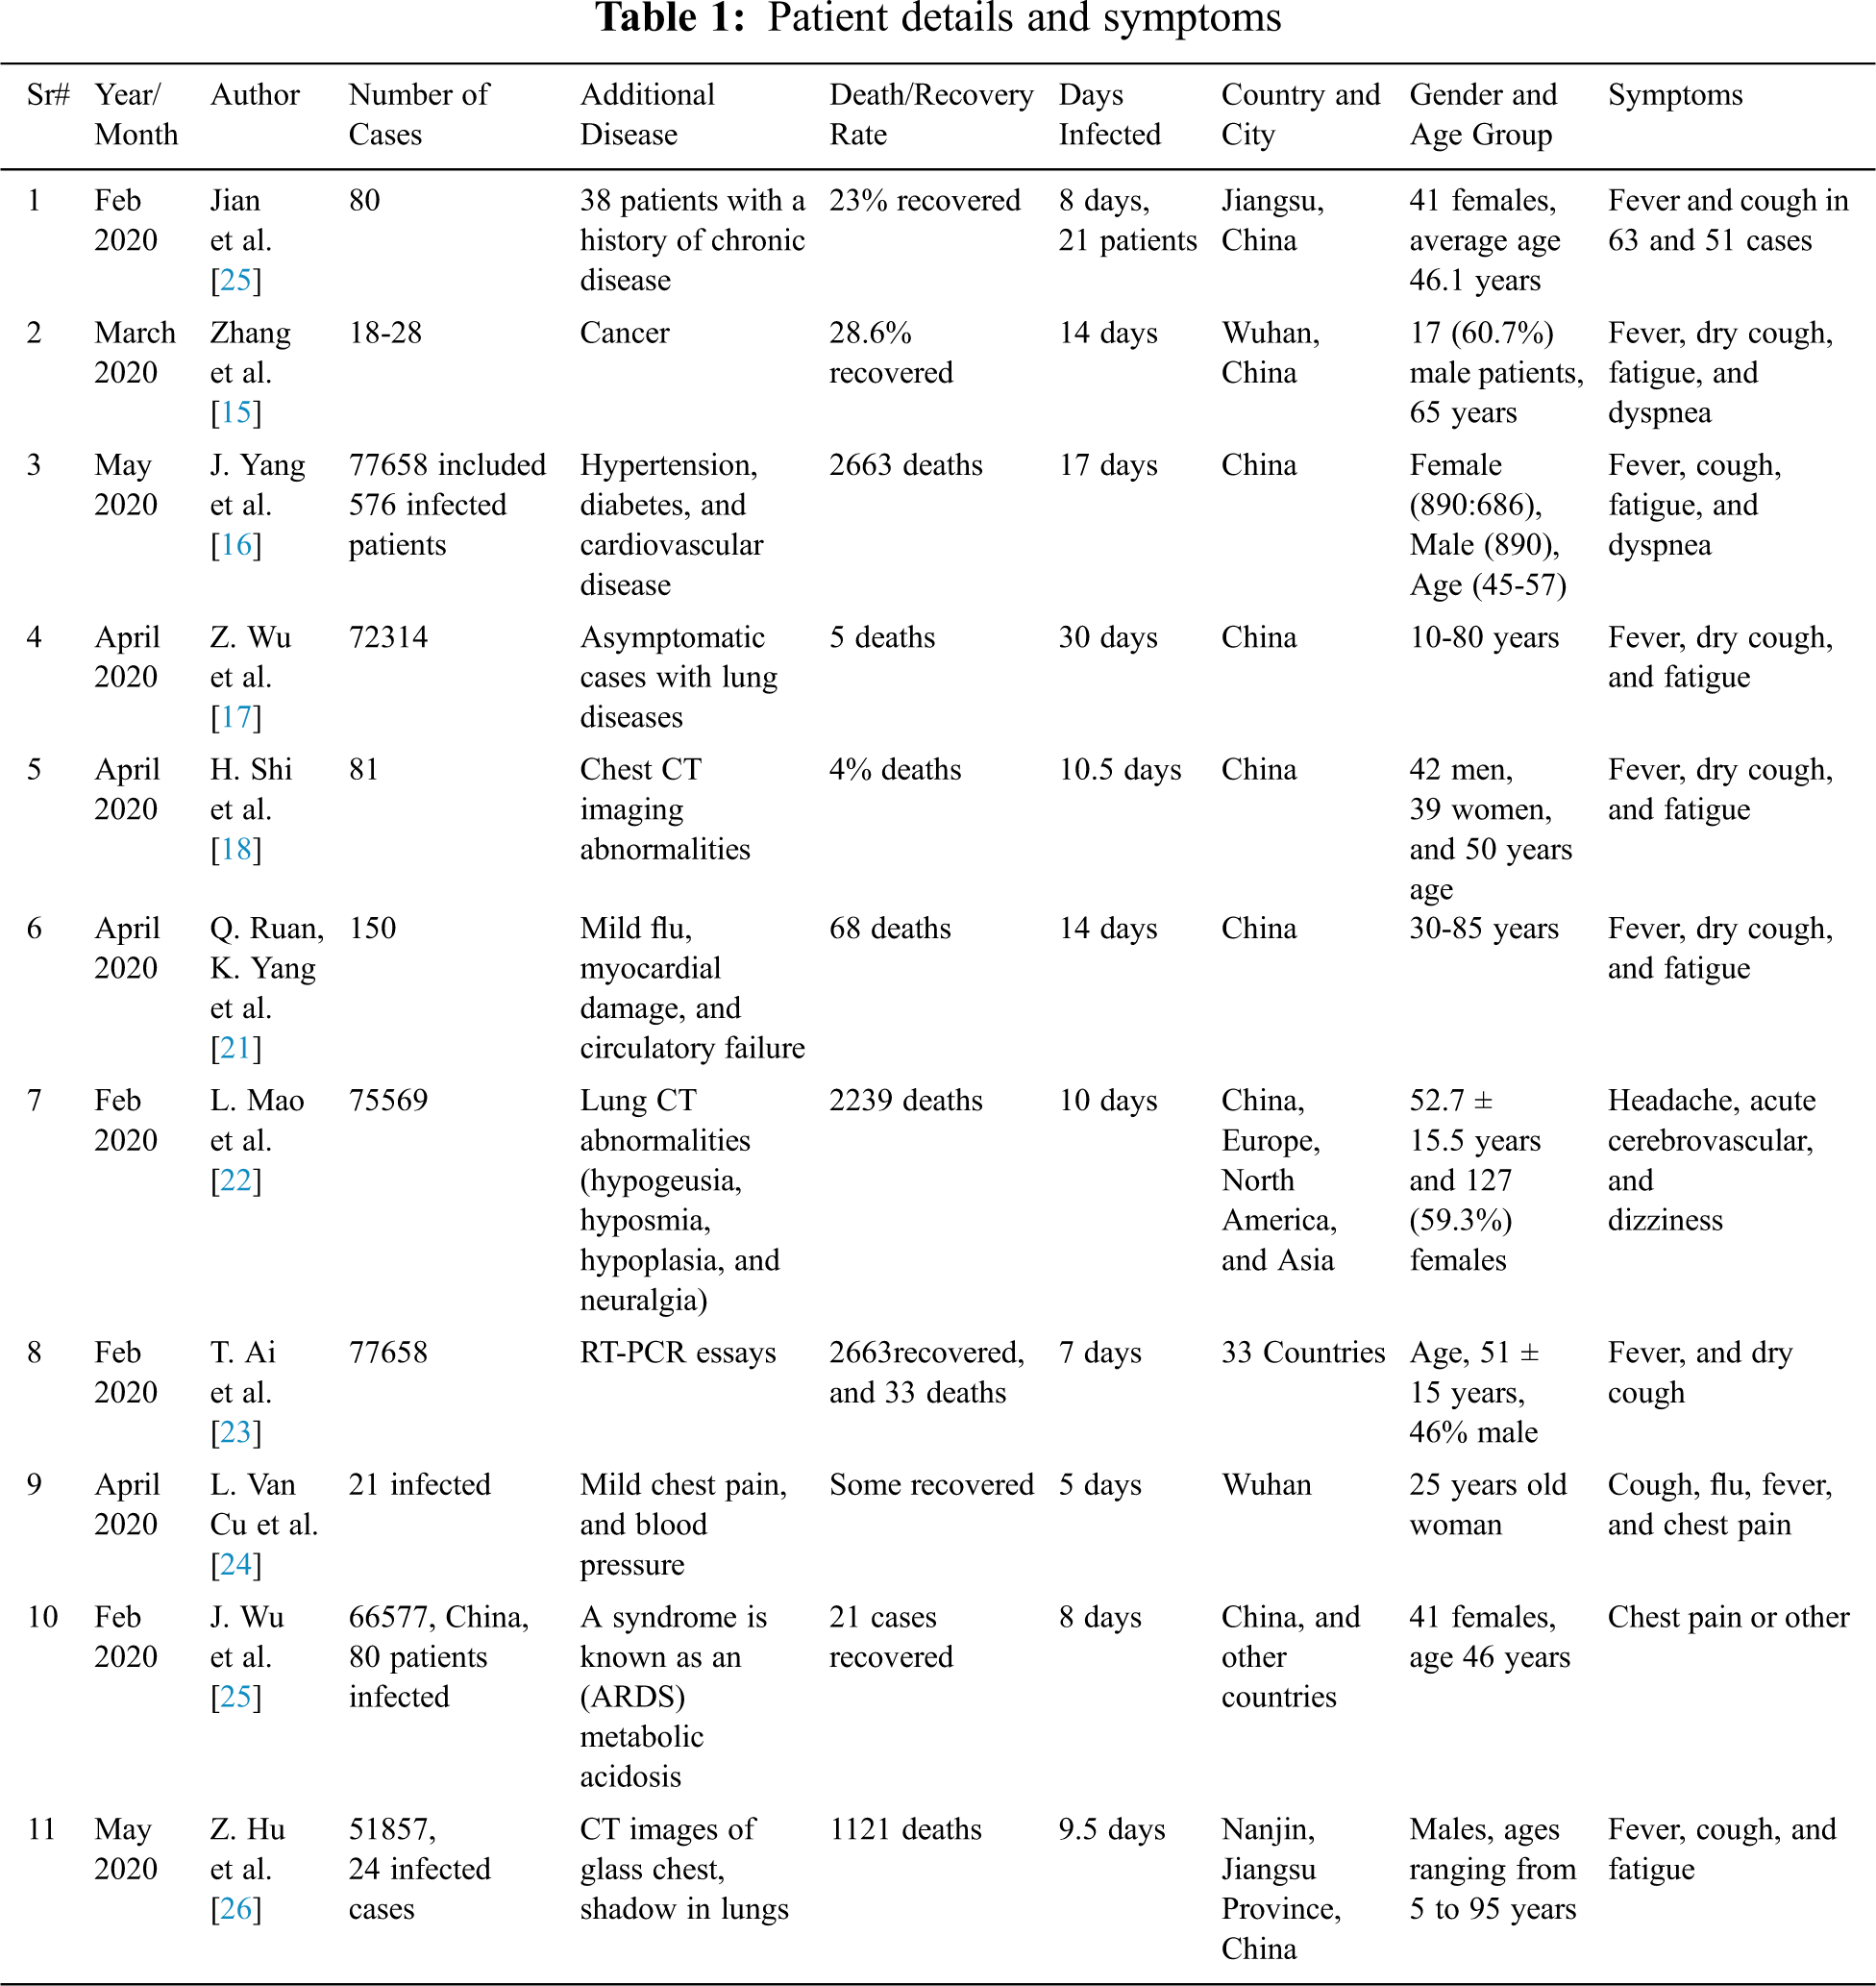
Tab. 1 shows the state-of-the-art research conducted to identify the symptoms, gender, age, number of days the patient remained infected, additional diseases the patient was undergoing corresponding to the country, and city where the patient was monitored.
Mohammad et al. proposed a framework to detect coronavirus-based thermal screening of the patients using an Internet of things (IoT) based smart helmet. They reviewed 6 case studies that analyzed COVID-19, infected patients, using qRT-PCR, and CT scan analysis method. The study concludes that the accuracy of qRT-PCR (81.3%) was lower than the CT scan (89.8%), therefore the CT scan method is more substantial [33]. It projected an open-source CNN that uses resizing and recurring learning rate discovery techniques and an altered version of the ResNet50 system which results in 96.23% accuracy on a public dataset (COVID) with an epoch count of 41 [34].
Ioannis et al. gauged the performance of CNN framework generated through transfer learning approach to detect several irregularities in small medical image data repositories. The result of analysis on two different datasets showed 96% accuracy, 98.66% sensitivity, and 96.46% specificity [35]. Biraja et al. proposed a framework that trains a bayesian deep learning classifier using transfer method to find out vulnerability in the X-ray scans from an open COVID-19 dataset. The outcome determines that susceptibility results in higher reliability in the estimate as it alarms radiologists on incorrect forecasts [36].
Charmaine et al. summarized that radiographic patterns of observation in CT chest scans and RT-PCR are significant methods for the recognition of coronavirus. Their research is the comparison of 2D, and 3D deep neural networks which resulted in 0.966% AUC, 98.2% sensitivity, and 92.2% specificity [37].
Bin et al. [38] demonstrated an experiment of Lopinavir–Ritonavir on elderly people hospitalized with severe coronavirus impact which caused breathing hindrance. Ying et al. illustrated that the period was secured from 1 January to 2 February 2020. During the time, they recognized 12 investigations that assessed the essential conceptive number for coronavirus cases from China or abroad. The assessments ranged from 1.4 to 6.49 where the mean calculated was 3.28, the middle was 2.79, and the inter-quartile was 1.16 [39]. Ganyani et al. [40,41] determined that an essential key irresistible sickness constraint of this disease is quintessential to demonstrate and manage the intercession techniques.
T. Thiruvalluan et al. stated that the coronavirus arising in Wuhan city in China is spreading throughout the world with the ACE II receptor as a binding site via human transmission, and is called SARS CoV-2. It is currently no officially approved cure for COVID-19 that has been controlled by symptomatic relief and some antiviral medication, so avoidance plays an important role in suppressing the spread [42–44].
Akib Mohi et al. state that over 100 countries were affected by COVID-19 in no time. It is important to develop a control system that will detect coronavirus. Disease diagnosis may be one of the remedies for handling the current havoc with the help of various AI resources [45]. Shi Zhao et al. stated that since December 2019, the extreme acute respiratory disease coronavirus (SARS-CoV-2), has exhibited a large spread (COVID-19) in other parts of the world starting from Wuhan, China. As of 15 February, there were 56 COVID-19 confirmed cases in Hong Kong after the onset of the first symptom on 23, 2020 January [46].
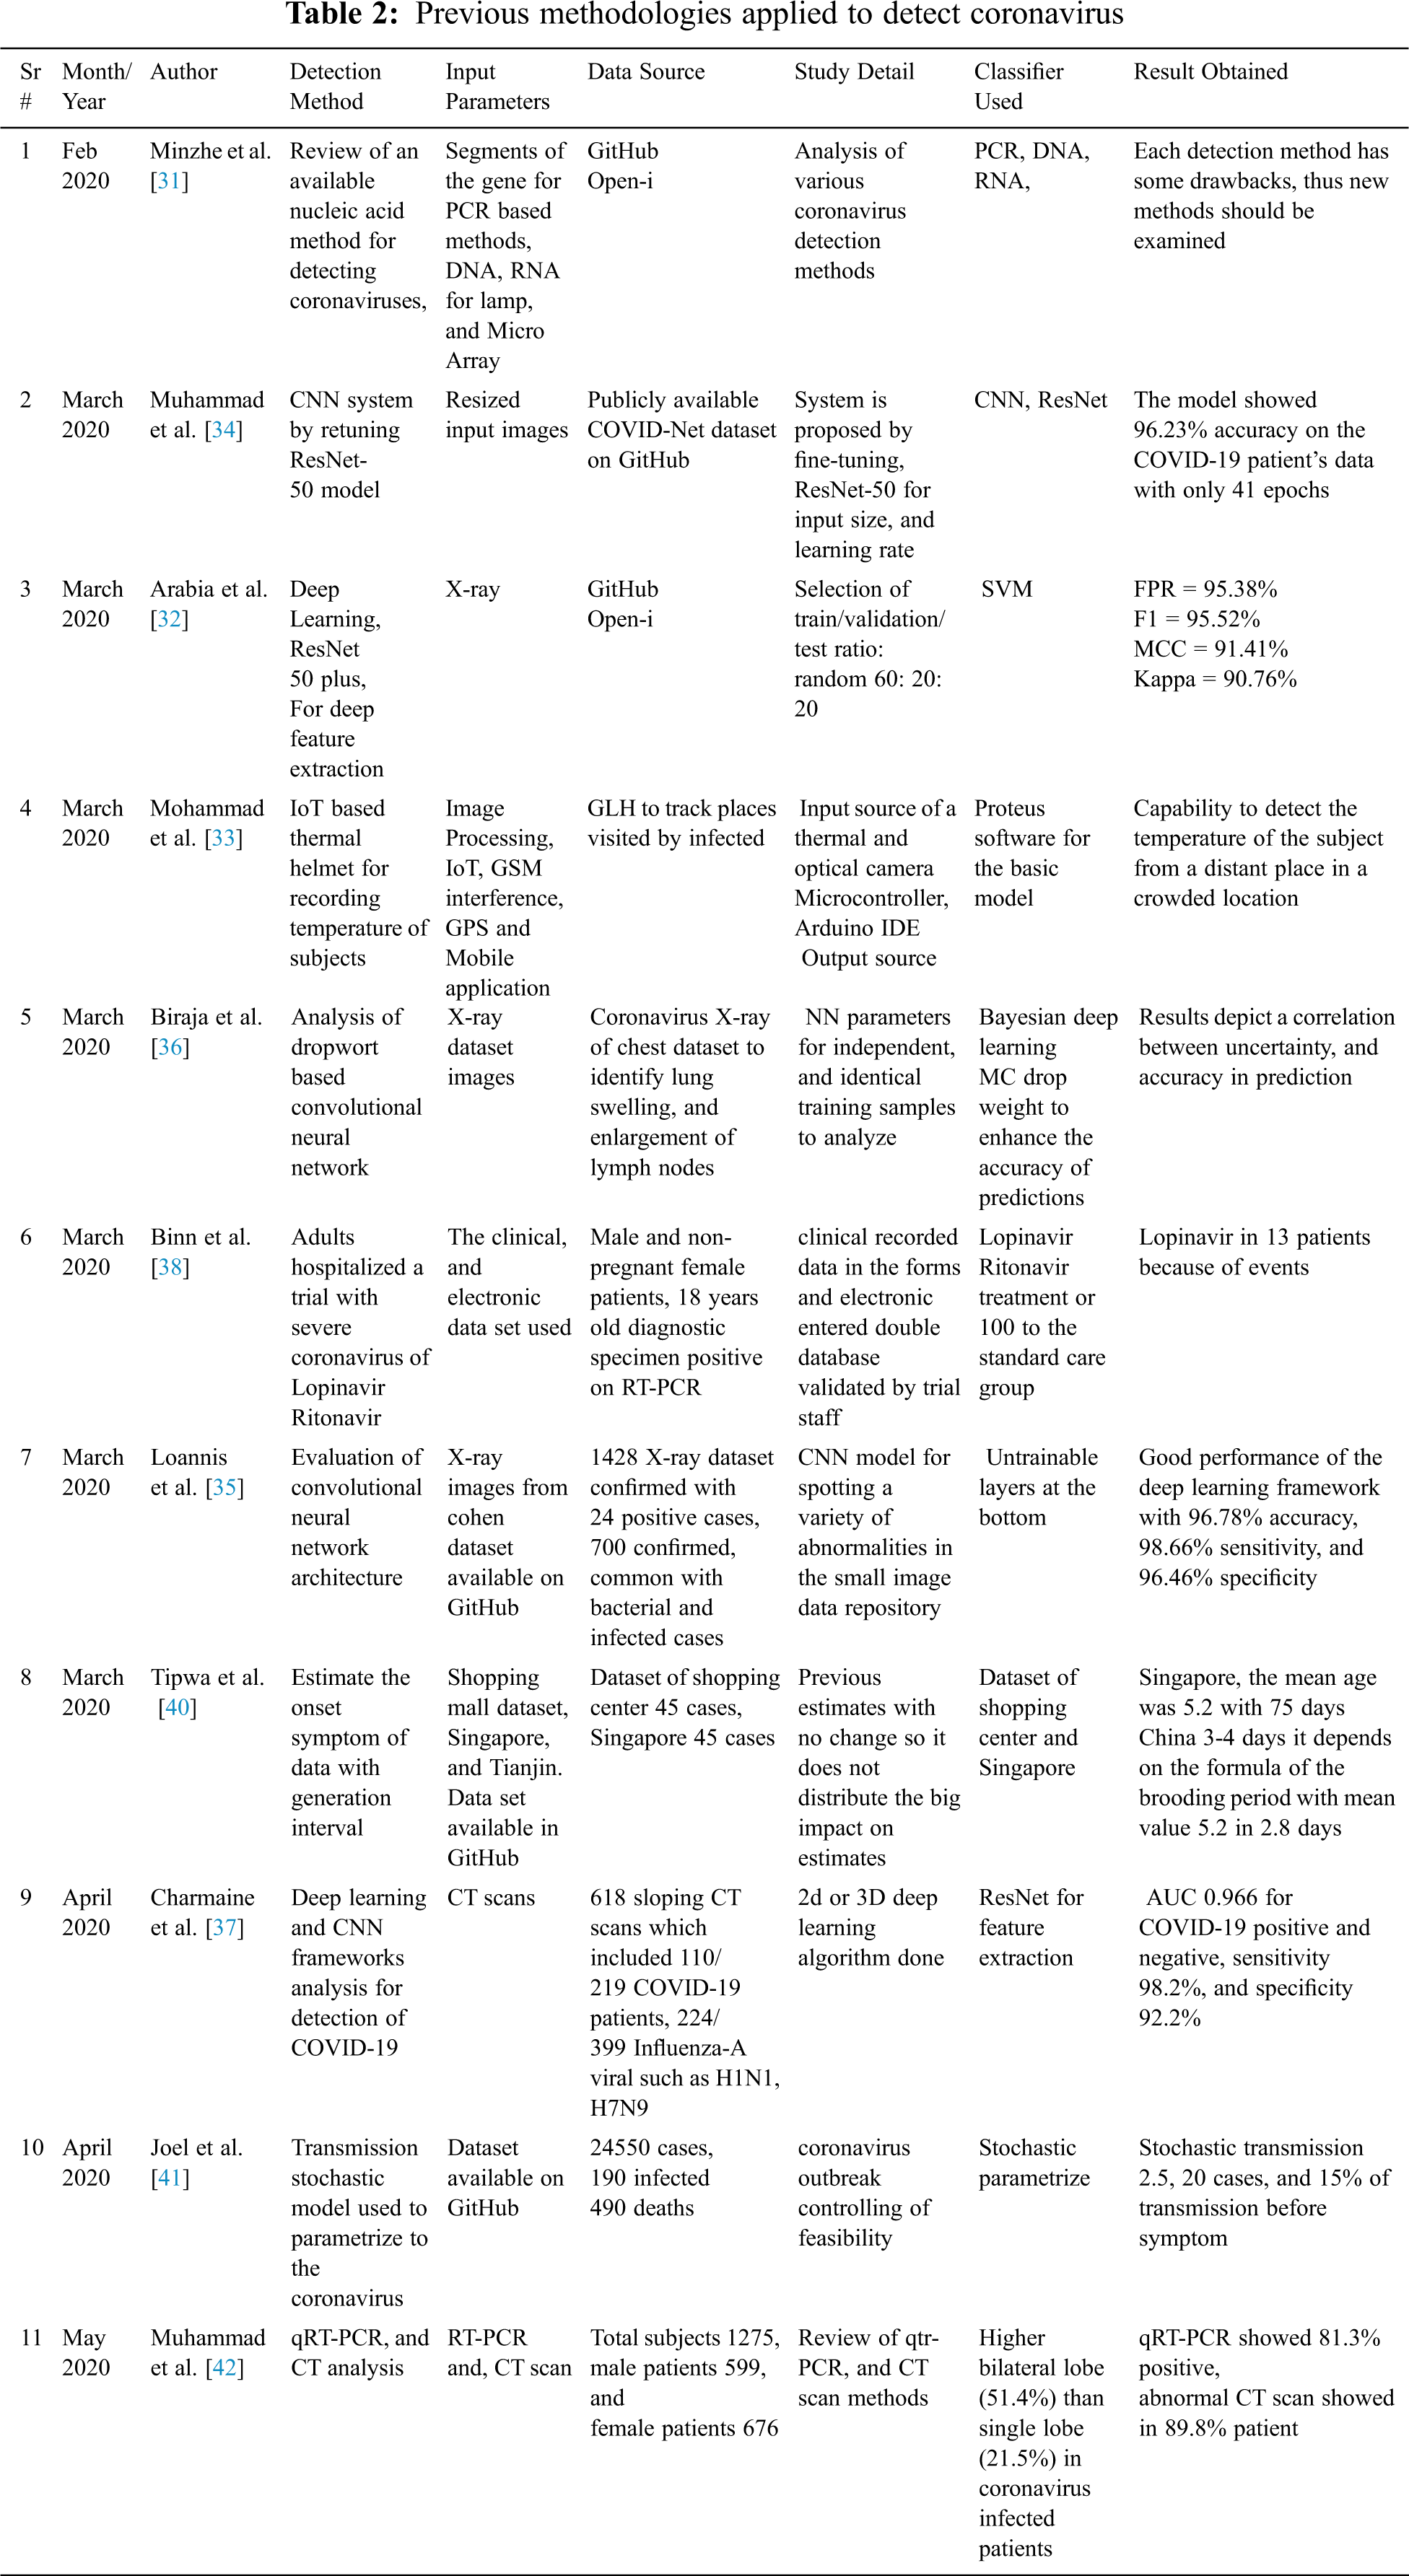
The above Tab. 2 shows the previous research conducted to analyze the various methodologies applied to detect coronavirus. The table states the input features utilized in the commonly applied detection methods, the source of data used, classifiers used, and result obtained.
The literature review implies the following things: First, common symptoms shown by coronavirus patients around the globe include fever and dry cough. Second, death rates were higher in cases where patients had predominant chronic diseases, like cancer or old age patients. Third, the detection methods that performed best in the COVID-19 cases include machine learning, deep learning, and CNN which show higher accuracy levels. These frameworks outperform the results obtained after molecular biology techniques. The next section determines the method we used to detect coronavirus patients according to their symptoms with utilization of LR, KNN, DT, NB, and SVM. The results would help the healthcare sector in decision making especially the countries where the disease is expected to affect greatly [43].
Machine learning classification algorithms take up data to process, classify, or predict. The flow of the process involves pre-processing which includes data cleaning, data transformation, and feature selection, followed by the application of machine learning algorithms.
4.1 Data Collection and Pre-Processing
Our study presented in this paper is based on publicly available databases. The dataset is obtained from the Israeli government website and is accessible worldwide, https://data.gov.il/dataset/covid-19/resource/d337959a-020a-4ed3-84f7-fca182292308. Such type of datasets are also used by several other research publications [6]. Although the website is constantly updated with the latest data, we used a dataset from 15/12/2020 till 21/01/2021. A total of 1,048,576 entries of patient records are contained in the dataset, containing symptoms and actual results of the potential COVID-19 patients. The columns are as follows: test_date, cough, fever, sore_throat, shortness of breath, head_ache, corona_result, age_60_and_above, gender, and test_indication.
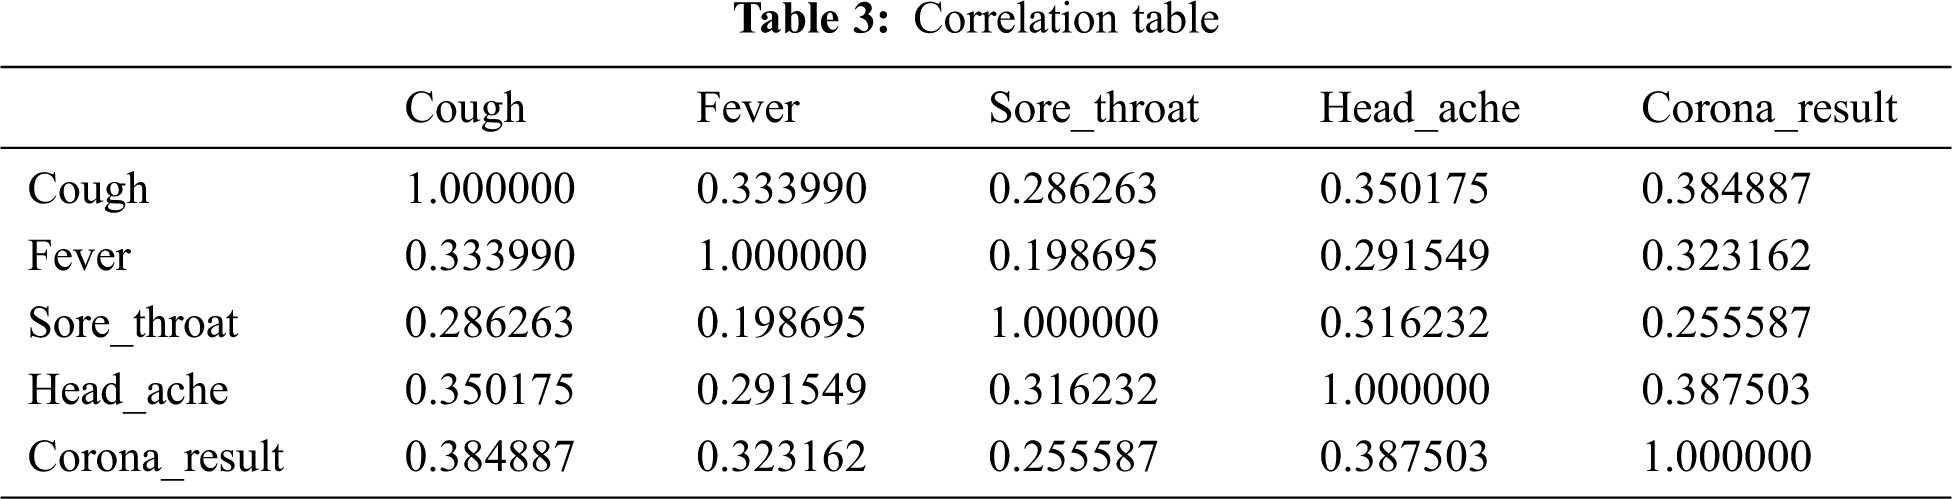
Firstly, the data is obtained from the source and analyzed. However, the data obtained is noisy and needs to be handled, otherwise, it could be misinterpreted, which could result in erroneous outcomes of the algorithm. The missing values are dropped and the data types of the required features are transformed. For the analysis, the features contained in the file and their correlation is examined. The features are shortlisted by peer-review to obtain the set of features around which the model will be revolved. The correlation between the selected variables can be seen in the above Tab. 3.
4.2 Machine Learning Models , Technology, and Evaluation Metrics
Jupiter notebook is incorporated for simulation. The model formed is an intelligent system that is empowered by machine learning techniques’ implementation on the pre-processed dataset. Moreover, several statistical measures are incorporated for the evaluation of the prediction of the suggested model. The algorithms applied are as follows:
• Logistic regression
• KNeighbors classifier
• Decision tree
• Naïve bayes
• Support vector machine
The accuracy of a machine learning algorithm is the way to evaluate how exactly the algorithm classifies a data point. To be precise, it is calculated by the number of true positives and true negatives divided by the total number including true positives, false positives, true negatives, and false negatives. The equation below shows how accuracy is calculated.
Moreover, accuracy is used along with the calculation of precision and recall. The precision is calculated by the total number of true positives divided by the sum of true positives and false positives. Whereas, the recall is measured by the true positives divided by the sum of true positives and false negatives. The calculation is further demonstrated by the following equations:
Machine learning has an essential task of performance measurement of the applied classifiers. The performance of the algorithms is visualized by the corresponding confusion matrices.
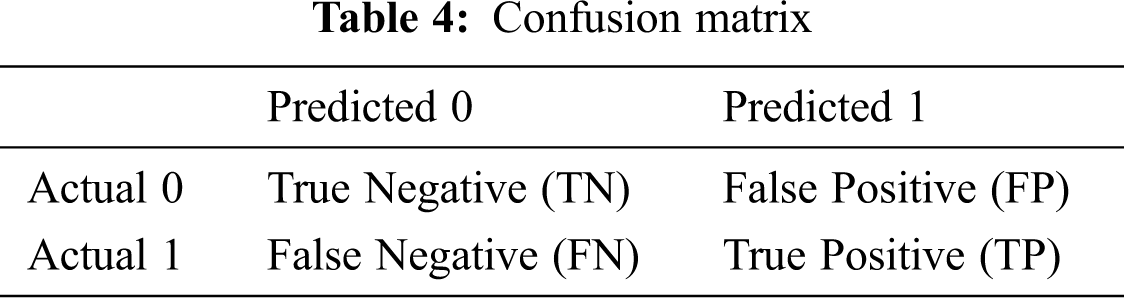
A confusion matrix is used in various machine learning problems, including the statistical classification problems being solved by supervised learning. The confusion matrix is based on true positive (TP), true negative (TN), false positive (FP), and false-negative (FN) values. TP is the instance where the model correctly identifies the positive class. TN is the outcome where models correctly identities the actual negative class. FP is the outcome at which the model incorrectly predicts the class when actually it is not present. Lastly, FN is the outcome where the model does not identify even in its presence. Tab. 4 above shows how a confusion matrix is plotted.
Moreover, a classification report is used to find out the quality of predictions corresponding to each classification algorithm. The metrics included in the report are precision, recall, f1-score, and support. Precision is the measure of the number of times the model identified an instance positive, which was actually positive as well. It can be calculated by the total positives divided by the sum of total positives and false negatives. The equation below shows how precision is calculated.
The recall is the fraction of positive which the classifier has identified correctly. It can be calculated by the total positives divided by the sum of total positives and false negatives. The following equation shows the method of calculation of recall.
Additionally, the classification report consists of F1-score which is the weighted harmonic mean of precision and recall. An f1-score of 1.0 is considered best and 0.0 is considered worse. This score is usually used to compare the classifier models, not the global accuracy. The equation below shows the method of calculating f1-score.
Lastly, the support is the total number of actual occurrences of the class in the dataset. The next section explains the obtained results concerning each incorporated classifier.
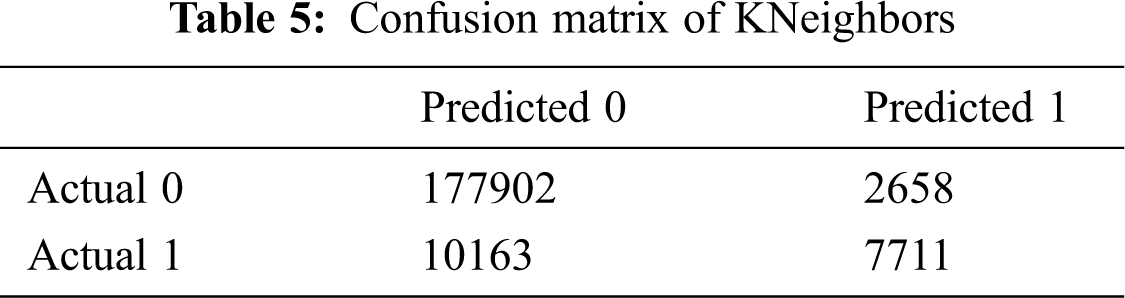
Machine learning classifiers used in this study incorporate supervised learning to solve binary classification problems. The TP value of the confusion matrix refers to the number of patients that truly have COVID-19 and the corresponding classifier identifies it correctly. The FP value refers to the patient count that actually doesn’t have COVID-19 but the classifier erroneously identifies them with the disease. The TN is the number of patients in the dataset that actually don’t have COVID-19 and the classifier also identifies them correctly. Lastly, the FN is the number of patients that truly have COVID-19, but the model erroneously identifies them as not having the illness. Below are the results of each classifier along with their accuracies, confusion matrices, and classification report.
The accuracy obtained with the KNeighbors is 93.53890966265863.
The following Tab. 5 demonstrates the TP, TN, FP, and FN values obtained through KNeighbors algorithm.
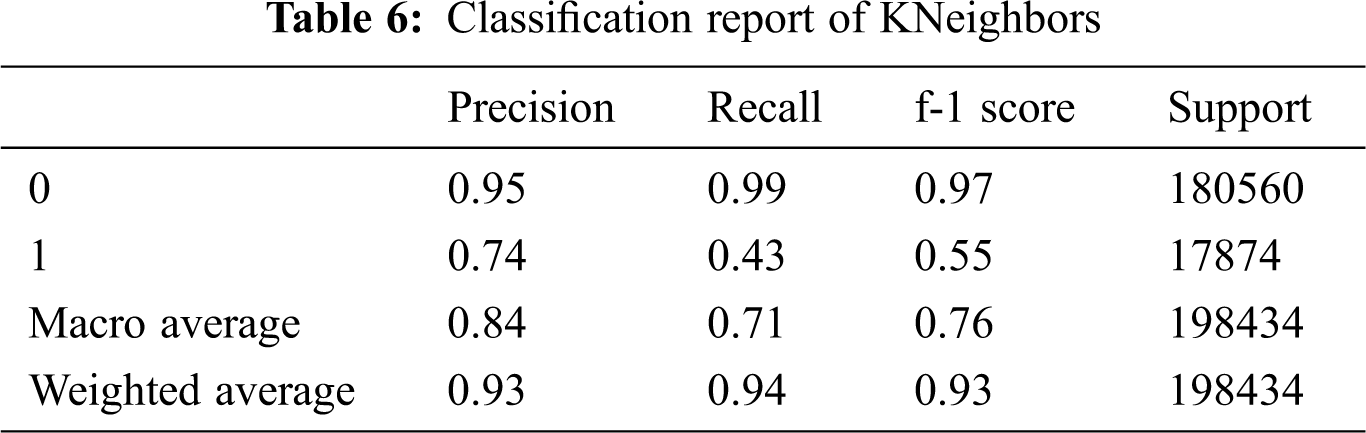
The following Tab. 6 shows the findings in terms of precision, recall, f1-score, and support value corresponding to the KNeighbors algorithm.
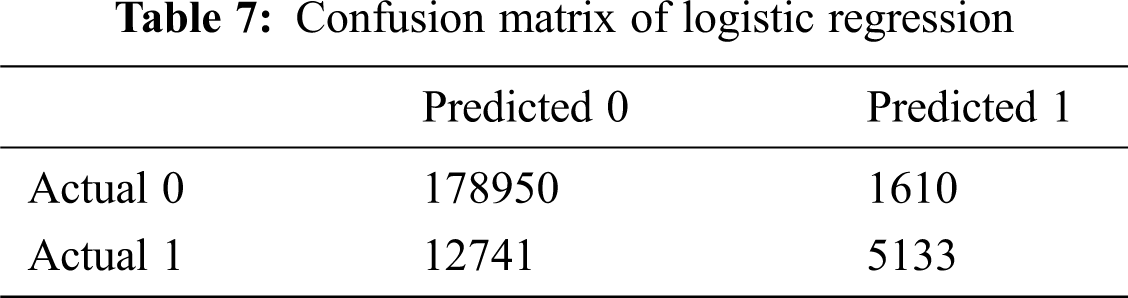
5.2 Logistic Regression Findings
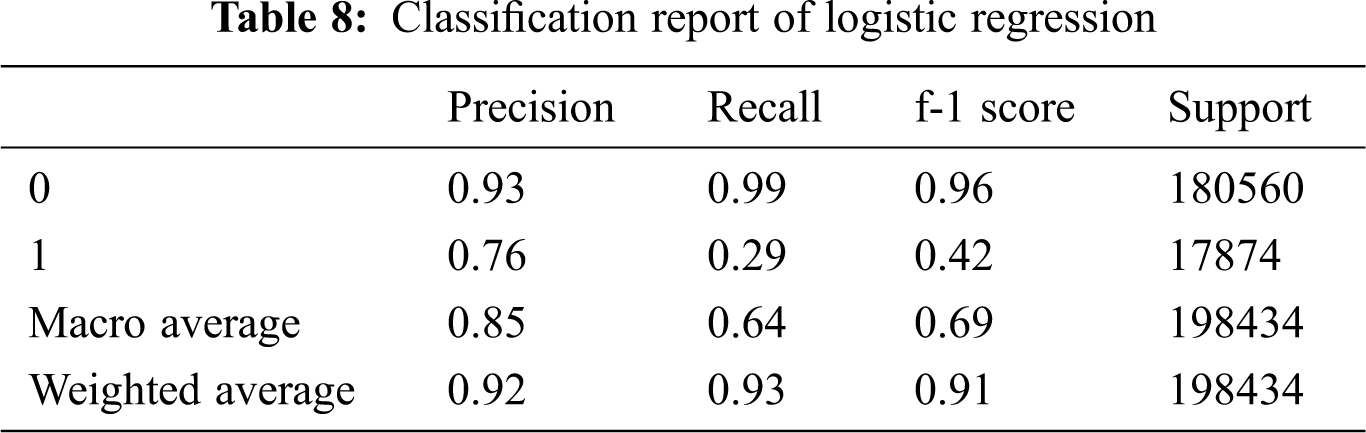
The accuracy obtained with the logistic regression is 92.76787244121472.
The following Tab. 7 shows a confusion matrix of logistic regression findings, it shows high true positive (TP) for class 0 which are the instances where the model correctly identified patients with coronavirus from the dataset.
The following Tab. 8 shows the detailed performance report of logistic regression in terms of its precision, recall, f-1 score, and support value.
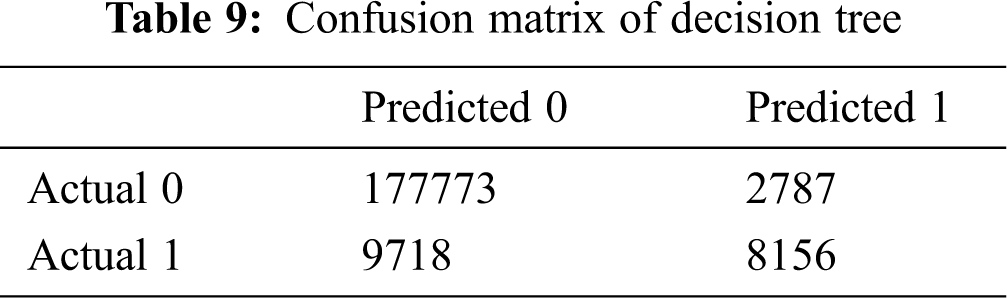
The accuracy obtained with the decision tree is 93.69815656591108.
The following Tab. 9 shows the confusion matrix of the decision tree algorithm for the classes 0 and 1 which are corona negative and corona positive patients correspondingly.
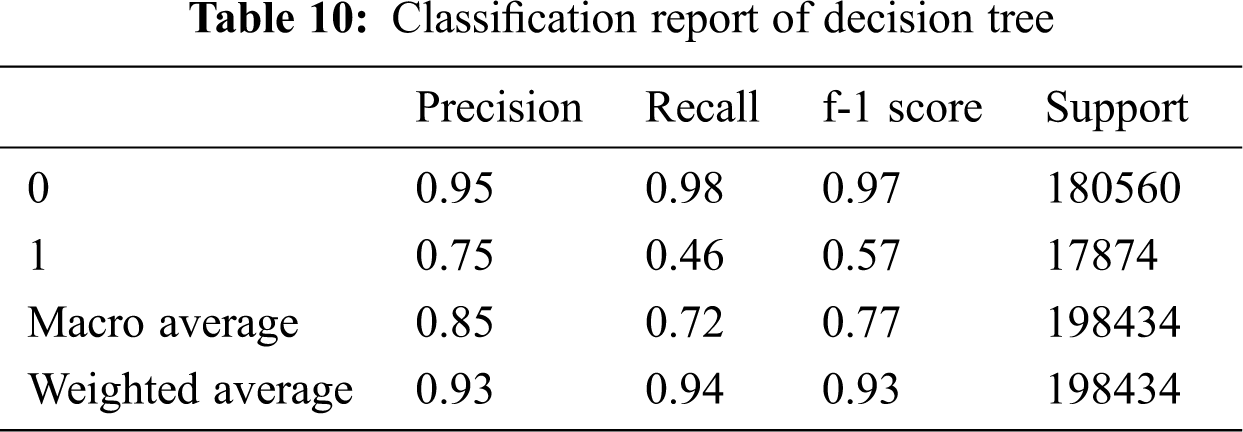
The following Tab. 10 shows the classification report stating precision, recall, f-1 score, and support of decision tree findings. It can be seen that the outcomes of class 0 (corona negative) are much better.
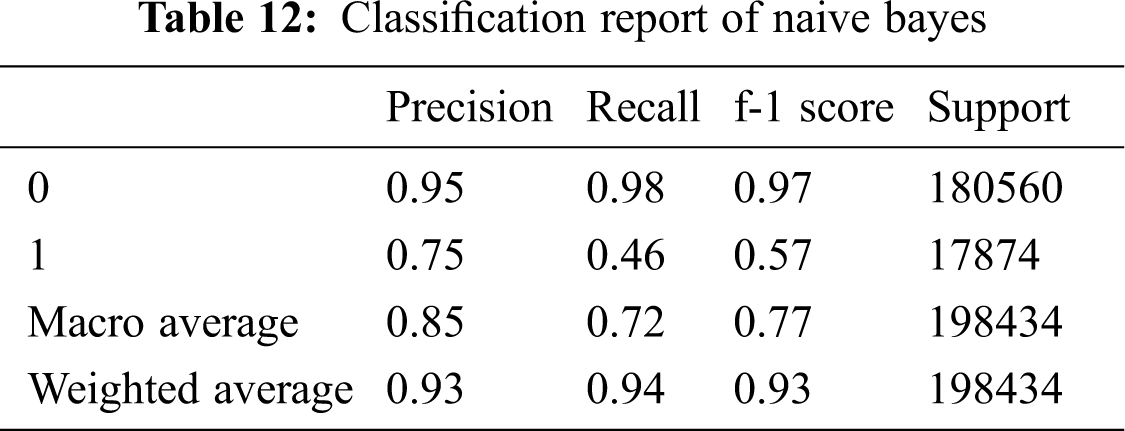
5.4 Naive Bayes Model Findings
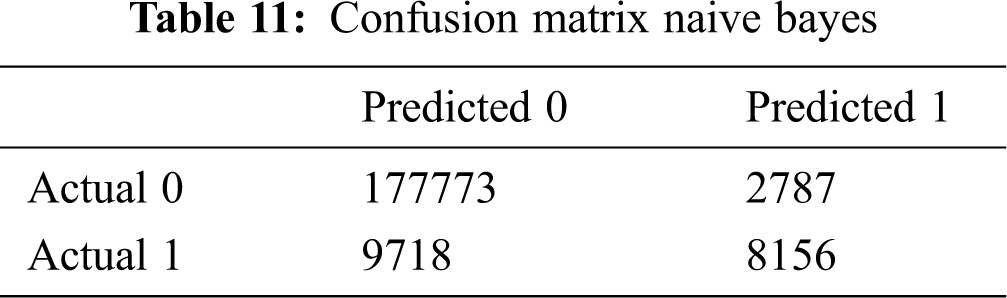
The accuracy obtained with the naïve bayes is 93.69815656591108.
The following Tab. 11 shows the confusion matrix stating the values TP, TN, FP, and FN of naïve bayes model. The TP values for class 0 (corona negative) are high.
The following Tab. 12 shows the details of precision, recall, f-1 score, and support values for naïve bayes algorithm.
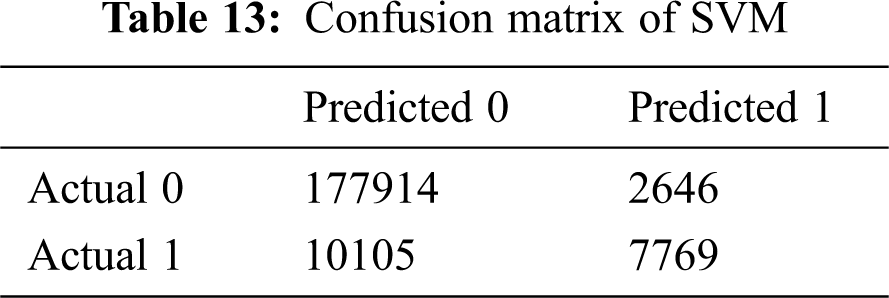
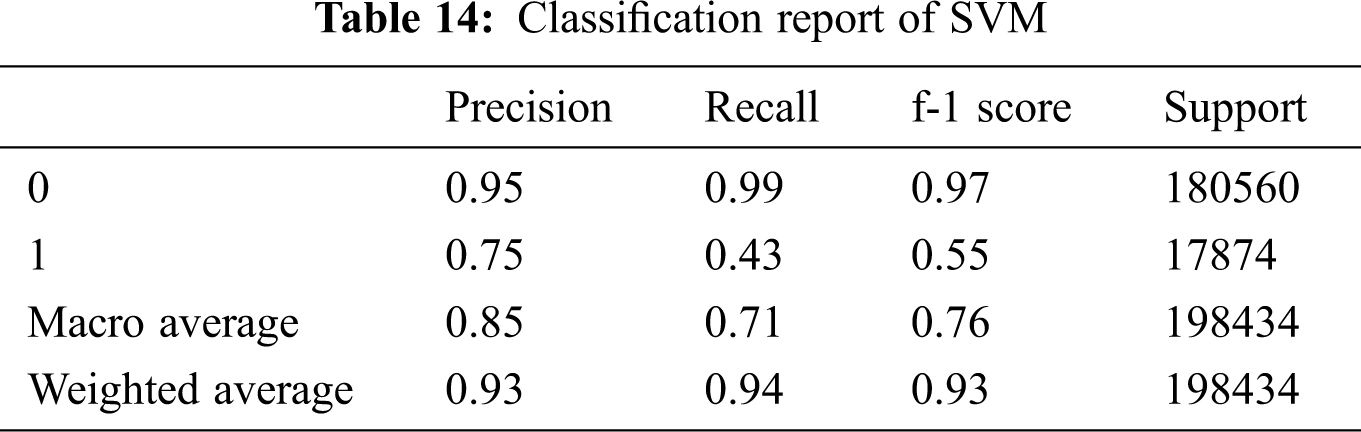
The accuracy obtained with the SVM is 93.57418587540441.
The following Tab. 13 shows the confusion matrix for the support vector machine algorithm.
The following Tab. 14 shows the report containing values of precision, recall, f-1 score, and support for SVM.
The following Tab. 15 compares the performance of the five incorporated models according to the obtained accuracies:
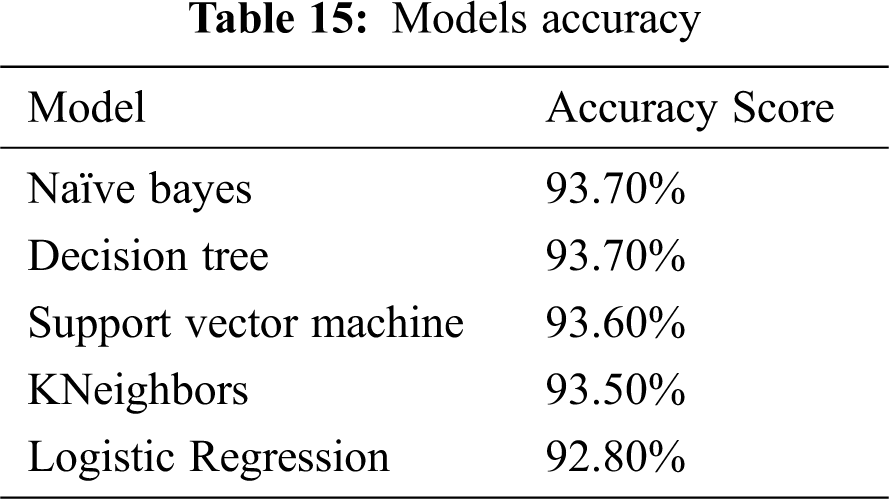
Since the precision and recall are high for class 0 in all the 5 classifiers, we deduce that the class is perfectly handled by the classifiers. The comparison of all the applied algorithms with respect to accuracy scores show that Naïve bayes and Decision tree outperform the remaining algorithms which are support vector machine, KNeighbors, and logistic regression in the determination of COVID-19 based on significant features from the symptoms.
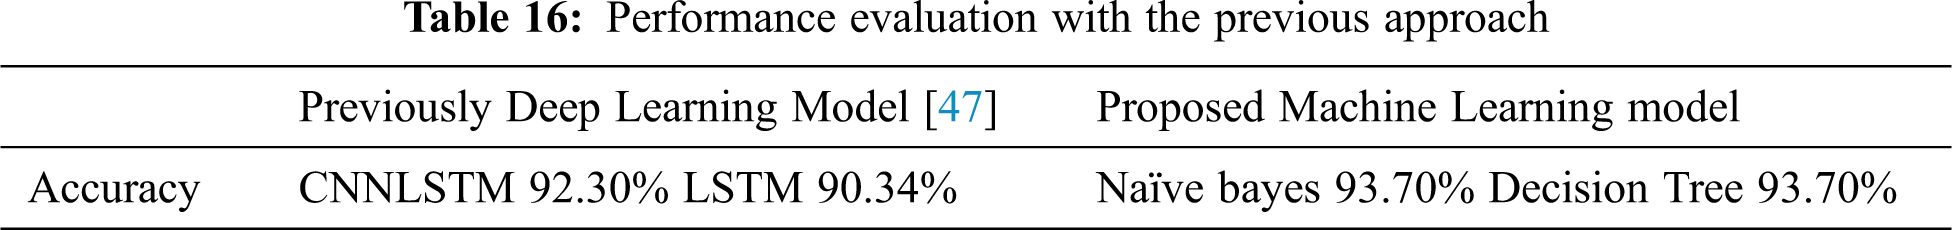
The following Tab. 16 illustrates the performance evaluation with a previously published approach empowered by deep learning with train-test splits approaches [47]. As shown in the table, our proposed model that incorporates machine learning algorithms outperforms the other deep learning algorithm in terms of accuracy.
From the study, we determine that supervised machine learning algorithms can be utilized for the prediction of COVID-19 in patients with potential symptoms of this disease. For evaluation of the models, we have used the metrics of accuracy. Accuracy is the fraction of predictions that the model got correct. By comparing the obtained results critically, we determine that logistic regression performs most inexact with an accuracy of 92.80% whereas, NB and DT show highest accuracy of 93.70%.
This study presents the accuracy and performance of the machine learning classifiers: DT, KNN, SVM, LR, and NB algorithms to determine the presence of COVID-19 in potential patients. We studied the impact of this illness on different age groups, genders, and people having previous medical conditions. A large dataset which contains the details of the date on which the patient was tested, presence of cough, fever, sore throat, and headache. The outcome of coronavirus test conducted for patient, information of the age of patient, gender, and another indicator such as contact of the patient with another coronavirus patient was analyzed and pre-processed. A vast range of models and algorithms for data analysis and visualization were considered and examined. However, after comparison and peer review, we selected the above-mentioned algorithms for our study. The comparison between their results shows that the NB, and DT demonstrates the highest performance in terms of accuracy whereas, LR demonstrates the least.
This research aims to assist future researchers in examining the machine learning approaches to solve COVID-19 problems and to determine whether the patient is sick with this particular illness. Moreover, this research can be extended in future to address relevant problems of other diseases and act accordingly in case of potential pandemic.
Acknowledgement: Thanks to our families and colleagues who supported us morally.
Funding Statement: The author(s) received no specific funding for this study.
Conflict of Interests: The authors declare that they have no conflicts of interest to report regarding the present study.
1. V. K. Deshwal, “COVID-19: A comparative study of asian, european, american continent,” International Journal of Scientific Research and Engineering Development, vol. 3, no. 2, pp. 436–440, 2020. [Google Scholar]
2. Y. A. Alrazaq, A. M. Alajlani, D. Alhuwail, J. Schneider, S. A.Kuwari et al., “Artificial intelligence in the fight against COVID-19: Scoping review,” Journal of Medical Internet Research, vol. 22, no. 12, pp. 1–18, 2020. [Google Scholar]
3. X. Wang, X. Deng, Q. Fu, Q. Zhou, Feng et al., “A weakly-supervised framework for covid-19 classification and lesion localization from chest ct,” IEEE Transactions on Medical Imaging, vol. 39, no. 8, pp. 2615–2625, Aug. 2020. [Google Scholar]
4. R. Zagrouba, M. A. Khan, M. A. Saleem, M. F. Mushtaq et al., “Modelling and simulation of COVID-19 outbreak prediction using supervised machine learning,” Computers, Materials & Continua, vol. 66, no. 3, pp. 2397–2407, 2021. [Google Scholar]
5. L. J. Muhammad, E. A. Algehyne, S. S. Usman, A. Ahmad, C. Chakraborty et al., “Supervised machine learning models for prediction of COVID-19 infection using epidemiology dataset,” Springer Nature: SN Computer Science, vol. 2, no. 11, pp. 1–13, 2021. [Google Scholar]
6. M. A. Quiroz-Juarez, A. T. Gomez, I. H. Ulloa, R. D. J. L. Montiel et al., “Identification of high-risk COVID-19 patients using machine learning,” MedRxiv, vol. 66, no. 3, pp. 1–10, 2021. [Google Scholar]
7. I. Arpaci, S. Huang and M. A. Emran, “Predicting the COVID-19 infection with fourteen clinical features using machine learning classification algorithms,” Multimedia Tools & Applications, vol. 1, no. 1, pp. 1–15, 2021. [Google Scholar]
8. N. S. Punn, S. K. Sonbhadra and S. Agarwal, “COVID-19 epidemic analysis using machine learning and deep learning algorithms,” Health Informatics, vol. 1, no. 1, pp. 1–10, 2020. [Google Scholar]
9. A. Alimadadi, S. Aryal, I. Manandhar, P. B. Munroe, B. Joe et al., “Artificial intelligence and machine learning to fight COVID-19,” Physiological Genomics, vol. 52, no. 4, pp. 200–202, Apr. 2020. [Google Scholar]
10. A. Albahri and R. A. Hamid, “Role of biological data mining and machine learning techniques in detecting and diagnosing the novel coronavirus: A systematic review,” Journal of Medical Systems, vol. 44, no. 7, pp. 1–10, 2020. [Google Scholar]
11. M. Pourhomayoun and M. Shakibi, “Predicting mortality risk in patients with COVID-19 using artificial intelligence to help medical decision-making,” Health Informatics, vol. 1, no. 1, pp. 1–10, 2020. [Google Scholar]
12. A. Erraissi, M. Azouazi, A. Belangour and M. Banane, “Machine learning model to predict the number of cases contaminated by COVID-19,” International Journal of Computing and Digital Systems, vol. 9, pp. 1–11, 2020. [Google Scholar]
13. S. F. Ardabili, “COVID-19 outbreak prediction with machine learning,” Specialized Research Networks Journal, vol. 1, pp. 1–11, 2020. [Google Scholar]
14. Q. Li, “Early transmission dynamics in wuhan, china, of novel coronavirus-infected pneumonia,” New England Journal of Medicine, vol. 382, no. 13, pp. 1199–1207, Mar. 2020. [Google Scholar]
15. C. Huang, “Clinical features of patients infected with 2019 novel coronavirus in wuhan, china,” Lancet, vol. 395, no. 10223, pp. 497–506, Feb. 2020. [Google Scholar]
16. Y. He, H. Yu, E. Ong, Y. Wang, L. Huffman et al., “Cid, a community-based ontology for coronavirus disease knowledge and data integration, sharing, and analysis,” Scientific Data, vol. 7, no. 1, pp. 1–5, 2020. [Google Scholar]
17. S. Li, Y. Wang, J. Xue, N. Zhao and T. Zhu, “The impact of COVID-19 epidemic declaration on psychological consequences: A study on active weibo users,” International Journal of Environmental Research and Public Health, vol. 17, no. 6, pp. 2032, Mar. 2020. [Google Scholar]
18. J. Wu, “Clinical characteristics of imported cases of coronavirus disease 2019 COVID-19 in jiangsu province: A multicenter descriptive study,” Clinical Infectious Diseases, vol. 1, pp. 1–9, Feb. 2020. [Google Scholar]
19. L. Zhang, “Clinical characteristics of COVID-19 infected cancer patients: A retrospective case study in three hospitals within wuhan, china,” Annals of Oncology, vol. 31, no. 7, pp. 894–901, Jul. 2020. [Google Scholar]
20. J. Yang, “Prevalence of comorbidities and its effects in patients infected with SARS-CoV-2: A systematic review and meta-analysis,” International Journal of Infectious Diseases, vol. 94, pp. 91–95, May 2020. [Google Scholar]
21. Z. Wu and J. M. McGoogan, “Characteristics of and important lessons from the coronavirus disease 2019 (COVID-19) outbreak in china,” JAMA Network, vol. 323, no. 13, pp. 1239, Apr. 2020. [Google Scholar]
22. H. Shi, “Radiological findings from 81 patients with COVID-19 pneumonia in wuhan, china: A descriptive study,” Lancet Infectious Diseases, vol. 20, no. 4, pp. 425–434, Apr. 2020. [Google Scholar]
23. A. Polacco and K. Backes, “The amazon go concept: implications, applications, and sustainability,” Journal of Business and Management, vol. 24, no. 1, pp. 79–90, 2020. [Google Scholar]
24. Y. Liu, A. A. Gayle, A. W. Smith and J. Rocklöv, “The reproductive number of COVID-19 is higher compared to SARS coronavirus,” Journal of Travel Medicine, vol. 27, no. 2, pp. 0–21, Mar. 2020. [Google Scholar]
25. Q. Ruan, K. Yang, W. Wang, L. Jiang and J. Song, “Correction to: Clinical predictors of mortality due to COVID-19 based on an analysis of data of 150 patients from Wuhan, China,” Intensive Care Med, vol. 46, no. 6, pp. 1294–1297, Jun. 2020. [Google Scholar]
26. L. Mao, “Neurologic manifestations of hospitalized patients with coronavirus disease 2019 in Wuhan, China,” JAMA Neurology, vol. 77, no. 6, pp. 683–690, 2019. [Google Scholar]
27. T. Ai, “Correlation of chest CT and RT-PCR testing in coronavirus disease 2019 (COVID-19) in China: A report of 1014 cases,” Radiology, vol. 296, no. 2, pp. 32–40, Feb. 2020. [Google Scholar]
28. L. V. Cuong, “The first vietnamese case of COVID-19 acquired from china,” Lancet Infectious Diseases, vol. 20, no. 4, pp. 408–409, Apr. 2020. [Google Scholar]
29. J. Wu, “Clinical characteristics of imported cases of coronavirus disease 2019 (COVID-19) in Jiangsu Province,” Clinical Infectious Diseases, vol. 71, no. 15, pp. 706–712, Feb. 2020. [Google Scholar]
30. Z. Hu, “Clinical characteristics of 24 asymptomatic infections with COVID-19 screened among close contacts in Nanjing,” China Science China Life Sciences, vol. 63, no. 5, pp. 706–711, May 2020. [Google Scholar]
31. M. Shen, “Recent advances and perspectives of nucleic acid detection for coronavirus,” Journal of Pharmaceutical Analysis, vol. 10, no. 2, pp. 97–101, Apr. 2020. [Google Scholar]
32. P. K. Sethy and S. K. Behera, “Detection of coronavirus disease (COVID-19) based on deep features,” Engineering, vol. 2, pp. 1–15, Mar. 2020. [Google Scholar]
33. M. N. Mohammed, H. Syamsudin, S. AlZubaidi, R. Ramli and E. Yusuf, “Novel COVID-19 detection and diagnosis system using IoT based smart helmet,” International Journal of Psychosocial Rehabilitation, vol. 24, no. 7, pp. 2296–2303, 2020. [Google Scholar]
34. M. Farooq and A. Hafeez, “Covid-resNet: A deep learning framework for screening of COVID-19 from radiographs,” arXiv, vol. 1, pp. 1–15, Mar. 2020. [Google Scholar]
35. I. D. Apostolopoulos and T. A. Mpesiana, “COVID-19: Automatic detection from X-ray images utilizing transfer learning with convolutional neural networks,” Physical and Engineering Sciences in Medicine, vol. 43, pp. 635–640, April 2020. [Google Scholar]
36. B. Ghoshal and A. Tucker, “Estimating uncertainty and interpretability in deep learning for coronavirus (COVID-19) Detection,” arXiv, vol. 2, pp. 1–11, Mar. 2020. [Google Scholar]
37. C. Butt, J. Gill, D. Chun and B. A. Babu, “Deep learning system to screen coronavirus disease 2019 pneumonia,” Applied Intelligence, vol. 1, pp. 1–7, Apr. 2020. [Google Scholar]
38. B. Cao, “A trial of lopinavir-rionavir in adults hospitalized with severe COVID-19,” Physical and Engineering Sciences in Medicine, vol. 382, no. 19, pp. 1787–1799, May 2020. [Google Scholar]
39. Y. Liu, A. Gayle, A. W. Smith and J. Rocklöv, “The reproductive number of COVID-19 is higher compared to SARS coronavirus,” Journal of Travel Medicine, vol. 27, no. 2, pp. taaa021, Mar. 2020. [Google Scholar]
40. Q. Wang, S. Xie, Y. Wang and D. Zeng, “Survival-convolution models for predicting COVID-19 cases and assessing effects of mitigation strategies,” Frontiers in Public Health, vol. 3, no. 8, pp. 325, 2020. [Google Scholar]
41. J. Hellewell, “Feasibility of controlling COVID-19 outbreaks by isolation of cases and contacts,” Lancet Global Health, vol. 8, no. 4, pp. e488–e496, Apr. 2020. [Google Scholar]
42. A. Narin, C. Kaya and Z. Pamuk, “Automatic detection of coronavirus disease (COVID-19) using x-ray images and deep convolutional neural networks,” arXiv, vol. 2, pp. 30–45, Mar. 2020. [Google Scholar]
43. K. Abid, Y. A. Bari, M. Younas, S. T. Javaid and A. Imran, “Progress of COVID-19 epidemic in Pakistan,” Asia Pacific Journal of Public Health, vol. 32, no. 4, pp. 154–156, May 2020. [Google Scholar]
44. M. R. Naqvi, M. A. Jaffar, M. Aslam, S. K. Shahzad, M. W. Iqbal et al., “Importance of big data in precision and personalized medicine,” International Congress on Human-Computer Interaction, Optimization and Robotic Applications (HORAAnarka,Turkey, vol. 1, no. 1, pp. 1–6, 2020. [Google Scholar]
45. A. M. Khanday, U. D. Rabani and S. T. Khan, “Machine learning based approaches for detecting COVID-19 using clinical text data,” International Journal of Information Technology, vol. 1, no. 1, pp. 1–9, 2020. [Google Scholar]
46. W. Kai, S. Zhao, Y. Liao, T. Zhao, X. Wang et al., “Estimating the serial interval of the novel coronavirus disease (COVID-19) based on the public surveillance data in shenzhen, china from january 19 to february 22, 2020,” Transboundary and Emerging Diseases, vol. 1, no. 1, pp. 1–9, 2020. [Google Scholar]
47. T. B. Alakus and I. Turkoglu, “Comparison of deep learning approaches to predict COVID-19 infection,” Chaos Solitons & Fractals, vol. 140, pp. 110–120, 2020. [Google Scholar]
 | This work is licensed under a Creative Commons Attribution 4.0 International License, which permits unrestricted use, distribution, and reproduction in any medium, provided the original work is properly cited. |