DOI:10.32604/iasc.2022.019546
| Intelligent Automation & Soft Computing DOI:10.32604/iasc.2022.019546 | |
| Article |
Target Projection Feature Matching Based Deep ANN with LSTM for Lung Cancer Prediction
School of Computing, SASTRA Deemed University, Thanjavur, 613401, India
*Corresponding Author: K. R. Sekar. Email: sekar1971kr@gmail.com
Received: 16 April 2021; Accepted: 07 June 2021
Abstract: Prediction of lung cancer at early stages is essential for diagnosing and prescribing the correct treatment. With the continuous development of medical data in healthcare services, Lung cancer prediction is the most concerning area of interest. Therefore, early prediction of cancer helps in reducing the mortality rate of humans. The existing techniques are time-consuming and have very low accuracy. The proposed work introduces a novel technique called Target Projection Feature Matched Deep Artificial Neural Network with LSTM (TPFMDANN-LSTM) for accurate lung cancer prediction with minimum time consumption. The proposed deep learning model consists of multiple layers to learn the given input patient data. Different processes are carried out at each layer to predict lung cancer at an earlier stage. The input layer of the deep neural network receives the data and associated features and sends them to the hidden layer. The first hidden layer performs the feature selection process using Target Projection matching to identify the relevant features for accurate disease prediction with minimum time consumption. Hidden layer 2 performs the patient Data Classification based on Czekanowski's dice similarity coefficient with the selected relevant features from the previous layer to predict lung cancer. The factors considered for performance evaluation of the proposed technique with the existing state of the art approaches include prediction accuracy, false-positive rate and prediction time. Lunar 16 Lung Cancer dataset consisting of patient data is used for evaluation. The obtained results show that the proposed TPFMDANN-LSTM technique achieves higher prediction accuracy with minimum time consumption and less false positive rate than the state-of-the-art methods. The experimental results reveal that the TPFMDANN-LSTM technique performs better with a 6% improvement in prediction accuracy, 36% reduction of false positives, and 16% faster prediction time for lung cancer detection compared to existing works.
Keywords: Lung cancer prediction; deep artificial neural network; LSTM; target projection matching pursuit; LSTM; czekanowski's dice similarity
Lung cancer is a significant type of cancer, which directs to a high death rate. One of the crucial causes of lung cancer in developing countries is the increasing usage of cigarette smoking in the current epoch. With the rapid growth of people suffering from disease, the healthcare industry provides the doctors’ sets of quality of services for accurate analysis of patient medical data. Healthcare services are becoming more popular for solving various problems such as early disease prediction, patient care, and community services. Accurate prediction of Lung Cancer Disease is a significant process to provide appropriate treatment to the patients. A Lung Cancer Prediction Convolutional Neural Network (LCP-CNN) was developed in [1] for the early diagnosis of diseased patients to identify the benign nodules with a high degree of accuracy. But the accurate disease diagnosis did not perform with lesser time consumption. A k-Nearest-Neighbors (k-NN) technique was introduced in [2] for diagnosing the stage of patients’ diseases. The designed algorithm uses the genetic algorithm for effective feature selection to minimize the dataset dimensions. But the false positive rate was not minimized during the classification. A novel fuzzy soft expert system was introduced in [3] to predict lung cancer disease. But the machine learning approach was not applied for accurate prediction. A deep neural network (DNN) was introduced in [4] for lung cancer screening with high precision. But the designed network failed to collect more training data with higher robustness. A high-dimensional logistic regression was developed in [5] for lung cancer prediction with higher accuracy. But, the feature selection process was not carried out with a lesser prediction time. An Enhanced Convolutional Neural Network (CNN) was introduced in [6] to obtain better accuracy for automated diagnosis of a lung tumor. But the performance of lung tumor diagnosing time was not minimized. A Weight Optimized Neural Network with Maximum Likelihood Boosting (WONN-MLB) technique was introduced in [7] for lung cancer detection with big data. Though the technique improves the accuracy, the huge amounts of data points were not considered. A Markov decision process was developed in [8] to concurrently optimize lung cancer recognition with higher specificity. However, the higher classification performance in detecting malignant pulmonary nodules was not obtained. An integration of binary classification and Multiclass Support Vector Machine classification with threshold method was introduced in [9] to classify malignant or benign nodules. But, the designed method failed to improve the efficiency of classifying the stages. A cross-validated Bayesian network model was developed in [10] for predicting local lung cancer. However, the model failed to validate the lung cancer prediction with larger external data set. In [11], integration of platelet features and platelet-rich plasma were extracted for lung cancer identification. But the feature analysis was not done to improve the accuracy of lung cancer detection. A logistic regression prediction model was developed in [12] for classifying the tumor clinical stage. The designed model increases the accuracy and recall rate of the prediction, but the time consumption of prediction was not minimized. In order to minimize the time consumption for cancer prediction, an Elephant Herding Optimization algorithm was developed in [13]. But the algorithm failed to handle the complex datasets to obtain improved results.
The various classification techniques were introduced in [14] to make it possible for a better diagnosis of cancer survivability rate. However, the designed techniques failed to predict the entire stages of lung cancer. The fuzzy-based systems and the evolutionary genetic algorithms were delivered in [15] for the diagnosis of lung cancer. The algorithms were not efficient to improve the accuracy of lung cancer identification. A random forests (RF) machine-learning algorithm was designed in [16] for improving the lung cancer prediction. However, the additional machine learning approaches were not employed to enhance the prediction accuracy. A meta-heuristic optimized neural network was developed in [17] to analyze patient data for predicting lung disease with maximum accuracy. But the designed network large volume of the dataset was not taken to analyze critical disease. The double Normalization-based Multi-Aggregation (DNMA) model was introduced in [18] to find the important factors of early screening of lung cancer. However, the accuracy of lung cancer detection was not improved. The impact of combining delta features with conventional (non-delta) features was considered in [19] for diagnostic discrimination and lung cancer incidence prediction. However, it failed to apply deep learning for accurately identifying lung cancer. A multi-parameterized artificial neural network (ANN) was developed in [20] to predict lung cancer risk with high sensitivity and specificity. However, the designed neural network failed to perform the lung cancer risk prediction.
• The general contribution of the proposed TPFMDANN-LSTM is listed as follows,
• The TPFMDANN-LSTM technique is introduced based on feature selection and classification to improve lung cancer prediction accuracy.
• The Deep Artificial feed-forward neural network uses the Target Projection matching pursuit in the first hidden layer to find the significant features based on the Gaussian disruptive function. It helps to minimize the time consumption of lung cancer disease prediction.
• Next, patient data classification is performed with the selected relevant features at hidden layer 2 using LSTM to predict lung cancer based on Czekanowski's dice similarity measure. The Heaviside step activation function analyzes the similarity value and classifies the patient data into different classes. It helps to improve the prediction accuracy and minimize the false positive rate.
• The performance analysis of the proposed TPFMDANN-LSTM technique has measured along with conventional prediction methods based on various performance metrics through the series of experiments.
The paper is organized into different sections. Section 2 briefly describes the proposed TPFMDANN-LSTM technique for lung cancer prediction with a neat diagram. Section 3 provides information on the experimental settings with the lung cancer dataset. In Section 4, the test outcomes and comparative analysis are presented using various parameters. Finally, Section 5 concludes the paper.
2 Target Projection Feature Matched Deep Artificial Neural Network with LSTM for Lung Cancer Prediction
Lung cancer is a dangerous disease that causes a large number of deaths worldwide. The ancient prediction of lung cancer is essential to decline the death rate of patients. Thus, it is a great challenge encountered by physicians to identify lung cancer. With extensive development in healthcare communities, patient data analysis is used for early disease prediction. Due to the large volume of patient data, accurate disease prediction is a challenging task. Since the machine learning techniques use the entire feature for classification therefore it is infeasible and inaccurate. Hence, the dimensionality of the dataset needs to minimize for accurate disease prediction with minimum complexity. Based on this motivation, a TPFMDANN-LSTM is introduced. The TPFMDANN-LSTM considers the Qos metrics as time and the dimensionality (i.e., memory space). This contribution is achieved through the relevant feature selection. The architecture of the TPFMDANN-LSTM is shown in Fig. 1.
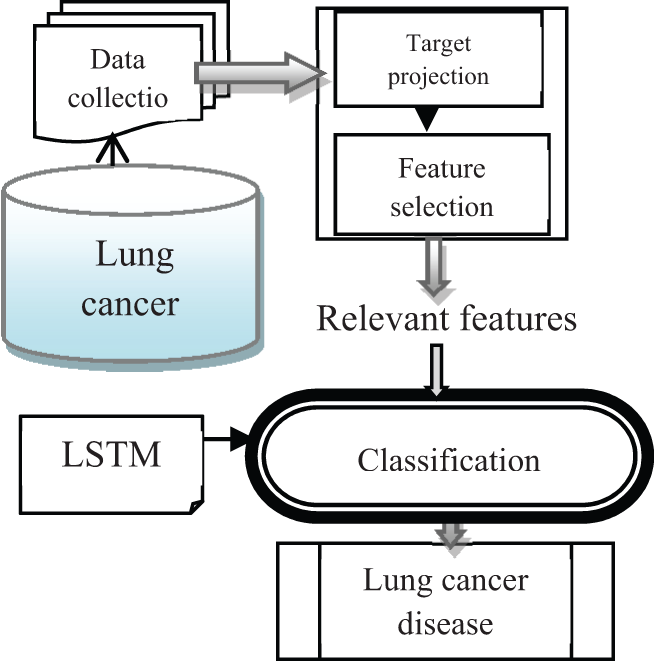
Figure 1: Architecture of proposed TPFMDANN-LSTM technique
Fig. 1 demonstrates the architecture of the proposed TPFMDANN-LSTM technique to predict lung cancer disease at an earlier stage with high accuracy lesser time consumption. Initially, the lung cancer dataset is considered for predictive analytics. The number of features
Fig. 2 illustrates the schematic construction of the deep artificial feed-forward neural Network. The proposed deep learning concept uses the feed-forward neural network that the input data processed in the forward direction where feature selection and classification is carried out. A multi perceptron network is also a named feed-forward network. The network consists of numerous layers such as one input layer, two hidden layers, and one output layer. The multi-layer perception is referred to a feed-forward network made up of fully connected layers.The nodes between one layer and another layer are connected in a feed-forward manner with adjustable weights to form the entire network. The network consists of numerous layers such as one input layer, two hidden layers, and one output layer. The input layer receives features
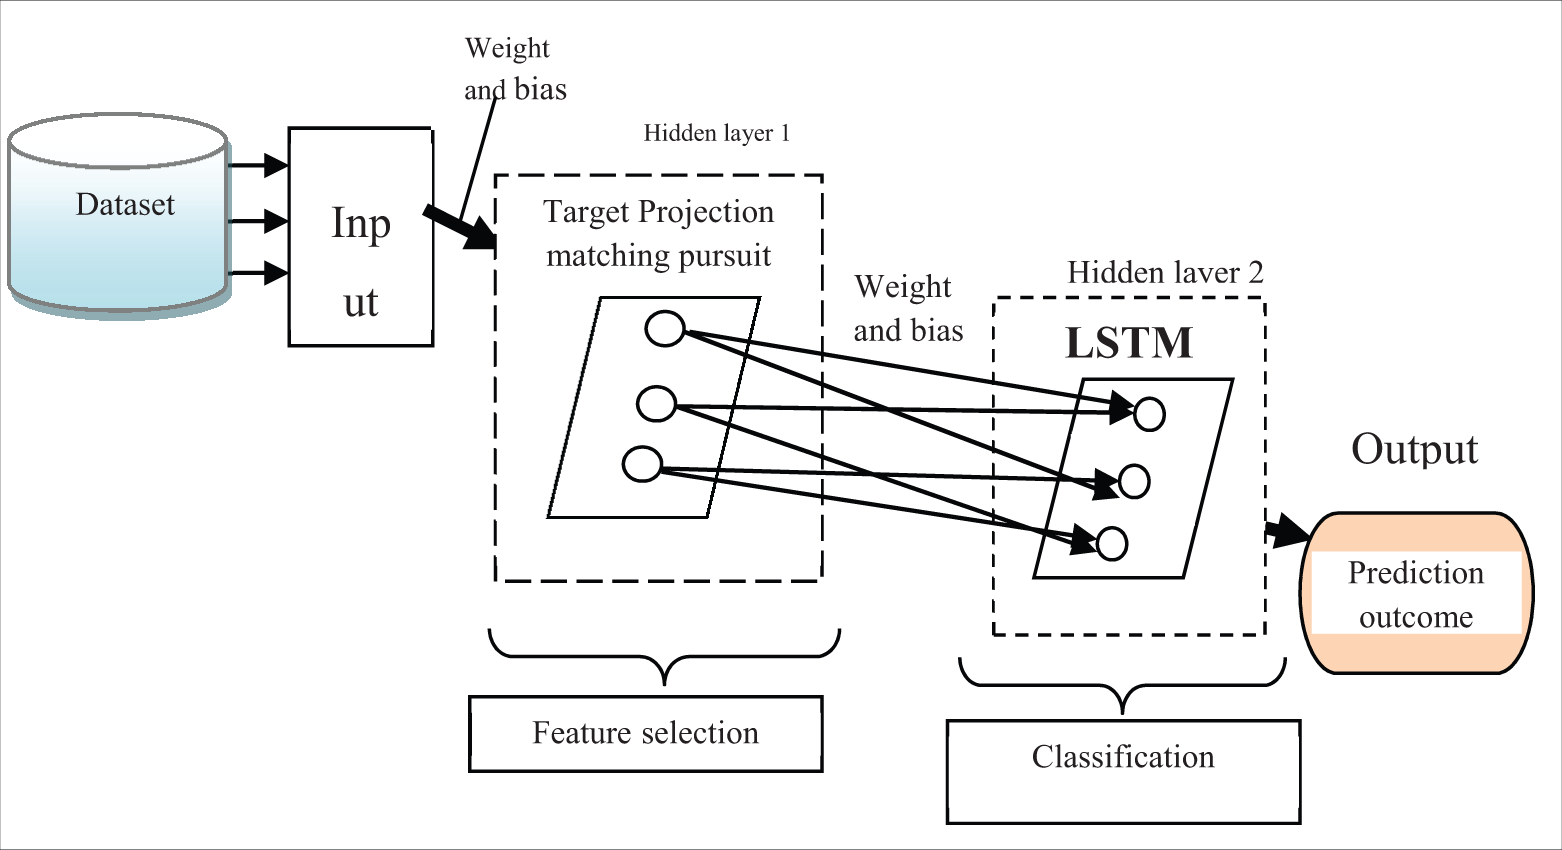
Figure 2: Schematic construction of deep artificial feed-forward neural network
The activity of the neuron at the input layer ‘
where, r denotes a bias stored the value is ‘1’,
The proposed technique uses the target projection matching pursuit to find the “best matching” features from the possible projections in the multidimensional dataset. The target projection matching pursuit is a statistical model for finding the more relevant features related to the objective. In the matching process, the Gaussian distributive function is applied for finding the best matching features.
where, M denotes a matching output,
Fig. 3 illustrates the architecture of the LSTM construction consists of the cell, an input gate, an output gate and a forget gate. The input gate receives the input (i.e., selected features with data) from the previous layer. Then, the forget gate uses the activation function for removing the significant data from the cell state. This forgets gate is also used to create a decision to display the output in a particular time step. Then the output gate displays the output results.
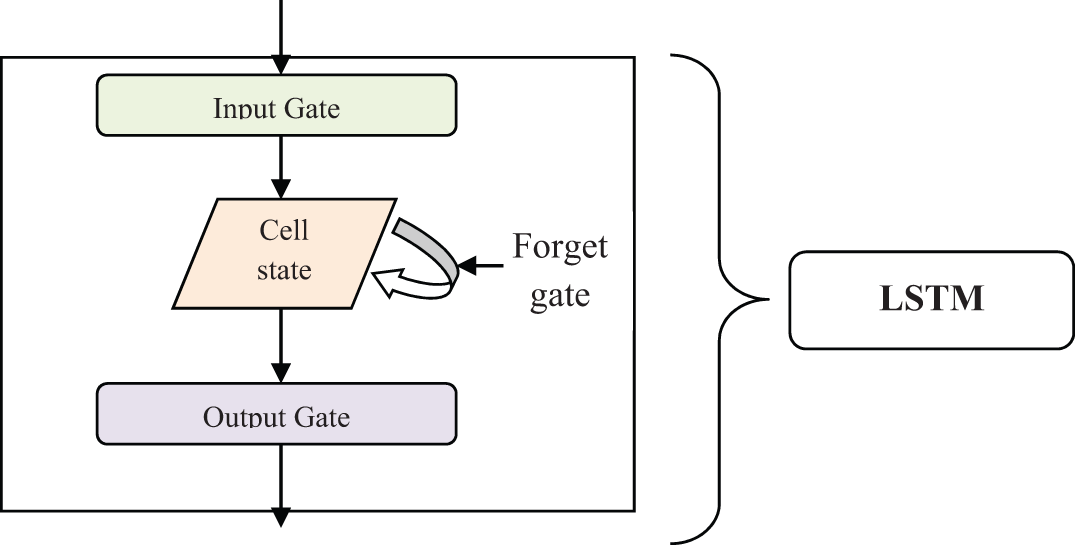
Figure 3: Architecture of the LSTM
The process of forget gate is expressed as given below,
where,
where ‘
where
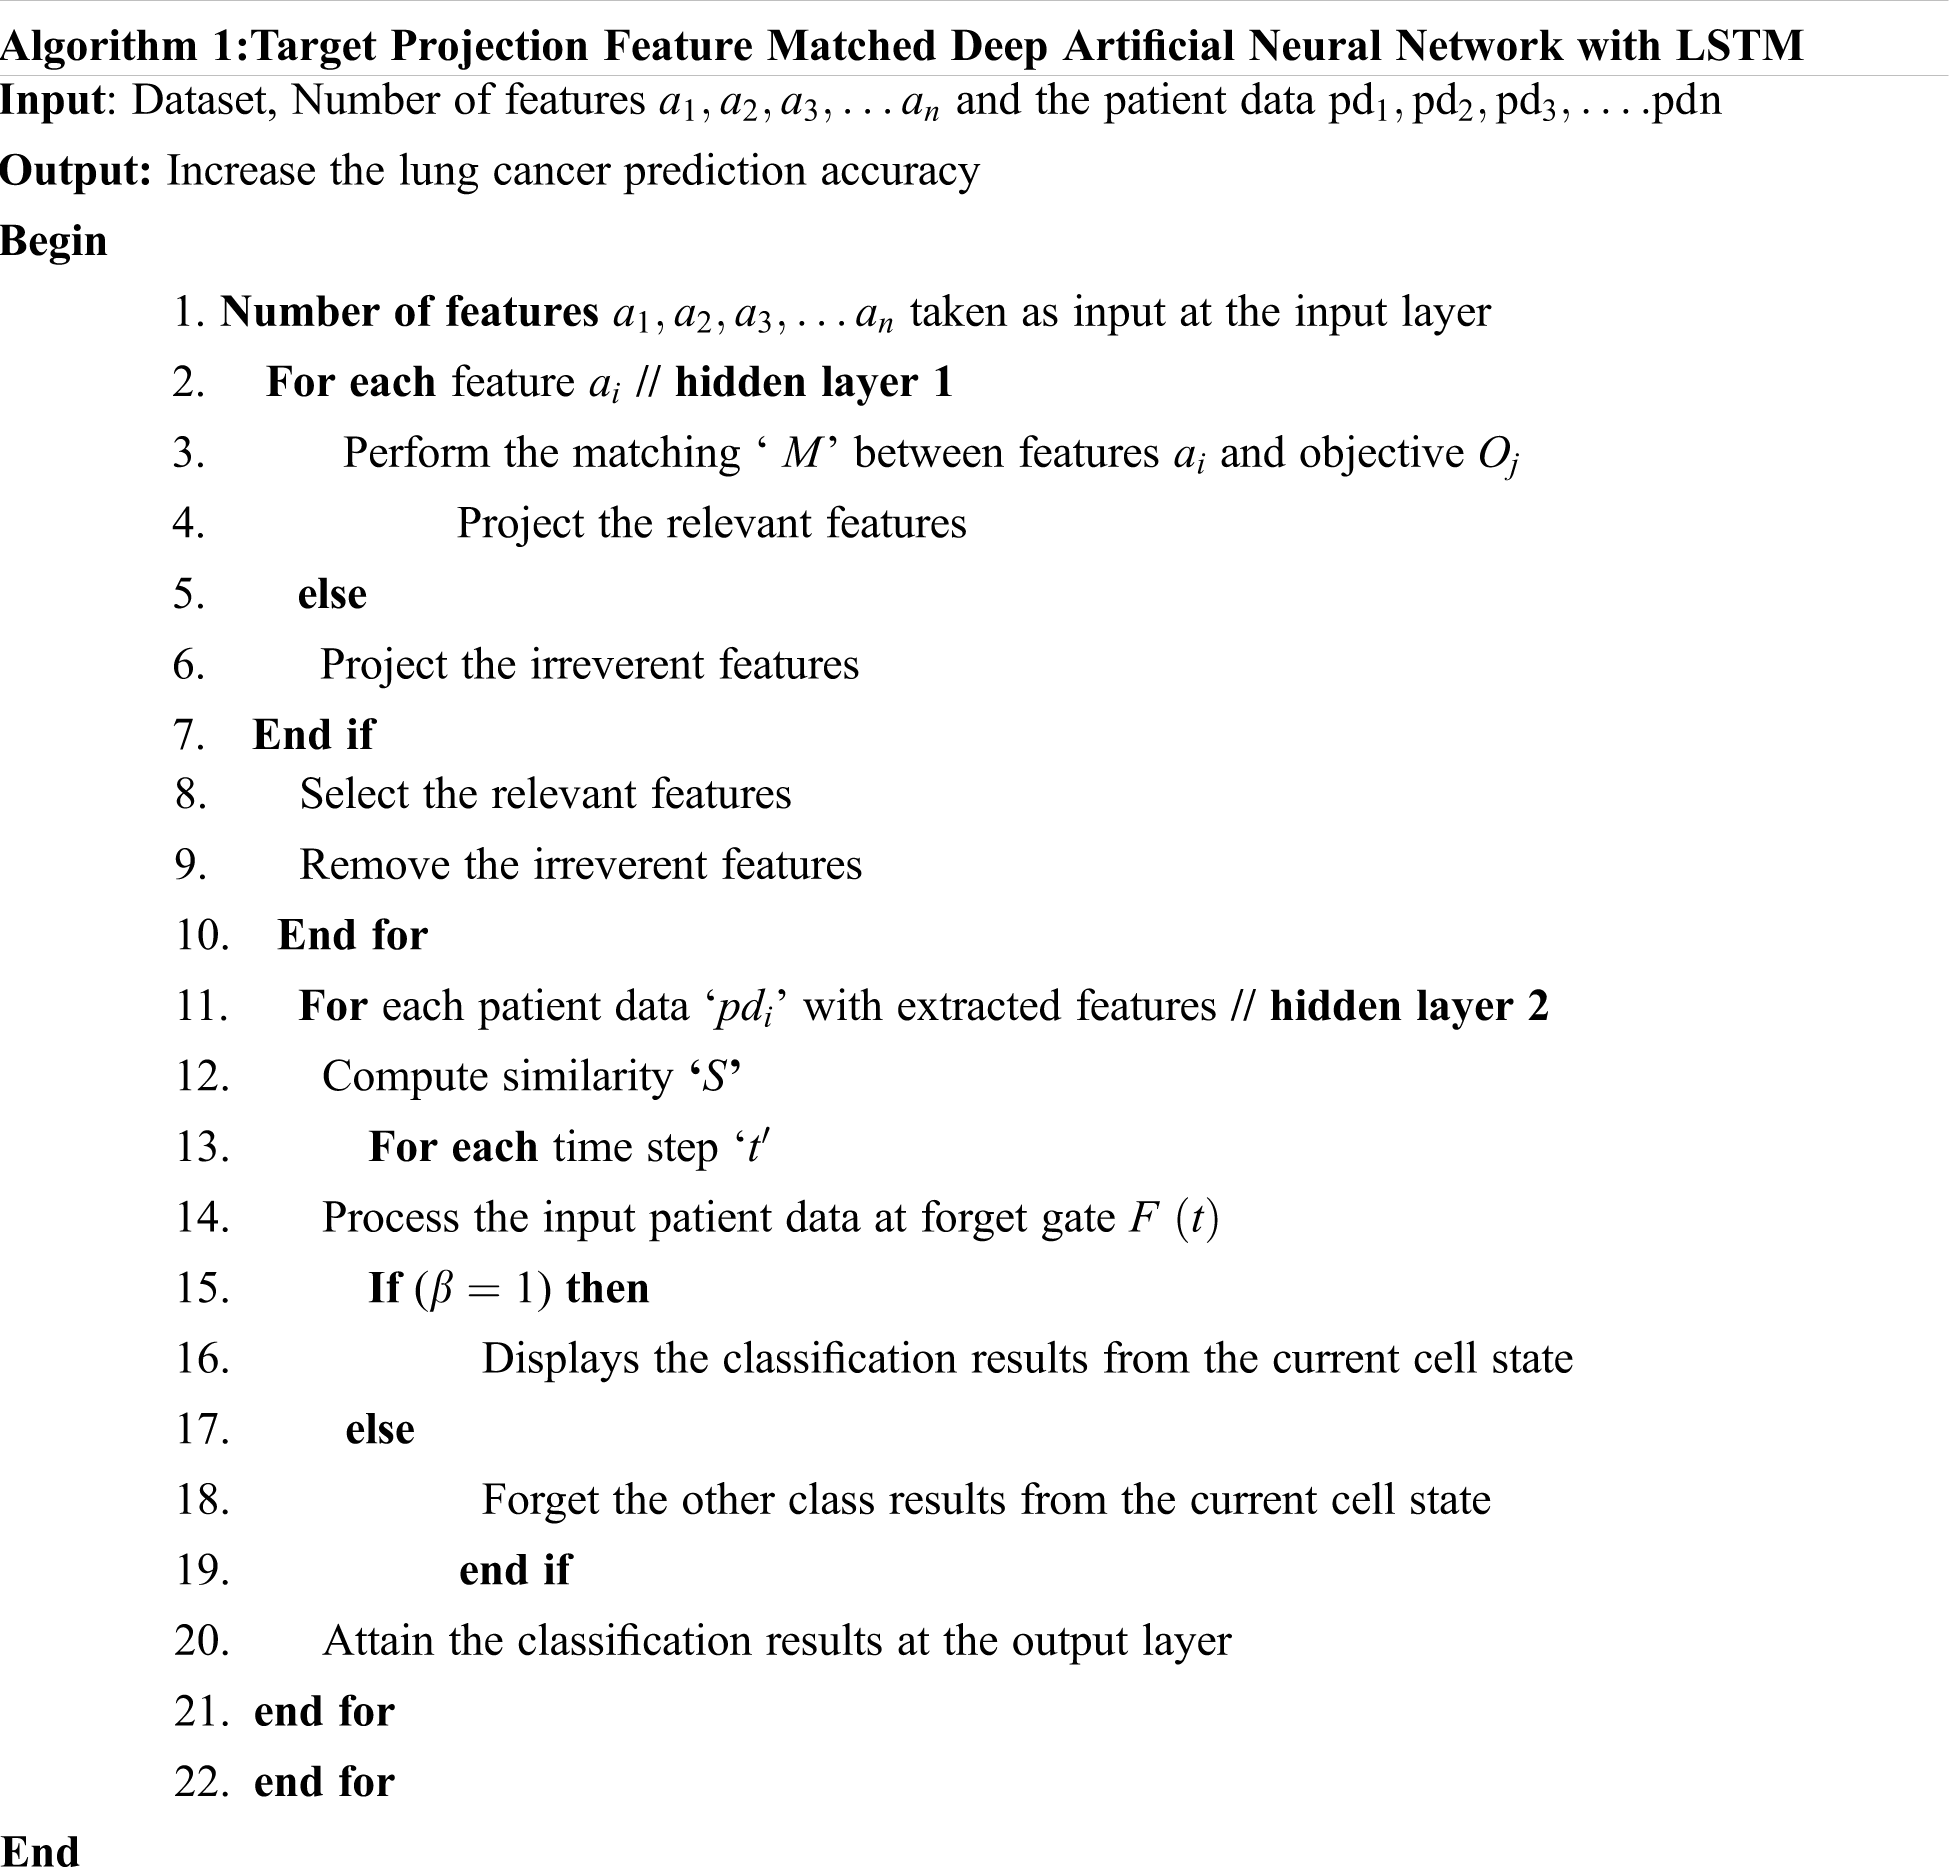
Algorithm 1 explains the step-by-step process of Target Projection Feature Matched Deep Artificial Neural Network with LSTM to increase the lung cancer prediction accuracy with minimal time consumption. Initially, the number of features and patient data is collected from the dataset. Then the collected data are sent to the input layer. Then the target projection matching pursuit is applied for finding the more relevant features from the dataset based on the Gaussian distributive function. The feature which is more relevant to the objective is selected and other features are removed. Then the selected features with the patient data are given to the second hidden layer using LSTM. The LSTM uses Czekanowski's dice coefficient to measure the similarity between patient data and their respective class. Based on the similarity measure, the activation function categorizes the patient data. Finally, the output layer displays the classification results to improve the lung cancer prediction accuracy.
An experimental evaluation is conducted for proposed TPFMDANN-LSTM and existing methods namely LCP-CNN [1] and k-NN [2] are carried out using Java language. For the experimental consideration, lung cancer data is used and taken from https://data.world/cancerdatahp/lung-cancer-data. The patient data are collected from this dataset to perform the lung cancer prediction through feature selection and classification. The dataset consists of 25 attributes. The attributes as a patient id, age, gender, air pollution, alcohol use, dust allergy, Occupational Hazards, genetic_risk, chronic_lung_disease, balanced_diet, obesity, smoking, passive_smoker, chest_pain, coughing_of_blood, fatigue, weight_loss, shortness_of_breath, wheezing, swallowing_difficulty, clubbing_of_finger_nails, frequent_cold, dry_cough, snoring and level. The dataset comprises 1000 patients for constructing a patient file. The patient is nothing but a dataset instance. The dataset includes 1000 instances. The attribute characteristics are integer and string. The associated task performed by the dataset is classification.
In this section, the performance evaluation of TPFMDANN-LSTM and existing LCP-CNN [1] and k-NN [2] are compared with certain parameters such as prediction accuracy, False-positive rate, and prediction time. The results of three different techniques are discussed with the aid of tables and graphical representation.
Prediction accuracy: It is defined as the ratio of numbers of patient data that are correctly classified into different classes to the total number of patient data. The prediction accuracy is formulated as given below,
where
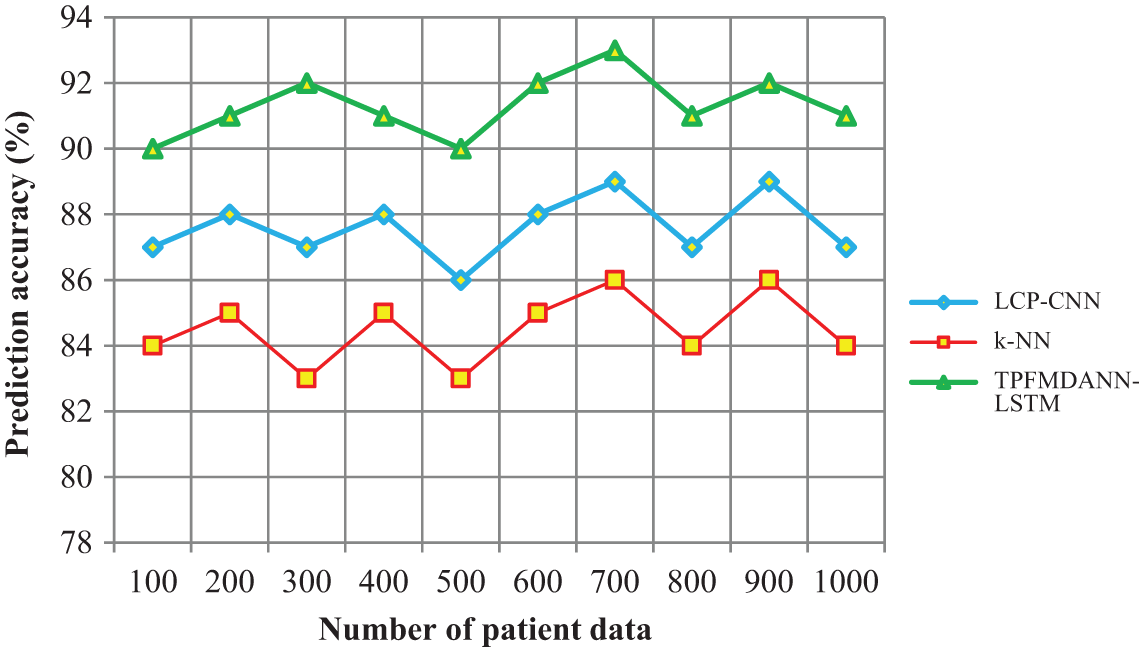
Figure 4: Performance analysis of prediction accuracy
Fig. 4 shows the performance analysis of disease prediction accuracy along with the number of patient data in the ranges from 100 to 1000. The input patient data are taken in the horizontal direction and the lung cancer prediction accuracy is observed at the vertical axis. As shown in the graphical chart, there are three various colors of lines such as green, blue and red indicates the prediction accuracy of three techniques namely TPFMDANN-LSTM, LCP-CNN [1] and k-NN [2] respectively. Among the three methods, the proposed TPFMDANN-LSTM has the ability for increasing prediction accuracy. This is because of the application of Deep Artificial Neural Network with LSTM to predict lung cancer. Followed by, Czekanowski's dice similarity coefficient is used for analyzing the training data and testing disease class data.Based on the similarity values, the patient data are correctly classified with higher accuracy. According to the observed results, the introduced TPFMDANN-LSTM effectively achieves higher prediction accuracy than the different classification schemes. Let us considers 100 patient data for conducting the experiments in the first iteration. By applying the TPFMDANN-LSTM, 90 data are correctly classified and the accuracy is 90% whereas the accuracy percentage of the existing [1] and [2] are 87% and 84% respectively. Followed by, various performance results are observed for each method. For each method, ten different results are observed. The performance of the proposed TPFMDANN-LSTM is compared to other existing methods. Finally, the average of ten comparison results designates that the lung cancer prediction accuracy of the proposed technique is increased by 4% when compared to [1] and 8% when compared to [2].
False-positive rate: It is defined as the ratio of numbers of patient data that are incorrectly classified into different classes from the number of patient data taken as input. The false-positive rate is expressed as given below,
where
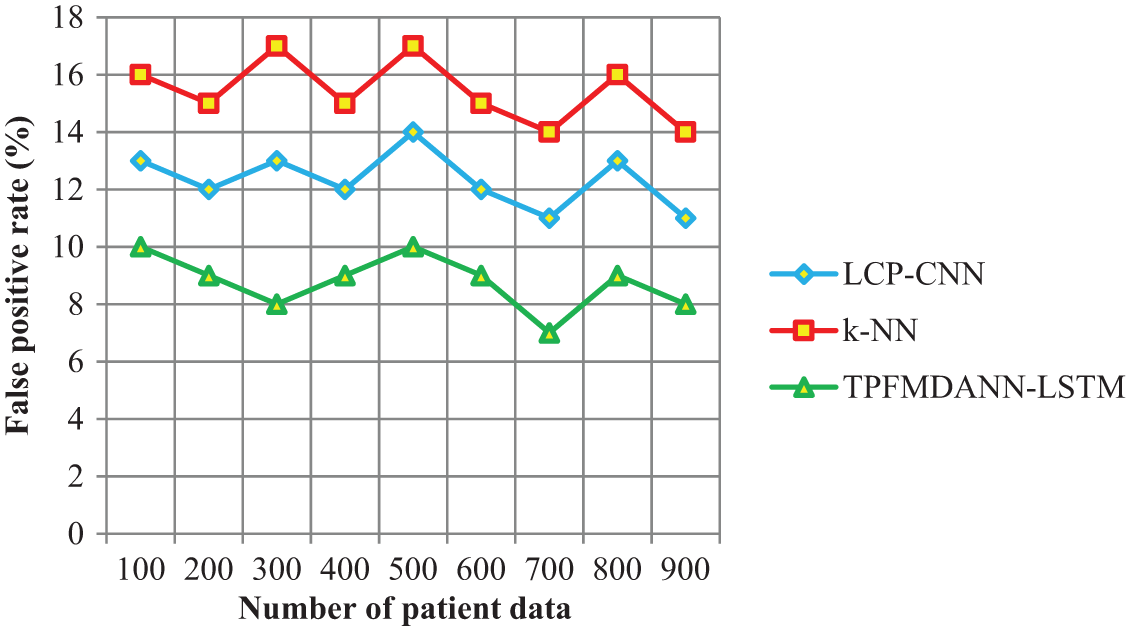
Figure 5: Performance analysis of the false positive rate
Fig. 5 portrays the performance results of the false positive rate regarding the number of patient data. As shown in the above graphical results, the proposed TPFMDANN-LSTM technique outperforms well in terms of achieving a minimum false positive rate than the other two classification methods. The reason for the lesser false positive rate is to apply the Heaviside step activation function to analyze the similarity value between the training data and testing disease data. Then the activation function returns the classification results and minimizes the incorrect data classification. In this way, patient data are correctly classified into the respective classes hence it reduces the false positive rate. The average of ten values shows that the false positive rate is significantly reduced by 29% and 43% when compared to existing methods.
Prediction time: It is defined as the amount of time consumed by the algorithm to predict lung cancer based on the patient data classification. The overall prediction time is measured as follows
where
The performance analysis of lung cancer prediction time along with the number of patient data is shown in Fig. 6. The time taken for predicting lung cancer is significantly reduced using the TPFMDANN-LSTM than the other two conventional classification methods. Let us consider ‘100’ patient data for experimentation, the time consumed by TPFMDANN-LSTM to predict the lung cancer is 12
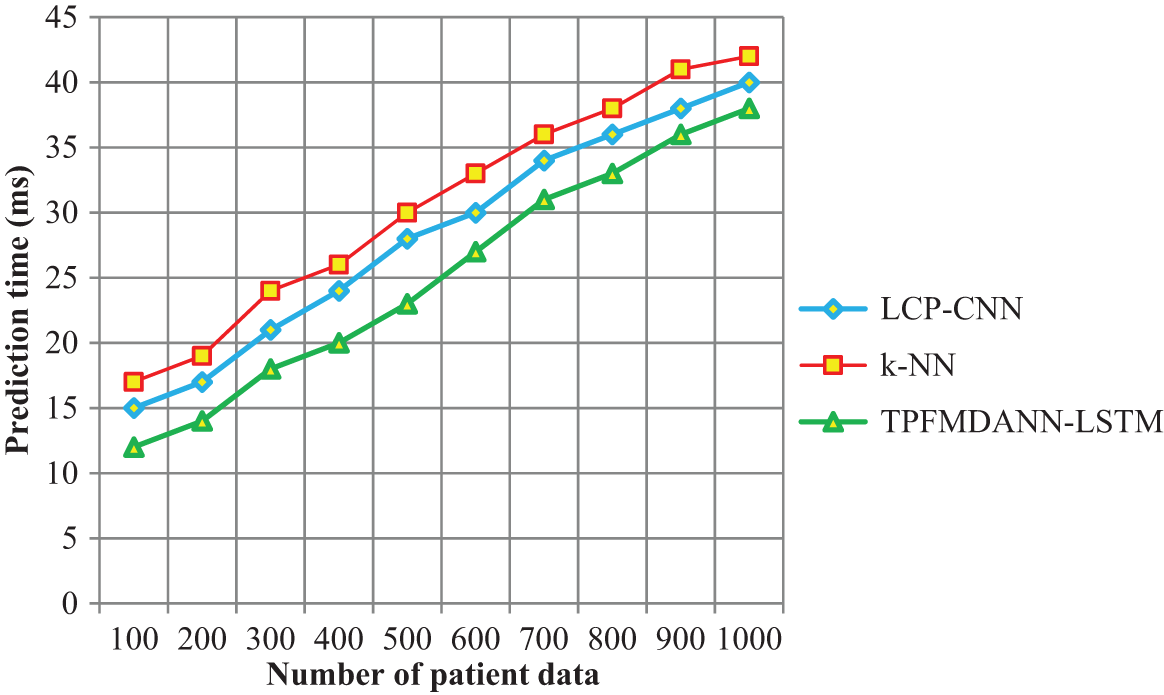
Figure 6: Performance analysis of prediction time
From the observed results, it is clear that the prediction time is minimized using the introduced TPFMDANN-LSTM technique. The TPFMDANN-LSTM technique uses the target projection matching pursuit for finding the more significant features to the objective from the dataset based on the Gaussian distributive function. The relevant feature is selected and other features are removed. Then the selected features are used for predicting the disease using LSTM and hence it reduces the prediction time. Therefore, the overall results of the proposed technique are compared to other classification techniques. The average of ten results shows that the lung cancer prediction time is significantly reduced by 12% and 19% than the state-of-the-art methods.
Several machine-learning methods have been available in the literature whose performances rely on various aspects. This work proposes a hybrid deep-learning method called TPFMDANN-LSTM with a feature selection and classification. First, the TPFMDANN-LSTM technique performs the feature selection using Target Projection Matching to identify the relevant features for accurate detection. The next step performs the classification based on the relevant features using the LSTM technique. The LSTM network analyzes the training and testing data using Czekanowski's dice similarity coefficient. Based on the similarity measure, the activation function returns the output results with higher accuracy. A comprehensive experimental evaluation compares the proposed TPFMDANN-LSTM with the existing classification approaches. The obtained result indicates that the proposed approach achieves higher lung cancer prediction accuracy, lesser false positive rate, and reduced time consumption.
Funding Statement: The authors received no specific funding for this study.
Conflicts of Interest: The authors declare that they have no conflicts of interest to report regarding the present study.
1. M. A. Heuvelmans, P. M. A. van Ooijen, S. Ather, C. F. Silva, D. Han et al., “Lung cancer prediction by deep learning to identify benign lung nodules,” Lung Cancer, Elsevier, vol. 154, pp. 1–4, 2021. [Google Scholar]
2. N. Maleki, Y. Zeinali and S. T. A. Niaki, “A k-NN method for lung cancer prognosis with the use of a genetic algorithm for feature selection,” Expert Systems with Applications, Elsevier, vol. 164, pp. 1–7, 2021. [Google Scholar]
3. A. M. Khalil, S. G. Li, Y. Lin, H. X. Li, S. G. Ma et al., “A new expert system in prediction of lung cancer disease based on fuzzy soft sets,” Soft Computing, Springer, vol. 24, pp. 14179–14207, 2020. [Google Scholar]
4. J. Guo, C. Wang, X. Xu, J. Shao, L. Yang et al., “An artificial intelligence-based automated system for lung cancer screening,” Annals of Translation Medicine, vol. 8, no. 18, pp. 1–12, 2020. [Google Scholar]
5. X. Zhang, Q. Zhang, X. Wang, S. Ma, K. Fang et al., “Structured sparse logistic regression with application to lung cancer prediction using breath volatile biomarkers,” Statistics in Medicine, Wiley, vol. 39, no. 7, pp. 955–967, 2020. [Google Scholar]
6. G. Kasinathan, S. Jayakumar, A. H. Gandomi, R. Manikandan, S. J. Fong et al., “Automated 3-D lung tumor detection and classification by an active contour model and CNN classifier,” Expert Systems with Applications, Elsevier, vol. 134, pp. 112–119, 2019. [Google Scholar]
7. J. A. ALzubi, B. Bharathikannan, S. Tanwar, R. Manikandan, A. Khanna et al., “Boosted neural network ensemble classification for lung cancer disease diagnosis,” Applied Soft Computing, Elsevier, vol. 80, pp. 579–591, 2019. [Google Scholar]
8. P. Petousis, A. Winter, W. Speier, D. R. Aberle, W. Hsu et al., “Using sequential decision making to improve lung cancer screening performance,” IEEE Access, vol. 7, pp. 119403–119419, 2019. [Google Scholar]
9. R. Sujitha and V. Seenivasagam, “Classification of lung cancer stages with machine learning over big data healthcare framework,” Journal of Ambient Intelligence and Humanized Computing, Springer, vol. 12, no. 5, pp. 5639–5649, 2021. [Google Scholar]
10. Y. Luo, D. McShan, D. Ray, M. Matuszak, S. Jolly et al., “Development of a fully cross-validated Bayesian network approach for local control prediction in lung cancer,” IEEE Transactions on Radiation and Plasma Medical Sciences, vol. 3, no. 2, pp. 232–241, 2019. [Google Scholar]
11. R. Zua, S. Yub, G. Yanga, Y. Gee, D. Wanga et al., “Integration of platelet features in blood and platelet rich plasma for detection of lung cancer,” Clinica Chimica Acta, vol. 509, pp. 43–51, 2020. [Google Scholar]
12. B. Wang and J. Zhang, “Logistic regression analysis for LncRNA-disease association prediction based on random forest and clinical stage data,” IEEE Access, vol. 8, pp. 35004–3501, 2020. [Google Scholar]
13. M. Nayak, S. Das, U. Bhanja and M. R. Senapati, “Elephant herding optimization technique based neural network for cancer prediction,” Informatics in Medicine Unlocked, Elsevier, vol. 21, pp. 1–10, 2020. [Google Scholar]
14. P. K. Ra and N. C. Naveen, “Lung cancer survivability prediction based on performance using classification techniques of support vector machines, C4.5 and naive Bayes algorithms for healthcare analytics,” Procedia Computer Science, Elsevier, vol. 132, pp. 412–420, 2018. [Google Scholar]
15. A. Alharbi, “An automated computer system based on genetic algorithm and fuzzy systems for lung cancer diagnosis,” International Journal of Nonlinear Sciences and Numerical Simulation, vol. 19, no. 6, pp. 583–594, 2018. [Google Scholar]
16. F. Deng, H. Zhou, Y. Lin, J. A. Heim, L. Shen et al., “Predict multicategory causes of death in lung cancer patients using clinicopathologic factors,” Computers in Biology and Medicine, Elsevier, vol. 129, pp. 1–7, 2021. [Google Scholar]
17. A. Abugabah, A. A. AlZubi, F. Al-Obeidat, A. Alarifi, A. Alwadain et al., “Data mining techniques for analyzing healthcare conditions of urban space-person lung using meta-heuristic optimized neural networks,” Cluster Computing, Springer, vol. 23, pp. 1781–1794, 2020. [Google Scholar]
18. H. Liao, Y. Long, M. Tang, D. Streimikiene, B. Lev et al., “Early lung cancer screening using double normalization-based multi-aggregation (DNMA) and delphi methods with hesitant fuzzy information,” Computers & Industrial Engineering, Elsevier, vol. 136, pp. 453–463, 2019. [Google Scholar]
19. S. S. Alahmari, D. Cherezov, D. B. Goldgof, L. O. Hall, R. J. Gillies et al., “Delta radiomics improves pulmonary nodule malignancy prediction in lung cancer screening,” IEEE Access, vol. 6, pp. 77796–77806, 2018. [Google Scholar]
20. G. R. Hart, D. A. Roffman, R. Decker and J. Deng, “A multi-parameterized artificial neural network for lung cancer risk prediction,” PLOS One, vol. 13, no. 10, pp. 1–18, 2018. [Google Scholar]
 | This work is licensed under a Creative Commons Attribution 4.0 International License, which permits unrestricted use, distribution, and reproduction in any medium, provided the original work is properly cited. |