DOI:10.32604/iasc.2022.019658
| Intelligent Automation & Soft Computing DOI:10.32604/iasc.2022.019658 | |
| Article |
Energy Demand Forecasting Using Fused Machine Learning Approaches
1Center for Cyber Security, Faculty of Information Science and Technology, Universiti Kebansaan Malaysia (UKM), Bangi, 43600, Selangor, Malaysia
2School of Information Technology, Skyline University College, University City Sharjah, Sharjah, 1797, UAE
3School of Computer Science, NCBA&E, Lahore, 54000, Pakistan
4Canadian University Dubai, Dubai, UAE
5Pattern Recognition and Machine Learning Lab, Department of Software, Gachon University, Seongnam, 13557, Korea
6School of Computer Science, Minhaj University Lahore, Lahore, 54000, Pakistan
*Corresponding Author: Muhammad Adnan Khan. Email: adnan@gachon.ac.kr
Received: 21 April 2021; Accepted: 04 June 2021
Abstract: The usage of IoT-based smart meter in electric power consumption shows a significant role in helping the users to manage and control their electric power consumption. It produces smooth communication to build equitable electric power distribution for users and improved management of the entire electric system for providers. Machine learning predicting algorithms have been worked to apply the electric efficiency and response of progressive energy creation, transmission, and consumption. In the proposed model, an IoT-based smart meter uses a support vector machine and deep extreme machine learning techniques for professional energy management. A deep extreme machine learning approach applied to feature-based data provided a better result. Lastly, decision-based fusion applied to both datasets to predict power consumption through smart meters and get better results than previous techniques. The established model smart meter with automatic load control increases the effectiveness of energy management. The proposed EDF-FMLA model achieved 90.70 accuracy for predicting energy consumption with a smart meter which is better than the existing approaches.
Keywords: Feature fusion; deep extreme learning; SVM; decision-based fusion; smart meters; energy; EDF-FMLA
Recently, the application of a keen meter for controlling and overseeing electric force utilization is one of the advances that help both clients just as electric forces and providers. It is expected that 70% of the universe’s populace, more than 6 billion, will live in urban communities and encompass districts by 2040, so urban communities should be savvy. IoT is the interconnection of different incorporated processing gadgets on the Internet, which allow them to speak with one another. This improves the personal satisfaction of the end client. The expansion in the Internet of things (IoT) has reached out in the local applications and the day-by-day activities [1–3]. This idea of IoT in homes is recommended to screen and spare vitality while coming to and keeping up a specific degree of comfort. The standard existing home automation systems practice basic technology such as Bluetooth, Zigbee, wi-fi, Arduino, gsm, etc. Each technology has some benefits but weaknesses also. Research should be ended to lessen and identify their disadvantages [4].
The IoT application has become this standard in this 21st century due to the prevalent usage of the web, headway of PDA development, and expanded desires for versatile correspondence. The prerequisite for the internet of things propels for home computerization structure has extended because of the augmentation in light of a legitimate concern for equality between the house and the rest of the world. The ever-expanding worldwide populace drives the interest for power. In any case, the present framework foundation is incapable of fighting the rising vitality prerequisite. On the one hand, the electric frameworks become wasteful and fragile due to outdated gear and innovations of the current electric lattice [5].
The administration organizations worldwide are concentrating on decreasing Carbon dioxide (Co2) discharges because of expanding natural mindfulness, what's more, involving guidelines. At present, to meet the ever-developing vitality request, power plants are utilizing oil, gas, coal, what's more, atomic force. The Smart Grid changes the current matrix to work all the more helpfully, responsively, and naturally. Electronic force molding, control of the creation, and conveyance of power are significant parts of the brilliant network [6].
A critical fragment of the smart grid is the Advanced metering infrastructure (AMI). AMI is unquestionably not a single development, in any case, an organized course of action of smart meters, trades frameworks, and data the chief’s systems that engage two-route correspondence among utilities and customers. Keen meters are critical sections of the smart grid, enabling a robotized variety of fine-grained (regularly reliably or few seconds) essentialness use data [7].
The smart meter has made conceivable novel sort of administrations. For instance, a Savvy meter (SM) compromises adaptable power evaluating plans, in which shoppers are charged by the hour of vitality utilization. The information created by SM is immense and gets weak to be prepared with regular procedures. MDA enables service organizations to make their organizations progressively effective; shoppers set aside their cash by utilizing less vitality at top times. Likewise, utilities and purchasers can comprehend their power use designs from the point-by-point examination of meter information. Along these lines, it is both practical and green [8].
With shrewd meter innovation, it is conceivable to profit by request flexibility and better decisions on tax plans. In this way, determining gives the clients the way to relate power use conduct with utilization cost. Clients may likewise profit by anticipating arrangements through more superior comprehension of their vitality utilization and future projections, permitting them to all the more likely deal with their vitality bills. Additionally, at whatever point, specific controllers of a segment of the robust warming and cooling loads can design the movement of these stacks to dodge load shedding [9]. There are numerous difficulties in determining the issue of energy estimating since 1990 utilizing different strategies comparing Artificial neural network (ANN) [9–11], neuro-fuzzy method, and fuzzy logic [12].
Further approaches consist of time series analysis [10] and Support vector regression (SVR) [13]. Feature fusion-based technique is used to estimate standard energy capacity for each hour regularly using SM data. Deep extreme machine learning technique is a data handling framework enlivened by the way natural apprehensive frameworks process the data.
A massive part of the Internet of things (IoT) based keen meters is viewed as a strategy to accomplish energy proficiency, feasible turn of events, and the capability of improving the quality, dependability, and effectiveness of intensity of power supply. These results demonstrate the significance of the character limit regarding significant inherent capacity, deal, and circulation of electrical force flexibly [14]; an intelligent meter was proposed along with the applied GRU model, one artificial neural network adequate energy supervision. Power consumption data collected to train the GRU model with the proposed smart meter. The applied smart meter has programmed power capacity and real-time observation function, and energy control function through power consumption prediction. A reference value is determined to control the energy using Root mean squared error (RMS), which is one of the performance evaluation indexes. The author confirmed that the smart meter with automatic energy control increases energy supervision productivity [15].
The recently proposed technique utilizes Clara bunching for gathering the entire dataset into three different gatherings relying upon their essential feeding value, which future used with arrangement models artificial neural network and support vector machine to gauge with apparatus devoured extra energy inside different timeframes [16]. In this study, a novel illustration of highlight significance investigation as applied to brilliant meter order for non-private structures. The smart meter information is monstrous, and experts frequently need to utilize worldly knowledge to separate metadata data about structures [17].
An analytic data context for bunching housing clients based on their load features has been presented. The structure utilized a definition approach to decrease hourly load information from 4,000 Swedish clients in a particular time and temperature stretches. This information was a contribution to the K-implies calculation that gathered the clients. The group results were remotely approved on review information from 94 clients and indicated that the structure could recognize electric and non-electric warming frameworks, along with social viewpoints associated with the family unit arrangement. An affectability examination of model boundaries was also performed, indicating that the bunching was touchy to changes in separation boundaries. In this way, it should be tended to when bunching will be made, for example, tax plan for DSO. It was talked about that some potential mistakes were connected with the climate information as the climate station was situated in another geographic zone [18].
The author’s study presents an adaptable strategy for focusing on private clients for EE programs that attention on lessening pointless homegrown energy utilization and supplanting low proficient cooler coolers by utilizing shrewd meter information and day by day temperature information. A tale technique is proposed to recognize baseload [18]. In this study, the author proposed a period recurrence highlight mix-based family trademark ID approach utilizing shrewd meter information. First, a few recurrence area highlights are separated using discrete wavelet change notwithstanding traditional time-space measurable highlights. Second, the arbitrary backwoods calculation is used to choose a subset of significant highlights and eliminate redundant data in the first list of capabilities. Third, a help vector machine is utilized as a classifier with the chosen highlights’ contribution to gathering the family unit qualities. Finally, contextual investigation using the practical information from Ireland demonstrates that the proposed approach shows better execution after consolidating the recurrence space highlights [19].
To guarantee clients’ protection and forestall pernicious clients from altering power information, a security insurance plan of decentralized keen meter for brilliant home climate dependent on consortium blockchain is proposed in this paper, which tackles the clients’ protection issue and the danger of concentrated stockpiling. Hypothetical examination demonstrates that the plan ensures clients’ protection and has attributes of privacy and enforceability. The security of data downloaded by power organizations dependent on the consortium blockchain is a problem worth concentrating on later on [20,21]. Machine learning approaches like the Fuzzy system [22], Neural Network [23,24], DELM [25,26] and SVM [26] are robust candidate solutions in the field of smart health and smart city [24].
3 Proposed EDF-FMLA System Model
The cloud and decision-based fusion model for an intelligent smart meter load forecast system are proposed to predict the load. The preprocessing technique was used for handling the missing values. The moving average method was used for taking missing values in the datasets. The DELM has been applied for smart meter load prediction in the feature-based dataset in the application layer. In the evaluation layer, the accuracy and miss rate of the purposed EDF-FMLA Model were investigated. If the learning criteria are not met in both conditions, then the system must retrain, whereas if the learning criteria were completed, the data are stored on the cloud, and the next step is the decision-based fusion empowered with fuzzy logic activation. Decision-based fusion entangled with fuzzy logic determines whether the fused feature predicts load or not, shown in Fig. 1.
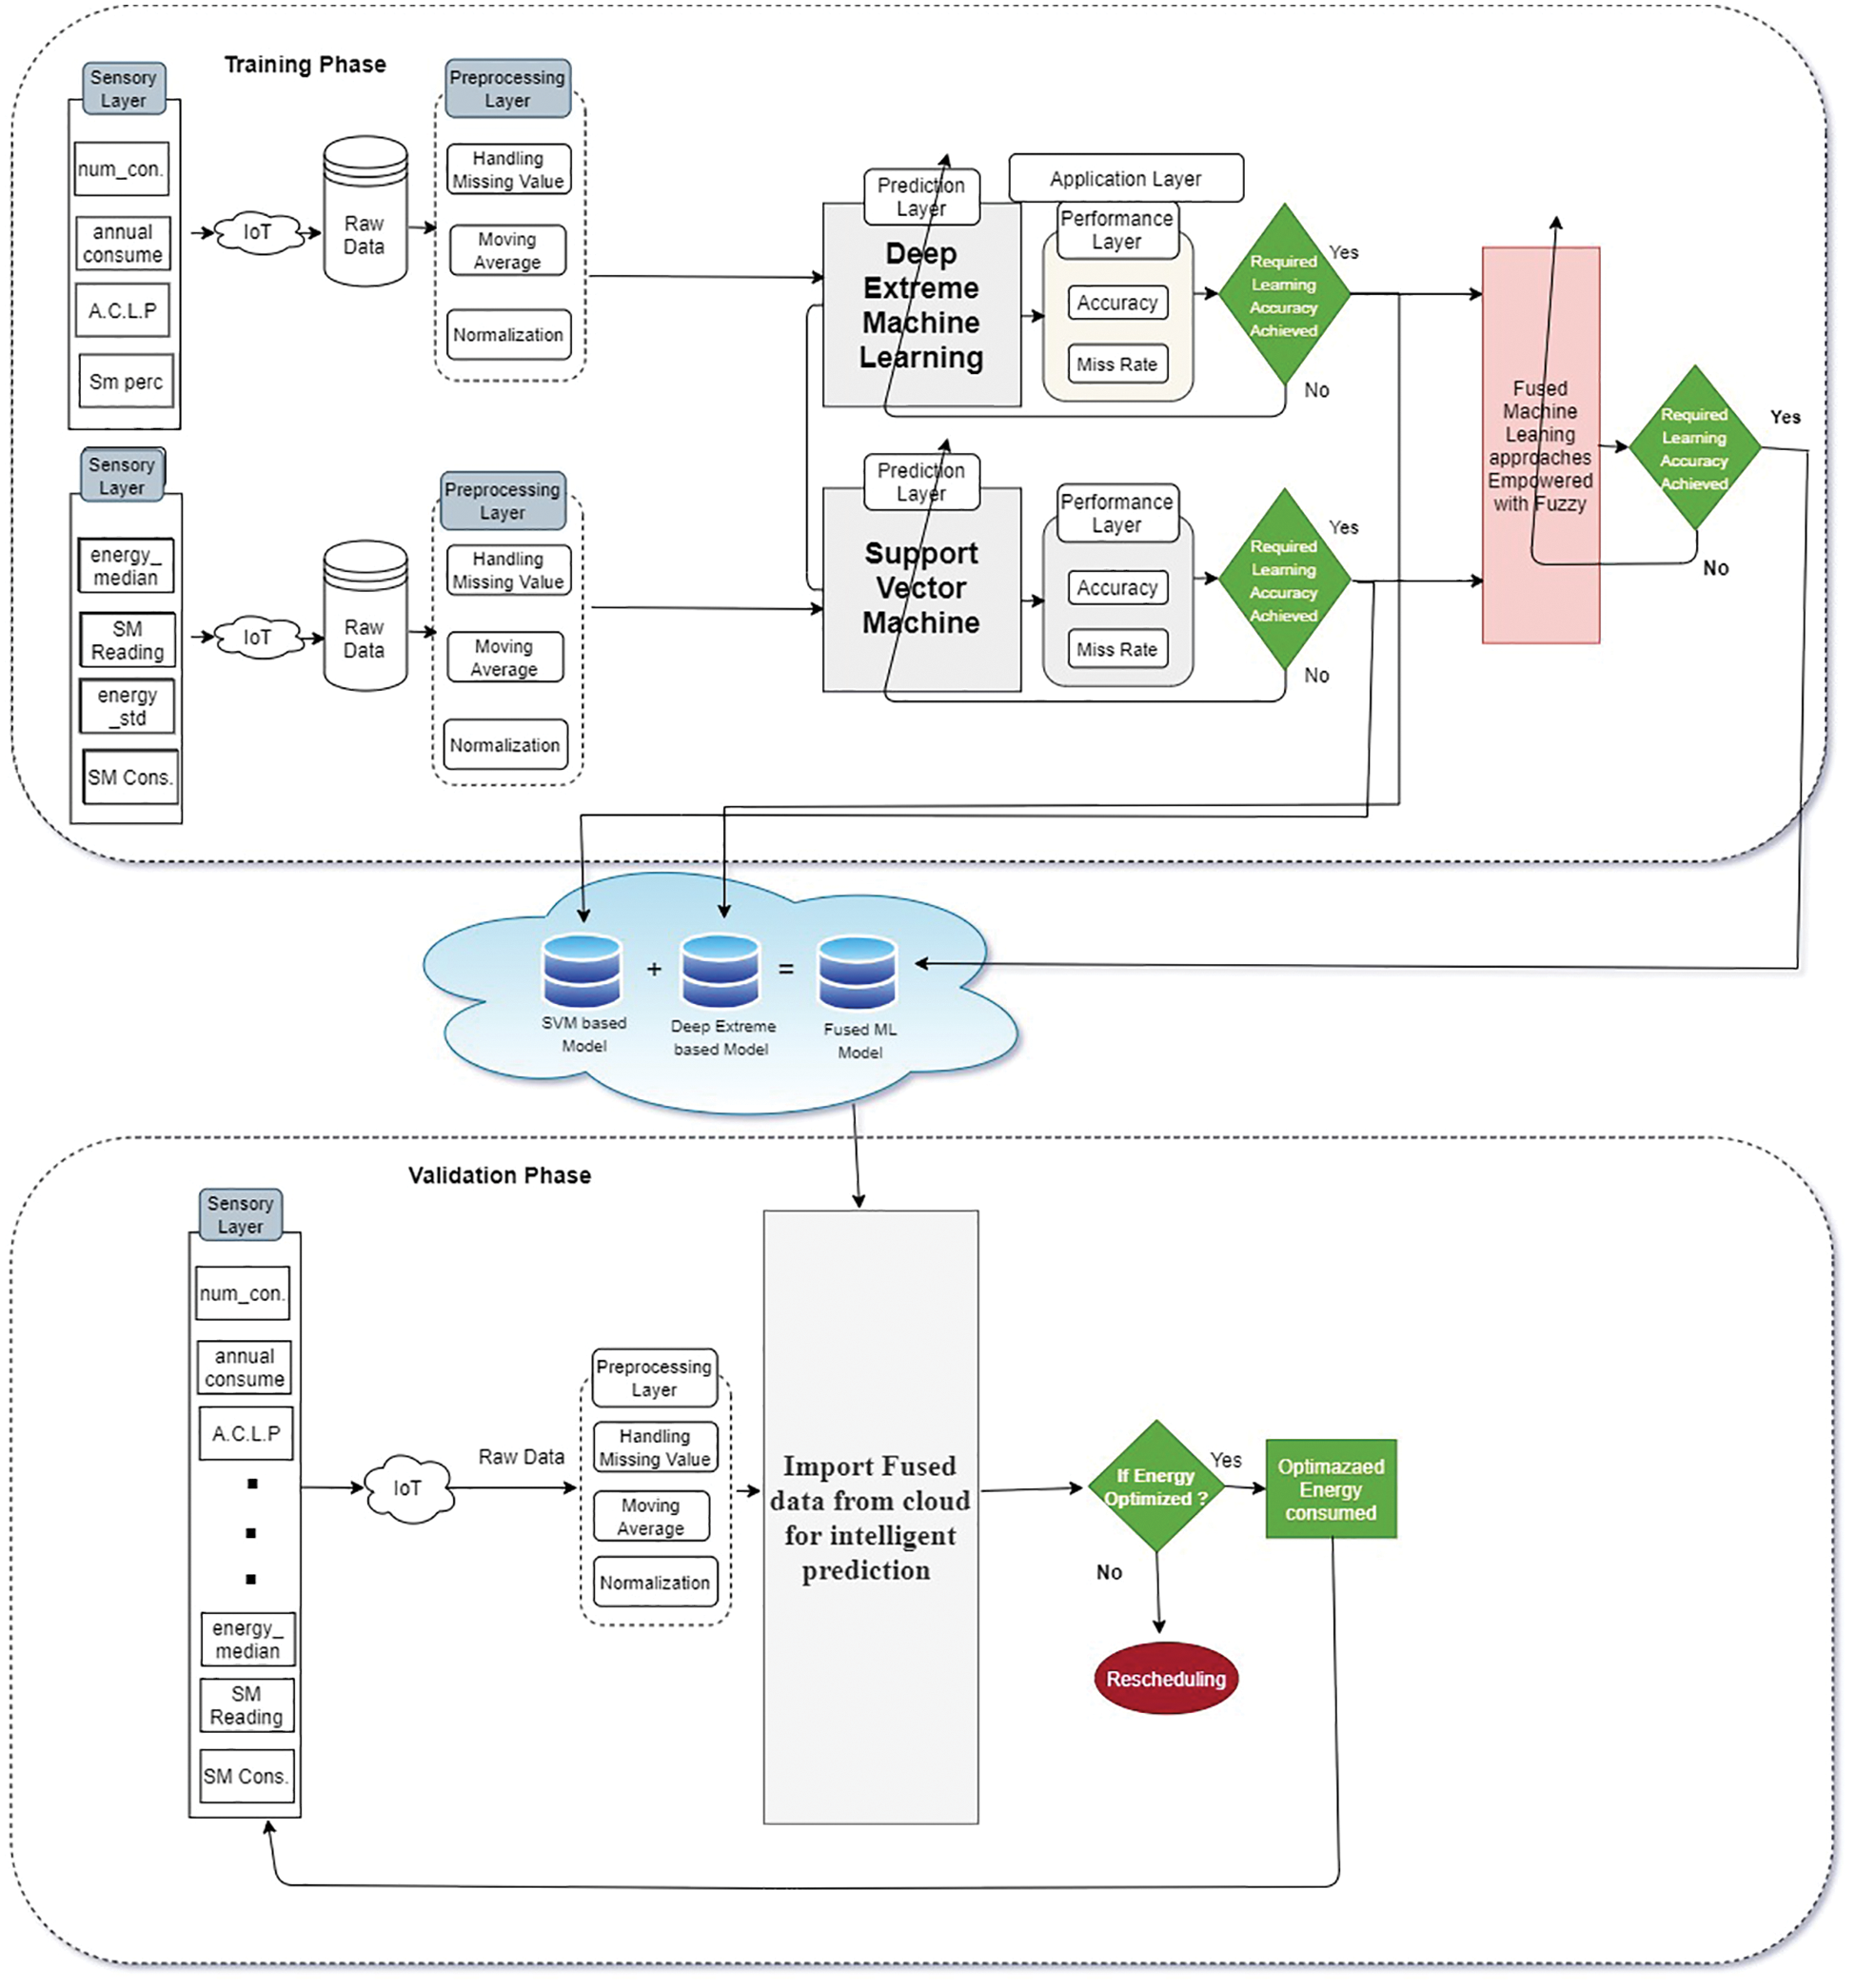
Figure 1: Proposed energy consumption prediction from smart meter EDF-FMLA model
After the preprocessing step, the proposed EDF-FMLA model imports fused data from the cloud to predict energy consumption. If the energy consumption is not indicated, then the model reschedules it. If energy consumption is indicated, then a fused database for intelligent prediction (activation layer) is created, and energy consumption prediction is imported from the cloud.
3.1 Deep Extreme Learning Machine
The Deep extreme learning machine (DELM) is an effective method that is primarily used for prediction. Fig. 2 represents the DELM architecture that consists of an input layer, hidden layers, and output layer. In the input layer, the various features are used as input. Four hidden layers are used in the proposed EDF-FMLA model.
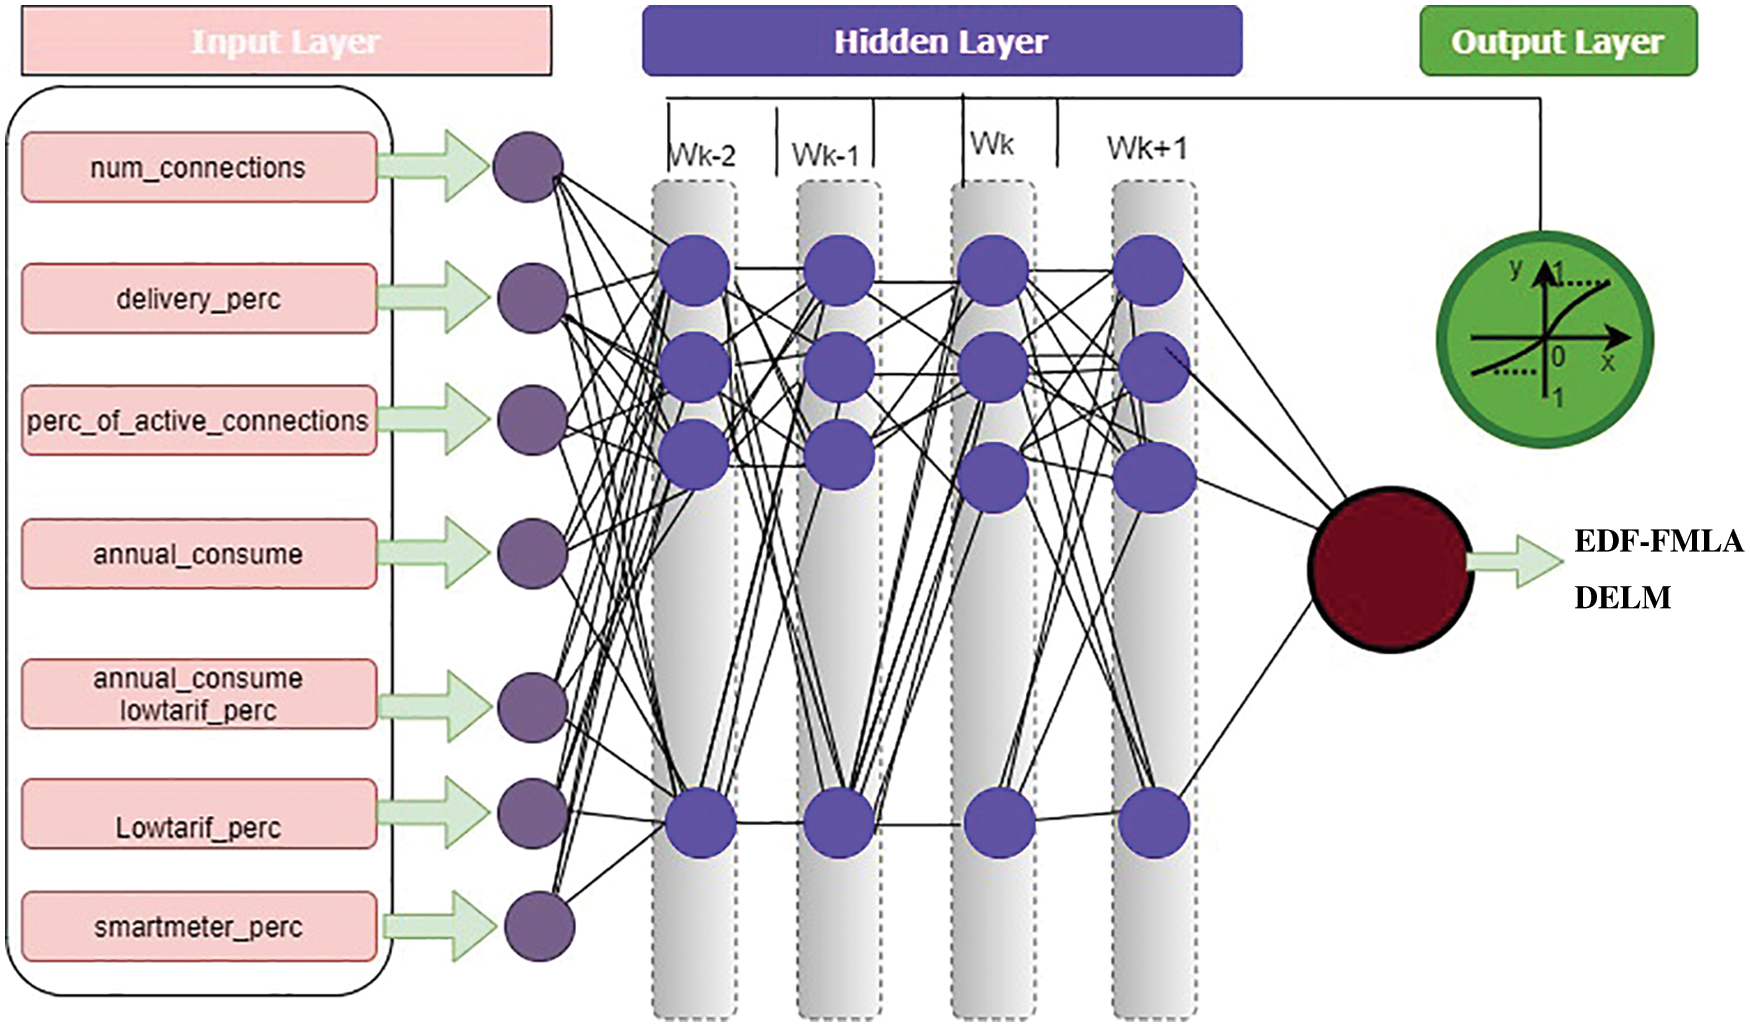
Figure 2: Deep extreme learning machine model for the proposed EDF-FMLA model
For the mathematical model of the proposed EDF-FMLA, the input layer represents in Eq. (1), and the output layer of the 1st layer represents in Eq. (2)
The feedforward propagation for the 2nd layer to the output layer in Eq. (3):
The output layer in the activation feature is indicated in Eq. (4):
The backpropagation error is written as in Eq. (6):
Eq. (7) imitates the rate of the weight change that is written for the output layer:
By adding the chain rule, in Eq. (8):
where,
Applying the chain rule (substituting Eq. (8)), to obtain the weight value revised as shown in Eq. (9):
where
where
Then the weights are the updating and biases between them, the output and hidden layers in Eq. (10):
The weight and bias alterations between the input and hidden layers are represented in Eq. (11).
In the application layer, the SVM is used for the prediction of load with a smart meter. It is a supervised ML algorithm that can be implemented in both regression and classification problems, but SVM is mainly used for classification tasks. K-fold cross-validation method is applied for the SVM algorithm in the forecast phase. The cross-validation method is applied to test the effectiveness of the model. K-fold sets are used for all data samples contributed, just as in the training and test phases. 4-fold, 10-fold, 14-fold, and 20-fold sets are applied to the processed data in the proposed model. In the performance evaluation layer, accuracy, miss rate, and other statistical parameters are designed to estimate the outcomes of the proposed model. The proposed model classifies the smart meter load prediction conditions into two classes, namely negative, positive. The negative case means no load prediction, and the record will not proceed. It would not be updated in the cloud database and positively signify the load prediction and data will be updated in the cloud database. The proposed EDF-FMLA can be stated mathematically as:
Given the equation of the line as,
where ‘w’ denotes the slope of the line and ‘y’ represents the intersect, so, Eq. (12) written as
Suppose,
Eq. (12) obtain from 2-dimensional vectors. Eq. (12) can work for other dimensions, the Eq. (13) shows the general equation of hyper lane.
The direction of a vector
where,
As we know that
Eq. (3) can also be written as
Let,
Applying
where,
where,
The dot product can be computed as Eq. (15) from multidimensional vectors. Let
If sign (g) < 0.5 then energy optimization is negative, if the sign (g) is greater than and equal to 0.5 and less than 1.5 then energy optimization is positive or yes.
Given a dataset S, we compute the energy optimization as follows,
In the following equation, g represents the functional margin of the dataset
The largest f will be selected by taking hyperplanes as the geometric margin of the dataset and is represented by g. The main objective is to take an optimal hyperplane which can be attained by finding the appropriate values of y and
The Lagrangian function is defined in the following equation,
From the above two equations, we get
After substituting the Lagrangian function
Subject to
Lagrangian multipliers technique is long to Karush-Kuhn-Tucker (KKT) conditions due to constraints have inequalities. The new requirement of KKT states that
So,
These are called support vectors, which are the closest points to the hyperplane. According to the above Eq. (21)
To compute the value of x we use the following equation
Multiplying both sides by
where
Then
The numbers of support vectors are V that will make the hyperplane used to make predictions. The hypothesis function is defined as follows,
The point that lies on the hyper-plane will be considered class 0 (negative), and the point that lies down the hyperplane will be categorized as 1 (positive). The primary purpose of the SVM is to discover the best hyper-plane that can distinguish the data proficiently and accurately.
3.3 Decision-Based Fusion Empowered with Fuzzy Logic
The proposed decision-based fusion modal empowered with fuzzy logic is based on knowledge, expertise, and logical reasoning ability. The Fuzzy Logic modal can manage the uncertainty and imprecision of data usage in a proper method. The proposed cloud and decision-based fusion for smart meter load forecasting system using the hierarchical DL SMFB modal mathematically modal is written as follow:
Fig. 3 represents the decision-based fusion diagram for the detection of energy consumption from smart meters.
R1edf = if DELM layer 1 is positive and SVM layer 1 is positive, then energy consumption is positive
R2edf = if DELM layer 1 is positive and SVM layer 1 is negative, then energy consumption is positive
R3edf = if DELM layer 1 is negative and SVM layer 1 is positive, then energy consumption is positive
R4edf = if DELM layer 1 is negative and SVM layer 1 is negative, then energy consumption is negative
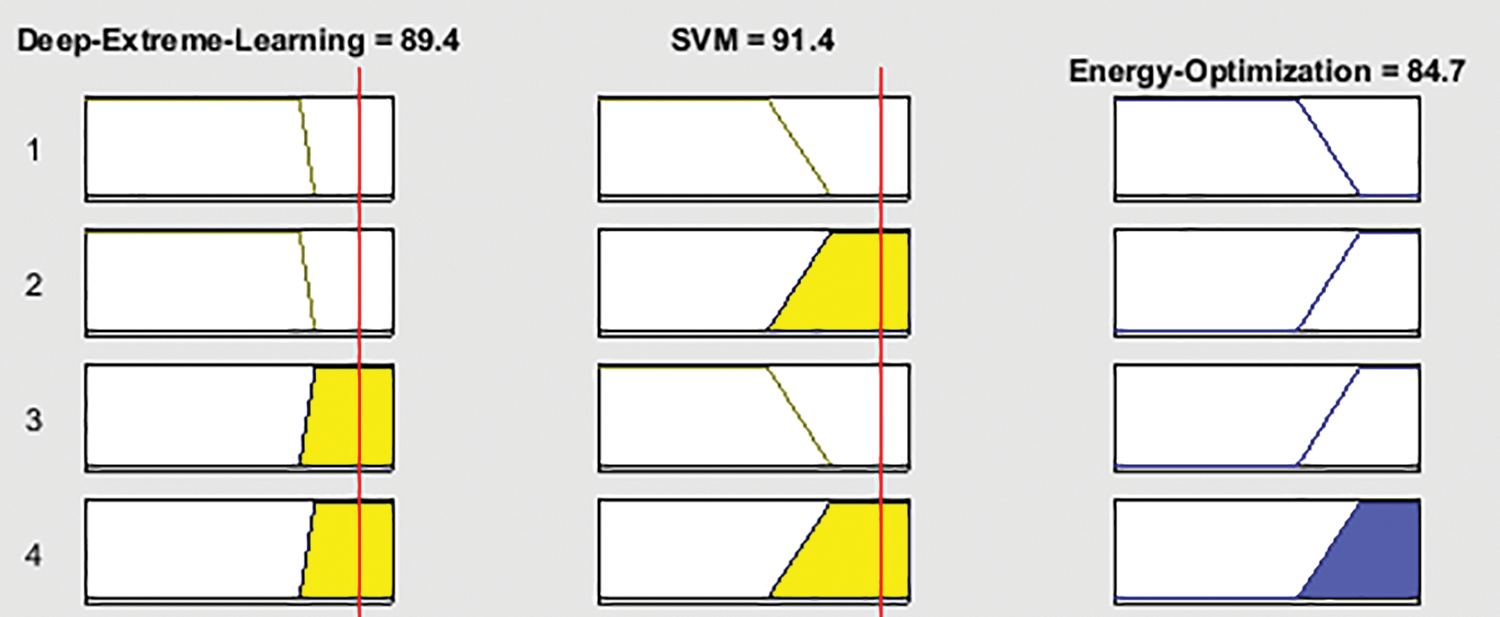
Figure 3: Proposed EDF-FMLA lookup diagram for decision-based fusion
Fig. 4 displays the output of the energy consumption consisting of DELM layer 1 and SVM layer 1. If SVM layer 1 is 80 to 100 and deep extreme 75 to 100, results will be positive, and energy consumption is entirely predicated. If SVM layer 1 is 0 to 60 and DELM 0 to 75, then results will be negative it will not predict the energy consumption from smart meters.
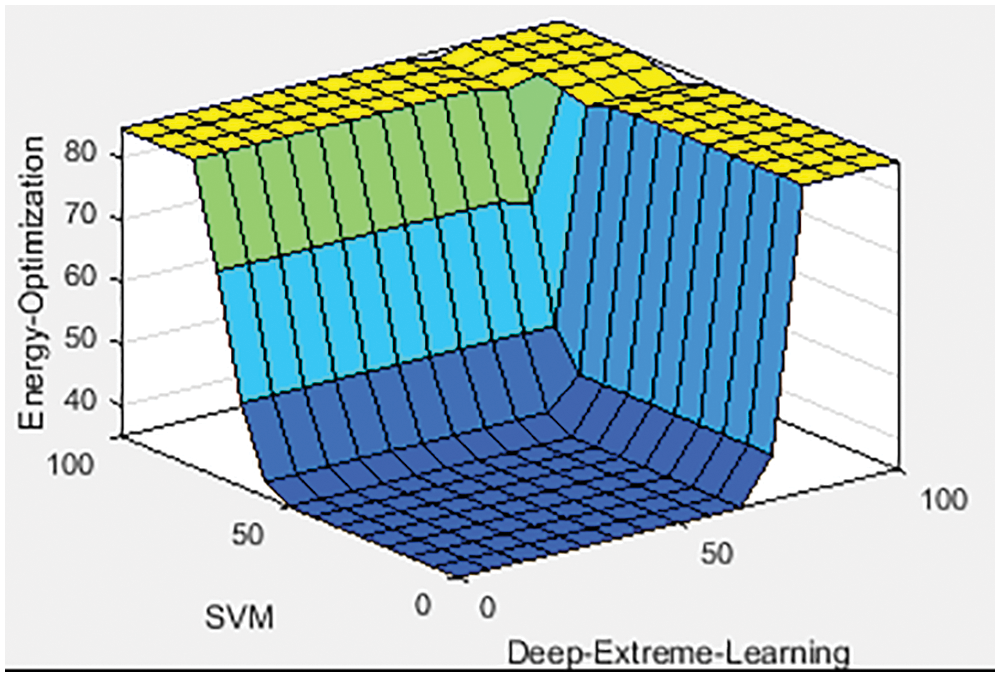
Figure 4: Proposed EDF-FMLA model rule surface for decision-based fusion
4 Proposed EDF-FMLA Modal Results
Matlab Tool 2019 is utilized for simulation and results based on an intelligent decision support system for the EDF-FMLA model empowered with deep learning based on a Support vector machine. The proposed Cloud and decision-based fusion for smart meter energy consumption prediction (EDF-FMLA) model were developed to predict load consumption from smart meters. In the proposed model using MATLAB simulations, results are obtained for prediction. The proposed EDF-FMLA model consists of two approaches, the SVM and DELM. In layer 1 the SVM and DELM approaches were used on 25575 and 2576 fused samples, correspondingly. For both methods, 80 percent of the fused samples were used for training purposes, and 20%were used for validation. The accuracy and miss rates of the proposed EDF-FMLA model were compared with the other existing approaches.
The proposed model detected either a smart meter predicts the load or not.
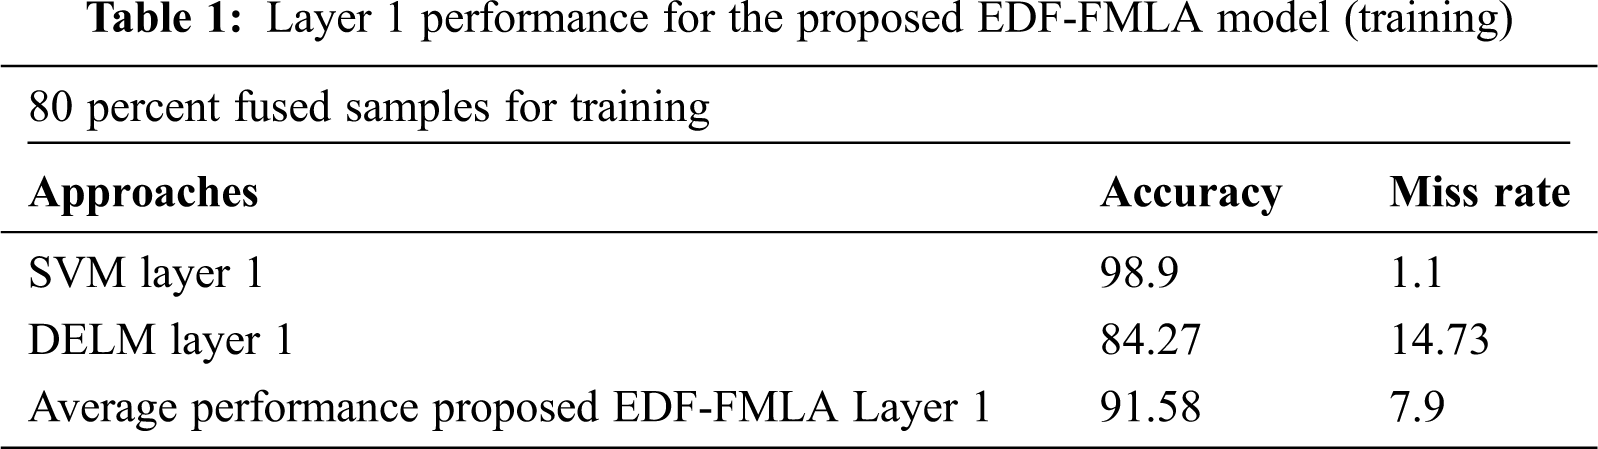
Tab. 1 represents the detection of the proposed EDF-FMLA model for training and used 80% fused samples. In Layer 1 the SVM Attained 98.9% and a 1.1 miss rate. DELM layer 1 obtained 84.27 accuracy and a 14.73 miss rate. The average performance of the purposed EDF-FMLA model layer 1 achieved 91.58 accuracy and a 7.9 miss rate.
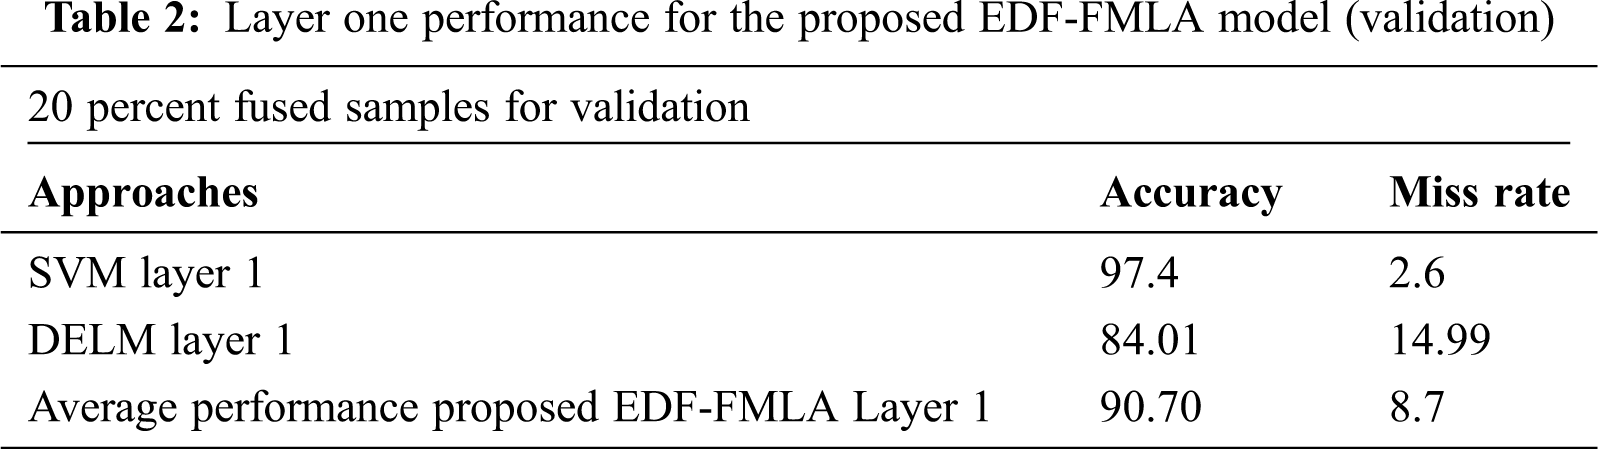
Tab. 2 represents the detection of the proposed EDF-FMLA model for validation and used 20% fused samples. In Layer 1 the SVM Attained 97.4% and a 2.6 miss rate. DELM layer 1 obtained 84.1 accuracy and a 14.99 miss rate. The average performance of the purposed EDF-FMLA model layer 1 achieved 90.70 accuracy and an 8.7 miss rate.
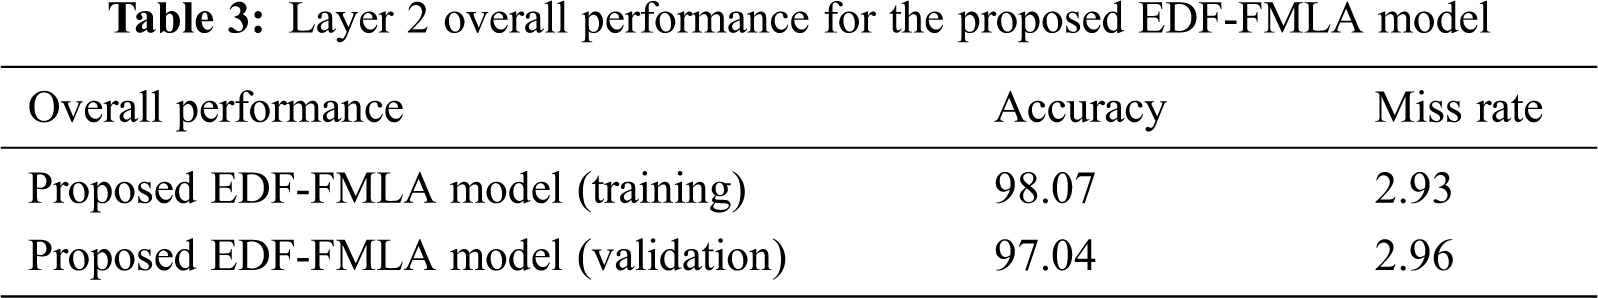
Tab. 3 lists the overall performance of the proposed EDF-FMLA model for the training and validation phases. The proposed EDF-FMLA model achieved 98.07 overall accuracy and a 2.93 miss rate in the training phase, and in the validation phase obtained 97.04 accuracy and a 2.96 miss rate. The proposed EDF-FMLA model layer 1 achieved 98.07 accuracy, which is better than the existing approaches. The proposed EDF-FMLA model also detects energy consumption from smart meters which achieve accuracy for validation 97.04 phase.
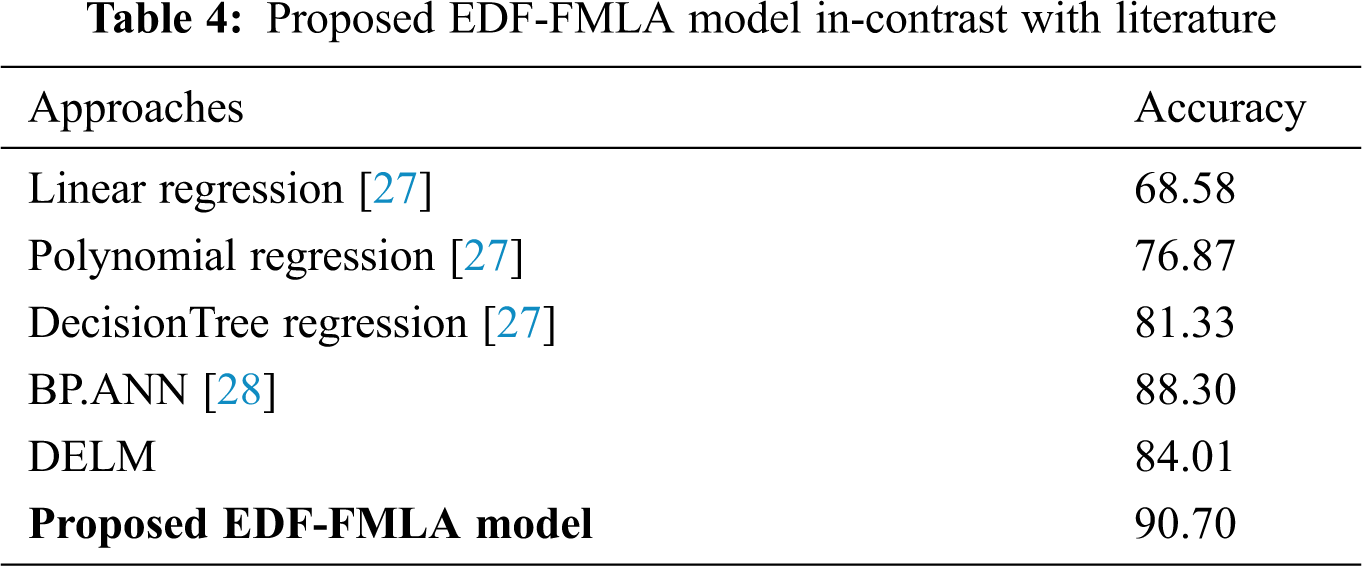
Tab. 4 represents a contrast between the state-of-the-art methods and the proposed EDF-FMLA model. The proposed EDF-FMLA layer 1 model achieved 97.04 accuracy for predicting energy consumption with a smart meter which is better than the existing approaches.
The usage of IoT-based Smart Meter in electric power consumption shows a significant role in helping users manage and control their electric power consumption. It produces smooth communication to build equitable electric power distribution for users and improved the entire electric system for providers. Machine learning predicting structures have been worked to apply the electric efficiency and response of progressive energy creation, transmission, and consumption. The proposed IoT-based smart meter uses deep extreme machine learning techniques to predict meter energy consumption. The proposed EDF-FMLA model controls the power consumption relying on and decision-based fusion. A deep extreme machine learning approach applied to feature-based data provided a better result. The proposed EDF-FMLA model achieved 90.70 accuracy for predicting energy consumption with a smart meter which is better than the existing approaches.
Acknowledgement: Thanks to our families & colleagues who supported us morally.
Funding Statement: The authors received no specific funding for this study.
Conflicts of Interest: The authors declare that they have no conflicts of interest to report regarding the present study.
1. S. Dey, A. Roy and S. Das, “Home automation using internet of thing,” in IEEE 7th Annual Ubiquitous Computing, Electronics & Mobile Communication Conf., United States, IEEE, vol. 3, pp. 1–6, 2016. [Google Scholar]
2. W. A. Jabbar, T. K. Kian, R. M. Ramli, S. N. Zubir, N. S. Zamrizaman et al., “Design and fabrication of smart home with internet of things enabled automation system,” IEEE Access, vol. 7, no. 3, pp. 144049–144074, 2019. [Google Scholar]
3. M. A. Kuwari, A. Ramadan, Y. Ismael, L. A. Sughair, A. Gastli et al., “Smart-home automation using iot-based sensing and monitoring platform,” in IEEE 12th Int. Conf. on Compatibility, Power Electronics and Power Engineering, Doha, Qatar, IEEE, vol. 2, pp. 1–6, 2018. [Google Scholar]
4. M. J. Keertikumar, M. Shubham and R. M. Banakar, “Evolution of lot in smart vehicles: An overview,” IEEE Computer Society, vol. 6, no. 1, pp. 804–809, 2015. [Google Scholar]
5. S. Seung-Chul, N. K. Kim, B. Lee, C. Chae and J. W. Chong, “A time synchronization technique for coap-based home automation systems,” IEEE Transactions on Consumer Electronics, vol. 62, no. 1, pp. 10–16, 2016. [Google Scholar]
6. E. Meer, “Smart grid estimated to reduce Co2 emission by up to 2.2 gigatonnes by 2050,” in IEEE 33rd Int. Telecommunications Energy Conf., USA, vol. 2, pp. 1–8, 2012. [Google Scholar]
7. S. M. Sulaiman, P. A. Jeyanthy and D. Devaraj, “Artificial neural network based day ahead load forecasting using smart meter data,” in Biennial Int. Conf. on Power and Energy Systems: Towards Sustainable Energy, Bengaluru, vol. 1, pp. 1–6, 2016. [Google Scholar]
8. T. Wilcox, N. Jin, P. Flach and J. Thumim, “A big data platform for smart meter data analytics,” Computers in Industry, vol. 105, no. 3, pp. 250–259, 2019. [Google Scholar]
9. V. Dehalwar, A. Kalam, M. L. Kolhe and A. Zayegh, “Electricity load forecasting for urban area using weather forecast information,” in IEEE Int. Conf. on Power and Renewable Energy, Shanghai, China, IEEE, vol. 7, pp. 355–359, 2016. [Google Scholar]
10. W. He, “Load forecasting via deep neural networks,” Procedia Computer Science, vol. 122, no. 3, pp. 308–314, 2017. [Google Scholar]
11. K. Gajowniezek and T. Zbkowski, “Short term electricity forecasting using individual smart meter data,” Procedia Computer Science, vol. 34, no. 2, pp. 489– 497, 2014. [Google Scholar]
12. T. Chen, “Forecasting the long-term electricity demand in Taiwan with a hybrid FLR and BPN approach,” International Journal of Fuzzy Systems, vol. 14, no. 3, pp. 361–371, 2012. [Google Scholar]
13. A. Zhukov, N. Tomin, D. Sidorov, D. Panasetsky and V. Spirayev, “A hybrid artificial neural network for voltage security evaluation in a power system,” in 5th Int. Youth Conf. on Energy, Pisa, Italy, IEEE, vol. 3, pp. 1–8, 2015. [Google Scholar]
14. G. A. Alkawsi, N. Ali, A. S. Mustafa, Y. Baashar, H. Alhussian et al., “A hybrid sem-neural network method for identifying acceptance factors of the smart meters in malaysia: Challenges perspective,” Alexandria Engineering Journal, vol. 10, no. 4, pp. 11–23, 2020. [Google Scholar]
15. J. Lee, Y. G. Sun, S. M. Lee, S. H. Kim, Y. Kim et al., “Implementation of smart meter applying power consumption prediction based on GRU model,” Journal of The Institute of Internet, Broadcasting and Communication, vol. 19, no. 4, pp. 93–99, 2019. [Google Scholar]
16. F. Z. Abera and V. Khedkar, “Machine learning approach electric appliance consumption and peak demand forecasting of residential customers using smart meter data,” Wireless Personal Communications, vol. 111, no. 1, pp. 64–82, 2020. [Google Scholar]
17. A. K. M. Masum, M. H. Saveed, M. K. A. Chy, T. M. Hasan and S. T. Reza, “Design and implementation of smart meter with load forecasting feature for residential customers,” in Int. Conf. on Electrical, Computer and Communication Engineering, Bangladesh, IEEE, pp. 1–6, 2019. [Google Scholar]
18. C. Sandels, M. Kempe, M. Brolin and A. Mannikoff, “Clustering residential customers with smart meter data using a data analytic approach-external validation and robustness analysis,” in 9th Int. Conf. on Power and Energy Systems, Perth, Australia, IEEE, pp. 1–6, 2019. [Google Scholar]
19. H. Liang, J. Ma, R. Sun and Y. Du, “A data-driven approach for targeting residential customers for energy efficiency programs,” IEEE Transactions on Smart Grid, vol. 11, no. 2, pp. 1229–1238, 2019. [Google Scholar]
20. S. Yan, K. Li, F. Wang, X. Ge, X. Lu et al., “Time-frequency feature combination based household characteristic identification approach using smart meter data,” IEEE Transactions on Industry Applications, vol. 46, no. 3, pp. 2241–2262, 2020. [Google Scholar]
21. S. Zhang, J. Rong and B. Wang, “A privacy protection scheme of smart meter for decentralized smart home environment based on consortium blockchain,” International Journal of Electrical Power & Energy Systems, vol. 121, no. 3, pp. 106–140, 2020. [Google Scholar]
22. A. Rehman, A. Athar, M. A. Khan, S. Abbas, A. Fatima et al., “Modelling, simulation, and optimization of diabetes type II prediction using deep extreme learning machine,” Journal of Ambient Intelligence and Smart Environments, vol. 12, no. 2, pp. 125–138, 2020. [Google Scholar]
23. S. Y. Siddiqui, S. A. Hussnain, A. H. Siddiqui, R. Ghufran, M. S. Khan et al., “Diagnosis of arthritis using adaptive hierarchical Mamdani fuzzy type-1 expert system,” EAI Endorsed Transactions on Scalable Information Systems, vol. 26, no. 7, pp. 1–16, 2020. [Google Scholar]
24. M. A. Khan, S. Abbas, A. Atta, A. Ditta, H. Alquhayz et al., “Intelligent cloud based heart disease prediction system empowered with supervised machine learning,” Computers, Materials & Continua, vol. 65, no. 1, pp. 139–151, 2020. [Google Scholar]
25. M. A. Khan, S. Abbas, K. Masood, M. A. Ghamidi, A. Rehman et al., “Intelligent forecasting model of COVID-19 novel coronavirus outbreak empowered with deep extreme learning machine,” Computers, Materials & Continua, vol. 64, no. 3, pp. 1329–1342, 2020. [Google Scholar]
26. S. Y. Siddiqui, M. A. Khan, S. Abbas and F. Khan, “Smart occupancy detection for road traffic parking using deep extreme learning machine,” Journal of King Saud University-Computer and Information Sciences, In Press, pp. 1–18, 2020. [Google Scholar]
27. F. Khan, M. A. Khan, S. Abbas, A. Athar, S. Y. Siddiqui et al., “Cloud-based breast cancer prediction empowered with soft computing approaches,” Journal of Healthcare Engineering, vol. 20, pp. 1–20, 2020. [Google Scholar]
28. A. K. Masum, M. K. A. Chy, M. T. Hasan, M. H. Sayeed and S. T. Reza, “Smart meter with load prediction feature for residential customers in Bangladesh,” in Int. Conf. on Energy and Power Engineering, Toronto, Canada, IEEE, pp. 1–6, 2019. [Google Scholar]
 | This work is licensed under a Creative Commons Attribution 4.0 International License, which permits unrestricted use, distribution, and reproduction in any medium, provided the original work is properly cited. |