DOI:10.32604/iasc.2022.018974
| Intelligent Automation & Soft Computing DOI:10.32604/iasc.2022.018974 | |
| Article |
Multi-Model Detection of Lung Cancer Using Unsupervised Diffusion Classification Algorithm
1Department of Computer Science and Engineering, KPR Institute of Engineering and Technology, Coimbatore, 641407, Tamilnadu, India
2Department of Computer Science and Engineering, St. Joseph’s Institute of Technology, Chennai, 600119, Tamilnadu, India
3Department of Medical Equipment Technology, College of Applied Medical Sciences, Majmaah University, Al Majmaah, 11952, Saudi Arabia
4Department of EEE, SRM Institute of Science and Technology, Chennai, 603203, India
*Corresponding Author: N. Jayanthi. Email: jayanthi.nkpr@gmail.com
Received: 28 March 2021; Accepted: 25 June 2021
Abstract: Lung cancer is a curable disease if detected early, and its mortality rate decreases with forwarding treatment measures. At first, an easy and accurate way to detect is by using image processing techniques on the cancer-affected images captured from the patients. This paper proposes a novel lung cancer detection method. Firstly, an adaptive median filter algorithm (AMF) is applied to preprocess those images for improving the quality of the affected area. Then, a supervised image edge detection algorithm (SIED) is presented to segment those images. Then, feature extraction is employed to extract the mean, standard deviation, energy, contrast, etc., of the cancer-affected area. Finally, an unsupervised diffusion classification (UDC) algorithm is explored to narrow down the affected areas. The proposed lung cancer detection method is implemented on two datasets obtained from standard hospital real-time values. The experiment results achieved superior performance in the detection of lung cancer, which demonstrates that our new model can contribute to the early detection of lung cancer.
Keywords: Diagnose lung cancer; future extraction; preprocessing; segmentation; UDC algorithm
Lung cancer is one of the most dangerous diseases afflicting people. It can typically be diagnosed using image processing techniques to quickly identify affected cancer areas, thereby decreasing decrease its development in time. Several factors may influence a rapid diagnosis of lung cancer, including tumor growth, late mortality due to uncertain efficacy, lack of specific screening, and rapid disease progression symptoms. The disease diagnosis depends, as well, on its performance dates. In the past few decades, the accuracy of these values has been declining, and consequently slowing down the pace of the fight against lung cancer. For example, until recently, most lung cancers are being treated more or less as the same disease, without any distinction to their variability.
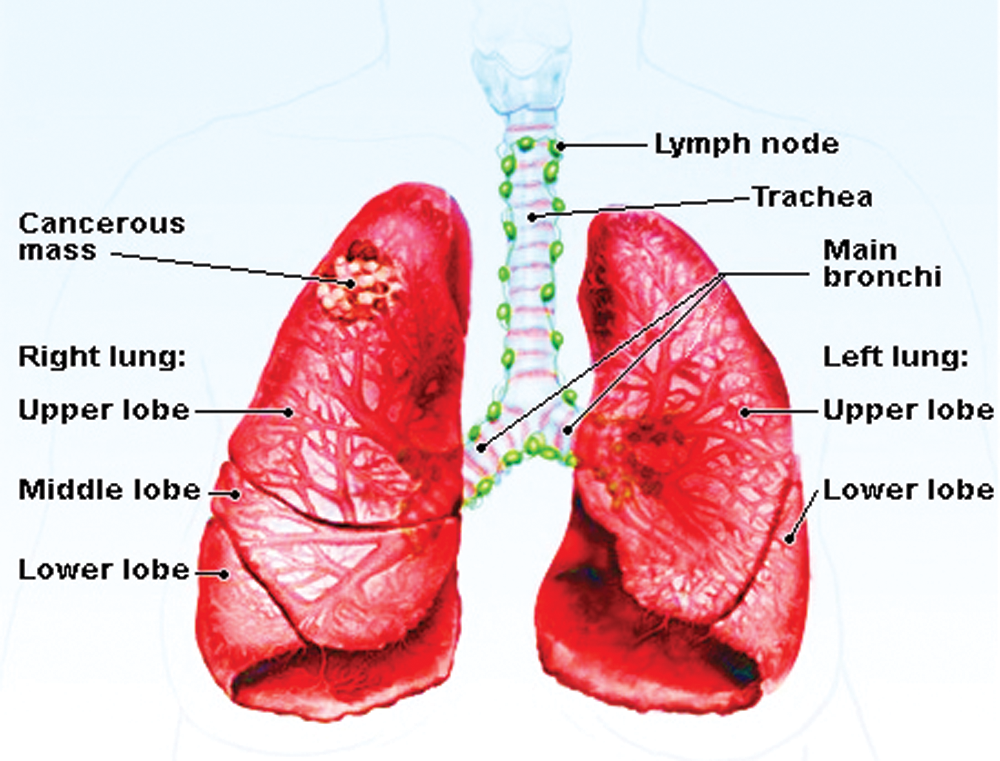
Figure 1: A basic lung cancer image
Fig. 1 shows the example of the lung cancer image, image processing is used to analyze cancer affected in this proposed system. The respiratory system is used for breathing, consisting of tissues, a network of organs, blood vessels, and airways. It has been considered that common cancers are familiar and resist controlling the disease. Meanwhile, they give rise to modification, which may require different treatment methods in the medical field. A number of patients are used to check the disease’s level and overcome the problem to reduce and achieve a better performance value. Hence, the proposed model ends up with various tests that easily process the image to identify affected areas.
The methods presented here focus on improving the image quality to enhance the appearance of early signs of cancer. Since the time coefficient imaging in the clinical field is generally utilized in the beginning phases, it is significant to the therapy of cellular breakdown in the lungs by recognizing malignancy cells. The lung image enriches the information of nature image data, and its nature is motivated by preprocessing. Normally, there are mainly two image enhancement techniques: one is the spatial-domain processing method, and the other is the frequency-domain processing method. The former is to directly process the pixels of the image, which is basically based on the grayscale mapping transformation. The latter is to perform operations on the transformed coefficients in a certain transform domain of the image and then transform it to the original spatial domain to obtain an enhanced image. In this paper, an unsupervised diffusion classification (UDC) technology is proposed, which is very simple to understand and useful for real-time implementation. Using UDC in image classification can improve image linearity and increase accuracy.
The main contributions of this paper are as follows.
1. To easily identify affected cancer region based on the unsupervised diffusion classification (UDC) algorithm;
2. The time consumption and loss are less to identify the affected region.
The rest part of this paper is organized as follows: Section 2 introduces related work. Section 3 describes the proposed method in detail. Section 4 presents the experimental results and discussions. Finally, Section 5 draws the conclusion.
Cancer is an essential disease that causes increased mortality levels worldwide. Neurotic determination and the arranging of tumor tissue tests are giving the promise to treat illness, but it does not give accurate affected regions [1]. Lung cancer is caused by the uncontrolled growth of aberrant cells in the human body and healthy lung tissue development [2]. Early detection of lung cancer is important for patient survival and quality of life [3]. Besides, detailed anatomical information is of absolute importance before the actual process of pulmonary cavity amputation surgery planning. From Fig. 1, we can see that a normal human lung has five different anatomical partitions, called lobes. There is a crack at the border of each lung. Lungs typically include left and right parts, with upper, middle, and lower lobes and isolation [4]. The lung segmentation depends on estimated precision and processing time, and the most popular lung segmentation method is utilized in several image processing methods [5].
Image processing of lung cancer in the clinical field is broadly utilized in the beginning phases. Patients’ lung detection needs to recognize disease cells due to the significant time of their therapies and the impact of cellular breakdowns in the lungs [6]. To achieve accurate detection performance, lungs must be extracted based on anatomical perspectives. It should be noted that all external and internal pulmonary vessels are removed in addition to the lobe bronchi. Further, motion assist of lung morphology is extracted from binary images [7]. The valve function of quantitative evaluation automatically develops image registration between lung and image segmentation by combining a series of lobe imaging tools [8].
The method based on local invariant features shows excellent results of this task. Local features’ values directly differ from their properties and the natural pattern of the associated images [9]. Images of irregular breathing and heartbeats are twisted and presented at different noisy frequencies [10]. Therefore, the purpose of preprocessing is to enhance images and provide an automatic image processing technique that includes a human observer’s image to enter the starting phase of image information [11]. In preprocessing, the input CT images are processed by improving the image quality. In this stage, several actions are performed on the model data is used to highlighted images [12]. Feature extraction is an important step to determine normal or abnormal images, which is the basis of the classification process [13]. The extracted tumor features are the average length of perimeter, area, and eccentricity, which can be completely determined if there is a binarization of a cancer tumor. Meanwhile, if there is a malignancy, the cancer stage can also be identified [14].
Image enhancement based on Gabor function is simultaneous (and optimal) to local log with excellent spatial and frequency domains and local multi-scale decomposition [15]. As mentioned above, a radiologist can become a decision-maker to identify abnormalities from original CT images. The center and diameter of clinical cancer data are used as the initial segmentation seed for our computer-aided design (CAD) program [16]. The concepts of segmentation and detection are, however, not equivalent. The major and minor details data can be incomplete, while at the same time, other accessory cracks can be visible [17]. Therefore, extracting basic features of nodules requires many heuristic steps [18]. The calculation is utilized to improve the lung parenchyma’s applied slope image to distinguish the four associated networks around every pixel of the object with the least angle estimation [19]. Also, the alignment of gradient direction calculation on high contrast edges is applied to determine the standard image plane and 3D image gradient vector [20]. Elastic registration using full scan and cracking is refined by mutual information registration programs such as a similarity measure [21].
Globally, lung cancer is one of the most serious diseases because its identification is complicated in the medical field. Lung cancer scan is currently not advocated, especially for the high-risk population. The most significant use is identifying central tumors and cancers. In this paper, imaging techniques are employed to predict the early detection of lung disease disorders. Firstly, the Adaptive Median Filter algorithm is applied to preprocess the input images. Then, the Supervised Image Edge Detection is exploited to distinguishing unconventional image variety. Finally, the unsupervised diffusion classification (UDC) is proposed to classify this system’s images. In this model, the feature detection and accuracy analysis are taken for the lung cancer image-based UDC technique.
Fig. 2 illustrates the framework of the proposed strategy, which consists of seven stages: input, preprocessing, segmentation, feature extraction, UDC, classification, and output.
Image preprocessing is a significant start in the diagnosis of lung symptoms, which is conducted to improve the overall performance of lung cancer classification. In our preprocessing, the adaptive median filter is mainly utilized to reduce the random noise of the input image with an excellent noise reduction function. After preprocessing, the image quality is improved compared to the original image.
The median filter method is a nonlinear smoothing technique, which sets the gray value of each pixel to the median of the gray values of all pixels in a certain neighborhood window of that point. Adaptive median filters have been widely used in image enhancement, feature extraction, and pattern medical multistage expression.
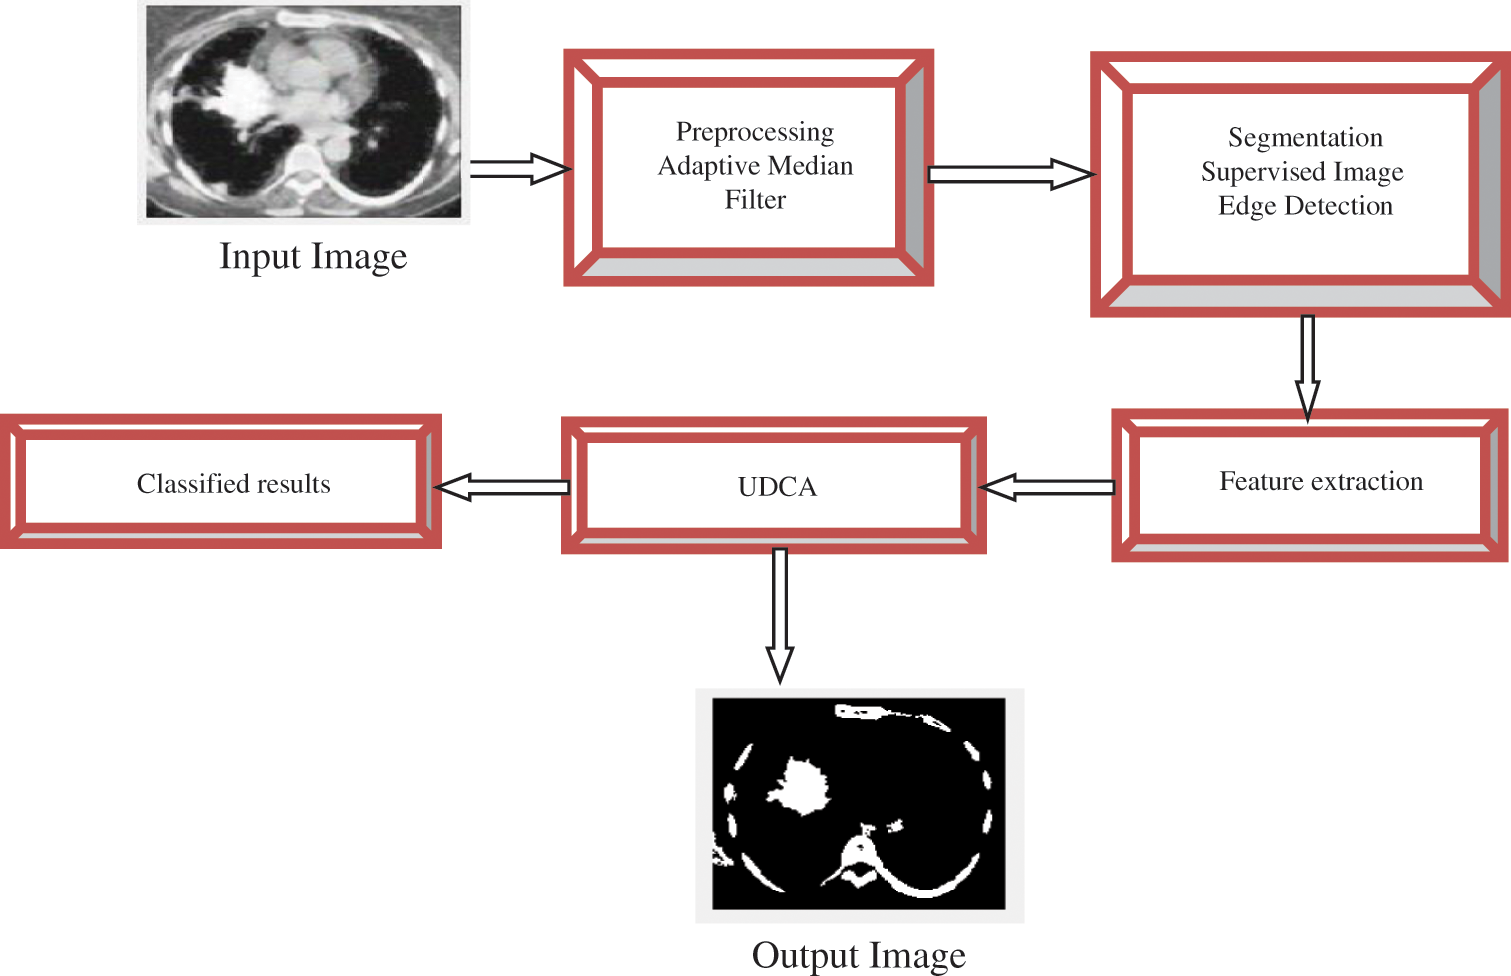
Figure 2: The framework of lung cancer detection
Adaptive Median Filter
Step 1: Select the image size and process the value of the pixel
Step 2: Analyze the ascending order of the pixel value in the image and denote the pixel value by median value
Step 3: Sort the minimum pixel value
Step 4: If the range of
Step 5: If the condition of Step 4 is not met, the neighboring pixel crosses to result in the difference vector VD, which can find the largest difference in the image V0 corresponding to the processed pixel to enhance the output image.
where,
V0 = sorted vector
VD = difference vector
Step 6: End.
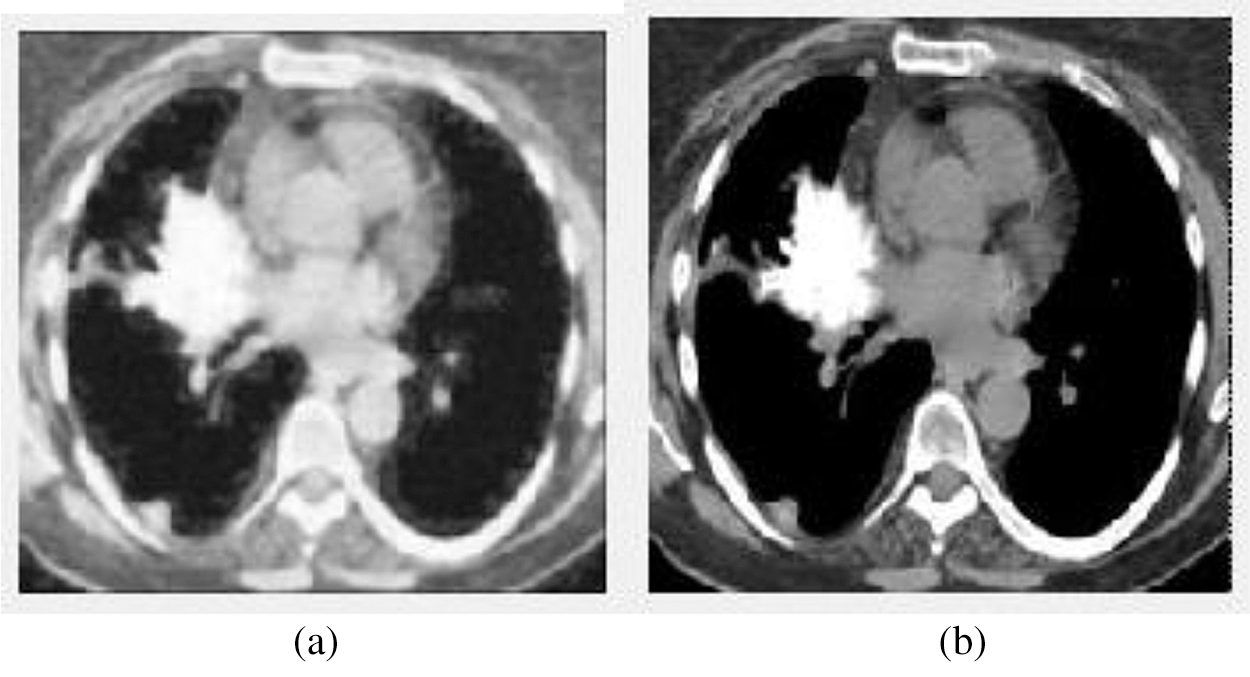
Figure 3: The input and output of the image preprocessing stage. (a) The input image (b) The preprocessed output image
We can see from the above Fig. 3, Fig. 3a shows the input image, and Fig. 3b displays the preprocessed image using the Adaptive Median Filter. The preprocessed image is enhanced the image quality and is fed to the next stage—the segmentation process.
Image segmentation is an essential process of extracting meaningful features and areas from an image, which is a hotspot in the image field. These features can be the original characteristics of the image, such as gray pixel values, colors, reflection characteristics, and textures. The algorithm’s main idea is to cluster pixels, i.e., the image is divided into many blocks depending on the relationships between adjacent pixels. In this stage, the correlation between pixels can be explained by the distance.
Supervised Image Edge Detection Algorithm
Step 1: Obtain the preprocessed image.
Step 2: The threshold value T is utilized.
If (p, q) > T, g (p, q) = 0;
If (p, q) ≤ T, threshold value.
where
Step 3: If the threshold T value is measured with the input variable. Depending on the local threshold or neighborhood, if T (
Step 4: The various process of the filter compared to the threshold value
If g (
If T1 < f (
If g (
where,
T = Threshold value
Step 5: End.
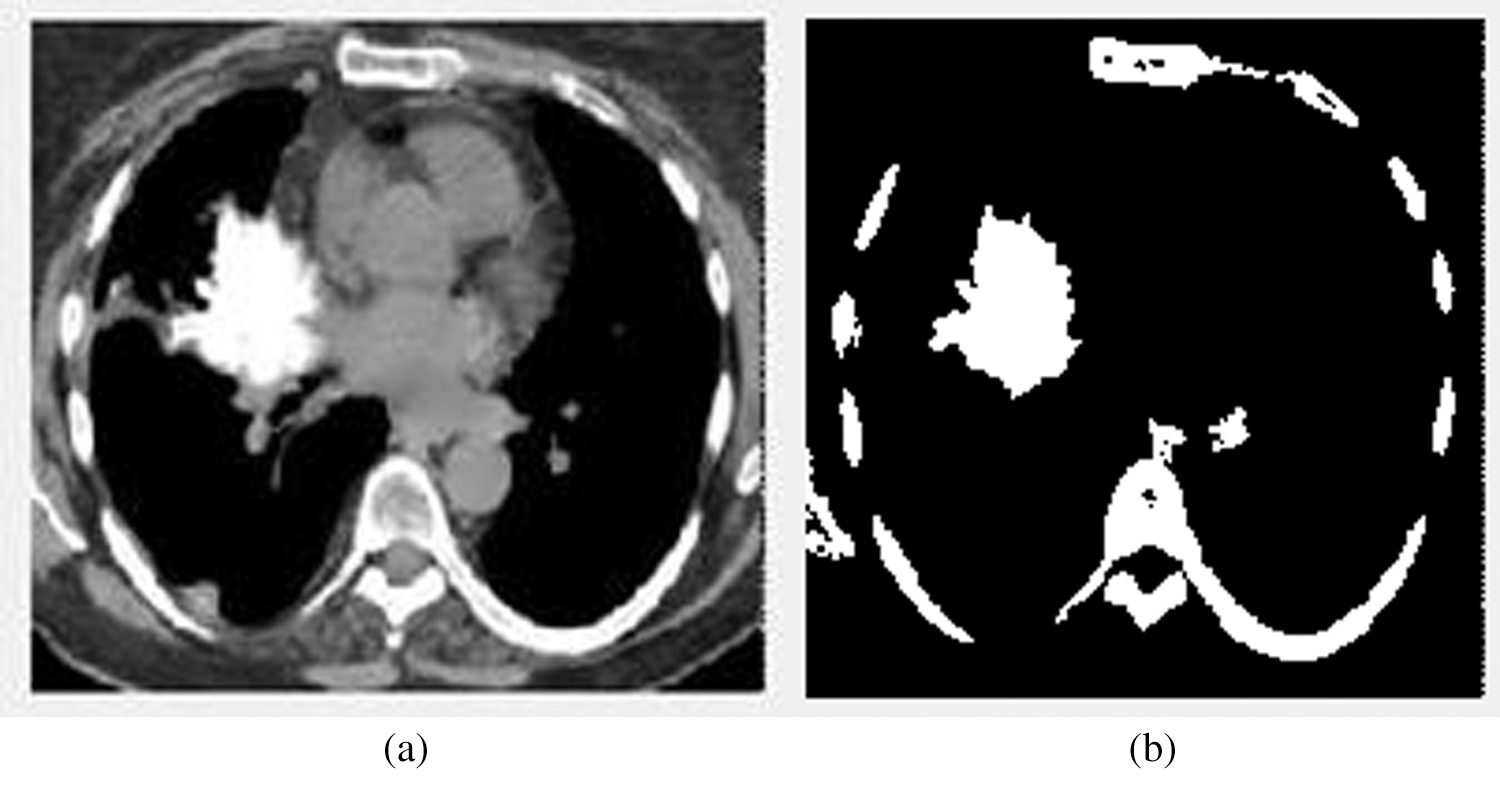
Figure 4: The input and output images of the segmentation stage. (a) The image before segmentation (b) The image after segmentation
Fig. 4 illustrates the input and output images of the segmentation stage. Fig. 4b denotes the affected area.
An invariant feature of the image is extracted, depending on the selected condition and the constant function’s value. During image feature extraction, it finds the reliable and robust shape, appearance, and values of any parameters that can control the contrast, as long as the shape image is in the presence of light and dark. In feature extraction, the adaptive median filter can effectively affect the liver and distinguish it from normal organs. Thus,
where the constant variable is the first term and the optimal value of the image. And
In general, it is useful for each gray level in the normalized template image. Given the pixel (x, y) at the position corresponding to the normal distribution, then the max can be expressed as:
where,
T = pixels template
This model has been considered at several levels and presents different image details at different scales. However, as a constant, the adaptive median filter can adequately and directly account for uncomplicated lung problems.
The mean filter operation is mainly based on arithmetic averaging and variation of Gaussian noise from video signals.
where M and N are the image dimension and the total number of pixels, respectively.
Standard deviation is the most generally utilized method to calculate the changeability or decent variety. As far as image preprocessing, it indicates the amount of variation from the average (mean or expected value). Thus, the standard deviation
where Σ is the sum function, pis the input image,
Energy is used to measure the smoothness of the image. The energy of the pixel extends between 0 to 1. Consistency is transferred pixels, and the energy can be expressed as:
where
The less smooth the area, the more consistent the dispersion.
Black and white contrast and the polarization distribution are used to capture the image’s grayscale dynamic range. Therefore, The contrast measure is defined as:
where
3.4 Unsupervised Diffusion Classification (UDC)
The proposed unsupervised diffusion classification (UDC) is a more straightforward learning calculation for separating arrangement maps into various element vector planes by nonlinear planning, normally various classes by high-dimensional planes. It works out two sorts of characterization of the hyperplane.
Unsupervised Diffusion Classification Algorithm Steps
Step 1: Initialize input data.
Step 2: Define the value of pixel P(x, y), partial area B, and all the input data pixels.
Step 3: Calculate the maximum pixel vector near each erosion and dilation B’s expanded configuration.
where P is the pixel value.
Step 4: Update the image at each location (
Step 5: If the pixel is set to the maximum, then loop Step 5 and let I + 1; Otherwise, using
Step 6: A unique spectral set of pixels with a higher correlation in the form vectors is used to calculate the pixel vector pair of pixels P.
Step 7: End.
Unsupervised diffusion classification (UDC) is originally designed for binary classification with the sum of N (N − 1)/2 categories. Carriers may be divided into a maximum number of values of each particular type.
The detection of the affected cancer region in the lungs with the help of the image processing technique is based on the proposed UDC technique. The proposed unsupervised diffusion classification (UDC) performs superior by accomplishing exactness, affectability, and explicitness when contrasted with another ordinary classifier. Our experiment is conducted on MATLAB 2017a, which is one of the most widely used programs. Particular activities and imaginative conditions to execute the calculation are broken down, as shown in Fig. 5. Fig. 5 shows the process of image preprocessing, segmentation, feature extraction, and accuracy. This GUI shows 90% of accuracy by using the proposed UDC technique.
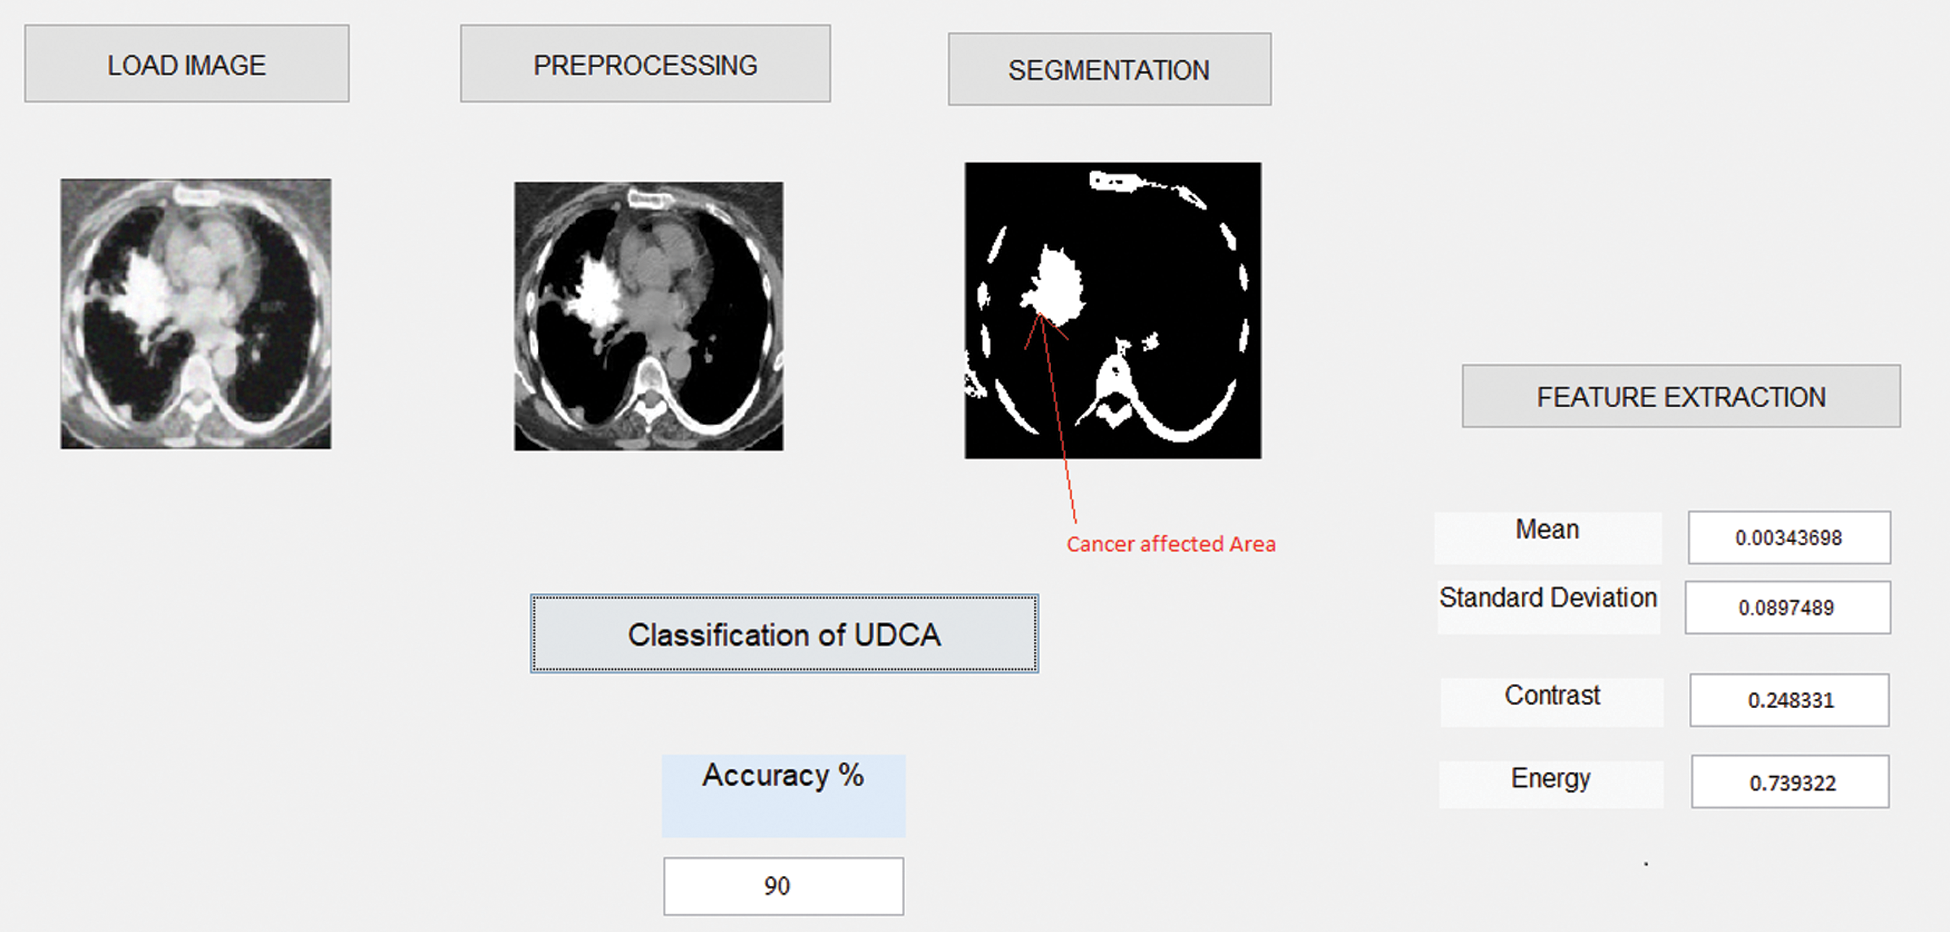
Figure 5: The screenshot of the proposed system
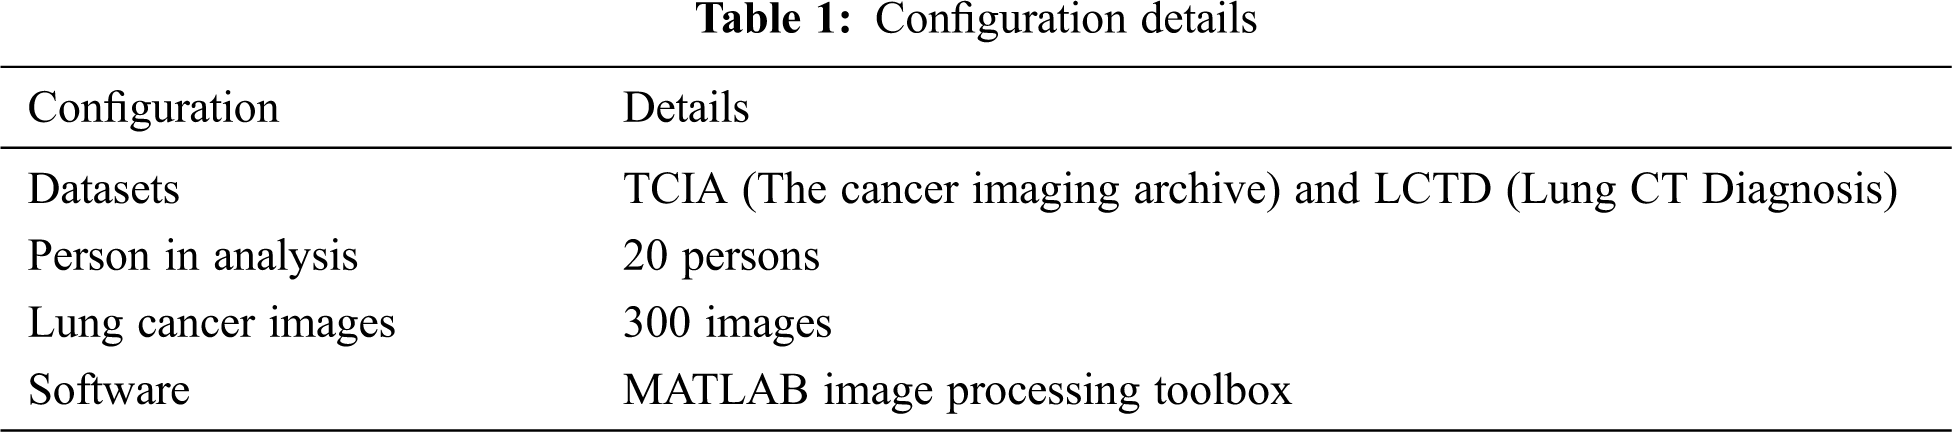
Tab. 1 shows the configuration details used in our experiment, including datasets, persons in analysis, lung cancer images, and the software.
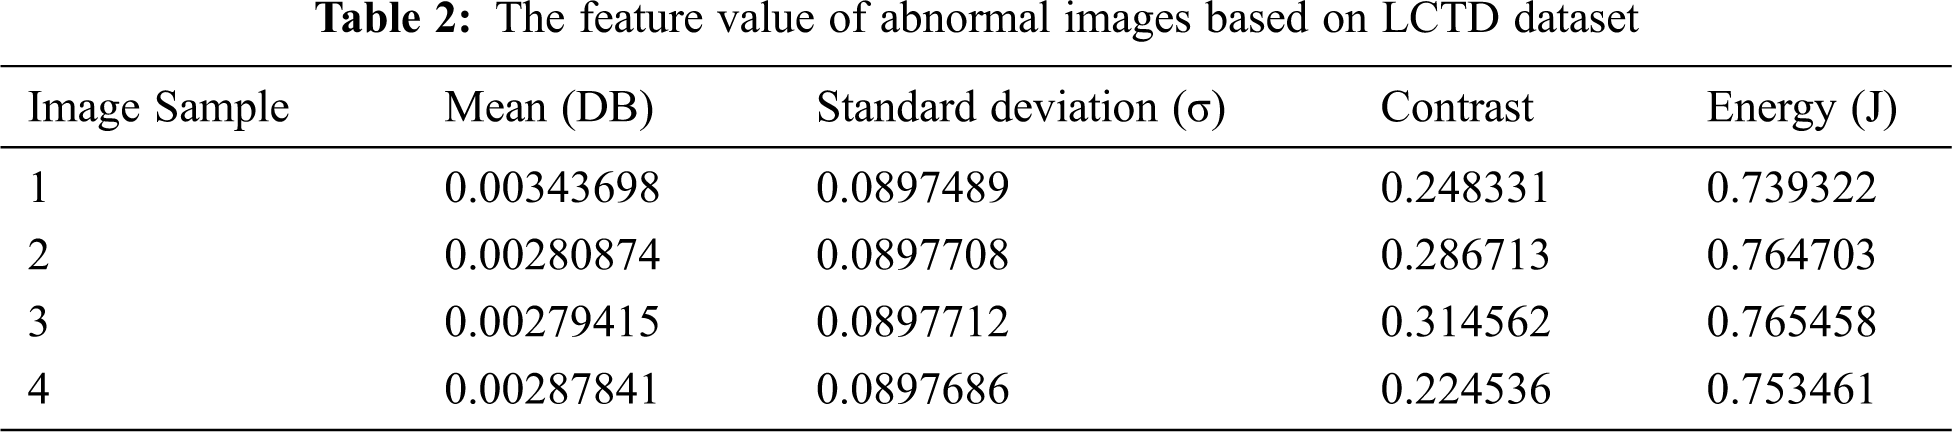
Tab. 2 illustrates the abnormal image feature values analysis of the LCTD dataset.
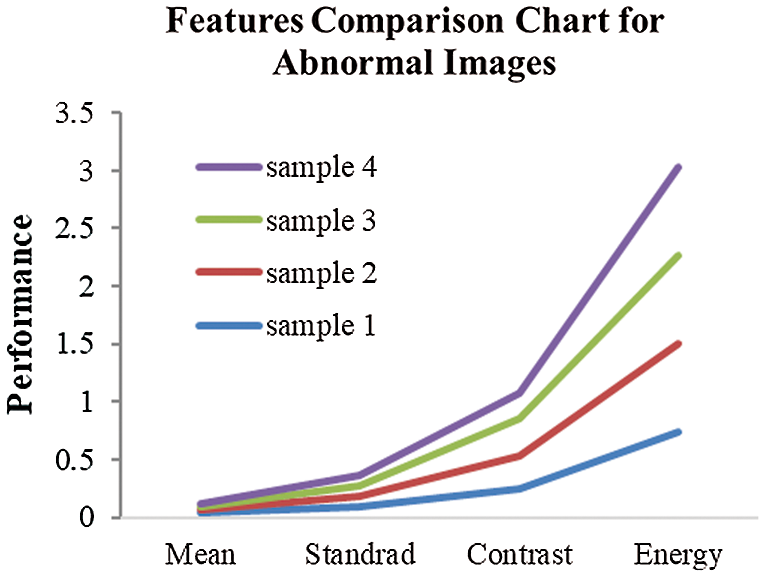
Figure 6: Image feature value comparison
Fig. 6 displays the different image features via the proposed unsupervised diffusion classification (UDC) method.
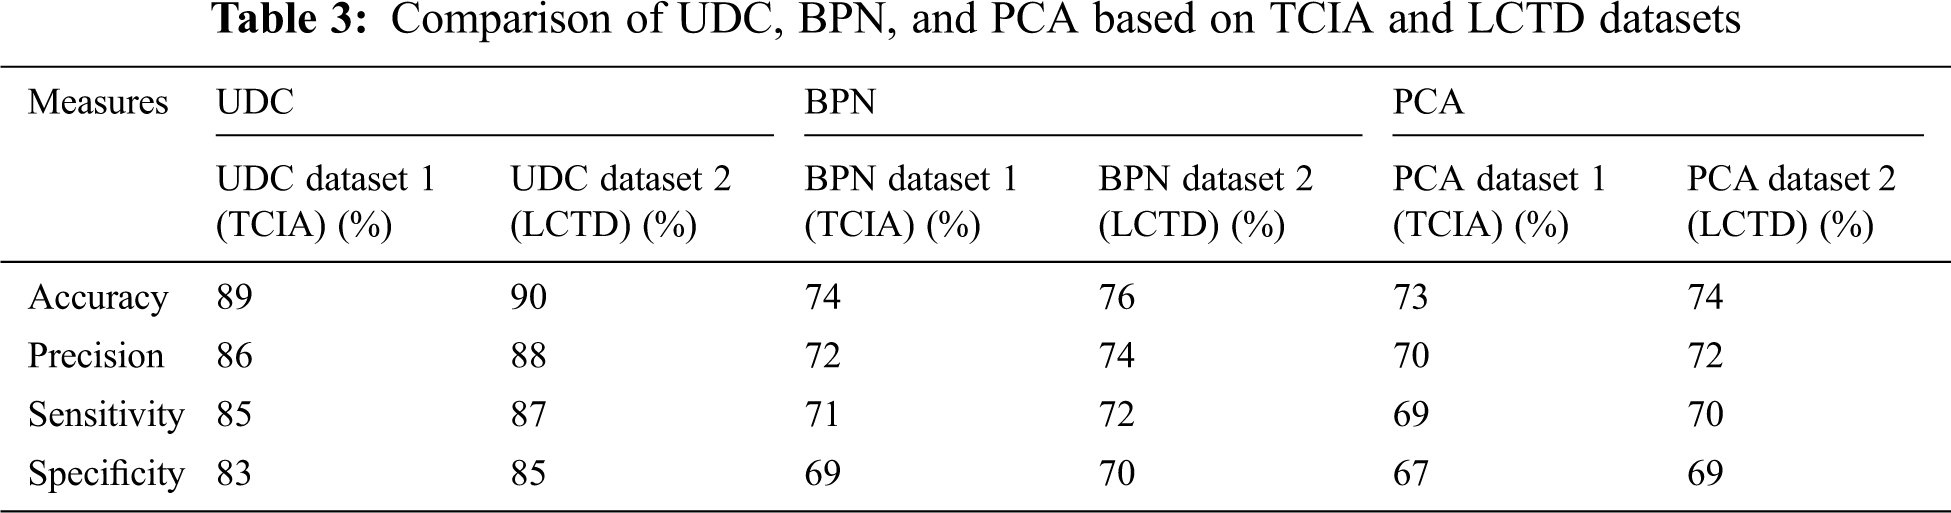
Tab. 3 shows the comparison of the different methods UDC, back propagation network (BPN), and principal component analysis (PCA), and the proposed unsupervised diffusion classification (UDC) method achieves an accuracy of 90%.
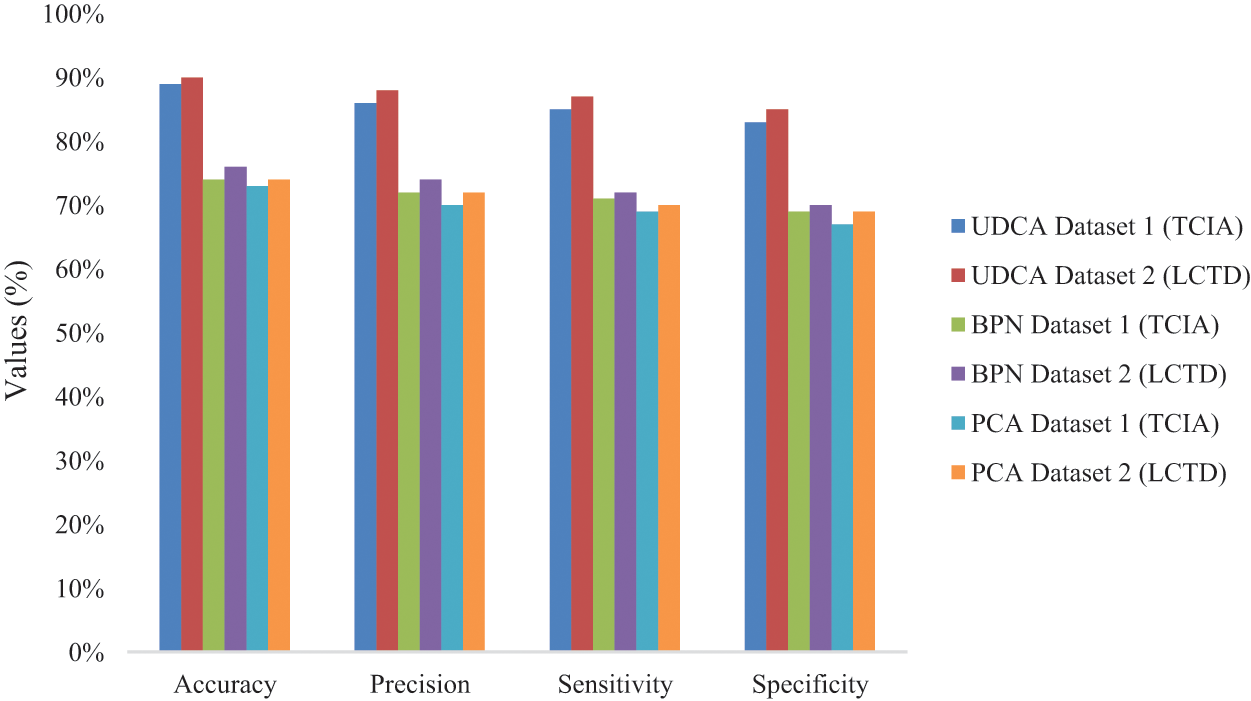
Figure 7: Values of four metrics’ performance
Fig. 7 illustrates the performance of four evaluation metrics among UDC, BPN, and PCA on TCIA and LCTD datasets.
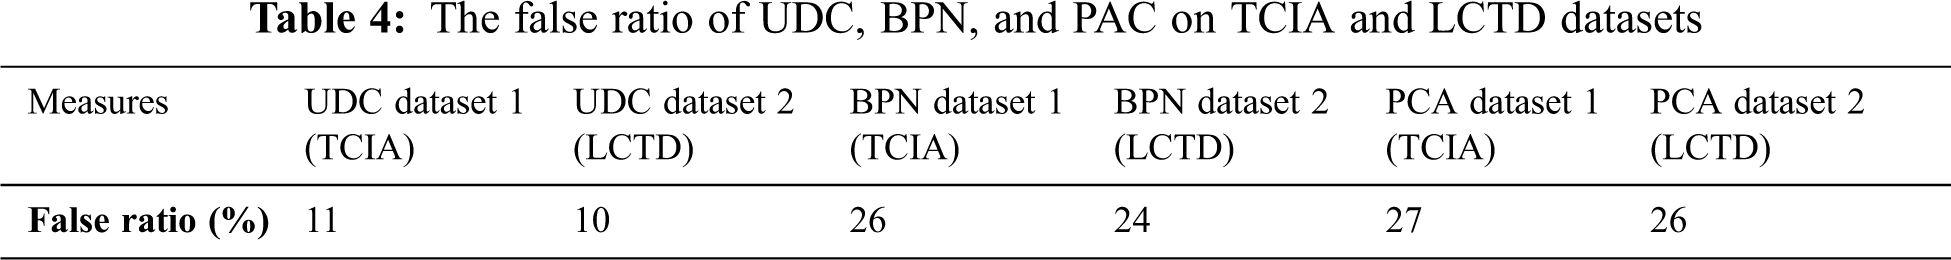
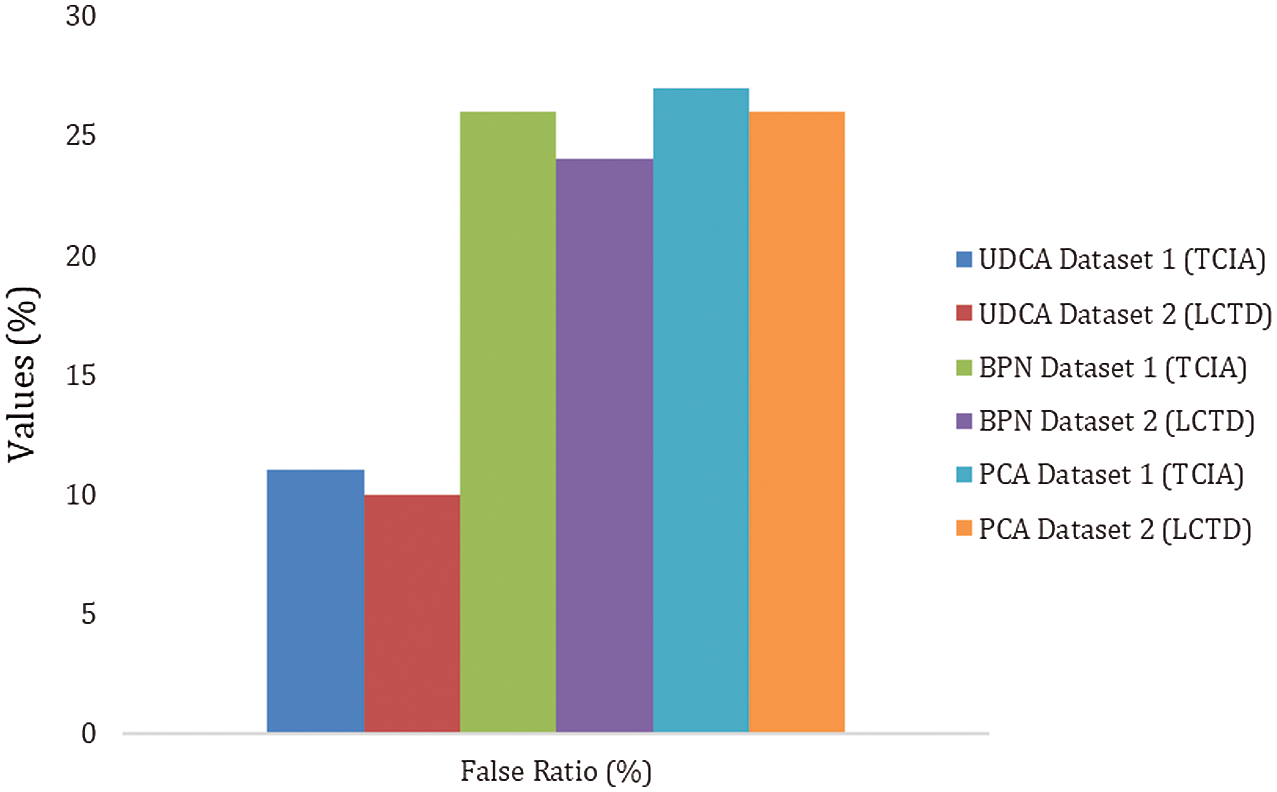
Figure 8: The false ratio of UDC, BPN, and PAC on TCIA and LCTD datasets
Fig. 8 and Tab. 4 show the false ratio comparison of the existing method and the proposed method on two datasets. It is clear that the unsupervised diffusion classification (UDC) method has the best performance with a very less false ratio.
Lung disease of the respiratory system may hide details. Generally, clinicians rely on automatic classification schemes rather than estimating direct observations of respiratory parameters, which is missing from previous studies and is difficult to understand by providing a mechanism to explain menstruation. In this paper, the proposed model shows the patient’s health conditions with the control of lung cancer. This model considers the performance parameters, which can be of great importance in the practical diagnosis of the input image. The exploratory outcomes demonstrate that the parameters, such as mean, standard deviation, contrast, energy, are promising for identifying lung cancer. In this model, the comparative analysis confirms the proposed unsupervised diffusion classification (UDC) is superior to existing methods, with the accuracy of 90%, the sensitivity of 87%, the precision of 88%, and specificity of 85%, respectively.
Acknowledgement: We would like to thank TopEdit (https://www.topeditsci.com) for the English language editing of this manuscript.
Funding Statement: The authors received no specific funding for this study.
Conflicts of Interest: The authors declare that they have no conflicts of interest to report regarding the present study.
1. T. Jayasankar, N. B. Prakash and G. R. Hemalakshmi, “Big data-based breast cancer prediction using kernel support vector machine with the gray wolf optimization algorithm,” in Applications of Big Data in Healthcare, Academic Press, pp. 173–194, 2021. [Google Scholar]
2. M. Anuradha, T. Jayasankar and N. B. Prakash, “IoT enabled cancer prediction system to enhance the authentication and security using cloud computing,” Microprocessor and Microsystems, vol. 80, pp. 1–14, 2021. [Google Scholar]
3. R. Sammouda, “Sammouda, segmentation and analysis of CT chest images for early lung cancer detection,” in Proc. GSCIT, Sousse, Tunisia, pp. 5090–2659, 2017. [Google Scholar]
4. Q. Wei, Y. Hu, G. Gelf and J. H. MacGregor, “Segmentation of lung lobes in high-resolution isotropic CT images,” IEEE Transactions on Biomedical Engineering, vol. 56, no. 5, pp. 1383–1393, 2009. [Google Scholar]
5. E. Hosseini, M. Jacek and K. Zurada, “3D lung segmentation based on incremental constrained nonnegative matrix factorization,” IEEE Transactions Biomedical Engineering, vol. 65, no. 5, pp. 18–9294, 2015. [Google Scholar]
6. S. Avinash and S. Senthilkumar, “Analysis and comparison of image enhancement techniques for the prediction of lung cancer,” in Proc. RTEICT, Bangalore, India, pp. 5090–3704, 2017. [Google Scholar]
7. K. Punithavathy and M. M. Ramya, “Analysis of statistical texture features for automatic lung cancer detection in PET/CT images,” in Proc. RACE, Chennai, India, pp. 81–94, 2015. [Google Scholar]
8. H. Haneishi, H. Ue, N. Takita, H. Toyama, T. Miyamoto et al., “Lung image segmentation and registration for quantitative image analysis,” in Proc. IEEE NSSCR, San Diego, USA, vol. 3, pp. 1390–1393, 2002. [Google Scholar]
9. H. Madzin and R. Zainuddin, “Feature extraction and image matching of 3d lung cancer cell image,” in Proc. ICSCPR, Malacca, Malaysia, pp. 7695–3879, 2009. [Google Scholar]
10. J. Wei and G. Li, “Automated lung segmentation and image quality assessment for clinical 3-D/4-D-computed tomography,” IEEE Journal of Translational Engineering in Health Medicine, vol. 2, no. 6, pp. 2168–2372, 2015. [Google Scholar]
11. M. S. Al-Tarawneh, “Lung cancer detection using image processing techniques,” Leonardo Electronic Journal of Practices and Technologies, vol. 11, no. 21, pp. 147–158, 2012. [Google Scholar]
12. A. S. Oliver, M. Anuratha, M. J. Justus, K. Bellam and T. Jayasankar, “An efficient coding network-based feature extraction with support vector machine-based classification model for CT lung images,” Journal of Medical Imaging and Health Informatics, vol. 10, no. 11, pp. 2628–2633, 2020. [Google Scholar]
13. A. Vijay and K. Gajdhane, “Detection of lung cancer stages on CT scan images by using various image processing techniques,” Journal of Computer Engineering, vol. 16, pp. 28–35, 2014. [Google Scholar]
14. S. S. Kanitkar, N. D. Thombare and S. S. Lokhande, “Detection of lung cancer using marker-controlled watershed transform,” in Proc. ICPC, Pune, India, pp. 1–6, 2015. [Google Scholar]
15. H. Gujral and K. Deulkar, “A review of techniques for lung cancer detection,” International Journal of Current Engineering and Technology, vol. 5, pp. 2347–5161, 2015. [Google Scholar]
16. N. Emaminejad, W. Qian, Y. Guan, M. Tan, Y. Qiu et al., “Fusion of quantitative image and genomic biomarkers to improve prognosis assessment of early-stage lung cancer patients,” IEEE Transactions on Biomedical Engineering, vol. 63, no. 5, pp. 1034–1043, 2015. [Google Scholar]
17. I. Sluimer and A. Schilham, “Computer analysis of computed tomography scan of the lung: A survey,” IEEE Transactions on Medical Imaging, vol. 25, pp. 385–405, 2006. [Google Scholar]
18. A. A. Setio, F. Ciompi, G. Litjens, P. Gerke, C. Jacobs et al., “Pulmonary nodule detection in CT images: False positive reduction using multi-view convolutional networks,” IEEE Transactions on Medical Imaging, vol. 35, no. 5, pp. 1160–1169, 2016. [Google Scholar]
19. J. Song, C. Yang, C. Yang, L. Fan, K. Wang et al., “Lung lesion extraction using a toboggan based growing automatic segmentation approach,” IEEE Transactions on Medical Imaging, vol. 35, no. 1, pp. 337–353, 2015. [Google Scholar]
20. F. Beaulieu and D. Rubin, “Surface normal of the overlap a computer-aided detection algorithm with the application of lung nodules in helical CT,” IEEE Transactions on Medical Imaging, vol. 23, pp. 661–675, 2004. [Google Scholar]
21. I. Sluimer and M. Prokop, “Toward automated segmentation of the pathological lung in CT,” IEEE Transactions on Medical Imaging, vol. 24, pp. 1025–1038, 2005. [Google Scholar]
 | This work is licensed under a Creative Commons Attribution 4.0 International License, which permits unrestricted use, distribution, and reproduction in any medium, provided the original work is properly cited. |