DOI:10.32604/iasc.2022.019778
| Intelligent Automation & Soft Computing DOI:10.32604/iasc.2022.019778 | |
| Article |
Detecting Lung Cancer Using Machine Learning Techniques
Department of Computer Science and Information System, College of Applied Sciences, Almaarefa University, Riyadh, 11597, Kingdom of Saudi Arabia
*Corresponding Author: Ashit Kumar Dutta. Email: drasheetkumar2002@gmail.com
Received: 25 April 2021; Accepted: 24 June 2021
Abstract: In recent days, Internet of Things (IoT) based image classification technique in the healthcare services is becoming a familiar concept that supports the process of detecting cancers with Computer Tomography (CT) images. Lung cancer is one of the perilous diseases that increases the mortality rate exponentially. IoT based image classifiers have the ability to detect cancer at an early stage and increases the life span of a patient. It supports oncologist to monitor and evaluate the health condition of a patient. Also, it can decipher cancer risk marker and act upon them. The process of feature extraction and selection from CT images plays a key role in identifying cancer hot spots. Convolutional Neural Network (CNN) is one of the efficient feature extraction techniques that improves the performance of image classifier by reducing the entropy of image data sets. A Random Forest (RF) classifier is a machine learning technique that can improve its efficiency with the support of CNN. This paper presents an RF classifier with CNN based technique to improve the percentage of accuracy in detecting cancer hot spots with CT images. The experimentation of the proposed approach is based on three dimensions: Feature extraction, selection, and prediction of cancer hot spots. To evaluate the performance of the proposed approach, benchmark image repositories which consists of 3954 images and 50 low dose whole lungs CT scan images are employed. The proposed method achieves an effective result on all test images under different aspects. Consequently, it obtains an average accuracy of 93.25% and an F-measure of 91.75% which is higher than the other methods, comparatively.
Keywords: Classification; feature extraction; IoT; lung cancer; random forest
The exponential growth of the Internet of Things (IoT) in healthcare services is recently leading to new research ideas in the field of Machine Learning (ML) techniques [1,2]. People-centered healthcare environment demands a IoT based technique to monitor everyone in a society [3,4]. To necessitate such an environment requires expensive tools and techniques, which may not be affordable by a common person. Therefore, it is necessary to provide an effective healthcare model at affordable cost. On the one hand, Lung Cancer (LC) is one of the dangerous diseases that increases the rate of mortality [5]. On the other hand, the I o T based cloud data model can be employed to assist healthcare service providers to monitor the health condition of a person who is diagnosed with LC. The report [6] shows that every year, more than 1.2 million people are diagnosed with LC.
Researchers have found that early detection of LC can increase the survival rate of patients. However, the process of identifying the mutation or cancer hot spot is complex and difficult. The diagnosis model based on the IoT technique can be effective in detecting abnormalities at an early stage and provides a safe environment for the patient to recover quickly.
ML techniques can recognize and detect interesting patterns from complex datasets and effectively predict the possible outcomes of a type of cancer [6]. It supports developers to create models that link a variety of variables to a disease. Currently, image classifiers are employed in detecting abnormalities and the presence of cancer hot spots in the lungs with images of Computer Tomography (CT) [7,8]. The image classification algorithms are broadly classified into supervised and unsupervised algorithms [9–11]. Random Forest (RF) is one of the supervised learning algorithms. It is a set of decision trees that has the potential to iterate itself for producing optimal results [12]. Generally, it is employed in varieties of applications such as Anomaly Detection, Natural Language Processing, and Text Mining. The accuracy of RF depends on the features extracted from the data set. The entropy of the data set plays a vital role in improving the performance of an RF classifier. The RF classifier uses the feature randomness of images and builds a tree for each feature thereby producing an uncorrelated forest.
Convolution Neural Network (CNN) is an Artificial Intelligence (AI) technique which takes an image as an input and extracts unique features [13–16]. In addition, AI approachces are broadly for detecting the hidden patterns of dangerous diseases from CT images. The structure of a CNN is similar to the pattern of Neurons in the human brain. A CNN can capture the spatial and temporal dependencies in an image by using features of an image and extract an individual layer in its network [17]. It intends to reduce the image into an easily understandable form without losing critical features. An image classifier can be built with the support of CNN for effective output. The RF classifier is a subset of the decision tree, which uses an ensemble learning technique [18–21]. It generates multiple trees depending on the number of data and integrates the outcome of all the trees. It handles non–linear parameters efficiently rather than the existing state–of–the art classifiers [22,23].
Some of the disadvantages of the RF classifier are as follows:
• It requires more computational power and resources [24–28].
• It takes decision based on most of the vote This needs longer training time.
To overcome the issues of the RF classifier, CNN is integrated with the RF to reduce the entropy of the data set and improve efficiency.
The contribution of this study is summarized as follows: The development of IoT based image classification techniques in healthcare services provides an opportunity to increase the survival rate of patients with LC. The technique extracts a detailed feature or accurate evidence to determine whether a patient has cancer or not. In this paper, we introduce a hybrid approach that combines CNN and RF classifiers for classifying LC images. A proper data refinery process is followed to reduce the entropy of the image data set and minimize the learning duration of the RF classifier.
In the remaining part of the paper, Section 2 presents the background with existing literature. The methodology for classifying the LC with CT images is explained in Section 3. The results of this study are validated in Sections 4 and 5 concludes the paper.
2 Research Background and Related Works
The common types of LC are Small-Cell LC (SCLC) and Non–Small–Cell LC (NSCLC). NSCLC differs from SCLC due to the appearance of tumor cells under a microscope. SCLC is about 15 percent of LC, while NSCLC is about 85 percent [1,2]. Detecting LC at an early stage improves the rate of survival from 15% to 50% [1,2]. ML-based image classification technique increases the survival rate by detecting cancer with CT images. The CT scan image that shows the 3D image of the lungs is one of the familiar evidences for detecting cancers [3]. The performance of existing detection techniques is not sufficient to provide an optimal output to aid medical practitioners in making decisions on the health condition of a patient. Therefore, there is a demand for an efficient image classification technique to detect LC with CT images.
The building blocks of a CNN comprises of convolution, pooling, and fully connected layers. The convolution layer extracts the features from an image [17,18]. The pooling layer is an optional layer that reduces the spatial size of the image and reduces the number of parameters for computation in the network. The fully connected layer uses the extracted features from the convolution layer for generating outputs.
The RF classifier is based on the decision tree algorithms [21,22]. It applies a set of If–else statements to find a solution for a complex problem. Fig. 1 shows the decision-making process of an RF classifier. It represents the processes of feature extraction, intermediate decision, and final decision. A final decision is made concerning the set of intermediate decisions. A feature will be provided as an input to a decision tree and each tree takes an intermediate decision. Finally, a decision will be made using the intermediate decisions.
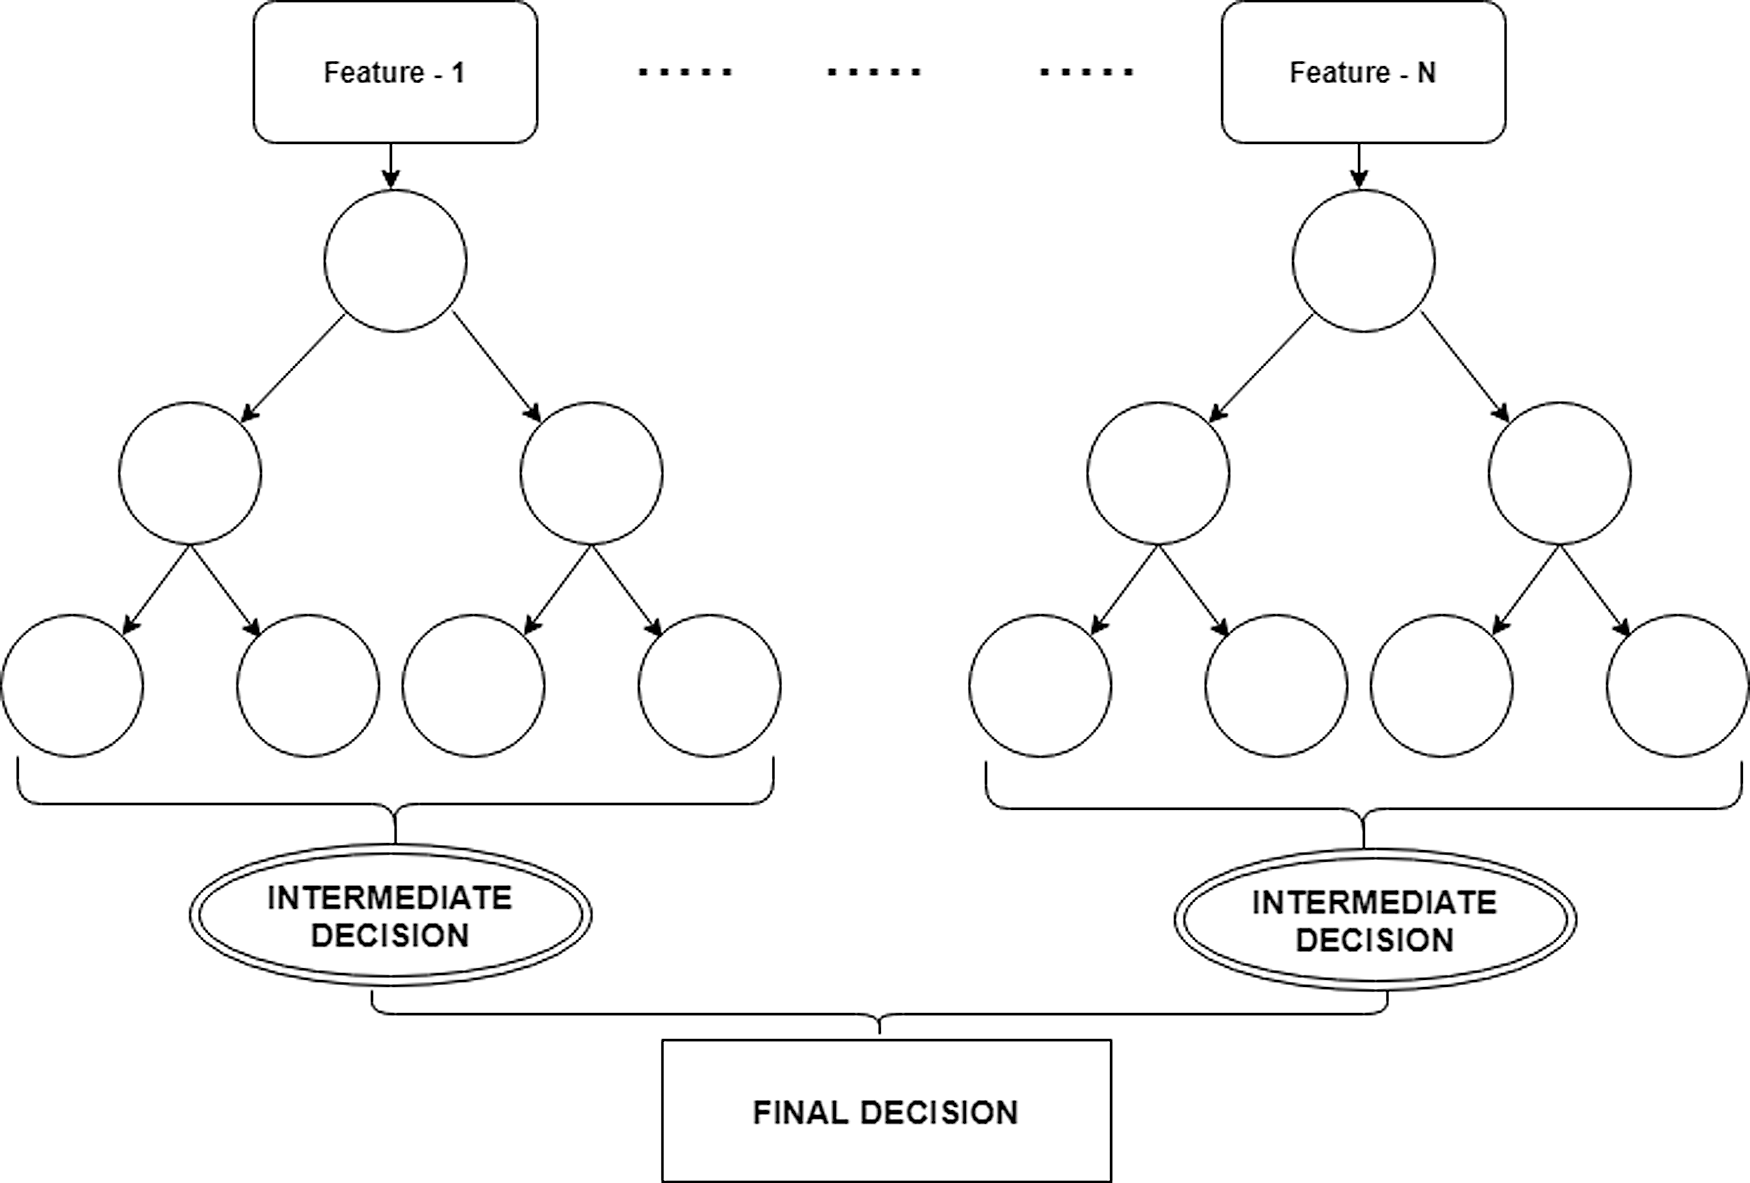
Figure 1: The decision-making process of a random forest classifier
The following part of this section discusses the existing image classification approaches based on supervised and unsupervised learning techniques. We have followed a systematic way in the process of collecting literature and research articles related to methods of detecting LC, based on ML techniques.
Wu et al. [1] proposed a method for diagnosing LC. In this research, probability analysis and decision making were adopted to identify the probability of NSCLC transitions. The treatment of NSCLC contains four stages of treatments: Stage I and II treatments adopts the drug approach for improving the lifetime of a patient. The number of treatments is increased in stages III and IV. NSCLC data of three hospitals from a period of 2011 to 2015 was used for the experimentation of this research. An effective parameter selection method is used to extract the effect of the correlation parameters. However, a classifier is required to process correlation parameters to generate a pattern from data.
Varadharajan et al. [2] developed a Naive Bayes (NB) and Artificial Neural Network (ANN) based technique to predict lung carcinoma with the support of back propagation neural network and decision tree classifiers. The two noteworthy sorts of LC are NSCLC and SCLC (or) oat cell disease. The data set is processed by a framework with a set of conditions. A variable called anticipated esteem is used as an indicator in the framework for predicting the health condition of a patient. The framework of this research cannot be implemented in IoT applications. Nonetheless, the concept can be used to design a ML approach for medical IoT.
Liu et al. [3] proposed an LC detection method in medical IoT. Deep reinforcement learning is used in this research to detect and diagnose LC. A framework with a supervised and unsupervised learning model is used for deep auto encoder and reinforcement learning. Deep reinforcement learning was employed to locate the position of a tumor in the images. The concept of action and reward is used to train the Q–Network and deep reinforcement learning method. The output of this research shows that learning technique is better than reinforcement learning approach.
Hart et al. [4] constructed an ANN–based method for predicting the risk of LC. The method is based on personal health information. The experimental results show that this method provides low-cost tools for predicting the risk associated with LC.
Agrawal et al. [5] developed a method based on association rule mining to identify hot spots in the LC image data set. The method has identified characteristics of the image segment using the value of the average survival rate. The association rule analysis is one of the greedy approaches for constructing the tree of rules in a depth-first fashion. It is applied to remove the redundant rules based on domain knowledge. The output of this study provides interesting insights into the survival rate of LC.
Muthazhagan et al. [6] contributed a survey of methods to identify LC in various aspects. According to this study, the survival rate of LC is only about 13 to 15 percentage. Identifying LC at an early stage is a challenging task for medical practitioners. Many research papers were published on identifying LC through computer-aided methods. The methods were broadly classified into data mining and medical image classification methods. Krishnaiah et al. [7] constructed a data mining classification technique to diagnose LC. In this study, the author examined the application of classification-based data mining techniques including Rule-based, NB, Decision Tree, and ANN on a large amount of healthcare data corpus. Dependency Augmented NB classifier and Naive Credal classifier were applied to pre-process data. The results of this study show that the supervised learning technique produces better output from CT images.
Dass et al. [8] proposed a classification technique to find LC sub types. They have constructed a decision tree using the J48 algorithm to predict LC for unknown classes. The output of this study has shown that the classifier has supported the medical practitioners by providing accurate differential treatment for LC using the knowledge of Biomarkers.
Valluru et al. [9] constructed a model to diagnose LC. In this model, the Support Vector Machine (S V M) is employed for classifying medical images. The technique has used the kernel function to change a non–linearity problem into a linearity problem for reducing the complexity of a mapping process. An enhanced Grey Wolf Optimization (GWO) with a Genetic Algorithm (GA) is applied in this model for extracting features from a medical image. The extracted features were classified by S V M. The output of the research showed that this model produces optimal accuracy in classifying medical images.
Zheng et al. [10] proposed a CNN system for aspect-based sentiment analysis. Authors combined the features of linguistic resources and gating mechanism for developing a sentiment analyzer. SEMEVAL 2014 restaurant data set was used in the research for evaluating the performance of the CNN application. The outcome of the study shows that the CNN system is more effective than the other approaches.
Zhou et al. [11] developed a hybrid deep learning Electrocardiogram (ECG) system by integrating CNN and Extreme Learning Machine (ELM). Authors used MIT - B I H database, which is a widely used data set that contains 84,615 items. The method has applied the RELU function for representing the feature map of the classifier. The ELM layer was used to classify one-dimensional vectors of the feature map transformation. The experimental results showed that the accuracy of the classifier is 97.5%, revealing its better generalization ability.
Zhang et al. [12] proposed a novel model for extracting spatial and semantic Convolutional features to track objects. They have constructed a Multi-scale pyramid correlation filter for each target and derived its features. OTB-2013, a benchmark data set was employed in the research for validating their method. The outcome of the study showed that the method has outperformed 12 state-of-the-art trackers.
Luo et al. [13] developed a Coverless Real-time image information hiding system using an image block-matching and CNN. In this research, a set of real-time images are segmented using a specific condition. The DENSENET application is applied for extracting high-level semantic features for similar blocks. Morphed images were utilized on both sending and receiving ends. The experimental results revealed that the method provides better robustness with retrieval accuracy.
Wang et al. [14] developed a Neural Network (NN) based stochastic non-linear system to remove the linear growth condition for non- linearity in the finite-time systems. A neural controller is designed through a back-stepping technique to approximate unknown functions. The experimental results were satisfactory.
Fang et al. [15] proposed a feature selection method for effective medical diagnosis. The authors have applied a composition and distribution of possible symptoms in digital medical records and evaluated using traditional feature selection methods. The experimental results showed that the method achieves greater accuracy.
Chen et al. [16] developed an extraction method to extract texture features from cloud images. The power spectrum analysis is used to compute the feature vector values. The outcome of this study showed that multiple frequencies of texture can be identified, and sub clouds can be generated.
Nath et al. [17] found that ML method improves the rate of cancer diagnosis and support healthcare services to reduce the mortality rate of patients with cancer. It revealed that the data analysis technique can increase the accuracy of cancer predictability.
Based on the review of literature, we have framed the research questions as follows:
1. To find a proper classifier for LC image classification.
2. To evaluate the performance of the proposed classifier.
3. To develop an effective image classifier to support IoT devices for detecting LC with CT images.
RF classifier is an enhanced decision tree technique that applies a set of if-else conditions to produce the optimal result for a large dataset. The overview of the proposed method is shown in Fig. 2. Initially, CNN is used to extract features from the CT images. The process of extraction of features is illustrated in Fig. 2. After the extraction of features, the RF classifier will be trained with features and labels to learn the environment to detect cancer hot spots in the CT images. The trained classifier will be tested with features without labels and evaluated with performance metrics. The SVM and NB classifiers will be trained and tested similar to the RF classifier.
Step 1 – Input CT images.
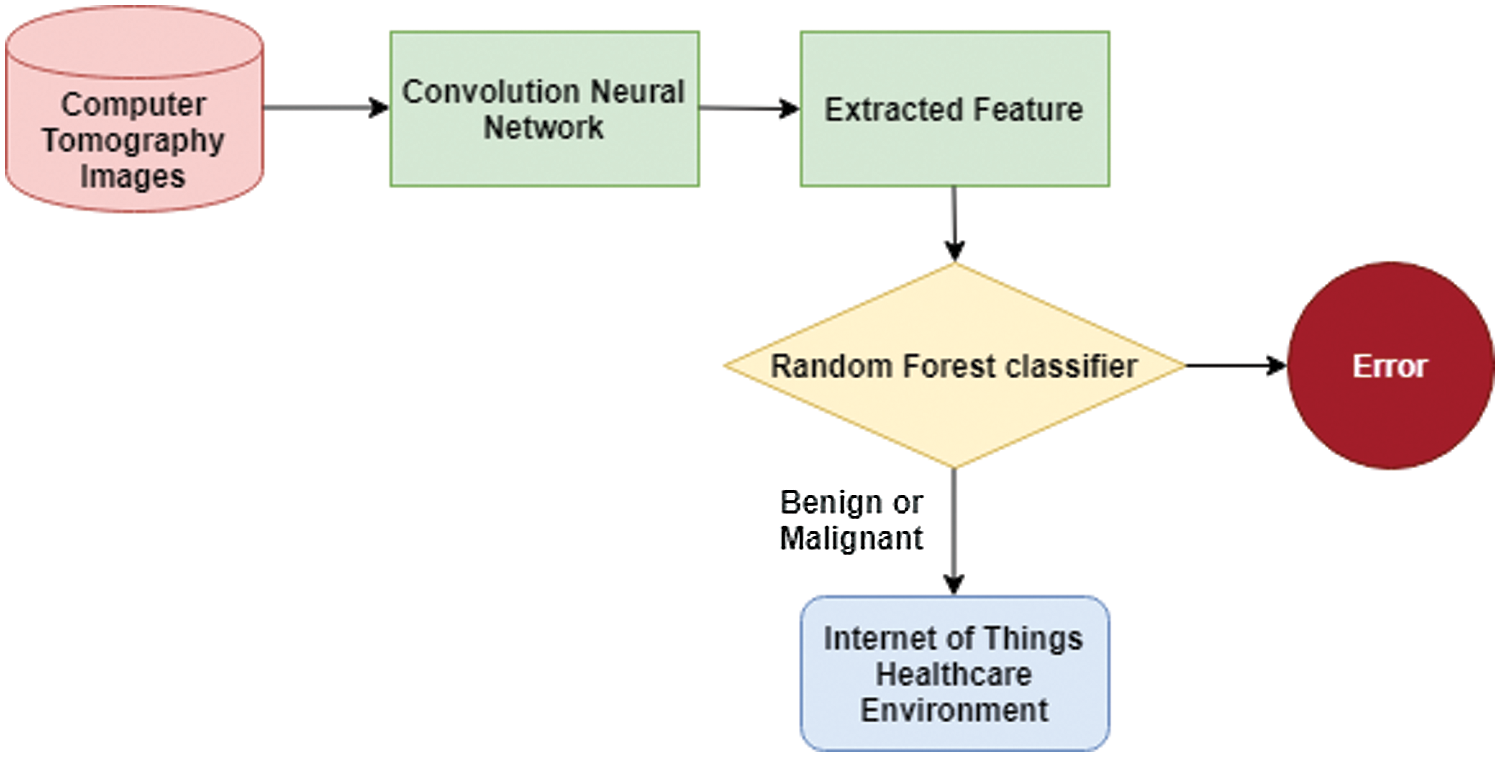
Figure 2: Illustration of the proposed research
In this step, the dataset of CT images from https://wiki.cancerimagingarchive.net/display/Public/LIDC-IDRI (D1) [27] is used to train and test the classifiers. The details of the data set are shown in Tab. 1. To identify benign types, we have used the images from http://www.via.cornell.edu/lungdb.html (D2) [28]. The Dataset D2 contains an image data set of 50 low doses of whole-lung CT scan images. Both datasets are freely available for research scholars. They contain a sufficient amount of data to train ML methods to uncover a complex object. Apart from the dataset, a set of 10 CT images of benign tumors in the lungs are downloaded from the Internet and used to train the classifiers.
Step 2 - Pre-process dataset.

In this step, the CT images are pre-processed and transformed into a computable form for the CNN model. A filtering technique is used to smooth edges and remove specific noise from images. A widowing approach is followed for transforming Hounsfield Units (HU) to grey scale values.
Step 3 – Extract features using convolution and pooling layer.
The CNN is built in a way to handle both linear and non–linear images. Forward and backward propagation is required for a NN to extract features from the images with fewer errors. The following procedure is followed for the forward propagation in the process of extraction of features from the CT images.
Let m be an image, Fr be a filter and “*” as a convolution then the mathematical expression to represent a Fully connected layer (Ef) is as Eq. (1):
For instance, consider a CT image size as a 3 X 3 matrix and a filter of size 2 X 2 matrix. The matrices are as shown in Eq. (2). It outlines the importance of a filter in CNN model.
The resultant 2D matrix is formed after the process of multiplying the above two matrices. The resultant matrix is as mentioned in Eq. (3):
The dimension of the image and the filter are smaller in size; therefore, it is predicted that the output matrix is 2 X 2 matrix. However, the shape of the output is not easy to predict for complex input image and filter dimension. The expression in Eq. (4), (5), and (6) represents the dimension of image, filter, and output matrix.
The output matrix shown in Eq. (3), is converted into a one-dimensional array and sent to the fully connected layer. Each value in the array is treated as an individual feature to represent the input image. The fully connected layer performs linear and non-linear transformation on the one-dimensional array. Eq. (7) shows the expression for the linear transformation.
Here, F is the linear transformation, X is the input, W is weight, and Z is a constant. Fig. 3 shows the process of extraction of features from CT images through the proposed CNN model. Initially, the convolution module uses a filter and extracts features and forwards it to a NN model. The convolution module will be iterated to generate a greater number of features. A set of new N–features will be formed by interacting with the initial set of N–features. The optimization module minimizes the actual input with predicted probability. CNN follows a forward and backward propagation method to update weights. This process of generating features from CT images is illustrated in Fig. 3. The feature extraction process is a three-layered approach, which processes an image from convolution layer to optimization layer. In each layer, features are updated with forward and backward propagation.
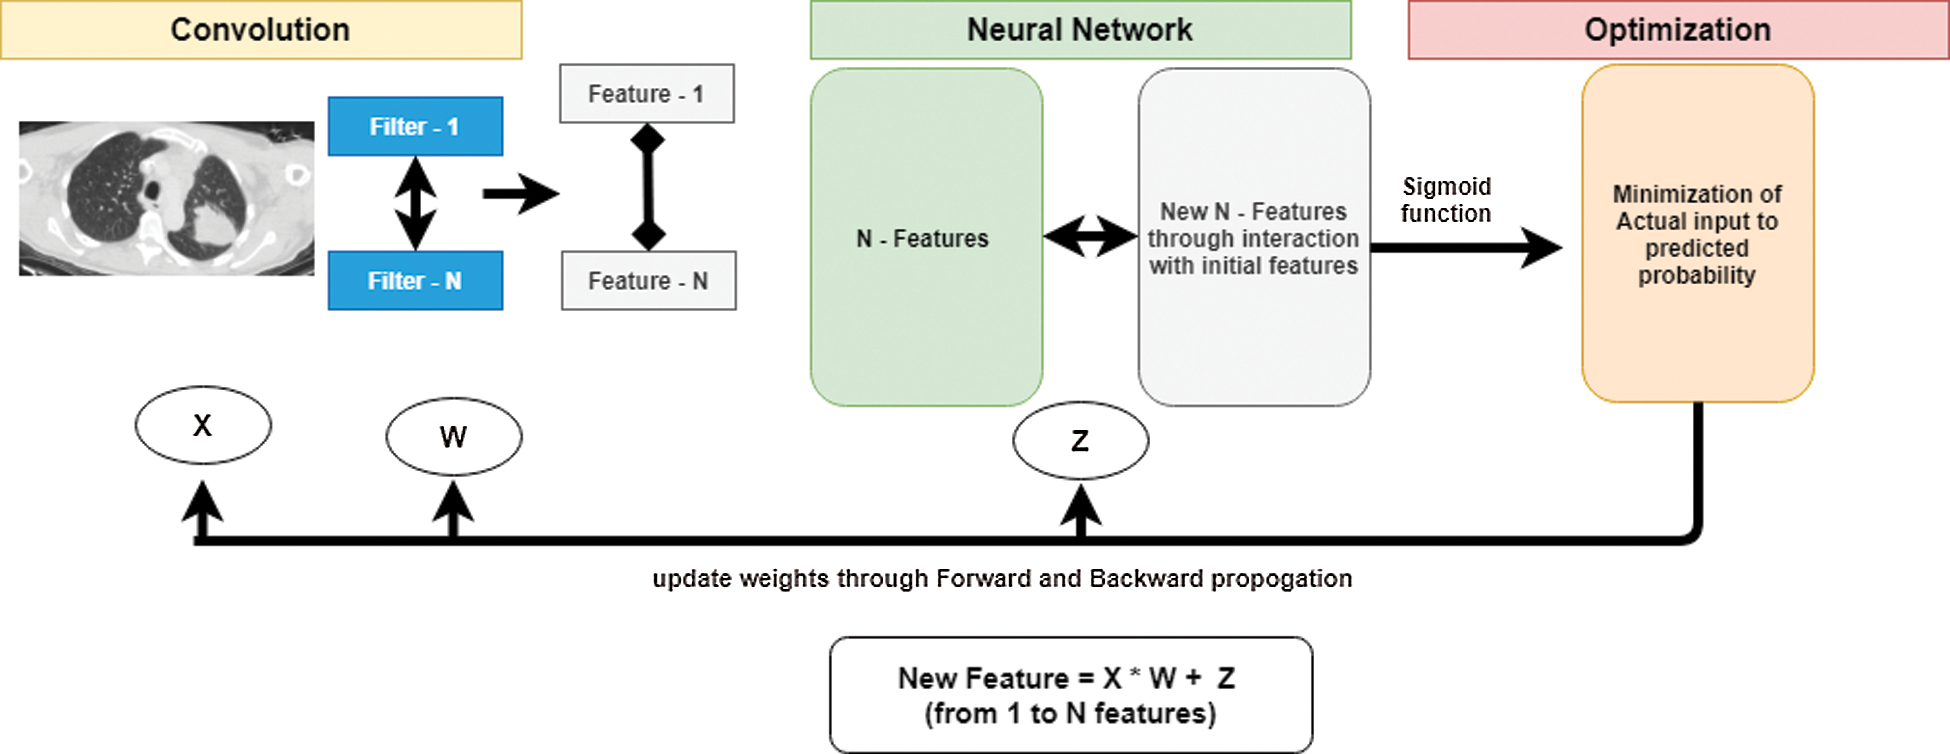
Figure 3: Extraction of features from images
CNN demands a non–linear transformation to capture the complex relationships between features. Therefore, a Sigmoid function is used to sum non - linearity to data. The expression for the Sigmoid activation function is as shown in Eq. (8):
The range of this Sigmoid function will be between 0 to 1. It is used for both convolution and fully - connected layer. The Sigmoid function for the fully connected layers is applied in Eq. (9) as follows:
After the completion of the forward propagation, the following Eq. (10) is used for the backward propagation. The backward propagation for fully connected layer is calculated using the below expression:
∂E/∂W is the output to represent fully connected layer,
∂E/∂O is the difference in error,
∂O/∂F is the difference in output with respect to F (Feature),
∂F/∂W is the change in F with respect to W (weight).
Finally, the backward propagation for convolution layer is calculated in Eq. (11) as follows:
∂E/∂fl is the output to show the convolution layer,
∂E/∂O is the difference in error,
∂O /∂F is the change in output for F (Feature),
∂F/∂A1 is the change in F concerning A1, which is calculated by ∂F/∂W.
∂A1/∂F is the change in A1 to F, and
∂F/ ∂f is the change in F concerning fl (filter).
Step 4 – Groups 70% of features and relevant labels as train set.
Step 5 – Groups 30% of features without labels as a test set.
Step 6 – Trains RF, SVM, and NB classifiers with train set.
CNN reduces the entropy of the data set and supports RF classifier to gain more information from the extracted features. The features and target labels will be sent as an input to the classifier as shown in Fig. 4. After the training phase, the RF, NB, and SVM can classify the images without target labels. Therefore, the testing phase uses 30% of dataset to test the ability of the classifiers. The following steps show the implementation of the RF classifier:
i) Choose random K features from the training set.
ii) Create a decision tree related to K features.
iii) Select several N trees to classify the K features and repeat steps i and ii.
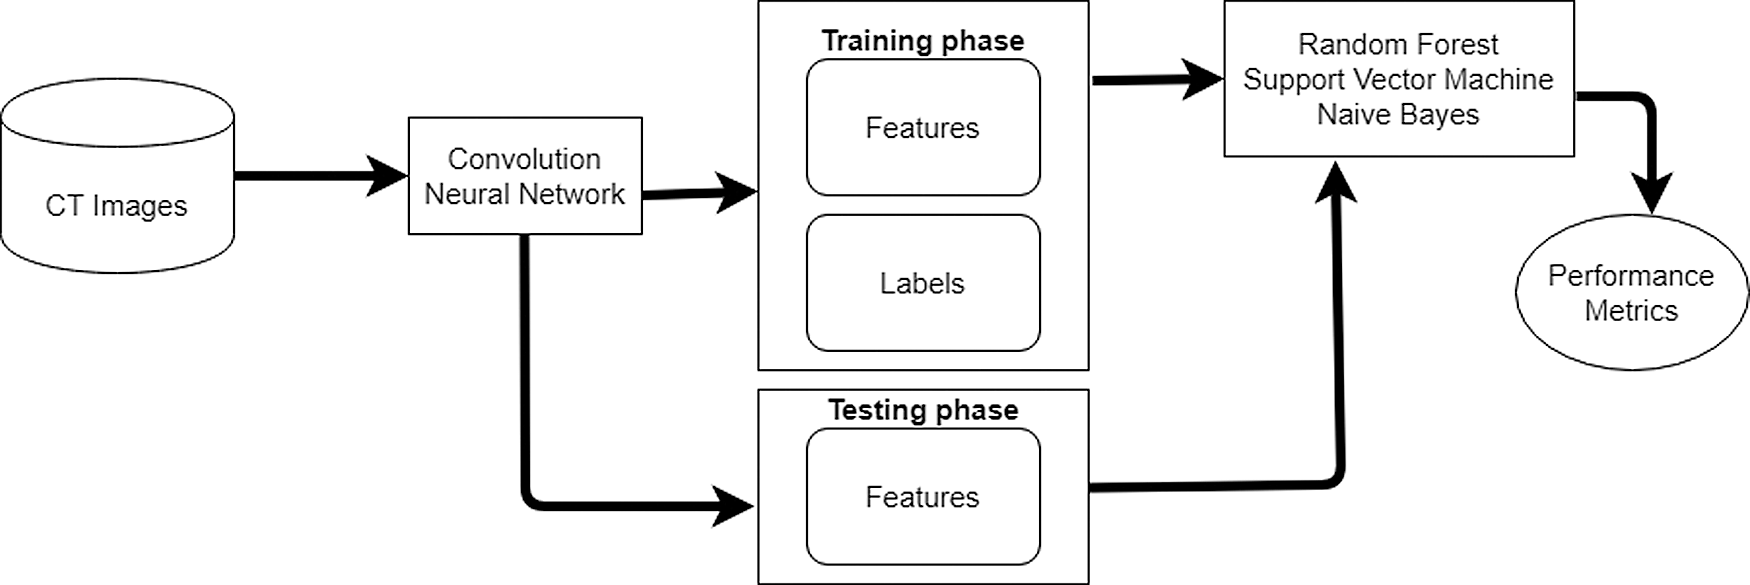
Figure 4: The process of identifying lung cancer
For a new feature, compute each N tree to predict a value for a feature and assign the feature across all predicted values.
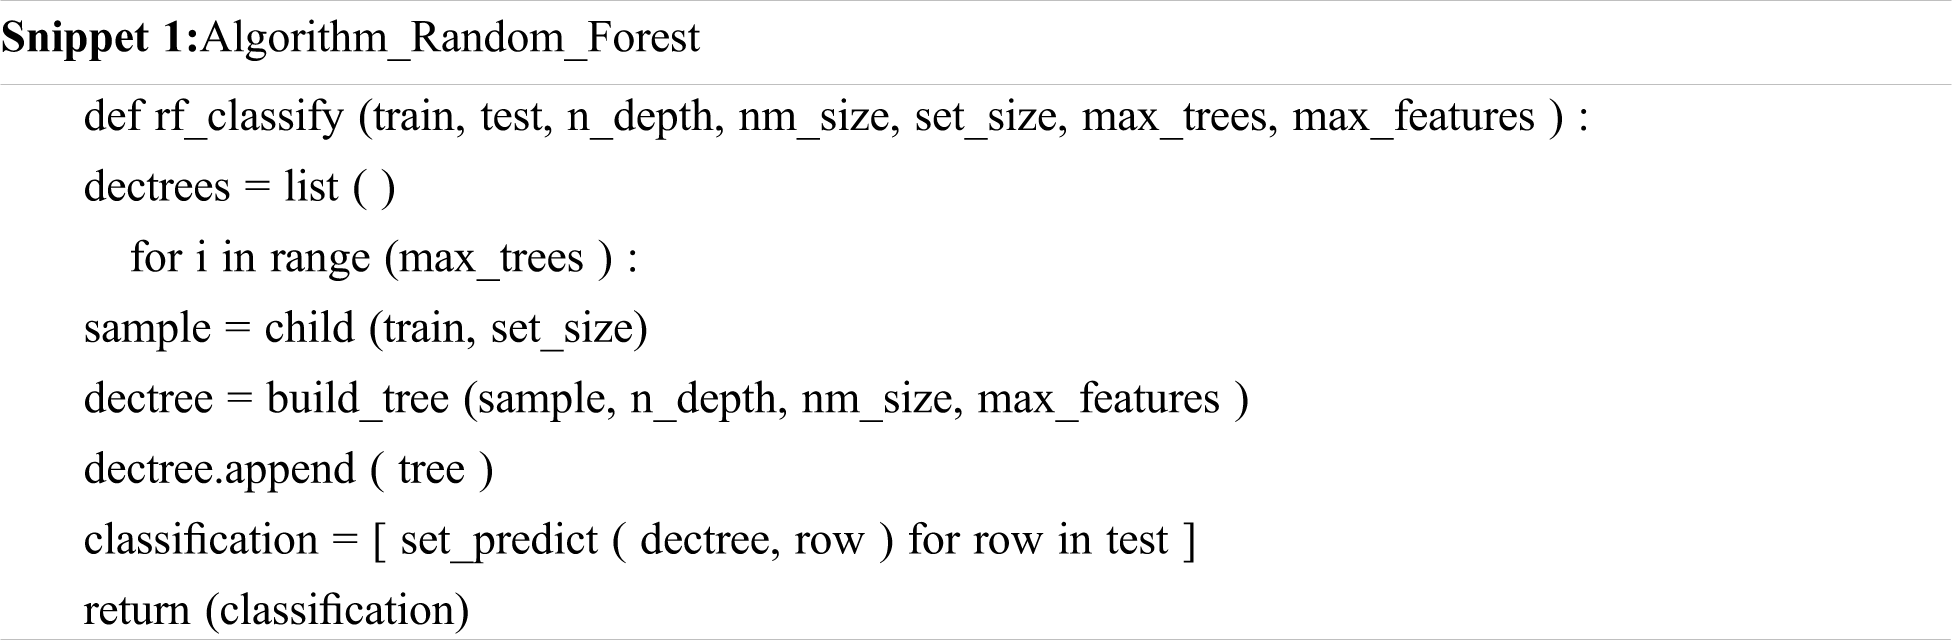
The following snippet 1 shows the primary algorithm of an RF classifier. It represents the classification processes that supports the proposed method to classify LC. It takes the maximum of the size of trees and features to integrate the intermediate results and make a final prediction/decision.
The following metrics are applied in the experimentation to measure the performance of the classifiers. These are widely in the research studies for evaluating the performance of a AI based technique [28].
i.Feature Selection Value
The Feature selection Value (FV) is similar to fitness value in GA and evolutionary algorithms. It is used to indicate the ability of classifiers in selecting features to predict the type of LC with CT images. It reduces the computation time and memory of the proposed approach in classifying the LC. In this research, we have applied an intermediate memory that connects both CNN and each classifier. The FV shows the number of features selected by the classifier to make a final decision. The maximum value of the feature selection is 1. A higher value is associated with better performance of the classifier. Eq. (12) shows the calculation of FV.
True Positive (TP), True Negative (TN), False Positive (FP), and False Negative (FN) are the four parameters for calculating Accuracy, Precision, Recall (Sensitivity), and Specificity. TP and TN are the correctly predicted positive and negative values whereas FP and FN are the contradicted values against the actual values.
ii. Accuracy
It is the most common performance measure that indicates a ratio between the correctly classified observations to the total observations. It is calculated as stated in Eq. (13):
iii. Precision
Precision is the ratio between TP and the sum of TP and FP. It is used to measure the ability of a classifier to find only relevant hot spots of cancers (malignant) with images. The general formula used for the same is as shown in Eq. (14):
iv. Recall
It is the ratio between TP and the sum of TP and FN. It is also called as sensitivity. It is used to calculate the capability of an image classifier in finding all relevant hot spots (benign and malignant) with the images. The following Eq. (15) for Recall is as follows:
v. F-measure:
It is the weighted accuracy of both recall and precision. It shows the ability of a classifier in retrieving relevant hot spots and detect the type of cancer correctly. It is calculated as mentioned in Eq. (16).
vi. Specificity
It is the metric that contradicts sensitivity. It shows the ability of a classifier to predict a patient with benign type of cancer. The general formula for sensitivity is shown in Eq. (17).
Step 9-End.
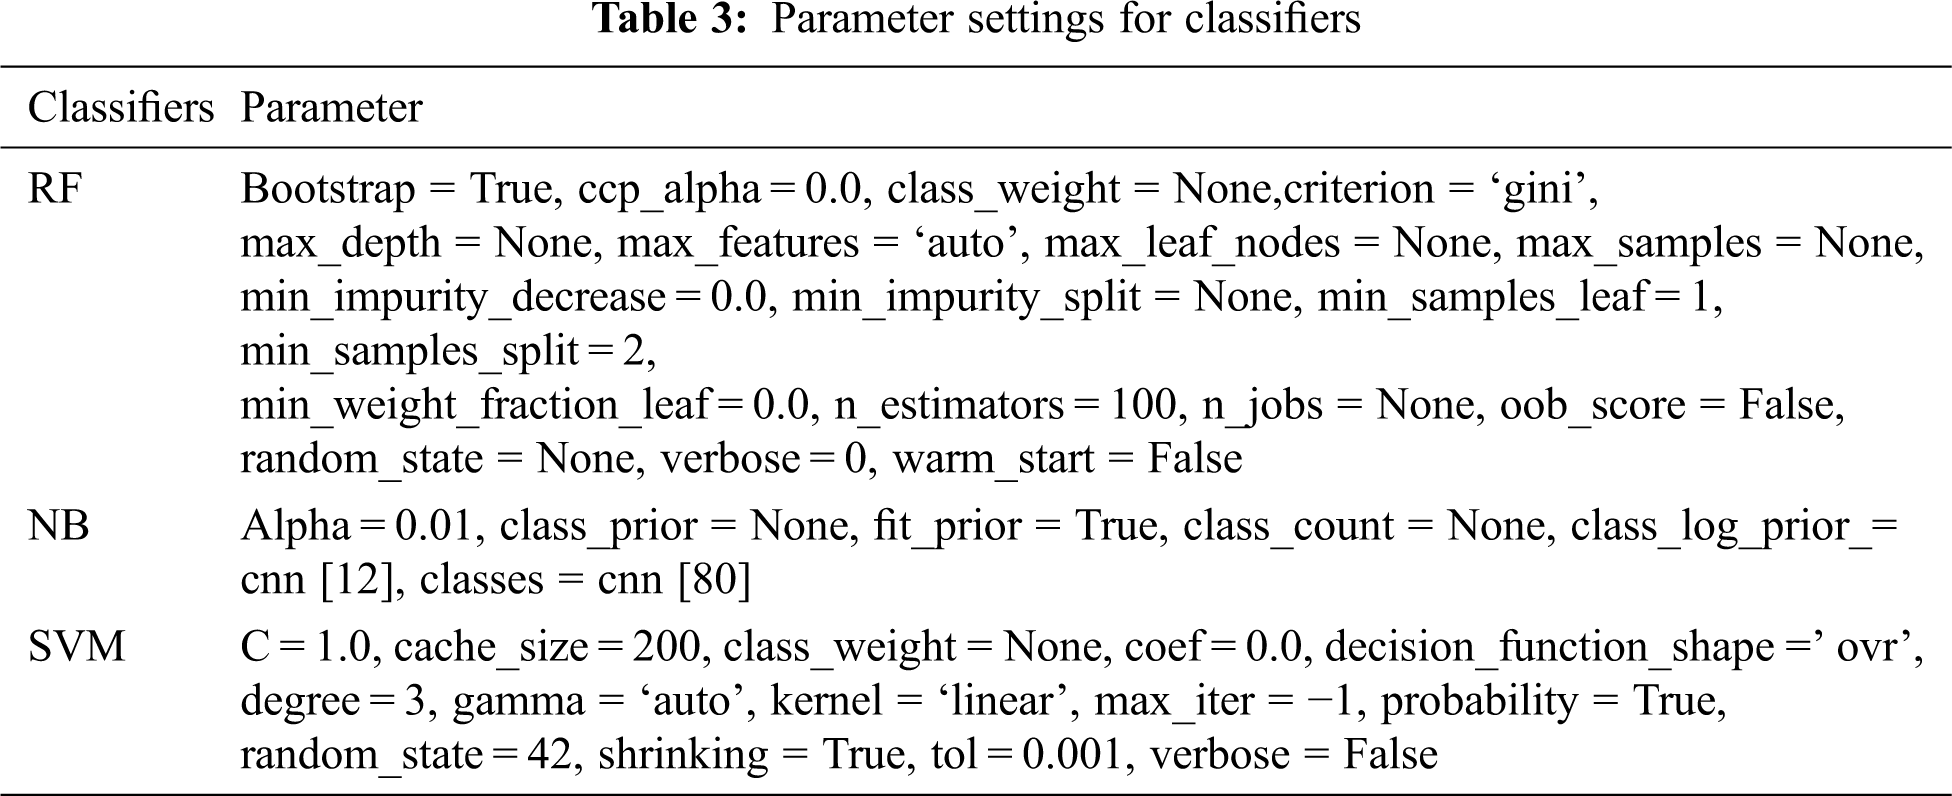
The above presented method is developed using PYTHON 3.7 in Windows 7 environment. The parameter settings for classifiers and CNN are provided in Tabs. 2 and 3. The settings include the experimentation portion taking place on two dimensions: feature extraction from CT images and cancer hot spot detection. A benchmark image from the repository D1 and D2 is employed in the research. The details about the repository are discussed in the previous section. Each image from D2 is generated in a single breath with 1.25 mm slice thickness.

In this study, we have developed a CNN with four convolution layers consisting of activation and pooling modules. A total of two fully connected layers are employed to process the features generated by the convolution layers. The settings for CNN are given in Tab. 2.
The repository has provided expert opinions about the images. Some of the sample images are shown in Fig. 5.
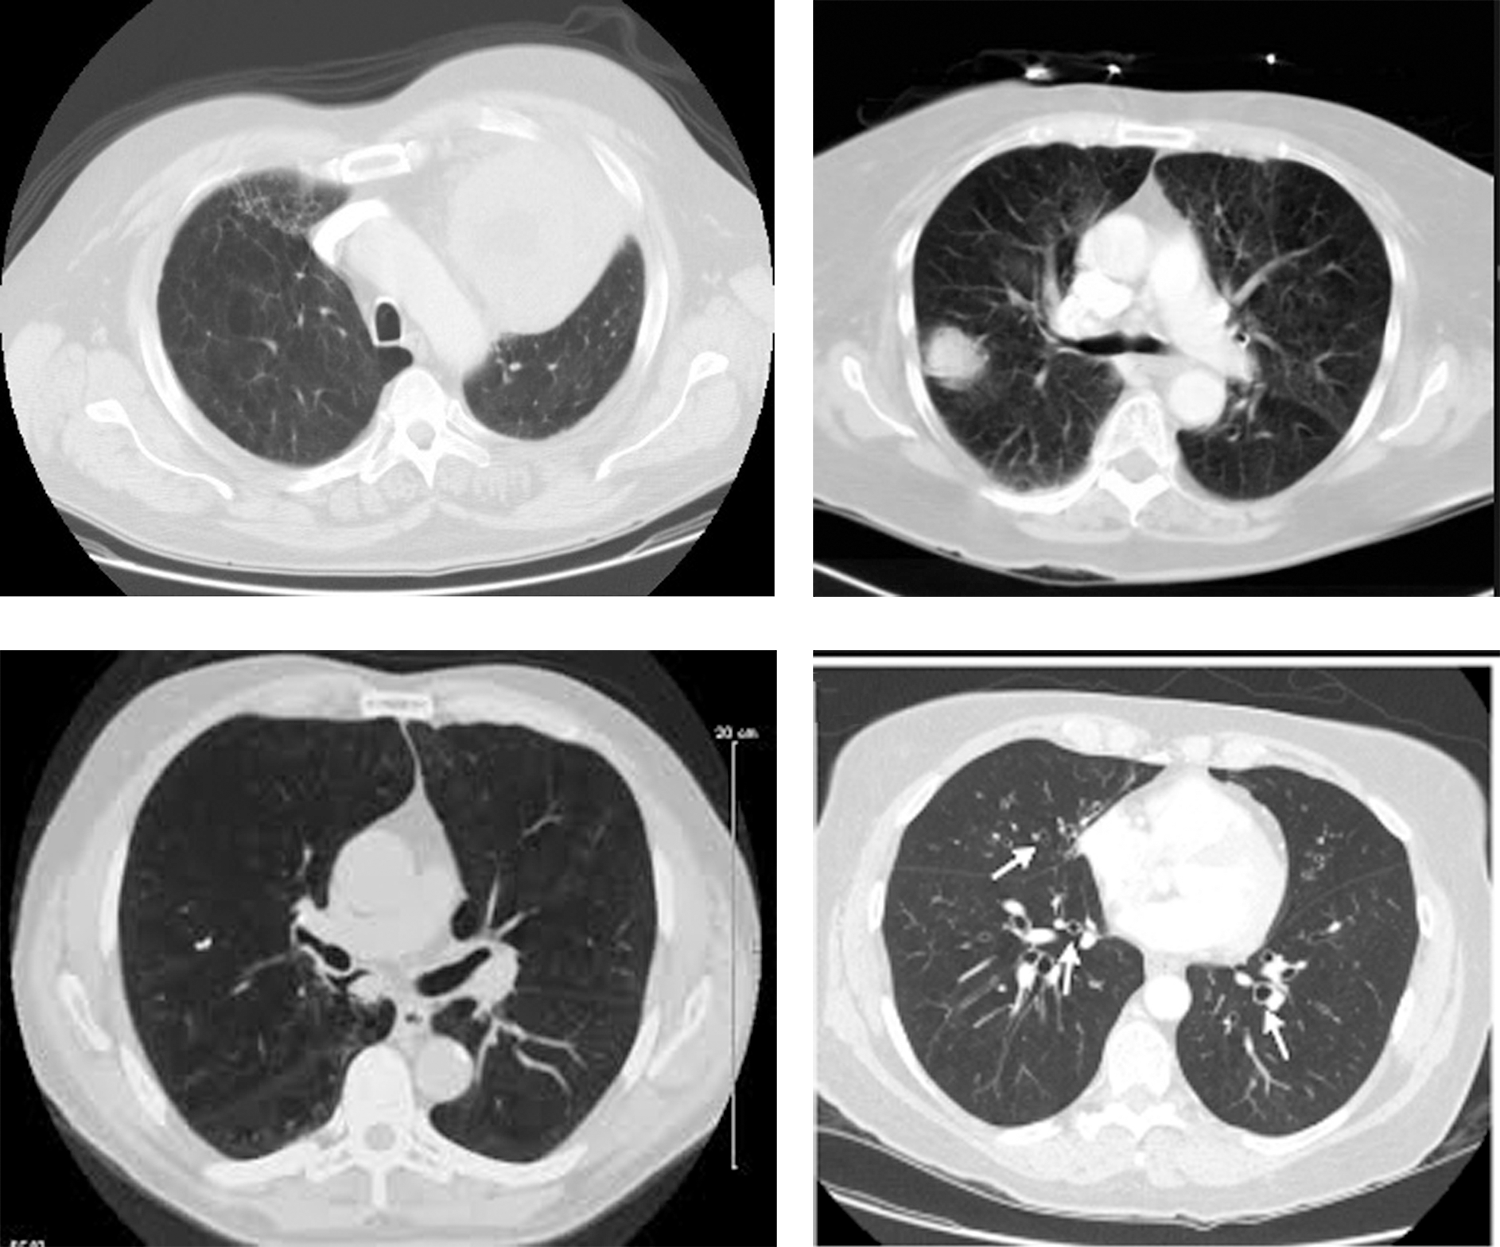
Figure 5: Sample CT images of lung cancer
Tab. 5 provides the features selection capability of the classifiers for Normal CT images. CNN has extracted features from D1 and D2. After the extraction, features are selected by RF, NB, and SVM. Feature selection value (FV), Standard deviation (Std), and computation time are calculated for each classifier.

Tab. 4–6 presents the FV, Std, and computation time of classifiers. It is provided in Tab. 4 that the FV of both NB and SVM is poorer than the proposed RF classifier. For instance, for the process of selecting features from normal CT images, a higher FV of 0.82 is obtained by the RF classifier whereas, the NB and SVM achieved FV of 0.74 and 0.79 respectively. The computation time of the RF classifier is more than SVM. However, it is lesser than the NB. Similarly, on the benign images in Tab. 5, RF obtained an FV of 0.87 whereas, the NB and SVM classifiers achieved an FV of 0.86 and 0.84 respectively. It is evident from Tab. 6 that the RF classifier achieved an FV of 0.94, a better value with less computation time with comparison with the NB and SVM classifiers. Fig. 6 shows the graph of combined FV of the classifiers for normal, benign, and malignant LC.
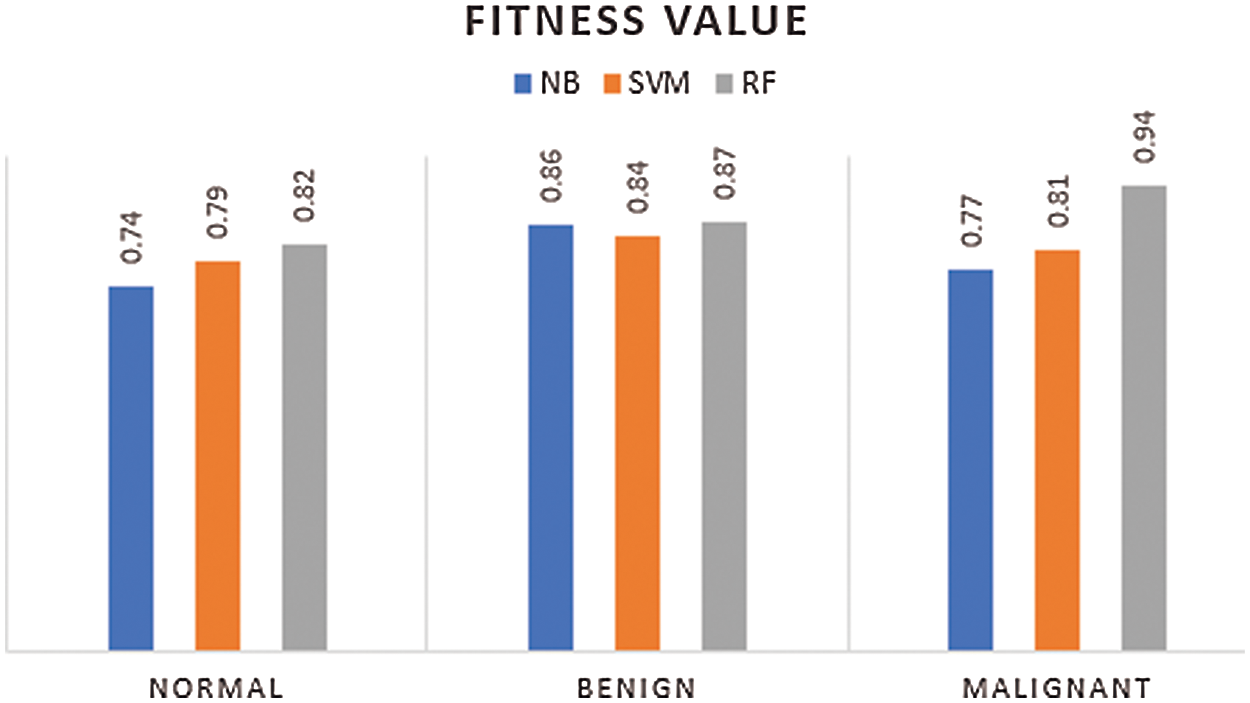
Figure 6: Feature selection value of classifiers

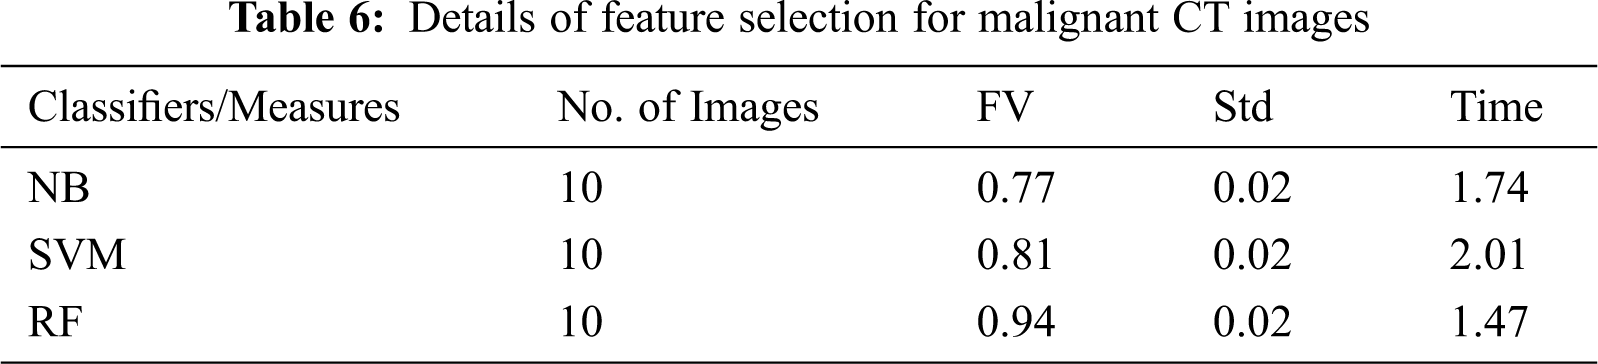
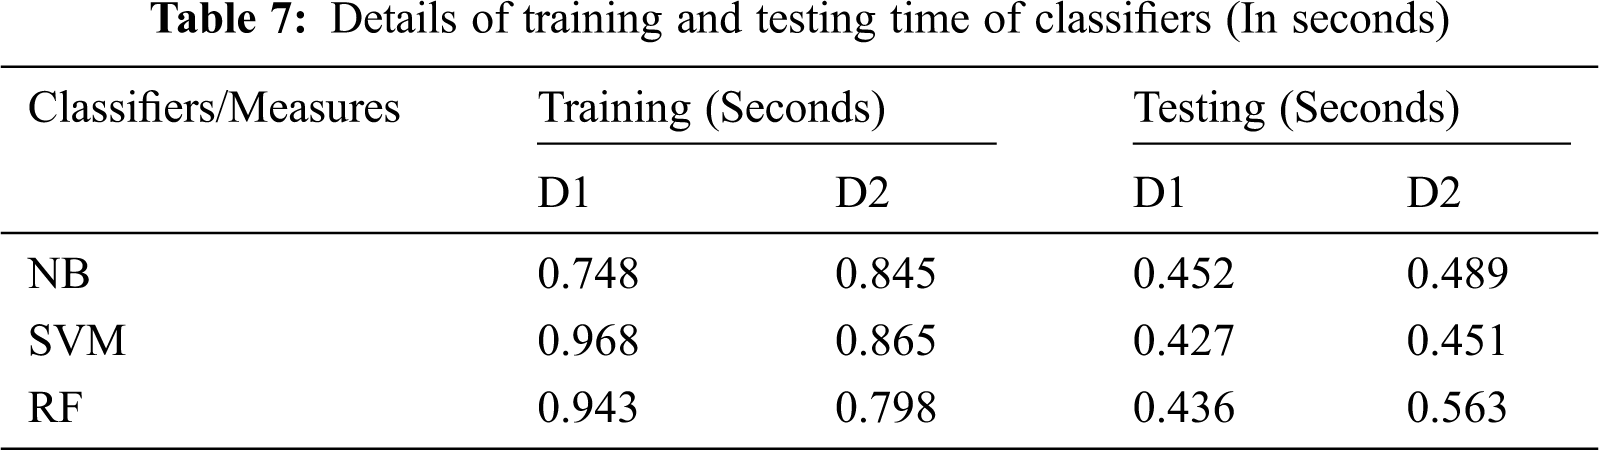
The proposed RF classifier showed a superior outcome with a better FV. Nonetheless, both NB and SVM depicted lower results. The proposed method achieved an average FV of 0.88 and computation time of 1.19 s on all sets of images, which depicts the better capability of the presented method than the existing classifiers. Especially, the proposed method has used a smaller number of features to predict a type of cancer with CT images. For instance, for malignant cancer images, a maximum of 10 images was used by the RF classifier and a value of 0.94 was obtained whereas, the NB and SVM achieved an FV of 0.77 and 0.81 respectively with the same number of images. Tab. 7 shows the computation time during the training and testing phase of the proposed classifiers. It is evident from Tab. 7 that the RF classifier takes less amount of time during the testing phase.
An analysis of the existing and the proposed method is made in terms of accuracy, precision, recall (sensitivity), F-measure, and specificity for the images in the repositories (datasets) D1 and D2. From the Tab. 8 and 9 and the relevant Fig. 7 and 8, it is evident that the proposed method attained an average accuracy of 93.25% whereas the NB and the SVM classifier obtained 94.1% and 92.7% respectively. For instance, for the images in D1, the proposed method has achieved an accuracy of 92.3%, which is lesser than the NB. However, it has scored better precision, recall, F-measure, and specificity than the NB. In short, the proposed method has achieved an optimal solution in all sets of test images than the NB and the SVM classifier.
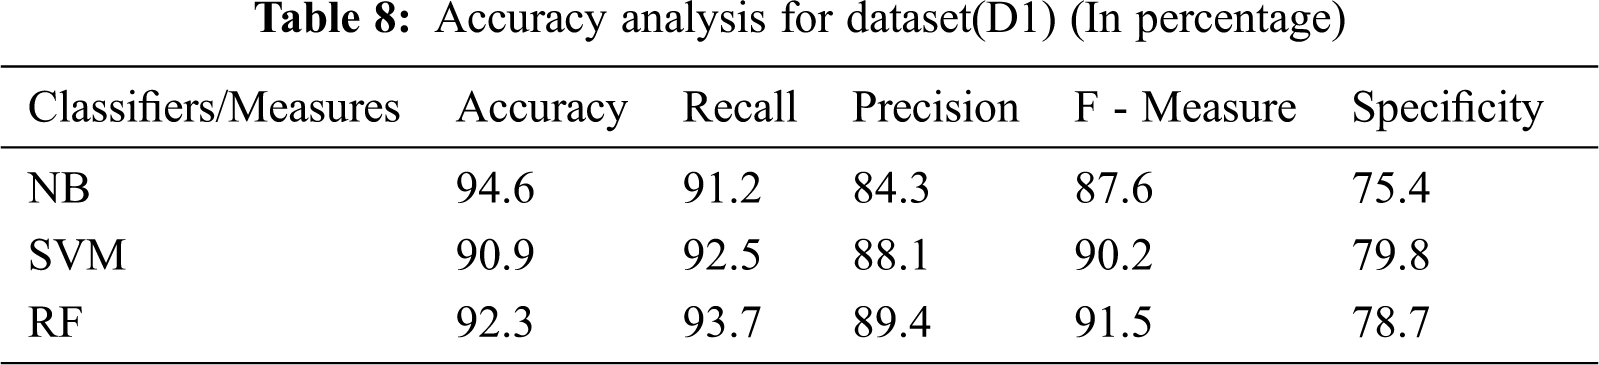

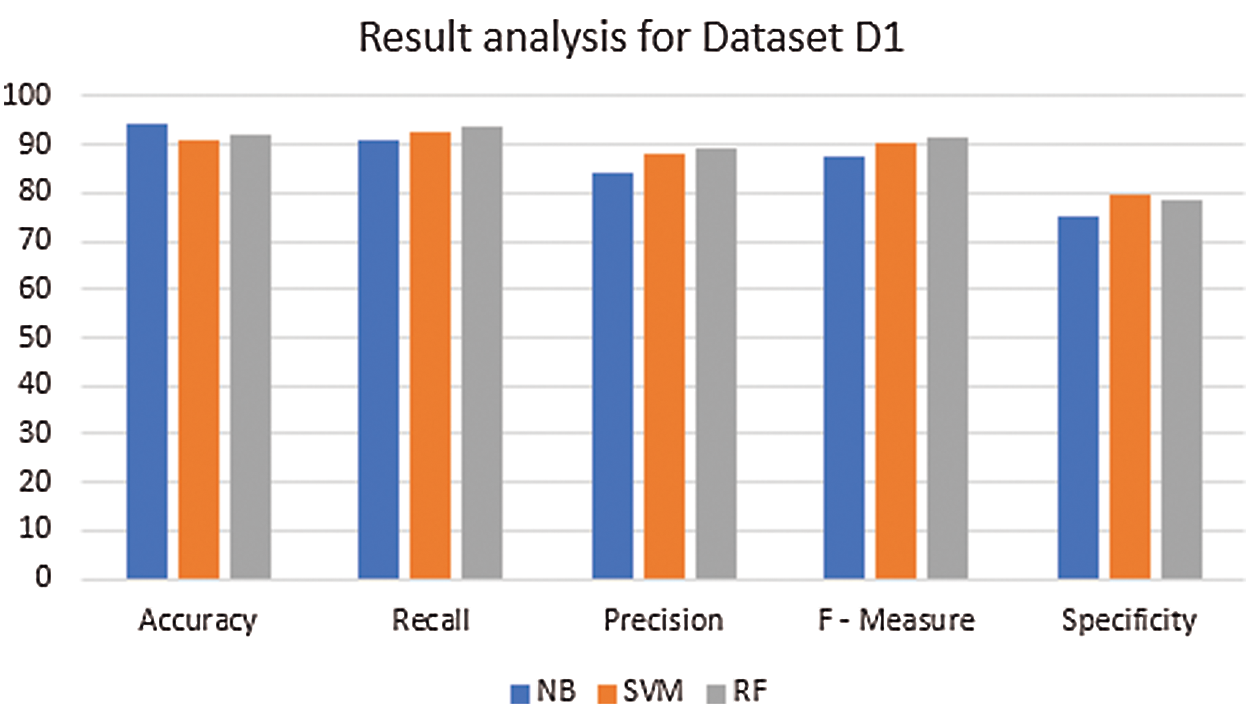
Figure 7: Result analysis for dataset (D1) (In percentage)
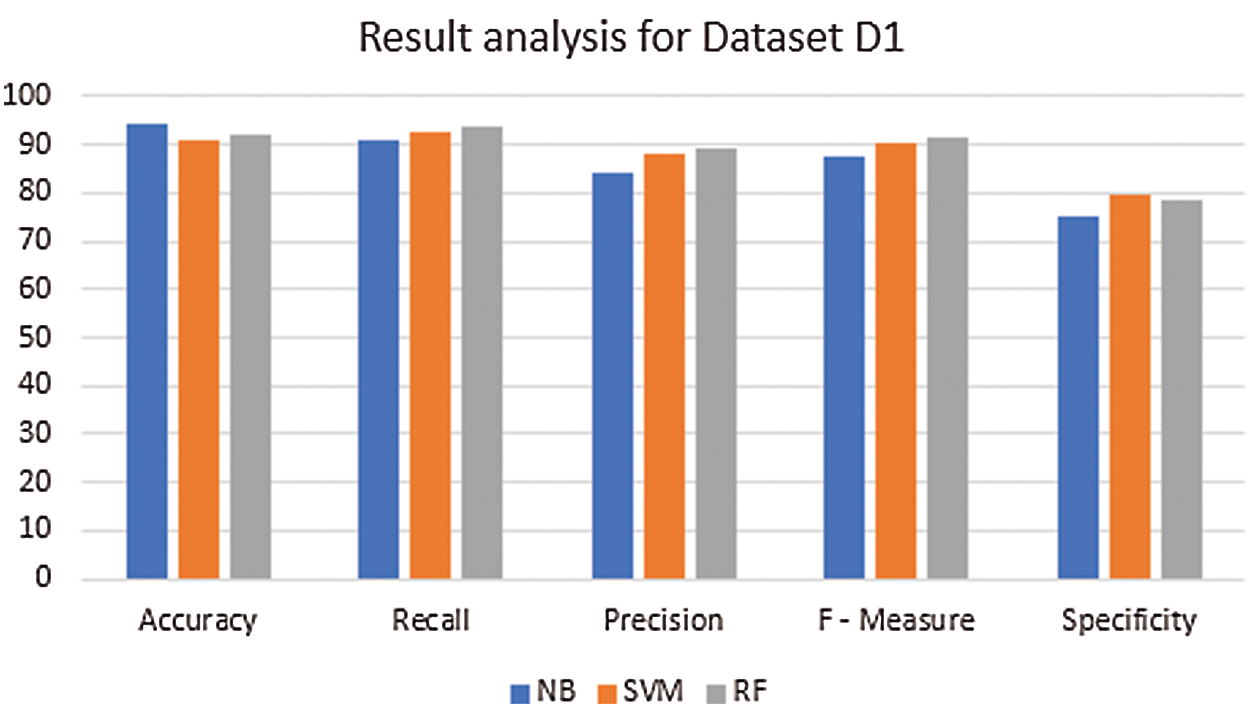
Figure 8: Result analysis for dataset (D2) (In percentage)
In this research, a Random Forest classifier with Convolutional Neural Network is devised to classify benign and malignant lung cancers with Computer Tomography images. The difficulties involved in extracting features from images reduces the performance of the existing image classifiers. The implementation part of this classifier takes place on three dimensions: Feature extraction, selection, and prediction of cancer hot spots. The proposed method has obtained superior results on all sets of test images under different aspects. Moreover, it secures an average accuracy of 93.2% and better precision, recall, and F-measure which is significantly higher than the compared methods. The time taken by the presented method to decide an output from an image is lower than that of the existing methods. The outcome of the experimental analysis ensures that the proposed IoT based random forest classifier can be applied in IoT based real-time health care services to identify lung cancers with images. Moreover, it represents that the performance of the proposed method is effective than the existing methods. In the future, the method can be enhanced to identify the damage caused by Corona virus in human lungs. Furthermore, a deep learning approach can be applied to improve the efficiency of the classification technique.
Funding Statement: The author received no specific funding for this study.
Conflicts of Interest: We declare that we have no conflicts of interest to this work. We declare that we do not have any commercial or associative interest that represents a conflict of interest in connection with the work submitted.
1. J. Wu, T. Aguilera, D. Shultz, M. Gudur, D. L. Rubin et al., “Early–stage non–small cell lung cancer: Quantitative imaging characteristics of 18F fluorodeoxyglucose PET/CT allow prediction of distant metastasis,” Radiology, vol. 281, no. 1, pp. 270–278, 2016. [Google Scholar]
2. R. Varadharajan, M. K. Priyan, P. Panchatcharam, S. Vivekanandan and M. Gunasekaran, “A new approach for prediction of lung carcinoma using back propagation neural network with decision tree classifiers,” Journal of Ambient Intelligence Human Computing, vol. 1, no. 1, pp. 111–115, 2018. [Google Scholar]
3. Z. Liu, C. Yao, H. Yu and T. Wu, “Deep reinforcement learning with its application for lung cancer detection in medical internet of things,” Future Generation Computer Systems, vol. 97, pp. 1–9, 2019. [Google Scholar]
4. G. R. Hart, D. A. Roffman, R. Decker and J. Deng, “A multi-parameterized artificial neural network for lung cancer risk prediction,” PLOS One, vol. 13, no. 10, pp. 1–13, 2018. [Google Scholar]
5. A. Agrawal and A. Choudhary, “ Identifying hotspots in lung cancer data using association rule mining,” in Proc. 11th IEEE Int. Conference on Data Mining Workshops, Vancouver, Canada, pp. 995 – 1002, 2011. [Google Scholar]
6. B. Muthazhagan and T. Ravi, “An early diagnosis of lung cancer disease using data mining and medical image processing methods: A survey,” Middle-East Journal of Scientific Research, vol. 24, no. 10, pp. 3263–3267, 2016. [Google Scholar]
7. V. Krishnaiah, G. Narsimha and N. S. Chandra, “Diagnosis of lung cancer prediction system using data mining classification techniques,” International Journal of Computer Science and Information Technologies, vol. 4, no. 1, pp. 39–45, 2013. [Google Scholar]
8. M. V. Dass, M. A. Rasheed and M. M. Ali, “Classification of lung cancer subtypes by data mining technique, in Proc. the 2014 Int. Conf. on Control, Instrumentation, Energy and Communication (CIECCalcutta, India, pp. 558–562, 2014. [Google Scholar]
9. D. Valluru and S. Jeya, “IoT with cloud-based lung cancer diagnosis model using optimal support vector machine,” Health Care Management Science, vol. 23, pp. 670–679, 2020. [Google Scholar]
10. D. J. Zeng, Y. Dai, F. Li, J. Wang and A. K. Sangaiah, “Aspect based sentiment analysis by a linguistically regularized CNN with gated mechanism,” Journal of Intelligent & Fuzzy Systems, vol. 36, no. 5, pp. 3971–3980, 2019. [Google Scholar]
11. S. R. Zhou and B. Tan, “Electrocardiogram soft computing using hybrid deep learning CNN-ELM,” Applied Soft Computing, vol. 86, pp. 1–11, 2019. [Google Scholar]
12. J. M. Zhang, X. K. Jin, J. Sun, J. Wang and A. K. Sangaiah, “Spatial and semantic convolutional features for robust visual object tracking, ”Multimedia Tools and Applications, vol. 79, no. 8, pp. 15095–15115, 2020. [Google Scholar]
13. Y. J. Luo, J. H. Qin, X. Y. Xiang, Y. Tan, Q. Liu et al., “Coverless real-time image information hiding based on image block matching and dense convolutional network,” Journal of Real-Time Image Processing, vol. 17, no. 1, pp. 125–135, 2020. [Google Scholar]
14. F. Wang, L. L. Zhang, S. W. Zhou and Y. Y. Huang, “Neural network-based finite-time control of quantized stochastic nonlinear systems,” Neurocomputing, vol. 362, pp. 195–202, 2019. [Google Scholar]
15. S. Q. Fang, Z. P. Cai, W. C. Sun, A. F. Liu, F. Liu et al., “Feature selection method based on class discriminative degree for intelligent medical diagnosis,” Computers, Materials & Continua, vol. 55, no. 3, pp. 419–433, 2018. [Google Scholar]
16. X. Y. Chen, S. J. Zhao, X. L. Wang, X. J. Sun, J. Feng et al., “Texture feature extraction method for ground nephogram based on contourlet and the power spectrum analysis algorithm,” Computers, Materials & Continua, vol. 61, no. 2, pp. 861–875, 2019. [Google Scholar]
17. A. S. Nath, A. Pal, S. Mukhopadhyay and K. C. Mondal, “A survey on cancer prediction and detection with data analysis,” Innovations in Systems and Software Engineering, vol. 16, no. 1, pp. 1–21, 2020. [Google Scholar]
18. L. Cai, T. Long, Y. Dai and Y. Huang, “Mask R-CNN-based detection and segmentation for pulmonary nodule 3D visualization diagnosis,” IEEE Access, vol. 8, pp. 44400–44409, 2020. [Google Scholar]
19. Y. H. Liu, “Feature extraction and image recognition with convolutional neural networks”, Journal of physics, Conference Series, vol. 1087, no. 6, pp. 1–7, 2018. [Google Scholar]
20. B. Xu, L. D. Xu, H. Cai, C. Xie, J. Hu et al., “Ubiquitous data accessing method in IoT-based information system for emergency medical services,”, IEEE Transactions on Industrial Inform Atics, vol. 10, no. 2, pp. 1578–1586, 2014. [Google Scholar]
21. S. K. Lakshmanaprabu, K. Shankar, M. Ilayaraja, A. W. Nasir, V. Vijayakumar et al.,“Random forest for big data classification in the internet of things using optimal features,” International Journal of Machine Learning and Cybernetics, vol. 10, pp. 2609–2618, 2019. [Google Scholar]
22. S. K. Saini, S. Gaurav and A. Choudhary, “Detection of lung carcinoma using fuzzy and ACO techniques”, International Journal of Engineering Research and Technology, vol. 3, no. 3, pp. 903–906, 2014. [Google Scholar]
23. T. Yang, N. Liang, J. Li, Y. Yang, Y. Li et al., “Intelligent imaging technology in diagnosis of colorectal cancer using deep learning,” Special Section on Data Mining for Internet of Things, vol. 7, pp. 178839–178847, 2019. [Google Scholar]
24. The Cancer Imaging Archive (TCIAOnline. Available: https://www.cancerimagingarchive.net. [Google Scholar]
25. Support vector machine algorithm, Online. Available: https://github.com/cperales/SupportVectorMachine. [Google Scholar]
26. Naïve bayes algorithm, Online. Available: https://github.com/gbroques/naive-bayes. [Google Scholar]
27. Cancer image archive, Online. Available: https://wiki.cancerimagingarchive.net/display/Public/LIDC-IDRI. [Google Scholar]
28. Lung cancer dataset, Online. Available: http://www.via.cornell.edu/lungdb.html. [Google Scholar]
 | This work is licensed under a Creative Commons Attribution 4.0 International License, which permits unrestricted use, distribution, and reproduction in any medium, provided the original work is properly cited. |