DOI:10.32604/iasc.2022.019877
| Intelligent Automation & Soft Computing DOI:10.32604/iasc.2022.019877 | |
| Article |
Arrhythmia and Disease Classification Based on Deep Learning Techniques
1School of Computing, Sathyabama Institute of Science and Technology, Chennai, 600119, India
2Department of Computer Science and Engineering, United Institute of Technology, Coimbatore, 641020, India
*Corresponding Author: Ramya G. Franklin. Email: mikella.prabu@gmail.com
Received: 29 April 2021; Accepted: 16 June 2021
Abstract: Electrocardiography (ECG) is a method for monitoring the human heart’s electrical activity. ECG signal is often used by clinical experts in the collected time arrangement for the evaluation of any rhythmic circumstances of a topic. The research was carried to make the assignment computerized by displaying the problem with encoder-decoder methods, by using misfortune appropriation to predict standard or anomalous information. The two Convolutional Neural Networks (CNNs) and the Long Short-Term Memory (LSTM) fully connected layer (FCL) have shown improved levels over deep learning networks (DLNs) across a wide range of applications such as speech recognition, prediction etc., As CNNs are suitable to reduce recurrence types, LSTMs are reasonable for temporary displays and DNNs are appropriate for preparing highlights for a more divisible area. CNN, LSTM, and DNNs are appropriate to view. The complementarity of CNNs, LSTMs, and DNNs was explored in this paper by consolidating them through a single architecture firm. Our findings show that the methodology suggested can expressively explain ECG series and of detection of anomalies through scores that beat other techniques supervised as well as unsupervised technique. The LSTM-Network and FL also showed that the imbalanced data sets of the ECG beat detection issue have been consistently solved and that they have not been prone to the accuracy of ECG-Signals. The novel approach should be used to assist cardiologists in their accurate and unbiased analysis of ECG signals in telemedicine scenarios.
Keywords: Heart diseases; ECG; anomaly detection; encoder; decoder; CNN; LSTM
Electrocardiography offers a vast volume of cardiovascular health and anatomy evidence and is a primary technique for cardiac disease diagnosis [1]. Arrhythmia is a very common cardiac condition that is studied critically by professionals. Throughout the clinical practice, errors in diagnosis and incorrect results sometimes arise because of the disparity between the specialists and the lack of flow. Programmed identification of arrhythmia and identifiable proof of occasions are important as experts should be helped in differentiating arrhythmic occasions beforehand [2].
The diagnosis of arrhythmia has generally concentrated on screamed impulses from the electrocardiogram (ECG), pulse segmentation [3,4], and manual extraction of components [5,6]. The ambiguous complexity of the actual scientific dataset demands through administration in terms of the potential impact of a diagnosis prediction error. The P wave, the QRS complex (current set in the electrocardiogram), and often the T wave have been seen by a complete ECG signal as shown in Fig. 1. Tab. 1 displays the representations of the most common value ranges of the wave features. Throughout the following research, subsequent studies have extended group estimates to an algorithmic characterization of blood pressure, such as Decision Trees (DT), Naive Bayes, and K-Nearest Neighbor (KNN) [7]. Also, three forms of SVM classifications were aimed at predicting cardiac path illness [8]. For cardiovascular condition IDs based on the support vector machines (SVM) arrangement of heart sounds an automated classification system is recommended [9]. Neural systems models have recently implemented outstanding efficiency for awaiting details and solving different structure issues. Deep learning approaches have become enormous in the area of health care in the discovery of knowledge and disease control, related to coronary heart disease, diabetes, and cerebrum infection, utilizing the details obtained from the biomedicines as illustrated in [10], which have demonstrated a few therapeutic implementations utilizing deep learning and have more comfortably seen. Precisely, several precious neural system-based models were designed primarily to correctly order cardiac diseases [11]. Convolutional Neural Networks (CNN) is used in ongoing research to identify different heart disease classifications of ECG-signals and to divide ECG information into ordinary and abnormal structures with an altered deep convolutional neural network [12]. The RNN was also used to predict potential infections by using clear EHR patient representations and showing transitional relationships within EHR data events [13]. Recent research was performed using long short-term memory modules (LSTM) toward identified risk in cardiovascular disease and transient vascular infection prediction through gated recurrent units (GRU) [14]. Because of advancements in innovative deep learning, convolutional calculations will complete several extraction processes. The methodology is easier than morphology and has small signal efficiency requirements [15]. The one-dimensional convolutional (1-D CNN) method proposed by [16], has been used to differentiate and describe ventricular ectopic beats and premature ventricular constraints. A similar 1-D CNN grouping was suggested by [17] to substantially boost the efficiency of the systems by arranging considerably more divisions of coronary artery diseases. Even though there are several references to the ECG arrhythmias, certain barriers have yet to be obstructed, such as the lack of ECG signal details during highlight mining or commotion scrubbing, ECG arrhythmias with a default collection of characteristics, relatively poor description of the internal mixture technique.
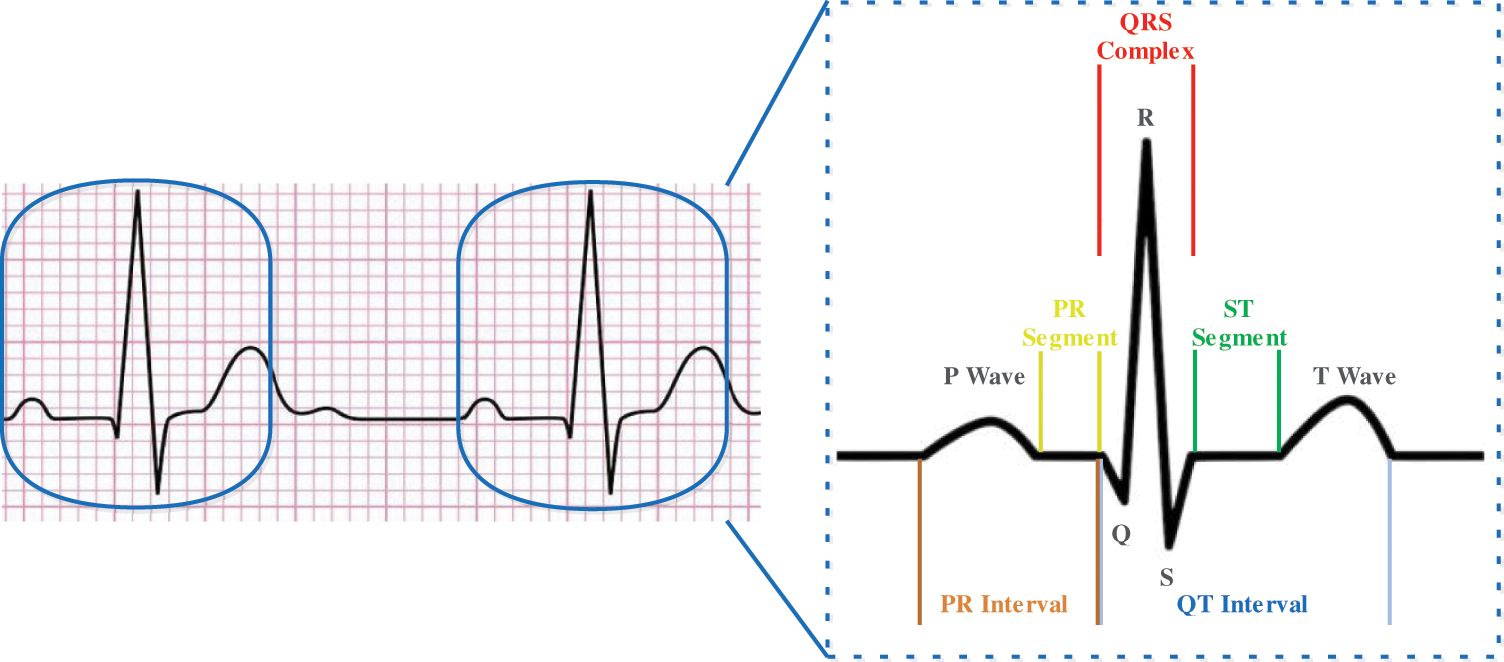
Figure 1: Typical ECG signal with a single heartbeat in normal sinus rhythm

Given the problems encountered, this paper suggests a 2D grayscale image model entering a deep 2D CNN with LSTM. Many ECG data will be lost because of complications, for example, the interference, but can be prevented by changing ECG to a 2D image with a 1D signal [18]. The information used is generally limited in most existing reviews. Most experiments would be highly careful where the 1D ECG signals are preprocessed in terms of the sensitive and unnecessary effect on the absolute exactness of one-dimensional ECG signals. More data and detail is possible through the translation of 1D ECG signals into 2D ECG images. If all the signals are separated, this little noise data may be overlooked by the convolution layer of the model. For 2D ECG images, filtering, and feature extraction of manual elements are not required. Even though noise data certainly are ignored by the convolution and pooling layers in these configurations while they obtain a feature map, they hold a strategic detachment from the problem of the effect of noise and accuracy. In addition, certain experts [19,20] utilize images as details in certain similar disease studies, rather than 1D signal. In terms of their study and identification of symptoms by way of image perception, the usage of 2D ECG images for detection and classification are more analogous to the cardiologist path for diagnosis of rhythmic illnesses. If a 1D ECG signal is used for devices such as ECG monitors, there would be issues including sampling rate and vibration, such that 2D ECG images may be used more in ECG tracking robots, which will aid cardiac specialists in the detection of arrhythmic diseases. Moreover, due to the current properties of the 1D ECG signal, it becomes challenging to implement information development technologies used in previous studies. The ECG signal should be applied to increase the planning data and will boost the arrangement accuracy effectively. For this study, we utilized distinctive trimming techniques to extend the 2D ECG image to support the CNN 2D technique to train a single ECG image through various perspectives. An automated ECG extraction modular highlights using a 2D CNN that will fix the existing hand-planned waveform includes that are not adequately hearty to deal with understanding to-tolerant contrasts in heartbeats. Unlike the 2D CNN construct, a recurrent neural network (RNN) operates as another deep learning mechanism for LSTM. The status and time elements of the data are added into the input condition of all cells in the LSTM and will preserve a strategic buffer from the problem of long term dependency. LSTM cells can retain and manage beneficial data from data that are specifically removed [21]. The integration of 2D CNN and LSTM enhances the classification impacts remarkably.
Heart diseases are responsible that shows any heart condition and show chest pain and suffering and weariness, anomalous cardiac beat rate, and many different signs. There are several contributing factors to heart disease diagnosis. Age, sex, weight, and other hazard factors are established. Smoking, alcohol, obesity, and various diseases, such as asthma and heftiness, are all linked to other risk factors. The array of factors allows determining and assessing the occurrence of cardiac disease challenging for physicians. The use of typical classification techniques such as the support vector machine (SVM), a priori algorithm, decision trees, and hybrid random forest model [22,23] is already proposed to classify and analyze EHR data concerning coronary disease expectations. Depending on the AI procedures applied to EHR information, cardiovascular failure prediction has been shown and reached a greater AUC score of 77% utilizing logistics recurrence with the preference of methodology based on the Bayesian data specification [24,25].
The ongoing experiments revised the fetal pulse records with an 85% accuracy convolutional neural network (CNN) and multilayer perceptron (MLP) [26]; a recurrent neural network (RNN) was also proposed in records with 83% precision for the detection of irregular beating rhythm. For the atrial fibrillation order of various electrocardiograph signals, a long-short term memory organizer was used and achieved 78% accuracy and 79% F1 value in [27]. An application for the pediatric testing of coronary heart disease using a CNN model was also measured for computerized phonocardiogram (PCG) signals to recognize the hazard of programmed auxiliary heart irregularities [28]. To successfully enhance the accuracy of coronary disease applications, the bidirectional neural network architecture was also introduced using the estimation of the BiLSTM consideration that provided better accuracy of 99.49% [29]. In the area of biomedicine, several research tasks are recognized regarding the efficacy of neural systems, and different applications of deep learning presented in clinical imaging obtained the highest outcomes in their class [30]. To enhance the computerized clinical results and suggest a strong morphological approach towards genuine ECG chronicles, it was proposed to use a generative adversarial network (GAN) consisting of BiLSTM and CNN models. Some different applications have used the Natural Language Processing (NLP), which has been supported by coronary disease experts, e.g., which recommended massive concentrations of electronic clinical data using the LTSM model, and ambulatory classes, as shown by a literary substance by using the BiLTSM [31,32].
Models of knowledge mining were expanded by emerging concepts such as ensemble learning, which enhanced the application of structures. The goal is to build a prestigious ensemble learning model focused on various data sets such that the proximity and non-appearance of coronary diseases are evaluated and grouped and promising accuracy is achieved that exceeded the best class results [33]. Besides, the possibility of ensemble learning was used by completing predictions of different classifiers rather than by preparing a separate classification. A case of usage was performed with the bagged tree and AdaBoost computations to minimize coronary disease [34]. A neural network-based ensemble strategy was suggested to build a very powerful classification technique and present a promising accuracy structure [35]. The cardiovascular breakdown identity based on LSTM-CNN was also proposed as a case of an ensemble learning model [36]. A classifier that is expected is consistently oriented to a shared class and has not summed up the learning. The use of proposed changes for strategies such as Smote, Edited Nearest Neighbors (ENN) and Tomek [37], to adjust the information to provide the superior significance of the class during model development was thus recommended. For EKG-based heartbeat order, a specific ensemble learning system configuration was proposed and the highly characterized performance of a balanced multi-class grouping task was demonstrated [38].
The data sets and observations included in this review come from the arhythmia database of MIT-BIH. The archive consisted of 48 0, 5-h ECG signal reports from 47 topics with two conduits [39]. Every record of the signals has been tested at the R peak at 360 Hz. Different cardiologists have explained this information anonymously. ECG signals have been processed into ECG images for data processing purposes. The detailed symptoms of lead II have been used during the experiments in this article. According to the MIT-BIH Arrhythmia database analysis, we listed “N” for the standard signal rhythm (SSR), ‘L’ for the left branch square block (LBSB), ‘R’ for the right bundle branch block (RBBB), “A” for atrial premature beat (APB), “V’ for premature ventricular constriction (PVC), “/” for paced beat (PAB), “E” for the precociously ventricular constriction (PVC), “!” for ventricular flutter wave (VFW). For instance, nodal leanings through beat were restricted in this article, beginning with ventricular flutter and specific beats, not recognized as rhythms. Most ECG arrhythmia findings have ignored the fact that such beats usually have little criticality. Fig. 2 shows the general techniques.
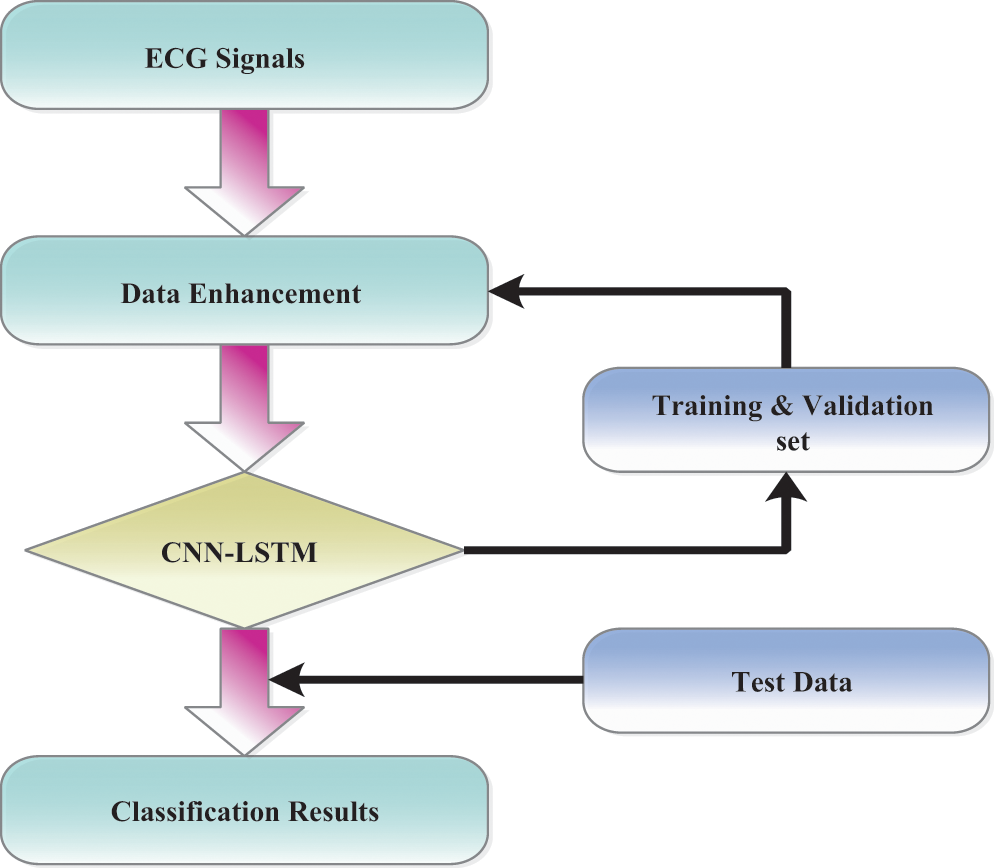
Figure 2: Overall procedures are processed in ECG arrhythmia classification
The ECG signal is approximately 2–3 min for each subject. From growing illustration, we divided 10 s windows. The morphology or range of the signal has no effect and therefore we do not clean or transform the example. We isolate the R-R signal [40] only preprocessing. Without the assumption of the signal, the technique employed is extremely necessary and effective. Both the signals are updated to 188 with labels 1 and 0 for anomalous and uncommon indications and its shown in Fig. 3. An average explanation for the typical signal, while an abnormal signal may not provide such an unusual occurrence. This element provides an interesting description of the usage of ECG signal anomaly detection.
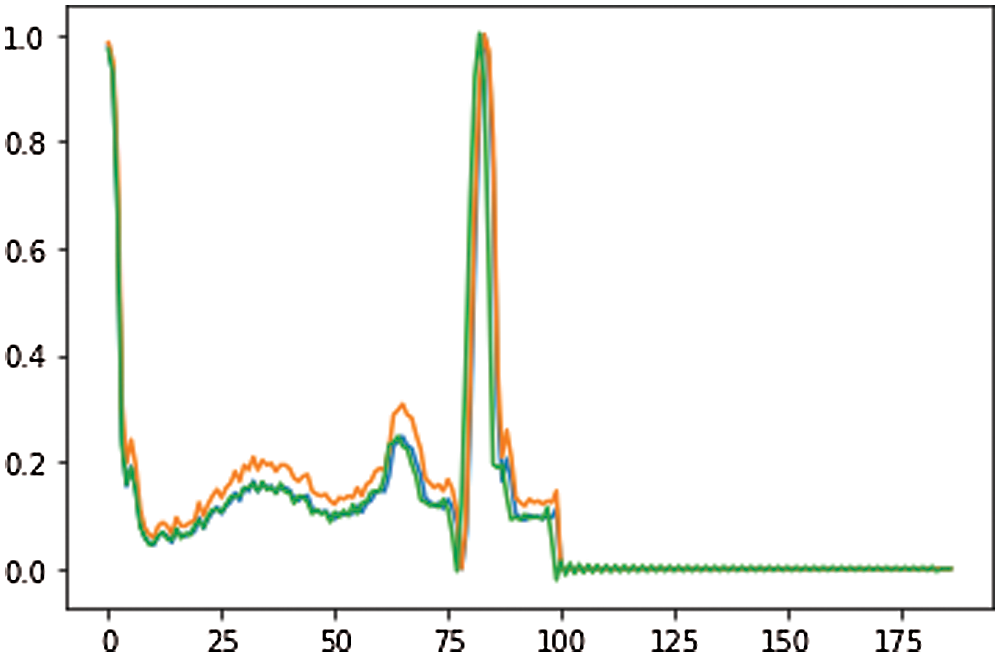
Figure 3: ECG data of preprocessing
Since the database contains the most typical rhythm types, the measurement of information for each type of disease is an imbalance. As a result of the imbalance amount of data in every data classification, the data expansion can build a small amount in the class and reduce overfitting problems adequately. Upgrading the image will improve the data calculation. Most of the past ECG rhythmic medications could not physically add information about enlargement because of loss with ECG signals training. The explanation includes the purpose of classifiers in feed-forward neural systems (FFNN) and SVM consider to have a similar classification meaning for each ECG signal [41]. The different category ECG signal obtained through the enhanced data is shown in Fig. 4. Nevertheless, considering that the data input by the model in this analysis is ECG, the image enhancement technique should not change the information, rather the information calculation should be built. The approach builds upon on handling of images and enhances details on the modified 2D ECG image. The controlled data is performed in a manner focused on the modified image of the ECG, investing the number of data samples while retaining an unaffected approximation of the results. Through updating the knowledge irregularity in the test, it improves the important original functionality.

Figure 4: Enhanced data in one heartbeat of each category
Another breakthrough that has been standard for machine learning, as well as pattern recognition, is deep learning [42,43]. It employs a cross-learning approach focused on deep learning. CNN and LSTM are integrated into the general structure of the model. Including CNN, the processing of spatial or private data is reasonable, whereas LSTM is acceptable for the attainment of information quality identified by time series. The models’ layers 1 to 9 are convolutional layers and layer 10 tends to be the LSTM layer. The resulting layers of LSTM assist the model in identifying the transient elements in such marks [44]. A combination of CNN and LSTM (none, 16, 16, 256). The output structure until the model’s pooling layer. Through the reshape technology, we reformulate the components of the model and the information size of an LSTM layer is reshaped afterward (256, 256). The model ultimately separates ECG signals across the fully connected layer after breaking down the time qualities of LSTM. By setting a streamlining agent and learning rate the preparation phases of the pattern can be improved. Thus, a learning speed of 0.001 and a streamlining enhancer have been set and utilized. The suggested network model is shown in Fig. 5.
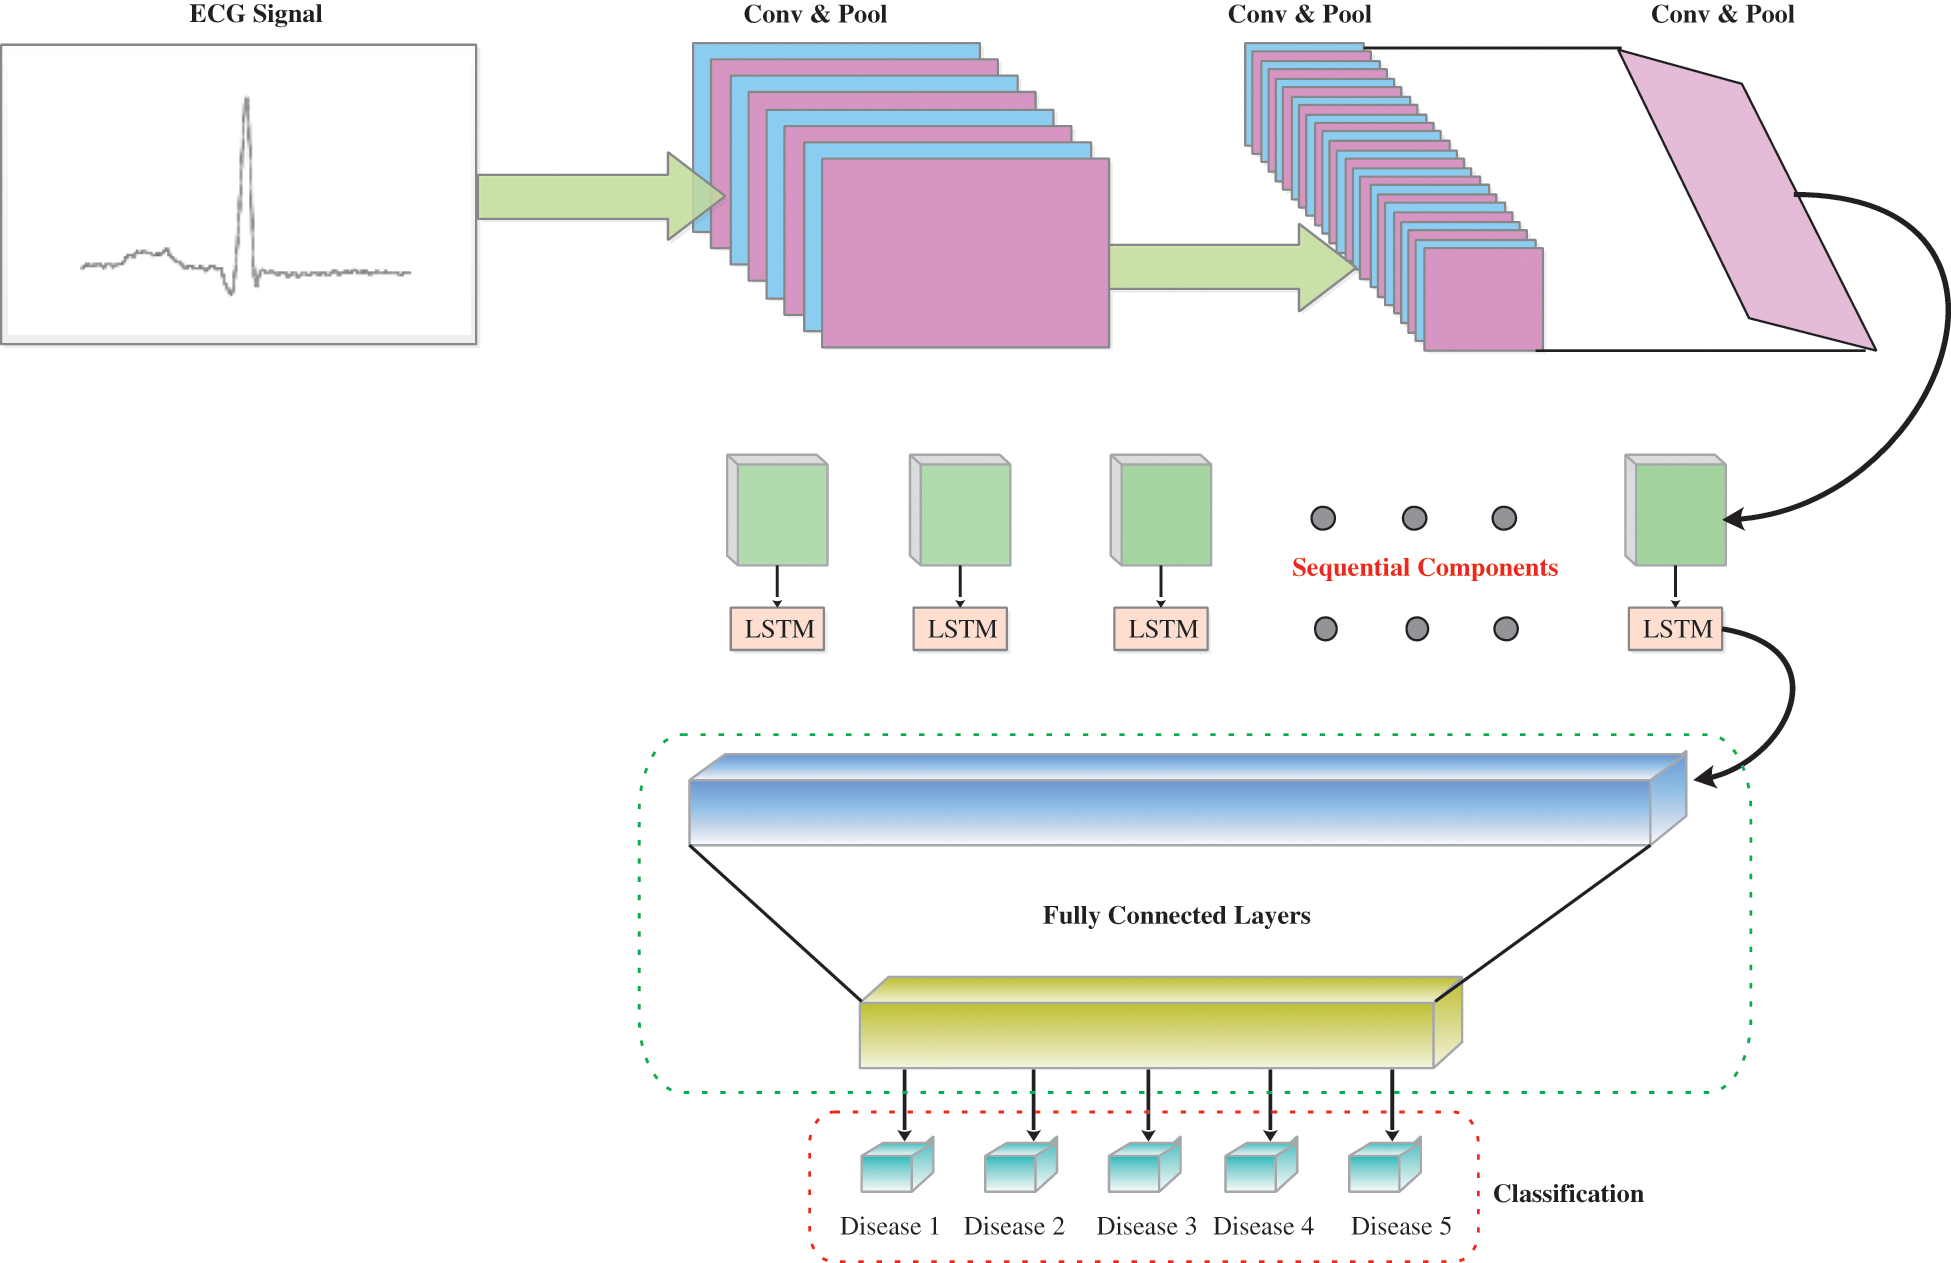
Figure 5: The overview of CNN-LSTM as proposed
3.4 Model Architecture and Details
The 2D CNN design is the most important feature of the proposed design, and is paired with three convolution blocks and has a stage size of 1. Each convolution is accomplished by the exponential linear unit (ELU). The batch normalization layer is used to regularize the activation costs. That ensures that two 2D CNN layers and a single overall batch layer in each convolution are reached. With all convolution tasks, the convolution part is systematically retrieved by multiplying the superposition matrix with both convolution functions. The feature map for this layer uses a most extreme pool channel for high light extraction following a 2D convolution and the maximum step size of the channel is two. The image of the components is extended to the most intense 2D pooling layer but the simplest region inside this feature map is stripped out, labeled as a different feature map. The basis for the design is continuously being created. To optimize the learning rate from the model structure, the size of the feature map is slowly decreased. In the last part of the model, each feature map is then moved to the LSTM layer to obtain any time information. After convolution and convergence, the highlights are separated into successive parts. The LSTM circular chain system carries out its time series prediction. Since it has an alternate form to a single neural network, LSTM is not quite the same as standard RNN. It focuses on specific cell conditions with gated units. LSTM consolidates these systems over and again to ensure that any data is processed in the network in a persistent and industrious manner. The modules with this process are presented such that the gradient is disappearing and long-term dependency problems are calculated. Following the LSTM layer, a feature vector with an illustration through time-dependent features takes control of the fully connected layer of the softmax system with five output neurons. Finally, the prediction of arrhythmia is fulfilled with the outputs behind these five classifications which are fully connected layers.
The layer xt is transmitted as an input to that same network, with l logical vectors on one side and r vectors on one side. This data is intended for [xt−l,…, xt+r]. Every frame xt in our work contains a log of 40 dimensions. Initially, by moving through several other convolutional layers, we minimize frequency variations of the input signal. In every CNN layer, the architecture used is the same as that indicated in and we use two convolutional layers, all of which 256 feature maps. We use a recurrent 9 × 9 time channel for the first convolution, accompanied by a 4 × 3 channel for a second convolutional layer, and the channels are spread over the entire frequency region. The method of pooling will be to utilize max pools that are not protected, and repeated pooling just happens [45]. The first layer was built-in with a pooling depth of 3 and also no second layer pooling was carried out.
Owing to the number of feature maps x frequency x time, the component over the last layer of such CNN is enormous. In such lines, the feature dimension is decreased by a linear layer until they are passed here to the LSTM layer as shown in Fig. 6. We have observed throughout [46] that a reduction of parameters with no consistency takes into consideration the addition of these linear layers during the CNN layers. We found that the size was important to decrease so that we could get 256 of the linear layer outputs during our observations. If the frequency is shown, we then transfer the CNN result through LSTM layers to show the signal in time. Following the suggested technique, we use two LSTM layers with an 832-cell LSTM layer and a dimensionality decrease of 512 projection layer units. The LSTM is unrolled 20 times to be primed for back propagation through time (BPTT) until it has been shown under certain circumstances. Moreover, the name of the output state is delayed by five points, so DNNs prove how data on the potential frame allows predicting the actual frame better. The data used in the CNN includes l on the one side and r on the other, and the output from the CNN is also transferred to an LSTM. In required to preserve certain LSTM does never have more than five possible CLDLN latency decoding objects, we set r = 0. At last, we transfer LSTM output to a couple of fully connected DNN layers following the frequency and worldly example. As seen in [47], these higher layers are ideal to provide a higher order of higher specifications, which can be separated much more effectively at each level. There are 1,024 hidden units for each fully connected layer.
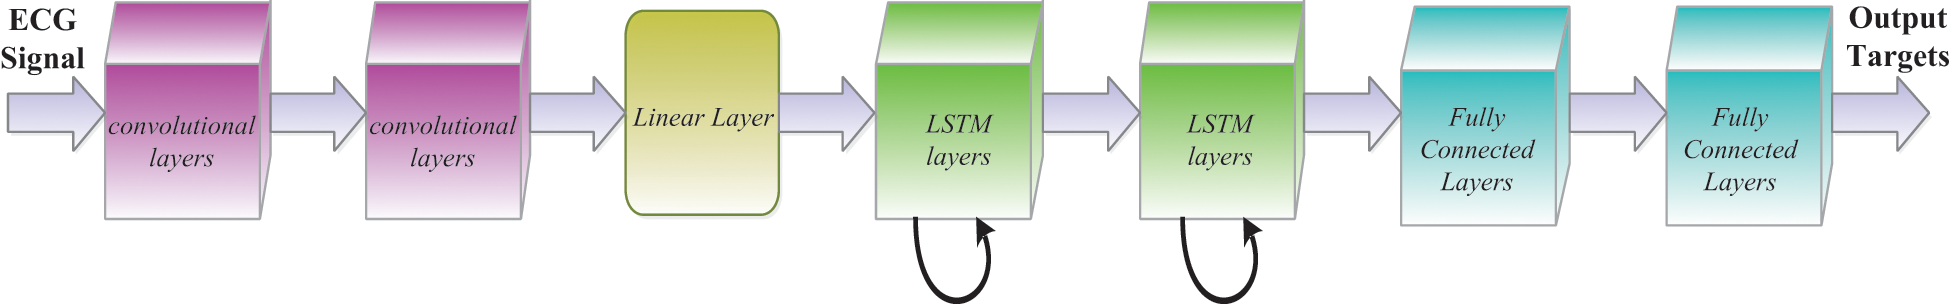
Figure 6: CNN-LSTM layer architecture
To enhance the expressive complexity of neural networks, activation functions still need to improve the approximation capabilities within each network layer. Non-linear activity is widely used in CNN models compared with additional current and flow-related work, in particular, leakage-rectified linear units (LreLU), ELU, and rectified linear units (ReLU). While most of the scientists using ReLU here as activation function behind this model, the neuron loses the analysis after the effects of the network parameters have been updated [46] when the input function gradient becomes extremely high. In this analysis, the ELU research was used because it indicates that ECG arrhythmia was the best clustered. In Eq. (1) ELU is shown,
A Mean Squared Error (MSE) specified in (2) shall be used to reconstruct between the input signal and output signal
The parameters of a layer to which comparison is made are slightly modified in the deep learning, and the extent of the data limits from the last layer will take a further phase. This mystery is regarded as the equilibrium of offset covariates. We have applied a normalization layer to the network layout to speed up the configuration during training and keep away from the gradient expansion of the model. In those words, the normalization of the batch during any modification of the system structure feature ensures that the transformation of specific clusters is retained within a particular range, thus speeding up the combination of parameters [47]. The batch normalization locations are used periodically before and during the activation function. The ELU function has been placed until the normalization layer of the cluster and significant outcomes have been obtained in the analyses of this operation. This lead to an ELU experiment being carried out in each convolution block before the batch normalization layer. A two-dimensional, intense pooling was formed behind each convolution hinder. Eq. (3) was calculated for batch normalization.
where the standardized output is a(t), μ and σ reflect the same batch’s mean and variance; and ′ is compatible and has 0.001 value.
Over fitting is a significant issue in the training of the model [48]. In this aspect, the regularization of the dropout is being used to prevent over fitting a training model. Simultaneously, we also propose correlations with models where could not have dropout regularization at the same level. Probably an amount of every hub in a similar layer is discarded by dropout regularization to reduce conditions between layers. When neurons are exit, the corresponding weight will be prohibited, which incredibly enhances a model capacity. The model beyond regularization adds all weights to the learning process throughout the training period, which greatly increases the connection between the layers, causing over fitting difficulties. During experimentation with dropout regularization, it was located at the last fully connected layer of the model. The dropout rate had been 0.5.
The exactness of the model was used as the preliminary parameter in the evaluation of the performance. The proportion from the appropriate outputs that a classification executes is defined by accuracy. By accuracy, we obtain a measure behind this model’s accurate predictions across a wide range of expectations in Eq. (4).
Accuracy has become a wonderful attribute whether two slightly more types of data are modified. In all cases, since the dataset is imbalanced, execution tests are not accurate. Often, accuracy will not think about the inaccurate performance, relies on better performance. In the performance evaluation, it is best to take into consideration both accurate and accurate predictions of the model is obtained by Eq. (5). So, we would like to include the F1 in our thoughts in this way. F1 is the weighted average of accuracy and measurement, which finds all false positives and false negatives.
True Positive (TP): The accuracy of the ECG signal, predicted by the model.
True Negative (TN): If there were no precision in the ECG signal and the model predicted it.
False Positive (FP): The model expected an inaccuracy if the ECG signal had no specific feature yet.
False Negative (FN): The algorithm predicts that the character does not have any anomalies while the ECG signal becomes abnormal.
Accurate findings here are the number of positive outcomes relative to the optimistic assumption of the standard and recall is the number of positive results that are correct above the number of cases that would be supposed to have been good. A model that generally makes a small and fair distinction between the real characteristics and the desired qualities for preparation, approval, and test set would be a decent model. The presentation of our model has been evaluated through accuracy, precision, recall, and F1 score.
In this analysis, the intent of the imbalanced ECG signal classification was implemented in the configuration of CNN-LSTM. The ECG beat data were categorized according to the LSTM model and then we built a CNN-LSTM configuration using FCL. A fully connected Layer’s acceptable practicality was clear for the type of ECG imbalanced rhythms. By contrast and best in class strategies, we confirmed the viability of the LSTM network structure. Mainly the MIT-BIH rhythmic database was the main source of the proposed model. As the AAMI standards specify, all MIT-BIH beats are collected into five main classes. Nevertheless, that is typically not desirable. The ECG beat and the accuracy of the beat forms will decide the form of arrhythmia.
The MIT-BIH Arrhythmia procedure was assessed with the PTB Diagnostic ECG database results. For other instances, we have taken 185 subjects from each of these unfortunate topics in a PTB reference and 25 from 12 separate meetings (2 from PTB and 10 from MIT-BIH). So, we consider 185 examples from sound and embarrassing articles for each of which the machine is not prepared for can be made at the moment. Our experiments are known as F1-score as we consider and evaluate their precision. In every case, Tab. 2 indicates that the impacts on the standard class are both expanded, including the precision, analysis, and F1 score. In addition, while the sum of usually ECG signals effectively classified decreased (between 16,550 and 16,575) the sum of abnormal signals wrongly marked as normal signals have decreased substantially. Tab. 2 also reveals that the F1-score has been further increased for minority classes S is 97.23% and F is 96.42%. Tab. 3 illustrates the changes in other relevant techniques in writing the different quality networks in our methodology. Hypothesized, we found that using a dropout regularizer helps to boost the appearance of the latent vector and keep it as flat and stable as possible at the same time. Expert in a specific idle function contributes to a stronger restructuring from the input signal. We efficiently demonstrate from the findings that regularization often enhances the model and typically increases model accuracy.


Fig. 7 demonstrates the accuracy and loss of changes to training and test. Therefore, the training also extended in quite a stable state and settled in roughly 35 epochs to verify this model. The model’s deals evaluation used the following performance measurements such us accuracy, R-squared, RMSE, and computation time. The CNN-LSTM with the FCL hybrid model reached 99.33% accuracy, 0.873% R-squared, 0.16% RMSE, and 20% computation time reduced after exploratory tests. Fig. 8 shows the different types of cardiac diseases classified through the proposed architecture. From this figure, we obtain the five types of disease classified and we consider the duration peek R-R interval.
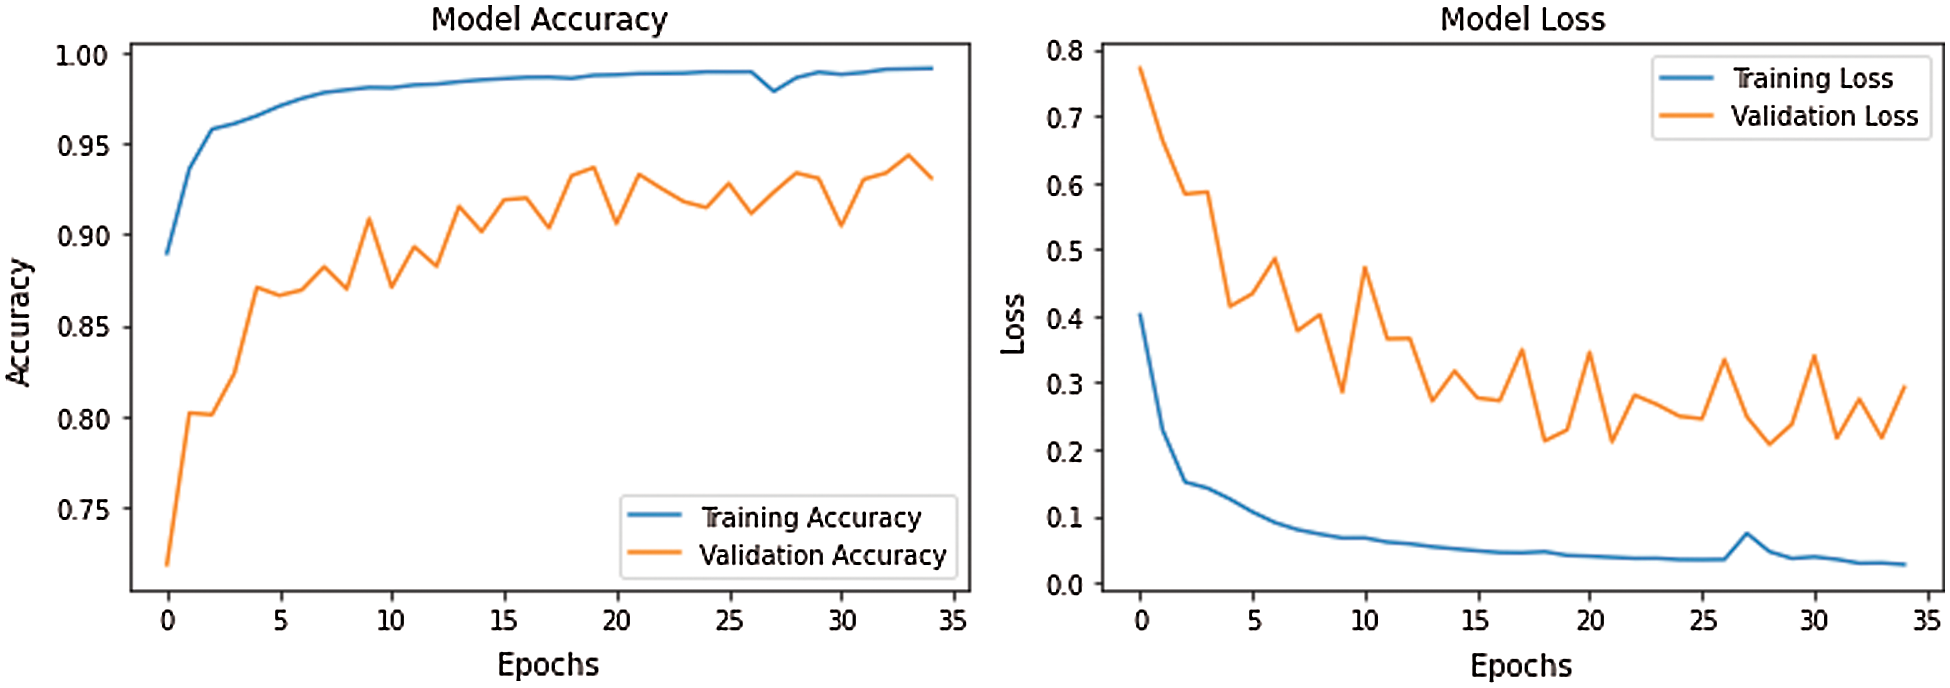
Figure 7: CNN-LSTM with FCL configurations for accuracy and losses
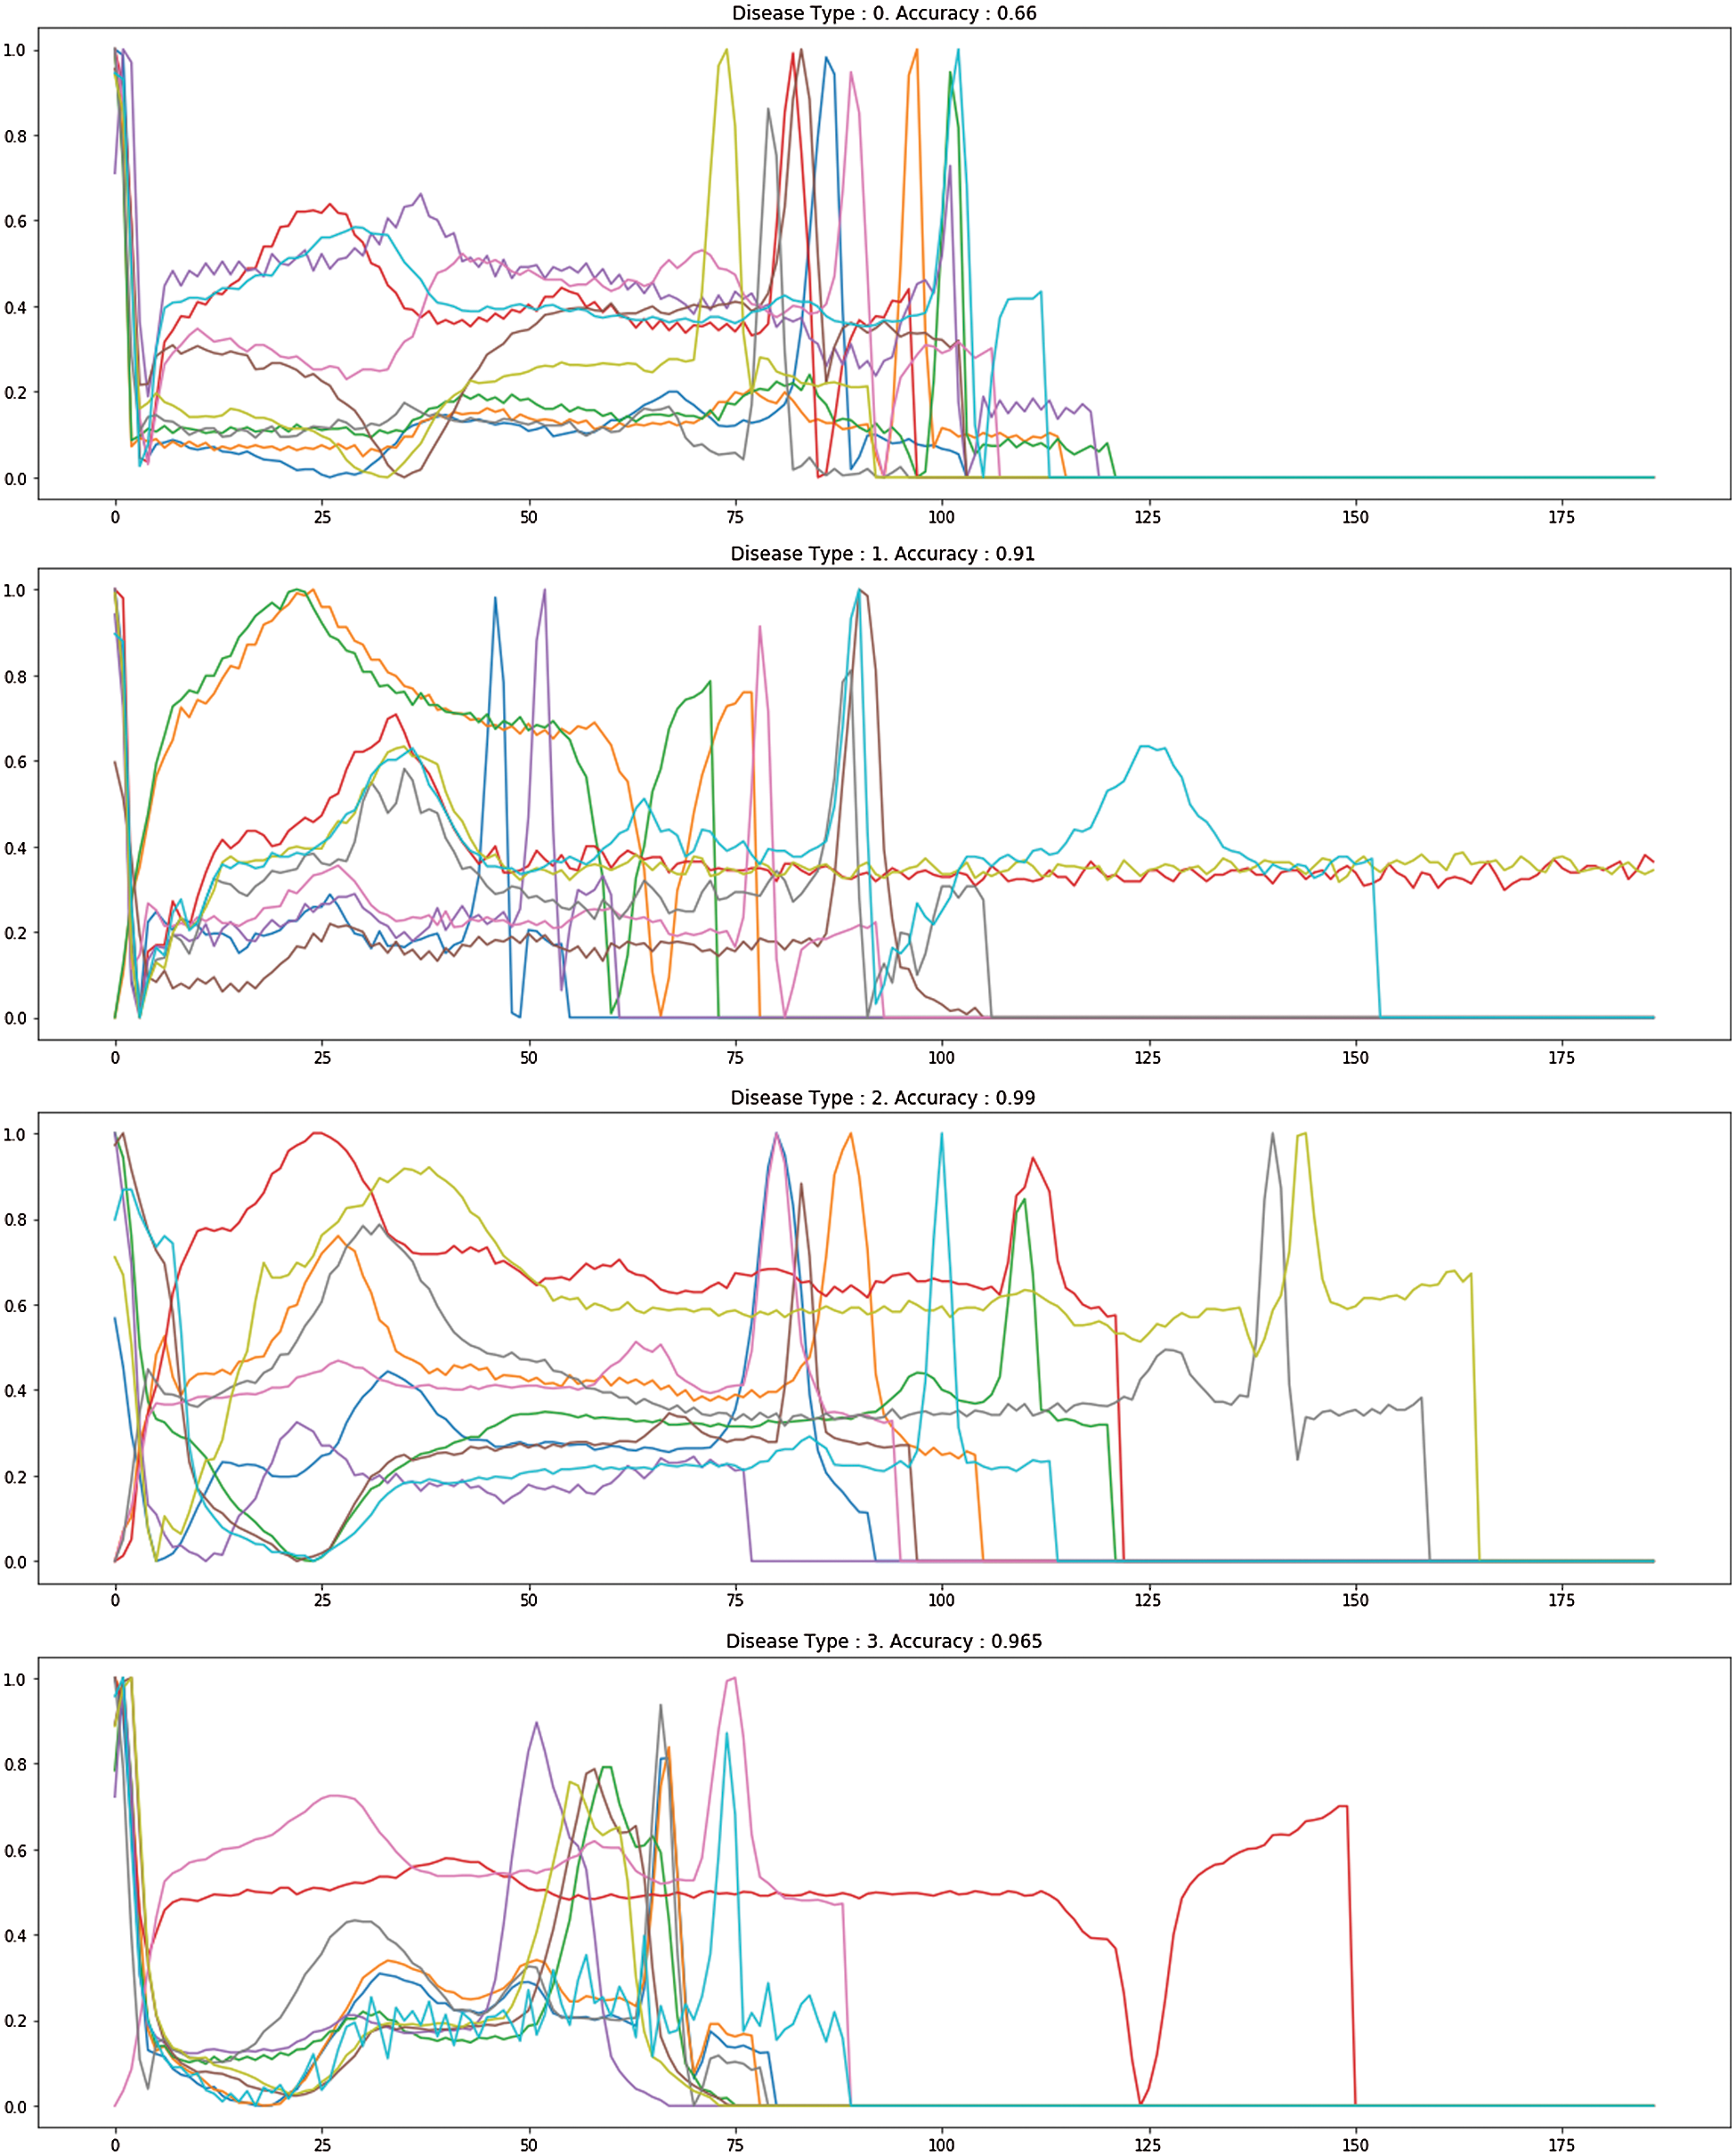
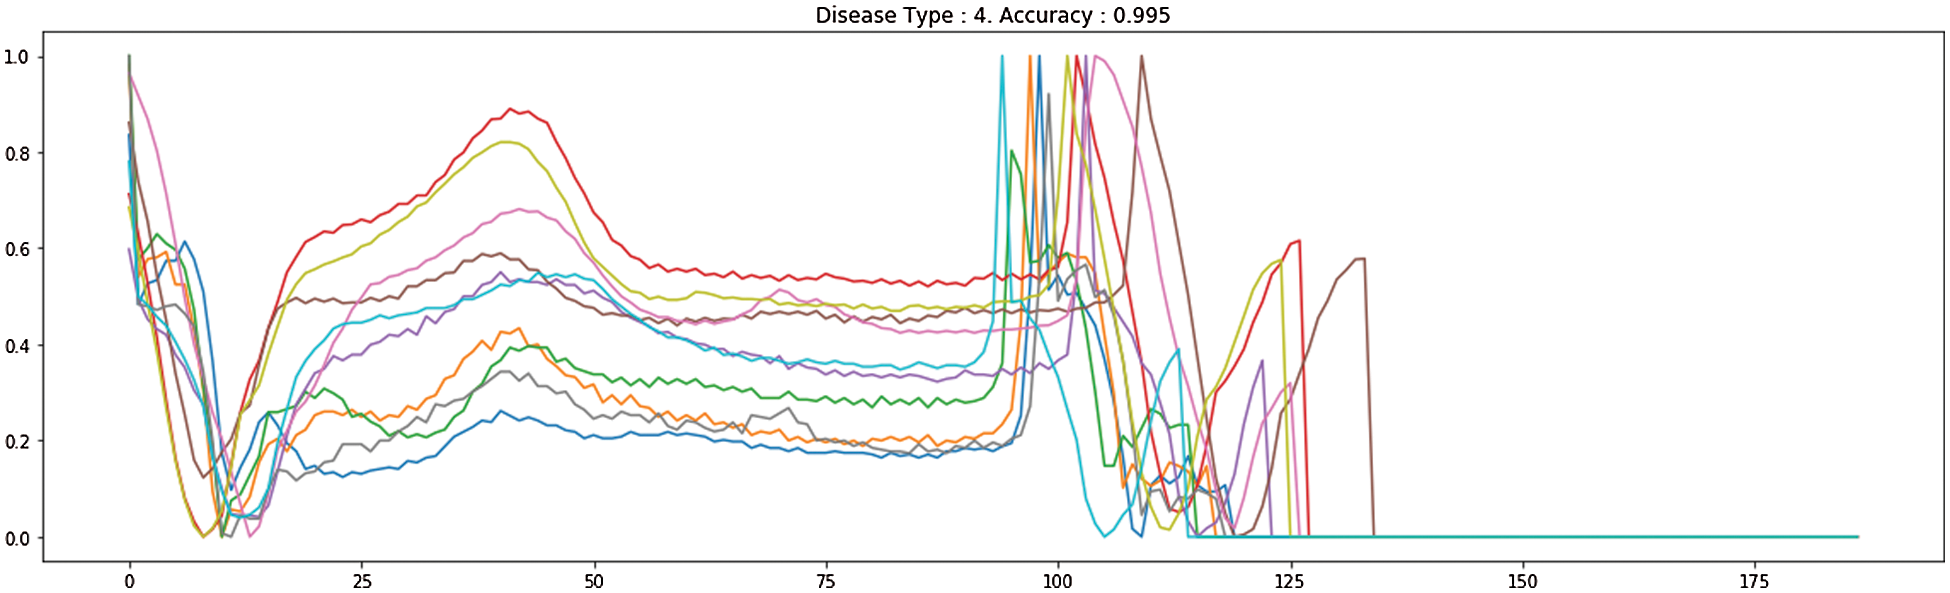
Figure 8: The proposed different heart disease classification
Tab. 4 demonstrates the high performance of our proposed CNN-LSTM and FCL. The similarity between our analysis and the numerous research is that we used deep learning how ECG imbalanced beat information was to be categorized in the classification. We suggested an LSTM with FCL for the classification of imbalanced ECG arrhythmias. The classification of imbalanced ECG data is often based on literature. The key difference is that our work uses FCL to change the loss function, which allows the LSTM mainly on examining abnormal ECG beats which appear to be misclassified and boost the accuracy of arrhythmia. Concerning Recall, the best results on the test set are achieved in our CNN-LSTM with FCL. It suggests that the incorrect outcomes, i.e., abnormal ECG beats, are erroneously attributed to regular ECG beats.
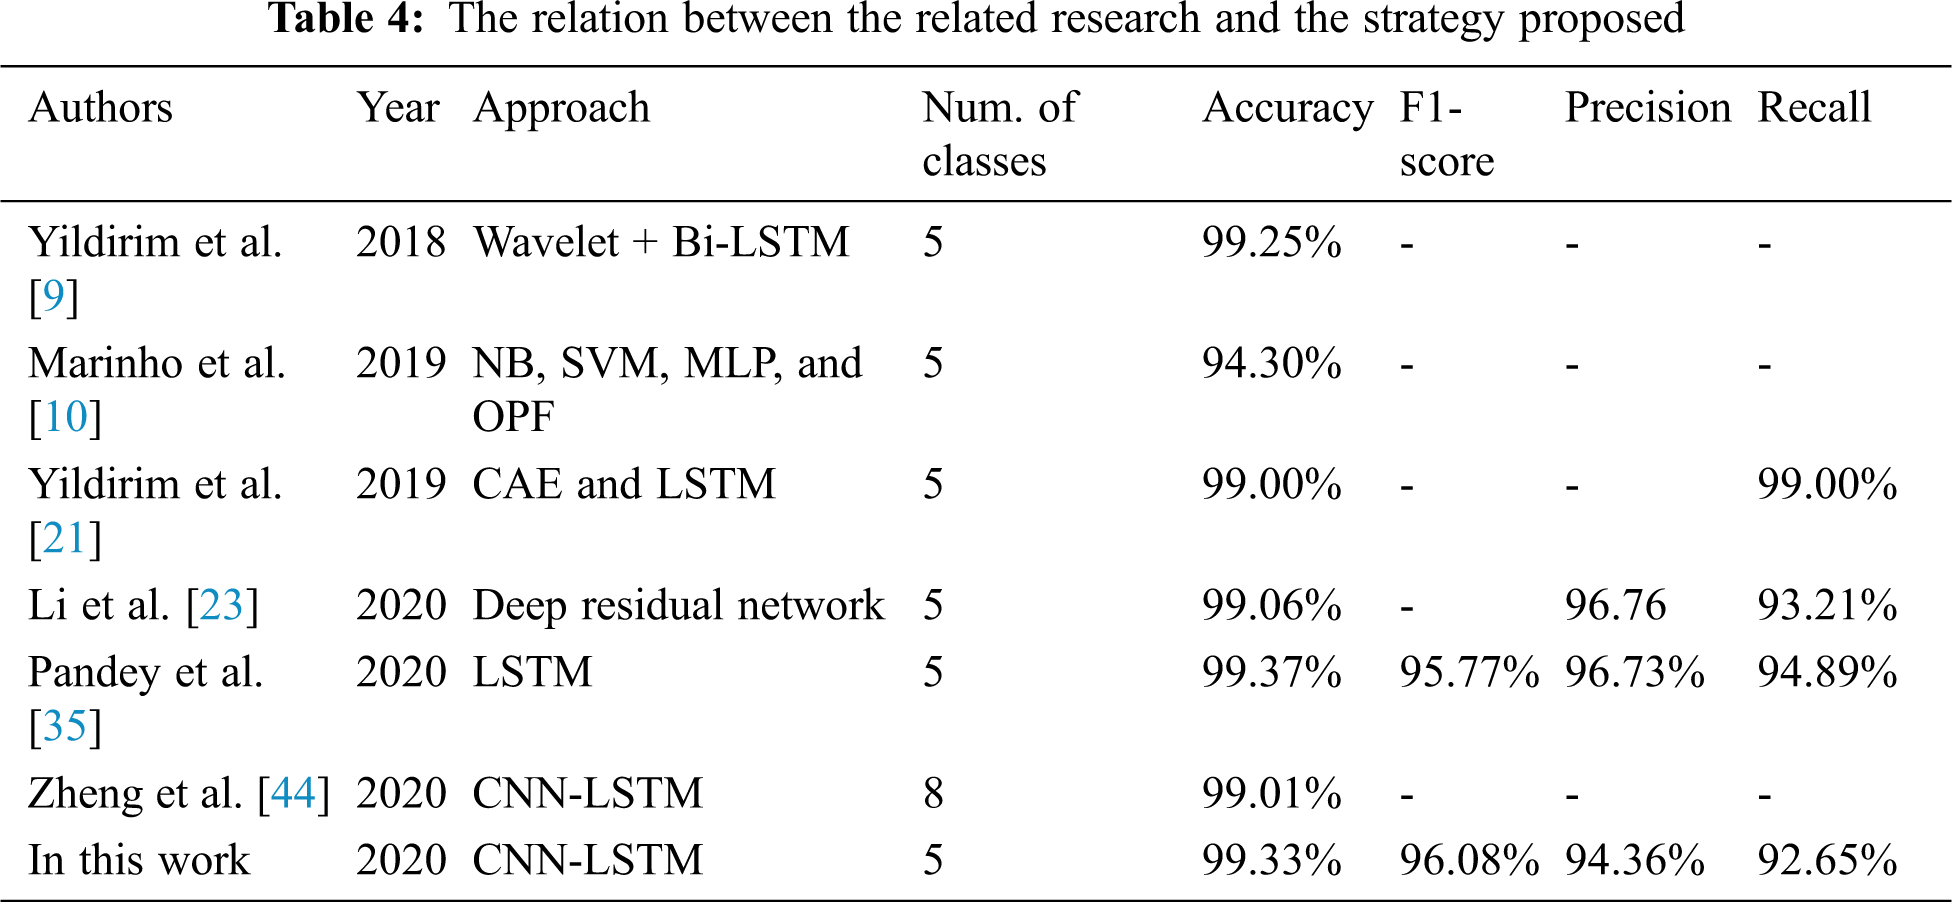
The early diagnosis of cardiovascular infection is focused on exploration and distinction signs of arrhythmia. Throughout this analysis we proposed the interaction between CNN-LSTM and FCL to improve the preparedness influence, limiting the effects on the model training of an enormous amount of basic specific ECG beat information. The proposed architecture utilizes CNNs to decrease each spectral variation in the input feature but instead moves it on to LSTM layers while providing outputs to DNN layers, which have a more effective feature representation. The findings indicate that CNN-LSTM and FCL have obtained 99.33%, 96.06%, 94.36%, and 92.65%, individually, with the results being accuracy, F1 score, precision, and recall. The adequacy and intensity of the proposed architecture were seen by the MIT-BIH arrhythmic test results. The methodology proposed could be used to help cardiologists in diagnosing ECGs with a better level of accuracy and impartiality in telemedicine scenarios. In conclusion, in future examinations, various kinds and specific beats will be included. In addition, to analyze the appearance of the CNN LSTM using the FCL pattern, we intend also to introduce specific rates of noise to ECG signals.
Funding Statement: The authors received no specific funding for this study.
Conflicts of Interest: The authors declare that they have no conflicts of interest to report regarding the present study.
1. O. S. Lih, V. Jahmunah, T. R. San, E. J. Ciaccio, T. Yamakawa et al., “Comprehensive electrocardiographic diagnosis based on deep learning,” Artificial Intelligence in Medicine, vol. 103, pp. 101789, 2020. [Google Scholar]
2. P. Dewinta and A. Menaldi, “Cognitive behavior therapy for generalized anxiety disorder: A case study of arrhythmia patient,” Humaniora, vol. 9, no. 2, pp. 161–171, 2018. [Google Scholar]
3. R. Willis, “Clinical approach to arrhythmias and intermittent collapse,” Guide to Canine and Feline Electrocardiography, 2018 John Wiley & Sons Ltd., Chapter, 12, pp. 189–200, 2018. [Google Scholar]
4. K. A. Alfarhan, M. Y. Mashor, A. R. Mohd Saad, H. A. Azeez and M. M. Sabry, “Effects of the window size and feature extraction approach for arrhythmia classification,” Journal of Biomimetics, Biomaterials and Biomedical Engineering,” Trans Tech Publications Ltd, vol. 30, pp. 1–11, 2017. [Google Scholar]
5. Y. Hagiwara, H. Fujita, S. L. Oh, J. H. Tan, R. San Tan et al., “Computer-aided diagnosis of atrial fibrillation based on ECG signals: A review,” Information Sciences, vol. 467, pp. 99–114, 2018. [Google Scholar]
6. U. B. Baloglu, M. Talo, O. Yildirim, R. San Tan and U. R. Acharya, “Classification of myocardial infarction with multi-lead ECG signals and deep CNN,” Pattern Recognition Letters, vol. 122, pp. 23–30, 2019. [Google Scholar]
7. S. K. Berkaya, A. K. Uysal, E. S. Gunal, S. Ergin, S. Gunal et al., “A survey on ECG analysis,” Biomedical Signal Processing and Control, vol. 43, pp. 216–235, 2018. [Google Scholar]
8. I. Kavakiotis, O. Tsave, A. Salifoglou, N. Maglaveras, I. Vlahavas et al., “Machine learning and data mining methods in diabetes research,” Computational and Structural Biotechnology Journal, vol. 15, pp. 104–116, 2017. [Google Scholar]
9. Ö. Yildirim, “A novel wavelet sequence based on a deep bidirectional LSTM network model for ECG signal classification,” Computers in Biology and Medicine, vol. 96, pp. 189–202, 2018. [Google Scholar]
10. L. B. Marinho, N. de MM Nascimento, J. W. M. Souza, M. V. Gurgel, P. P. Rebouças Filho et al., “A novel electrocardiogram feature extraction approach for cardiac arrhythmia classification,” Future Generation Computer Systems, vol. 97, pp. 564–577, 2019. [Google Scholar]
11. P. Pławiak, “Novel methodology of cardiac health recognition based on ECG signals and evolutionary-neural system,” Expert Systems with Applications, vol. 92, pp. 334–349, 2018. [Google Scholar]
12. Ö. Yıldırım, P. Pławiak, R. S. Tan and U. R. Acharya, “Arrhythmia detection using deep convolutional neural network with long duration ECG signals,” Computers in Biology and Medicine, vol. 102, pp. 411–420, 2018. [Google Scholar]
13. B. G. Arndt, J. W. Beasley, M. D. Watkinson, J. L. Temte, W. J. Tuan et al., “Tethered to the EHR: Primary care physician workload assessment using EHR event log data and time-motion observations,” The Annals of Family Medicine, vol. 15, no. 5, pp. 419–426, 2017. [Google Scholar]
14. S. Xiao, J. Yan, M. Farajtabar, L. Song, X. Yang et al., “Joint modeling of event sequence and time series with attentional twin recurrent neural networks,” ArXiv abs/1703.08524: n. pag., 2017. [Google Scholar]
15. W. Rawat and Z. Wang, “Deep convolutional neural networks for image classification: A comprehensive review,” Neural Computation, vol. 29, no. 9, pp. 2352–2449, 2017. [Google Scholar]
16. D. Li, J. Zhang, Q. Zhang and X. Wei, “Classification of ECG signals based on 1D convolution neural network,” in Proc. of Int. Conf. on e-Health Networking, Applications and Services (HealthcomIEEE, Dalian, China, pp. 1–6, 2017. [Google Scholar]
17. Prakash, Allam Jaya and S. Ari, “A system for automatic cardiac arrhythmia recognition using electrocardiogram signal,” Bioelectronics and Medical Devices. San Francisco, CA: Elsevier, pp. 891–911, 2019. [Google Scholar]
18. L. Wang, Y. Mu, J. Zhao, X. Wang and H. Che, “IGRNet: A deep learning model for non-invasive, real-time diagnosis of prediabetes through electrocardiograms,” Sensors, vol. 20, no. 9, pp. 2556, 2020. [Google Scholar]
19. N. D. Bruce, C. Wloka, N. Frosst, S. Rahman and J. K. Tsotsos, “On computational modeling of visual saliency: Examining what’s right, and what’s left,”Vision Research, vol. 116, pp. 95–112, 2015. [Google Scholar]
20. A. E. U. Cerna, “Large scale electronic health record data and echocardiography video analysis for mortality risk prediction,” Doctoral Dissertation, The University of New Mexico, 2019. [Google Scholar]
21. O. Yildirim, U. B. Baloglu, R. S. Tan, E. J. Ciaccio and U. R. Acharya, “A new approach for arrhythmia classification using deep coded features and LSTM networks,” Computer Methods and Programs in Biomedicine, vol. 176, pp. 121–133, 2019. [Google Scholar]
22. M. Liu, M. Wang, J. Wang and D. Li, “Comparison of random forest, support vector machine and back propagation neural network for electronic tongue data classification: Application to the recognition of orange beverage and Chinese vinegar,” Sensors and Actuators B: Chemical, vol. 177, pp. 970–980, 2013. [Google Scholar]
23. Z. Li, D. Zhou, L. Wan, J. Li and W. Mou, “Heartbeat classification using deep residual convolutional neural network from 2-lead electrocardiogram,” Journal of Electrocardiology, vol. 58, pp. 105–112, 2020. [Google Scholar]
24. R. Miotto, L. Li, B. A. Kidd and J. T. Dudley, “Deep patient: An unsupervised representation to predict the future of patients from the electronic health records,” Scientific Reports, vol. 6, no. 1, pp. 1–10, 2016. [Google Scholar]
25. A. Artetxe, A. Beristain and M. Grana, “Predictive models for hospital readmission risk: A systematic review of methods,” Computer Methods and Programs in Biomedicine, vol. 164, pp. 49–64, 2018. [Google Scholar]
26. C. Krittanawong, A. S. Bomback, U. Baber, S. Bangalore, F. H. Messerli et al., “Future direction for using artificial intelligence to predict and manage hypertension,” Current Hypertension Reports, vol. 20, no. 9, pp. 75, 2018. [Google Scholar]
27. A. B. Rad, M. Zabihi, Z. Zhao, M. Gabbouj, A. K. Katsaggelos et al., “Automated polysomnography analysis for detection of non-apneic and non-hypopneic arousals using feature engineering and a bidirectional LSTM network,” arXiv preprint arXiv: 1909.02971, 2019. [Google Scholar]
28. P. Bizopoulos and D. Koutsouris, “Deep learning in cardiology,” IEEE Reviews in Biomedical Engineering, vol. 12, pp. 168–193, 2018. [Google Scholar]
29. E. Kiperwasser and Y. Goldberg, “Simple and accurate dependency parsing using bidirectional LSTM feature representations,” Transactions of the Association for Computational Linguistics, vol. 4, pp. 313–327, 2016. [Google Scholar]
30. F. Milletari, N. Navab and S. A. Ahmadi, “V-net: Fully convolutional neural networks for volumetric medical image segmentation,” in Proc. of Fourth International Conference on 3D Vision (3DVIEEE, Stanford, CA, USA, pp. 565–571, October 2016. [Google Scholar]
31. P. Liu, X. Qiu and X. Huang, “Adversarial multi-task learning for text classification,” arXiv preprint arXiv: 1704.05742, 2017. [Google Scholar]
32. S. N. Kasthurirathne, “The use of clinical, behavioral, and social determinants of health to improve identification of patients in need of advanced care for depression,” Doctoral Dissertation, 2018. [Google Scholar]
33. K. Seetharam, S. Shrestha and P. P. Sengupta, “Artificial intelligence in cardiovascular medicine,” Current Treatment Options in Cardiovascular Medicine, vol. 21, no. 6, pp. 25, 2019. [Google Scholar]
34. P. C. Austin, J. V. Tu, J. E. Ho, D. Levy and D. S. Lee, “Using methods from the data-mining and machine-learning literature for disease classification and prediction: A case study examining classification of heart failure subtypes,” Journal of Clinical Epidemiology, vol. 66, no. 4, pp. 398–407, 2013. [Google Scholar]
35. S. K. Pandey and R. R. Janghel, “Automatic arrhythmia recognition from electrocardiogram signals using different feature methods with long short-term memory network model,” Signal, Image and Video Processing, vol. 14, pp. 1255–1263, 2020. [Google Scholar]
36. S. S. Azam, M. Raju, V. Pagidimarri and V. C. Kasivajjala, “Cascadenet: An LSTM based deep learning model for automated ICD-10 coding,” in Future of Information and Communication Conf., Springer, Cham, pp. 55–74, March 2019. [Google Scholar]
37. A. FernáNdez, V. LóPez, M. Galar, M. J. Del Jesus and F. Herrera, “Analysing the classification of imbalanced data-sets with multiple classes: Binarization techniques and ad-hoc approaches,” Knowledge-Based Systems, vol. 42, pp. 97–110, 2013. [Google Scholar]
38. H. Ge, K. Sun, L. Sun, M. Zhao and C. Wu, “A selective ensemble learning framework for ECG-based heartbeat classification with imbalanced data,” in Proc. of Int. Conf. on Bioinformatics and Biomedicine (BIBMIEEE, Madrid, Spain, pp. 2753–2755, 2018. [Google Scholar]
39. S. K. Berkaya, A. K. Uysal, S. Gunal, S. Ergin, M. B. Gulmezoglu et al., “A survey on ECG analysis,” Biomedical Signal Processing and Control, vol. 43, pp. 216–235, 2018. [Google Scholar]
40. H. Ghasemzadeh, S. Ostadabbas, E. Guenterberg and A. Pantelopoulos, “Wireless medical-embedded systems: A review of signal-processing techniques for classification,” IEEE Sensors Journal, vol. 13, no. 2, pp. 423–437, 2012. [Google Scholar]
41. J. M. Johnson and T. M. Khoshgoftaar, “Survey on deep learning with class imbalance,” Journal of Big Data, vol. 6, no. 1, pp. 27, 2019. [Google Scholar]
42. W. Liu, Z. Wang, X. Liu, Y. Liu, F. E. Alsaadi et al., “A survey of deep neural network architectures and their applications,” Neurocomputing, vol. 234, pp. 11–26, 2017. [Google Scholar]
43. S. Pouyanfar, S. Sadiq, Y. Yan, H. Tian, Y. Tao et al., “A survey on deep learning: Algorithms, techniques, and applications,” ACM Computing Surveys (CSUR), vol. 51, no. 5, pp. 1–36, 2018. [Google Scholar]
44. Z. Zheng, Z. Chen, F. Hu, J. Zhu, Q. Tang et al., “An automatic diagnosis of arrhythmias using a combination of CNN and LSTM technology,” Electronics, vol. 9, no. 1, pp. 121, 2020. [Google Scholar]
45. T. N. Sainath and B. Li, “Modeling time-frequency patterns with LSTM vs. convolutional architectures for LVCSR tasks,” in Proc. of Annual Conf. of the Int. Speech Communication Association, San Francisco, CA, USA, 2016. [Google Scholar]
46. S. Han, H. Mao and W. J. Dally, “Deep compression: Compressing deep neural networks with pruning, trained quantization and huffman coding,” arXiv: Computer Vision and Pattern Recognition: n. pag., 2016. [Google Scholar]
47. T. N. Sainath, O. Vinyals, A. Senior and H. Sak, “Convolutional, long short-term memory, fully connected deep neural networks,” in Proc. of Int. Conf. on Acoustics, Speech and Signal Processing (ICASSPBrisbane, Australia, pp. 4580–4584, 2015. [Google Scholar]
48. S. S. Liew, M. Khalil-Hani and R. Bakhteri, “Bounded activation functions for enhanced training stability of deep neural networks on visual pattern recognition problems,” Neurocomputing, vol. 216, pp. 718–734, 2016. [Google Scholar]
 | This work is licensed under a Creative Commons Attribution 4.0 International License, which permits unrestricted use, distribution, and reproduction in any medium, provided the original work is properly cited. |