DOI:10.32604/iasc.2022.020189
| Intelligent Automation & Soft Computing DOI:10.32604/iasc.2022.020189 | |
| Article |
CGraM: Enhanced Algorithm for Community Detection in Social Networks
Department of Computer Science and Engineering, College of Engineering, Guindy, Anna University, Chennai, Tamilnadu, India
*Corresponding Author: Kalaichelvi Nallusamy. Email: pnkalai@gmail.com
Received: 13 May 2021; Accepted: 17 June 2021
Abstract: Community Detection is used to discover a non-trivial organization of the network and to extract the special relations among the nodes which can help in understanding the structure and the function of the networks. However, community detection in social networks is a vast and challenging task, in terms of detected communities accuracy and computational overheads. In this paper, we propose a new algorithm Enhanced Algorithm for Community Detection in Social Networks – CGraM, for community detection using the graph measures eccentricity, harmonic centrality and modularity. First, the centre nodes are identified by using the eccentricity and harmonic centrality, next a preliminary community structure is formed by finding the similar nodes using the jaccard coefficient. Later communities are selected from the preliminary community structure based on the number of inter-community and intra-community edges between them. Then the selected communities are merged till the modularity improves to form the better resultant community structure. This method is tested on the real networks and the results are evaluated using the evaluation metrics modularity and Normalized Mutual Information (NMI). The results are visualized and also compared with the state-of-the-art algorithms that covers louvian, walktrap, infomap, label propagation, fast greedy and eigen vector for more accurate analysis. CGraM achieved the better modularity and improved NMI values comparatively with other algorithms and gives improved results collaboratively when compared to previous methods.
Keywords: Social network; community detection; eccentricity; centrality; jaccard co-efficient; modularity
As we are aligning towards online for every day to day activities, the demand on social data spike higher and higher. People interaction, opinion on products and policies are happening over the web in the form of social platforms, thus in fact gets as a source data for everything from an ordinary petty shop merchandiser to a head of state.
Social platforms take everything to a global stage, where there are no demographic limitations. Today’s internet trend has led to a virtualized social world where people form groups, communities to interact and share information and this form of networking is widely called a social network. To name a few Facebook, Twitter, LinkedIn, Instagram etc. are the popular ones in today’s world. The study of such networks leads further towards interdisciplinary research fields.
The social media data is heterogeneous in nature, thus complexes the network as the links and contents are added everyday without clear definition. Since this is the heavily used channel of communication, its enormous data demands the researchers and scientists to go into a vast level of data computation.
Social Network Analysis (SNA) enables the study of social phenomena with a specified social setting. The analysis is predominantly carried out based on a small community or social networking group. Group of users with similar characteristics are classified as community and it represents the basic functional unit in a particular social network. A dense subgroup could represent a community where nodes inside the sub graph lead strongly connecting with comparable nodes out of the immediate sub graph path. For instance, a set of readers who subscribe to magazines in the same area of practice and a age group who aspires for a college seeking entrance course.
The procedure of finding groups of users with similar characteristics from the network is known as community detection (CD). Community detection is used to determine the structure and function of the network and to extract the special relationship among the nodes. This can be done in three different ways like using topological features or using additional information associated with nodes and edges or combination of both [1]. For example, a graph depicted in Fig. 1 has three communities showing inter-community and intra-community edges.

Figure 1: A graph with three communities
Community determination is the key factor in a variety of applications [2] in social network analysis, as this helps including customer segmentation, recommendations, link inference, and vertex labeling and influence analysis. Considering the huge data in bigger networks, the task of detecting the communities is much complicated. Hence community detection is one of the emerging areas of focus in social network analysis. Due to the complexity and the scale of data growth the quality and scalability are the major issues, thus opening the demand and urgency to sharpen the community detection tools and techniques. The remainder of the paper is arranged as follows. Section 2 gives a brief literature survey of community detection algorithms. Proposed method is explained in Section 3. Data sets description, evaluation metrics and experimental results are presented in Section 4. Finally the paper finishes with conclusion in Section 5.
Considerable number of works [3] has been carried out in the past in the area of community detection and different algorithms [4] are available for detecting communities. These methods are mainly categorized into: modularity-based algorithms, spectral algorithms, hierarchical algorithms, clustering algorithms, random walk based algorithms, label propagation algorithms, graph technique based algorithms and algorithms using information-theoretical measures [5] etc.
Girvan Newman algorithm [6] used a famous standard measure named modularity, for detecting the communities in the network. Afterwards many other algorithms were developed which use modularity as a base that yields good results comparatively and used in many applications like finding research groups [7], product recommendations etc. The modularity measure is modified and combined with the spanning tree [8] for detecting the communities.
Density based method is another type of method for community detection but here [9], the resolution parameter is passed as input in the algorithm. Identifying the weak links and eliminating the same [10] also gives the community structure. But the performance measures like modularity and NMI are less for some networks in this method than other algorithms.
Mathematical programming is an interdisciplinary area which is used for community detection. Integer linear programming model is solved using the 2-Phase method or branch and bound algorithm [11] which detects the communities and gives better results in terms of time and performance. But the modularity is not optimized in this concept. Community detection is also carried out after simplification of the network [12] using the adjacency matrix and neighbors. In this method parameter λ is also passed as input along with the graph G.
Community detection is done using many graph measures like centrality, clustering coefficient, similarity measures, etc. Girvan Newman algorithm [13] finds the communities present in the network using a graph measure called betweenness centrality. Later several enhanced methods were developed using this as a foundation. Another well known measure, clustering coefficient is used to detect the communities [14] in social networks. In this work the algorithm is tested only on two small datasets. These algorithms are technically easier than others like graph partitioning methods in terms of complexity and time. Node similarity technique [15] is used to cluster the nodes into groups, that means most similar nodes are clustered as one group or community.
Clique guided community detection and graph partition methods are the algorithms which use graph concepts for clustering the nodes [16]. Clique percolation technique is merged with a centrality measure [17] to find the community structure from the given graph. But again here major drawback is that some nodes remain unclassified. New similarity measure is used to set the weight of edges [18] of the spanning tree and detect the communities using the minimum spanning tree concept. Like similarity measures, dissimilarity measures are also used for grouping the nodes. A new dissimilarity measure [19] is formed using the neighbor similarity and clustering coefficient for community detection from the networks.
Another way is, identifying the centre nodes using various measures and then applying different types of methods to get communities of the network. For instance, nodes are grouped by finding centre nodes and label propagation technique [20], then the node clusters are merged in later steps for finding the final communities. In this method the complexity is too high for the big networks and needs optimization. The initial community structure is [21] detected using graph measures and then the communities are merged based on a parameter to get the final output. Community-metric threshold parameter is passed as input in this algorithm for merging the communities to get the final community structure from preliminary community structure.
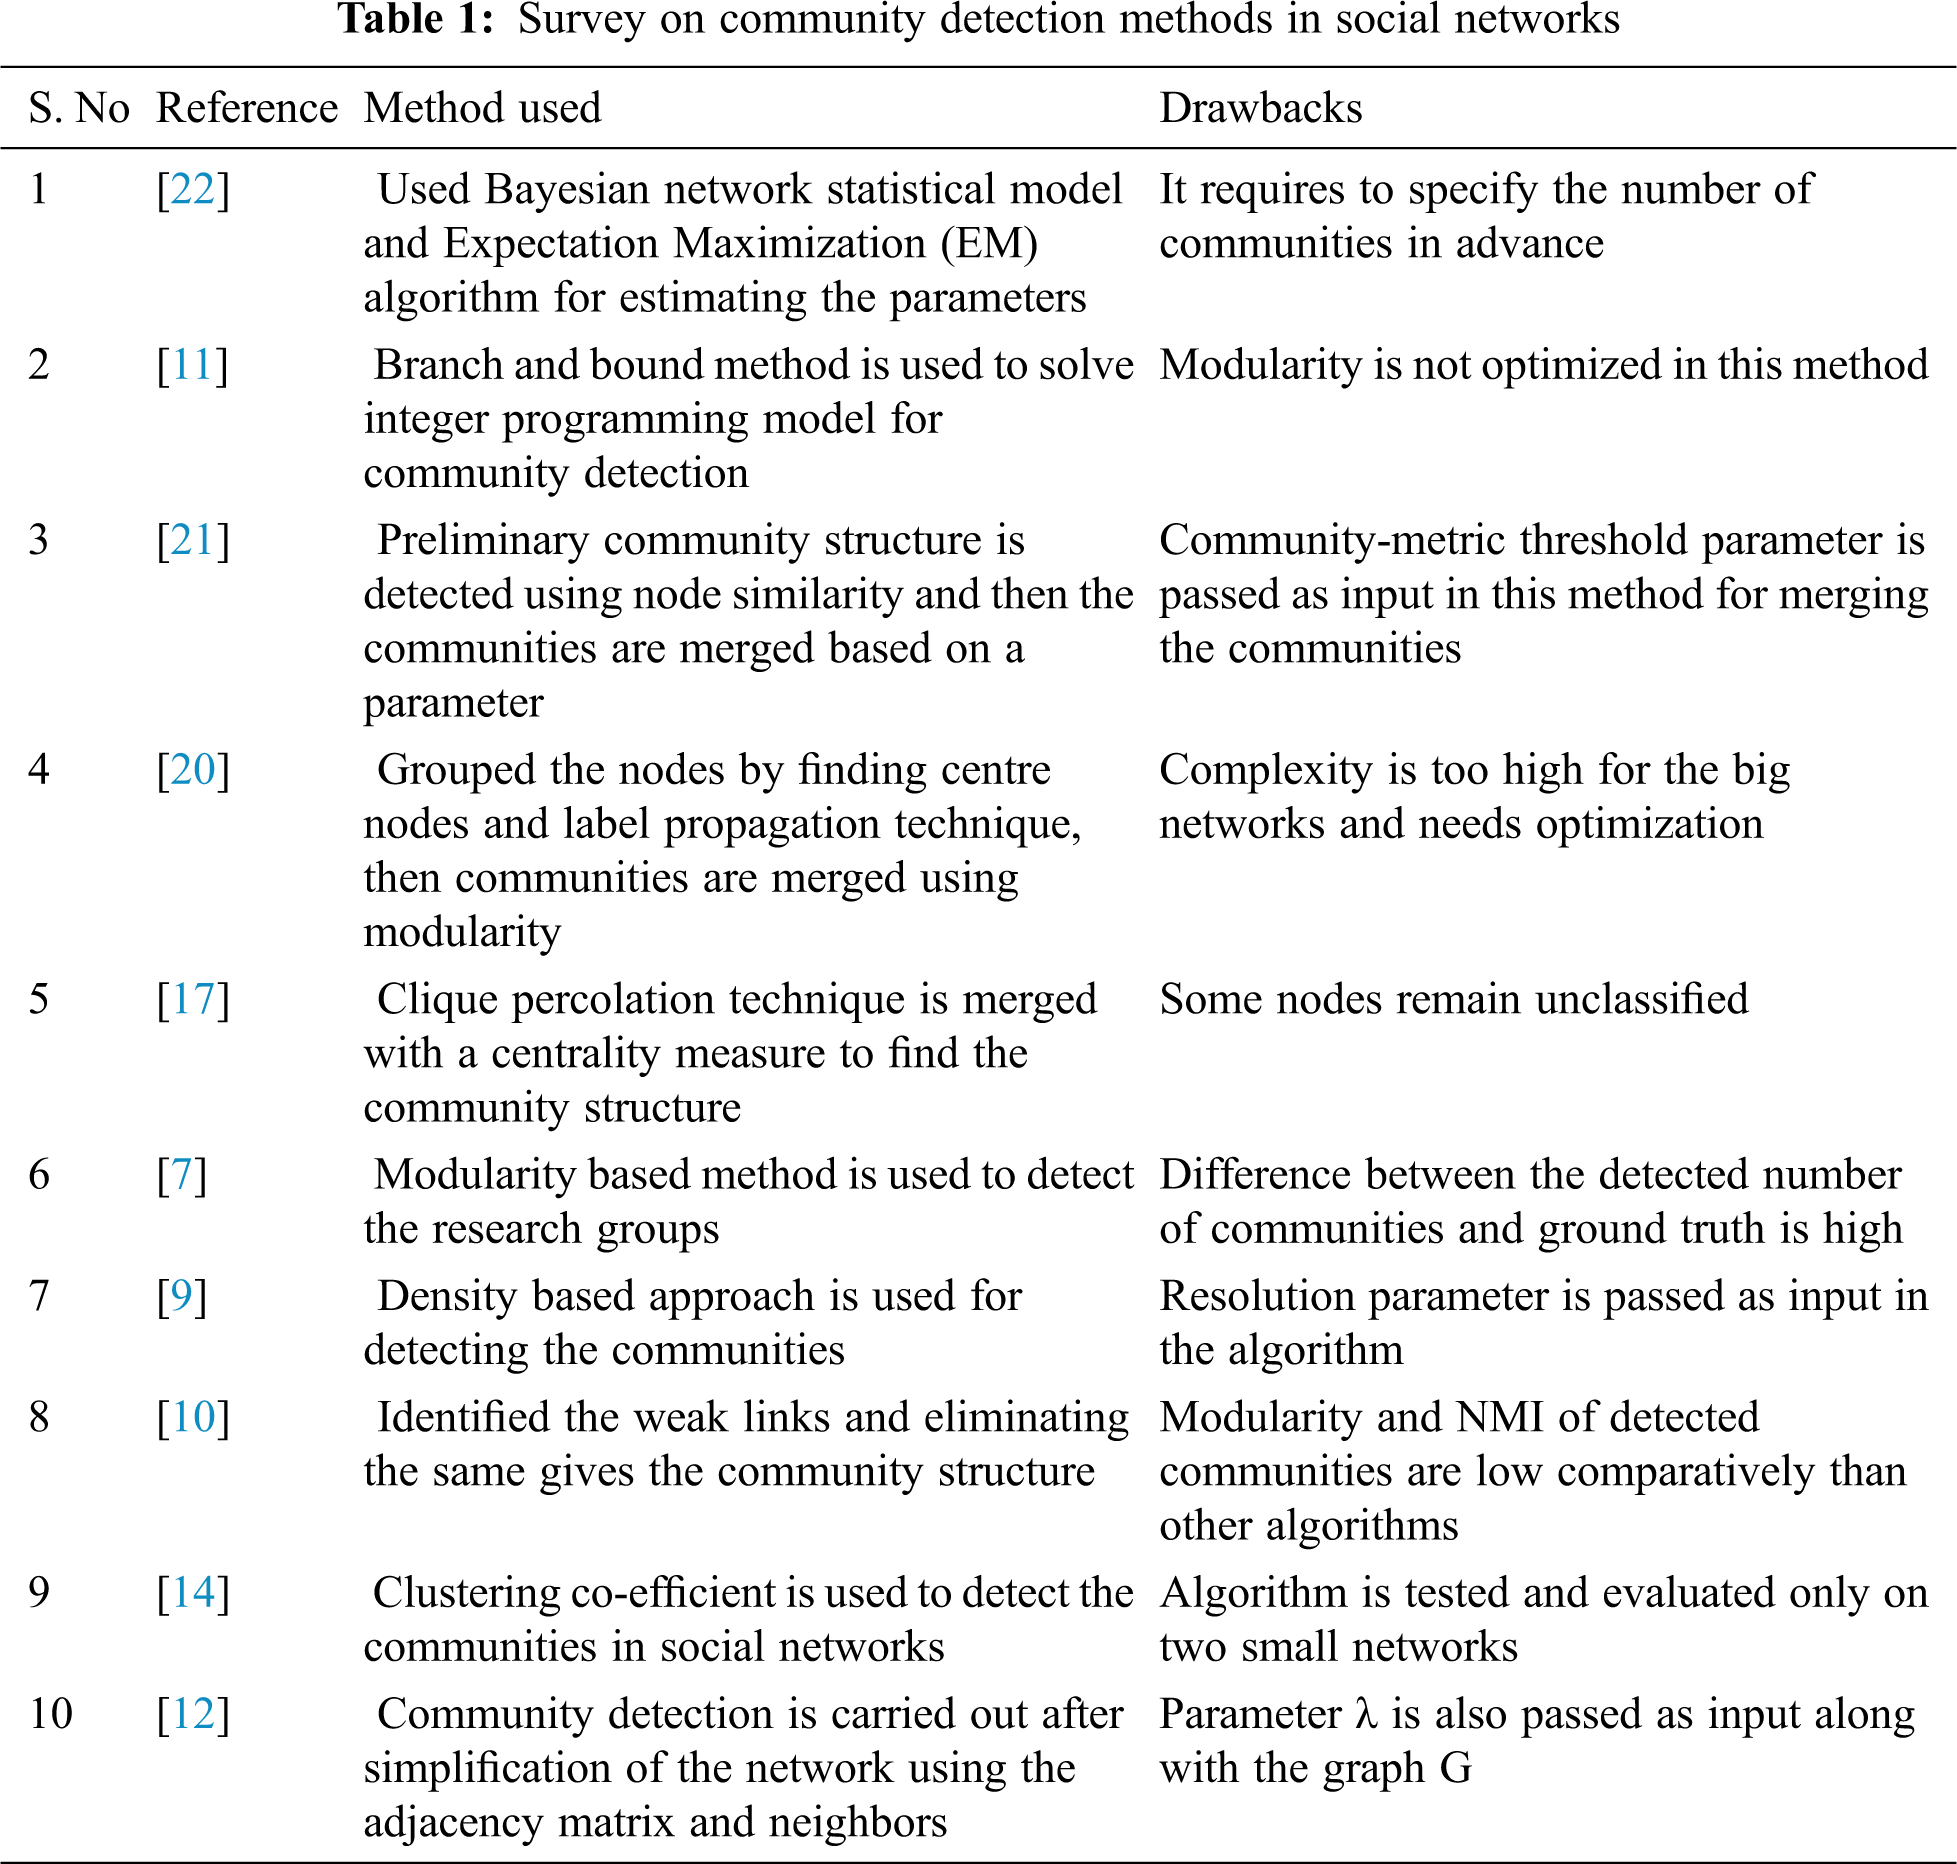
Several existing community detection methods are summarized in Tab. 1 with the drawbacks listed. In the existing algorithms either the number of communities or some threshold value is passed as input with the graph in advance. Also in most of the algorithms modularity and the similarity measure are used separately for detecting the communities. Here in the proposed algorithm CGraM, the modularity with the graph measures like eccentricity, centrality and similarity measure are used for getting better resultant community structure. In addition, this method classifies all the nodes and shows better modularity and improved NMI values comparatively with other algorithms and gives improved results collaboratively when compared to previous methods.
This section briefs about the graph measures that are used and the proposed algorithm CGraM with an example. The architecture diagram for the proposed method is shown in Fig. 2 and it has two major steps. In the first step the initial set of community structure is identified and later, based on the modularity and number of interconnecting edges, communities will be merged to get better resultant community structure.

Figure 2: Architecture diagram
The pseudo code for CGraM is given in Algorithm 1. Input for this algorithm is the undirected, un-weighted graph G(V, E). All communities together form a community set C and is initialized as empty set. Graph G is constructed in the pre-processing step wherein various dataset file formats can be handled dynamically. In this method, the eccentricity and harmonic centrality measures are used to select the centre nodes. The eccentricity of the node u is the maximum distance from u to any other nodes. It is given by:
Harmonic centrality of the node u is the sum of the reciprocal of the shortest path distances from all other nodes to u. That is,
where d(v, u) is the shortest-path distance between v and u.
CGraM works in the following manner. First, centre nodes of the network are identified by minimum eccentricity and maximum harmonic centrality using Eqs. (1) and (2). Minimum eccentricity is used to get the node which has minimum distance to other nodes. Maximum centrality is used to find the node which is centre of all nodes or it has the shortest path to all other nodes. Selecting the node with minimum eccentricity and maximum harmonic centrality gives the most centre node from all the nodes in the given network.
Next, the most similarity node is determined for the centre node which is selected based on eccentricity and harmonic centrality using Eq. (3). If two nodes have more common neighbors then the two nodes are considered as similar nodes. Jaccard coefficient similarity measure is used for finding the similar nodes here. It is a classic similarity measure used in many algorithms. It gives a intuitive measure of similarity between two data sets than other similarity measures. Jaccard coefficient of nodes u and v is given in the below equation.
where N(u) denotes the set of neighbors of u.
The most similar node denoted as v is found for the selected centre node u. If both u and v is not assigned to any community, then create a new community with nodes u and v. Since similar kinds of nodes are in the same community, then either u or v is assigned to any community and append the other similar node v or u also in the same community. This process is repeated until all nodes are assigned to some community and we get the initial community structure with many small communities.
The second major step is merging of sparse communities to get the better resultant community structure by improving the modularity. Modularity is the main measure when we talk about community detection. The strength of division of a network into groups is measured by modularity [23]. Networks with low modularity have sparse connections between the nodes within modules but dense connections between nodes in different modules. Modularity is used in optimization structure in order to detect community networks. It is the difference between the expected numbers of edges from the actual number of edges. Modularity Q is written as:
where eii is the fraction of edges in the network that connect vertices in group i and ai is the fraction of edges that connect vertices in the group with every other group.
Modularity Q can be also represented by:
where,
Here, m is the total number of edges in the given network, Aij is an element of the adjacency matrix of the network, i.e., Aij = 1, if there is an edge between i and j, Aij = 0 otherwise. ki and kj are the degrees of node i and node j respectively. Ci and Cj are the community labels of node i and node j. Delta, the Kronecker delta function is 1 if both i and j belong to the same community, and 0 otherwise.

Here in the proposed algorithm CGraM, the numbers of intra-community and inter-community edges are used as the main factor for merging two communities. Two communities should be merged if they have more connecting edges between them than with other communities.
Let lij is the number of inter-community links between Ci and Cj and is defined as:
Eq. (7) is used to determine whether the community Cj to be merged with Ci among all other communities in the community set.
where Ci , Cj ε C and
By assuming Ci = Ci ∪ Cj, compute the modularity of the community set using Eq. (5), let it be Qj and Q is the modularity of the community set before merging. Then update the community structure by merging Ci and Cj as a single community, if Qj > Q. Repeat this process until there is no further improvement in modularity occurs and finally we get the resultant community structure which has the maximum modularity. The detected communities are visualized for better understanding of the relationship among the nodes and communities with inter and intra-community edges.
To illustrate this procedure, we take Zachary’s karate club network as an example. In this network, node 1 is the first centre node since it is having the minimum eccentricity and maximum harmonic centrality. Most similar node of node 1 is node 2, so a new community is created with node 1 and node 2 together. Similarly two more new communities are created for the centre nodes 3 and 32 with its similar nodes 4 and 25 respectively. Next centre node is 14 and its similar node is 4 which is already in a community, so node 14 is appended to the same community where 4 was placed. Likewise, all the other nodes are processed in the same manner and the following eight communities are formed in the preliminary community structure: {1, 2, 20, 18, 22, 12}, {3, 4, 14, 8, 13}, {32, 25, 29, 26}, {9, 31}, {34, 33, 10, 15, 16, 19, 21, 23}, {28, 24, 30, 27}, {6, 7, 17}, {5, 11}.
In the next step, communities 1 and 2 are selected for merging by using Eq. (6). Similarly communities are merged till we get the maximum modularity community set. Finally, this enhanced algorithm for community detection CGraM, listed out the following three communities for the karate club network: {1, 2, 20, 18, 22, 12, 3, 4, 14, 8, 13}, {32, 25, 29, 26, 9, 31, 34, 33, 10, 15, 16, 19, 21, 23, 28, 24, 30, 27}, {6, 7, 17, 5, 11}.
This section primarily discusses the real-life datasets that are used for the testing. Also, the experiment set up for implementation is given followed by the list of metrics used for evaluating the detected communities. Then the efficiency of the proposed algorithm on the datasets is studied by analyzing the results and evaluated using the evaluation parameters of community detection.
4.1 Description of Datasets Used for Experiments
CGraM is applied to the following real-life networks. Karate club network, dolphin social network, US political books network, American college football network are the datasets with ground-truth community structure. Lesmis co-appearance network, email network, Texas power grid network and PGP network are the networks without ground truth community structure. Characteristics of the networks with description are summarized in Tab. 2.
• Karate network [24] shows the social interactions between the 34 members, composing trainees, instructor and administrator in a karate club in US. Members are represented as nodes and the relations between them are represented by the 78 edges. The entire club was divided into two groups over a period of time due to the clash of opinions.
• Dolphin social network [25] was constructed by observing the 62 dolphins living in New Zealand. The 159 edges are formed by the frequency of the dolphins played together.
• Polbooks network [26] shows the purchase history of books about American politics. The network consists of 105 books 441 edges are used to identify which books are purchased together.
• The football network [13] is the group that follows the football game schedule between the American college teams. There are 115 teams as nodes and the teams that have played each other are represented by 613 edges.
• Lesmis network [27] is from the novel Les Miserables written by Victor Hugo. It is the network co-appearances of characters from the novel. It has 77 characters as vertices and 254 edges indicate that the two characters appear together, at least once.
• Email network [28] is an email communication network of Rovira i Virgili University located in southern Spain. 1133 nodes represents users of the university’s email system and the 5451 edges represents that at least one email was exchanged between the two users.
• Powergrid [29] network is the network of power grids in the western states of the United States of America. The nodes are transformers, substations or generators and the edges are transmission lines.
• PGP (Pretty Good Privacy) is software for encrypting/decrypting files to send and receive through the Internet. PGP [30] network is the communication network between the users of this software which has 10,608 nodes and 24,316 edges.

4.2 Experiment Setup and Implementation
CGraM algorithm was executed on a machine with Intel(R) Core(TM) i5–6200U CPU having 2.30 GHz 2.40 GHz processor and 8 GB RAM. The programs were written in Python and the implementation of the other methods was performed with the igraph [31] package in python. Visualization of the detected communities is also done in Python using the networkx [32] package. We have used eight real-life datasets on the proposed method and a summary is provided later in this section.
The main two metrics used for evaluating the quality of detected communities are modularity and NMI (Normalized Mutual Information).
• Modularity:
This is the most popular quality attribute used for community detection in networks. It is the difference between the expected number of intra-community edges and the actual number of intra-community edges and is mathematically represented in Eq. (4).
• NMI (Normalized Mutual Information):
NMI is the other most used metric for evaluating the communities and it is proven by [33]. NMI explains how the ground truth and detected communities have common information that is how much the detected community structure agrees with the ground truth. More similar communities will have larger NMI values.
NMI is a quantitative metric which compares the quality of community detected with the observations of the ground truth based on the information theory. Since NMI needs information about the real world of communities, it cannot be used in datasets that do not provide the ground truth. The normalized mutual information NMI (A, B) of the communities A and B for a given network with N number of nodes is given below:
where CA is the number of communities from ground truth, CB is the number of detected communities.
4.4.1 Networks with Ground Truth Community Structure
We have applied the CGraM algorithm on the four real-life networks with ground truth community structure which is listed in the first part of Tab. 2. Evaluation and the measurement of quality of the detected community structures were performed by CGraM and well known algorithms in terms of both modularity and NMI.
The results of the evaluation metrics obtained are listed and compared with the state-of-the-art community detection algorithms in Tabs. 3 and 4. The results attained by CGraM from the listed networks were analyzed and visualized separately. The visualization of detected communities by CGraM and the ground truth for each data set is depicted in the figures. The identified communities are highlighted in different colors.


Fig. 3 shows the procedure of merging communities on the karate club network. Here the intermediate steps are shown for getting the resultant community structure from the detected preliminary community structure on karate club network by CGraM algorithm. In each step, two communities are selected based on the number of inter-community and intra-community edges and the selected communities are merged. Merging of the communities repeated if there is further improvement in the modularity.

Figure 3: The procedure of merging communities of CGraM on the karate club network (a) Preliminary community structure with eight communities (b) Merged community grey (grey and brown from step a) (c) Merged community yellow (purple and yellow from step b) (d) Merged community red (green and red from step c) (e) Merged community green (yellow and green from step d) (f) Final community structure with merged community green (green and blue from step e)
In the shown Fig. 4, karate club network is processed using CGraM and the result showed three communities, whereas in ground truth only two communities were present. But the modularity and NMI are higher than the other algorithms.

Figure 4: Karate club network (a) The ground-truth community structure (b) The community structure detected by CGraM
Fig. 5 shown is for the dolphin social network, the result obtained consists of six communities and where as in ground truth four communities were present. NMI for the communities detected by CGraM is the largest among other algorithms. Modularity is also higher and equal to the Louvian and infomap algorithms.

Figure 5: Dolphin network (a) The ground-truth community structure (b) The community structure detected by CGraM
For the polbooks social network, the result obtained consists of three communities and it matches with the actual communities count. Also the modularity for the communities detected by CGraM is the largest and NMI obtained is the second largest among other algorithms.
The Fig. 6 represents the football social network and the result obtained consists of nine communities and whereas twelve communities were present in reality. Also the modularity and NMI for the communities detected by CGraM are the largest among other algorithms. Though the number of detected communities differs with ground truth, CGraM gives higher modularity and NMI.
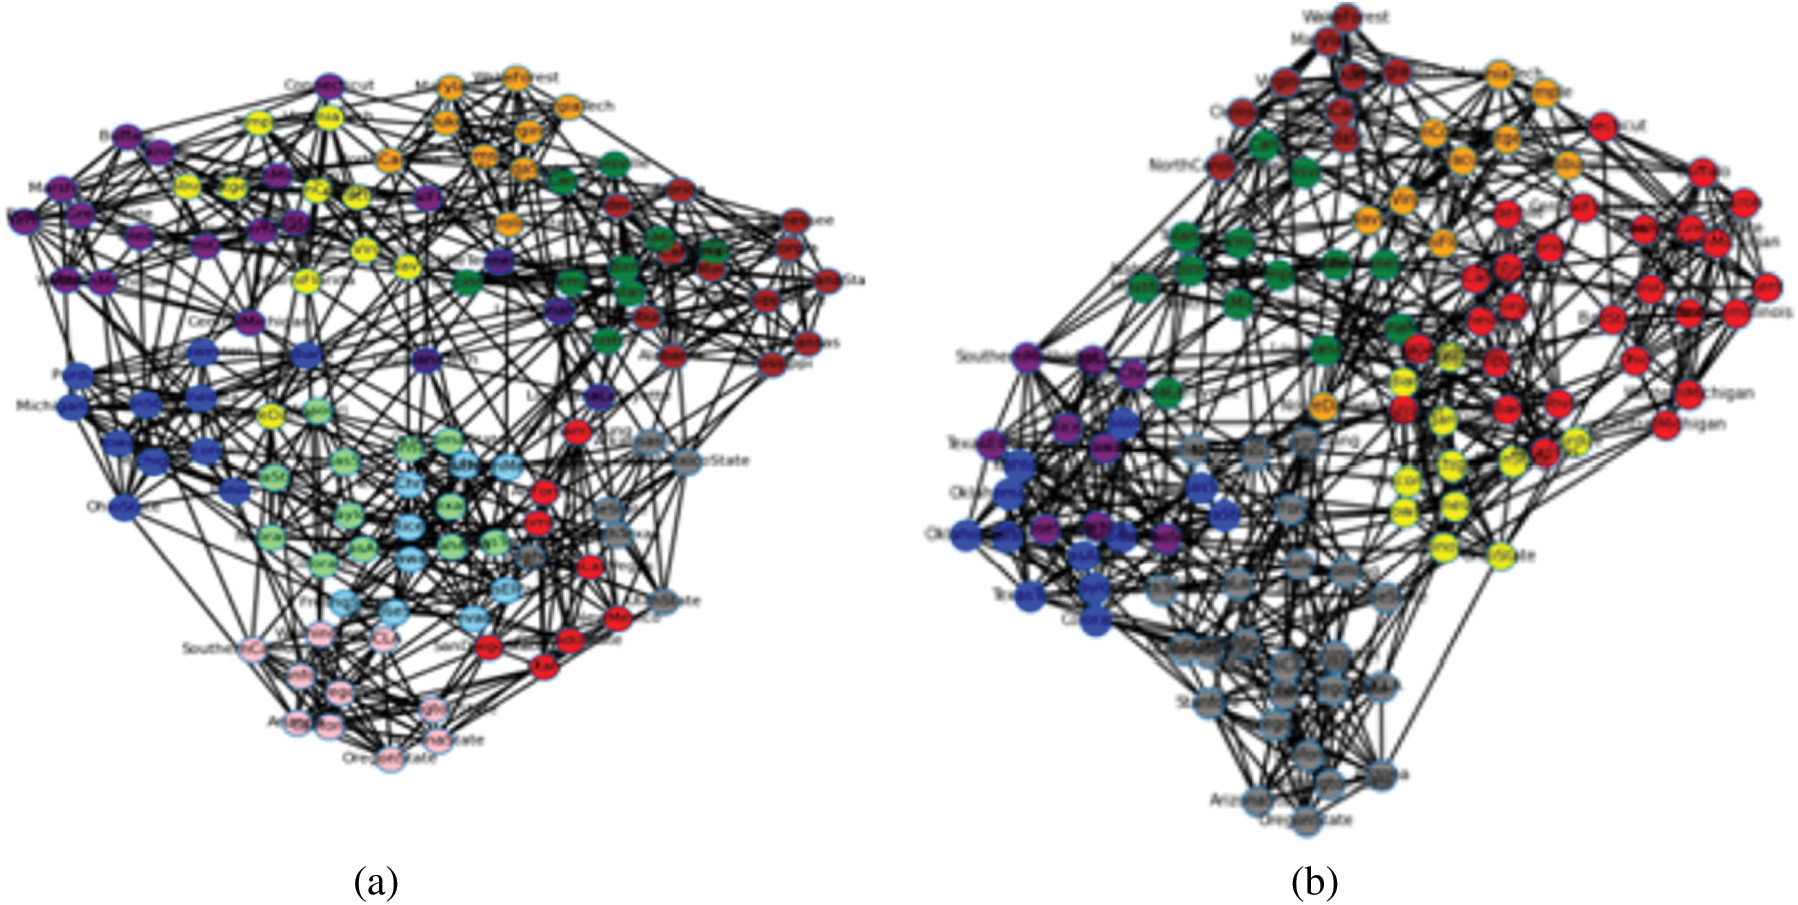
Figure 6: Football network (a) The ground-truth community structure (b) The community structure detected by CGraM
From the Tabs. 3 & 4 and the Figs. 7 & 8, the enhanced algorithm for community detection - CGraM achieved the better modularity and NMI values almost for all the datasets comparatively with the other state-of-the-art algorithms like louvian, Girvan Newman, walktrap etc. Thus CGraM yields better results collaboratively when compared to other algorithms.
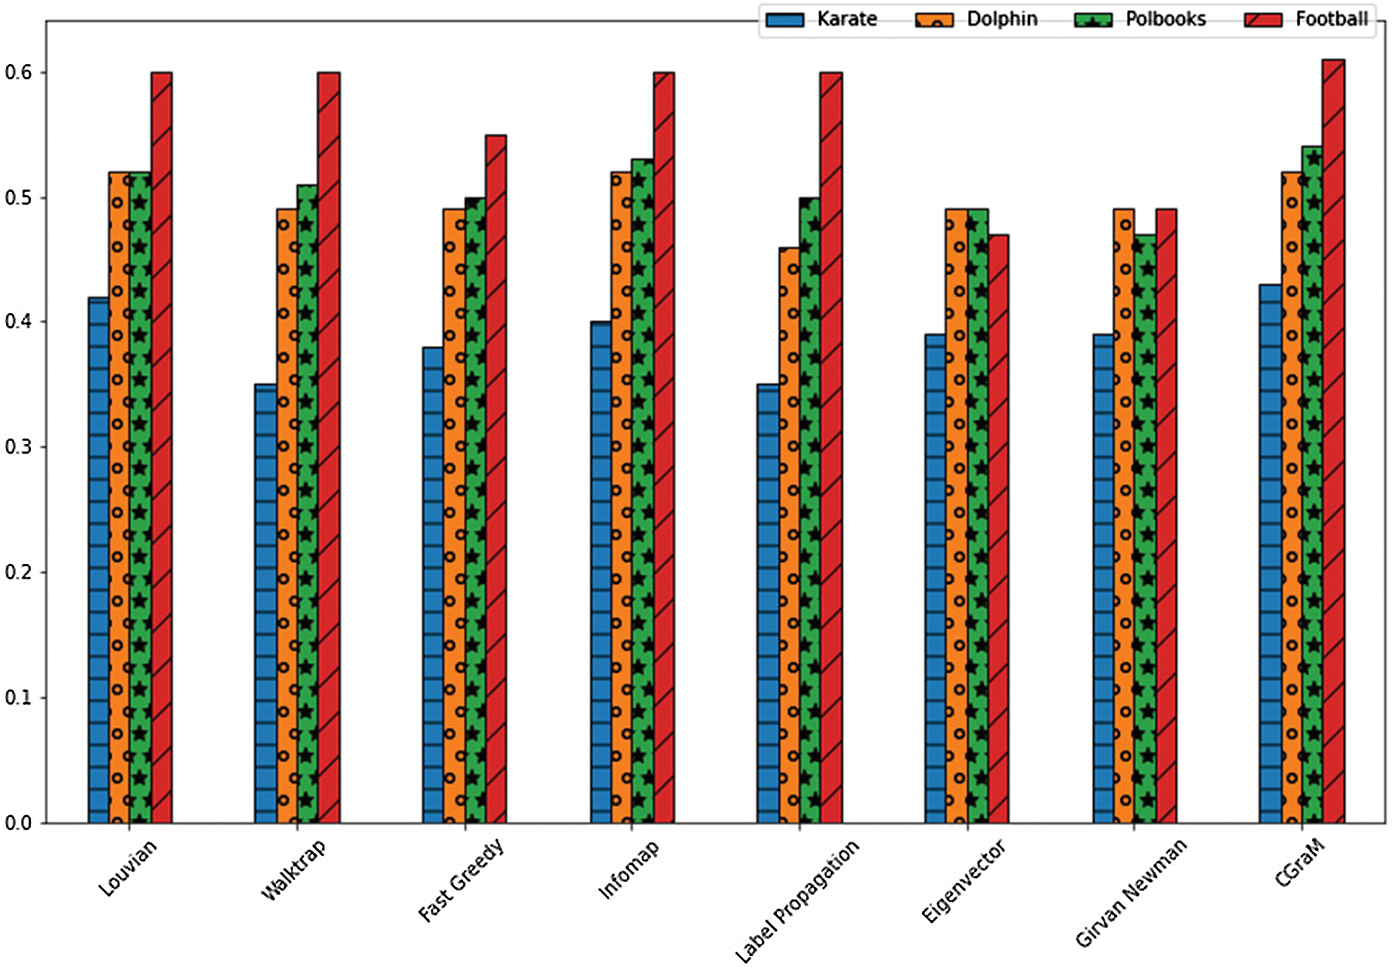
Figure 7: Comparison chart of modularity obtained in real-life data sets with ground truth
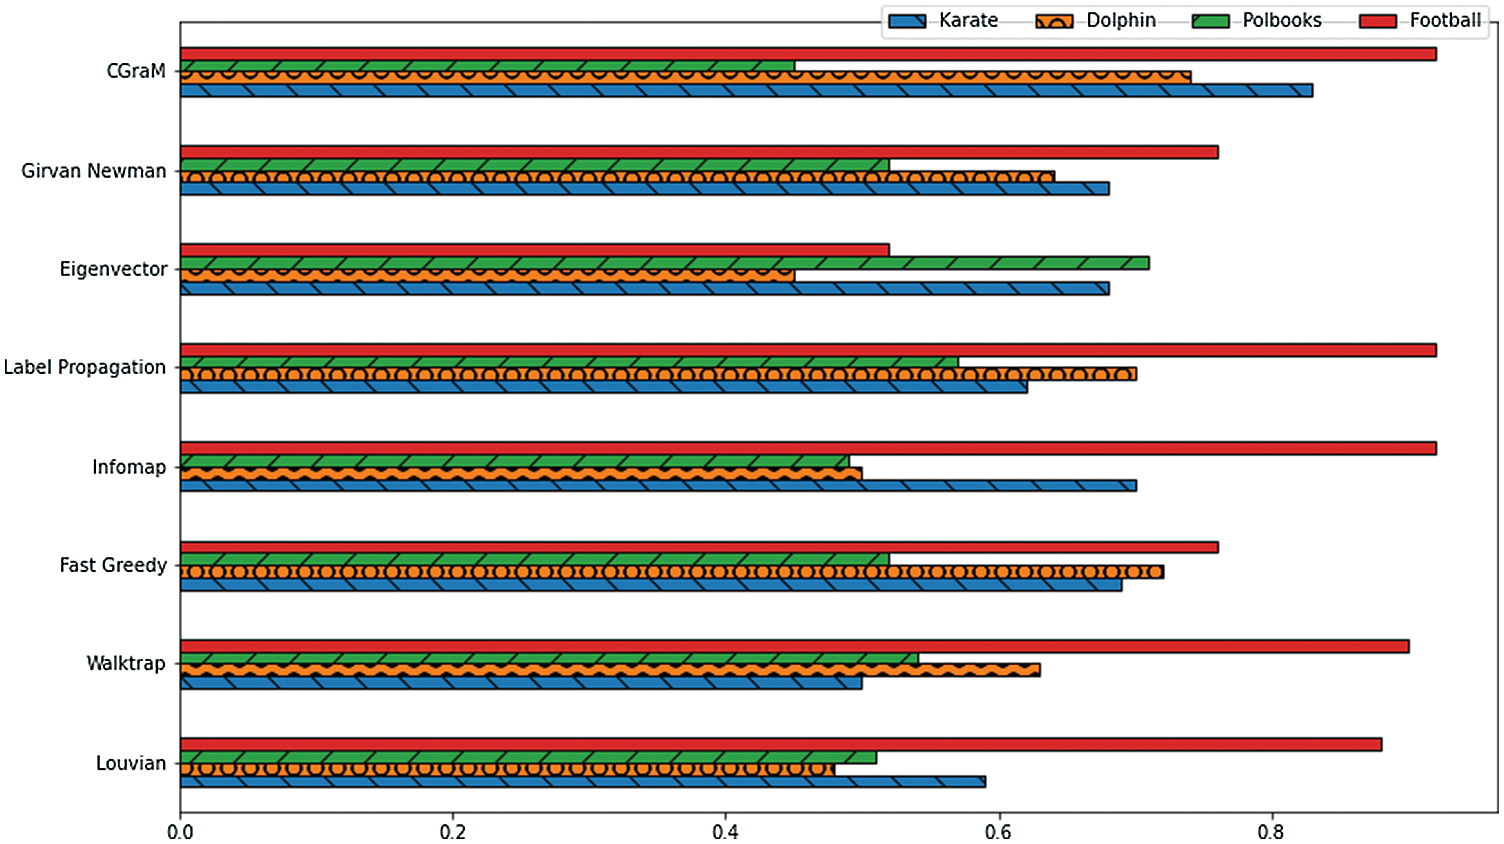
Figure 8: Comparison chart of NMI values obtained in real-life data sets with ground truth
4.4.2 Networks Without Ground Truth Community Structure
Networks listed in the second part of the Tab. 2 are the networks without ground truth community structure. We have evaluated the detected communities from these networks using modularity alone because the ground truth is not known. Modularity values obtained by CGraM and other algorithms are recorded in Tab. 5. We have also plotted a chart of this table for comparison which is shown in Fig. 10.

Communities detected by CGraM algorithm for the lesmis and email networks are shown in Fig. 9. From Tab. 5, CGraM attained the largest modularity for 3 out of 4 networks. For the lesmis network, still obtained the second largest modularity, Louvian method achieved the highest modularity for this network. The results show that CGraM detects the communities more efficiently for larger datasets also than other algorithms.
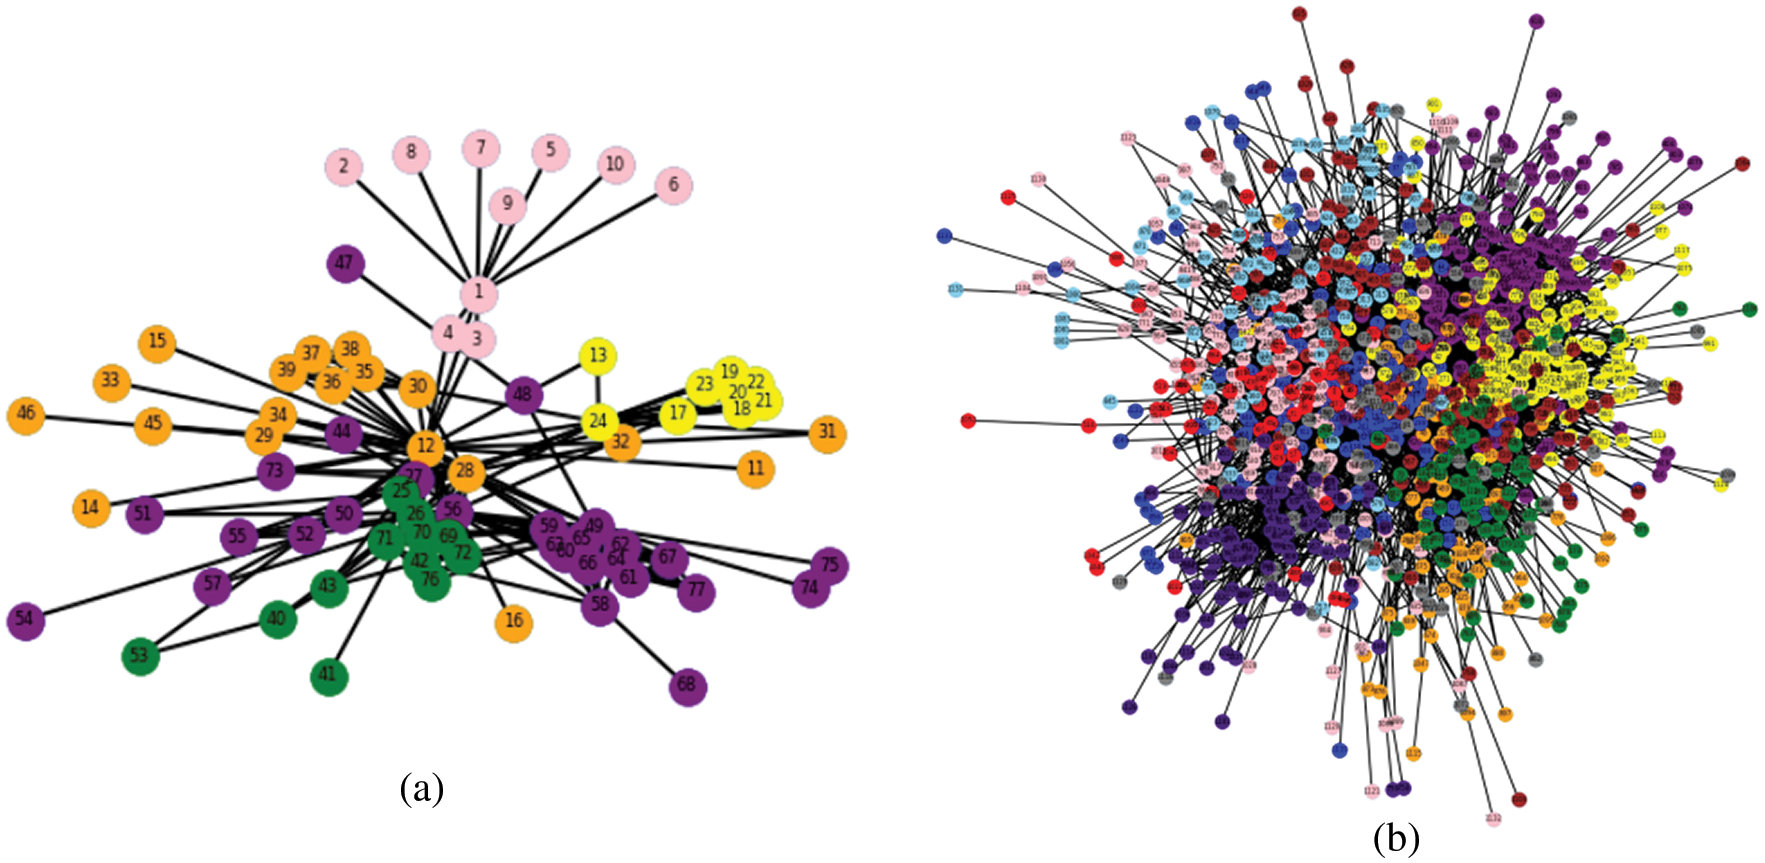
Figure 9: Communities detected by CGraM on (a) Lesmis network (b) Email network

Figure 10: Comparison chart of modularity obtained in real-life data sets without ground truth
The new methods for community detection in social networks - CGraM is proposed here. Centre nodes are identified using the graph measures, the eccentricity and harmonic centrality. Then primary community structure is formed by using the jaccard coefficient similarity. Selective communities are merged to get the better resultant community structure by using the well-known modularity measure. This method was applied on real networks and results are evaluated in terms of modularity and NMI with other state-of-the art algorithms. CGraM achieved the better modularity and NMI values almost for all the real networks and the comparative results show that CGraM reaches to more precise results than other algorithms that are considered for analysis. In future, this method can be extended for the directed and weighted networks.
Funding Statement: The authors received no specific funding for this study.
Conflicts of Interest: The authors declare that they have no conflicts of interest to report regarding the present study.
1. M. Khatoon and W. A. Banu, “A survey on community detection methods in social networks,” International Journal of Education and Management Engineering, vol. 5, no. 1, pp. 8–18, 2015. [Google Scholar]
2. A. Karataş and S. Şahin, “Application areas of community detection: A review,” in Proc. Int. Congress on Big Data, Deep Learning and Fighting Cyber Terrorism (IBIGDELFTAnkara, Turkey, pp. 65–70, 2018. [Google Scholar]
3. P. Kumar, R. Jain, S. Chaudhary and S. Kumar, “Solving community detection in social networks: A comprehensive study,” in Proc. Int. Conf. on Computing Methodologies and Communication (ICCMCErode, India, pp. 239–345, 2021. [Google Scholar]
4. M. El-moussaoui, T. Agouti, A. Tikniouine and M. E. Adnani, “A comprehensive literature review on community detection: Approaches and applications,” Procedia Computer Science, vol. 151, pp. 295–302, 2019. [Google Scholar]
5. J. Mothe, K. Mkhitaryan and M. Haroutunian, “Community Detection: Comparison of State of the art Algorithms,” in Proc. Computer Science and Information Technologies (CSITYerevan, Armenia, vol. 1–129–129 pp. 125–129, 2017. [Google Scholar]
6. M. E. J. Newman, “Fast algorithm for detecting community structure in networks,” Physical Review E, vol. 69, no. 6, pp. 66133, 2004. [Google Scholar]
7. S. R. Chintalapudi and M. H. M. K. Prasad, “Finding research groups using modularity based community detection algorithm,,” in Proc. 3rd Int. Conf. on Computing for Sustainable Global Development (INDIACom), New Delhi, India, pp. 65–69, 2016. [Google Scholar]
8. R. K. Behera, S. K. Rath and M. Jena, “Spanning tree based community detection using min-max modularity,” Procedia Computer Science, vol. 93, pp. 1070–1076, 2016. [Google Scholar]
9. S. G. Krishnan, S. Karthika and S. Bose, “Detection of Communities in Dynamic Social Networks,” inProc. 2016 Int. Conf. on Recent Trends in Information Technology (ICRTITChennai, India, pp. 334–339, 2016. [Google Scholar]
10. X. Ding, J. Zhang, J. Yang and Y. Shen, “An autonomous divisive algorithm for community detection based on weak link and link-break strategy,” Mathematical Problems in Engineering, vol. 2018, pp. 1–12, 2018. [Google Scholar]
11. S. Srinivas and C. Rajendran, “Community detection and influential node identification in complex networks using mathematical programming,” Expert Systems with Applications, vol. 135, pp. 296–312, 2019. [Google Scholar]
12. L. Bai, J. Liang, H. Du and Y. Guo, “A novel community detection algorithm based on simplification of complex networks,” Knowledge-Based Systems, vol. 143, pp. 58–64, 2018. [Google Scholar]
13. M. Girvan and M. E. J. Newman, “Community structure in social and biological networks,” Proc. of the National Academy of Sciences, vol. 99, no. 12, pp. 7821–7826, 2002. [Google Scholar]
14. N. Tahir, A. Hassan, M. Asif and S. Ahmad, “MCD: Mutually connected community detection using clustering coefficient approach in social networks,” in Proc. 2nd Int. Conf. on Communication, Computing and Digital Systems (C-CODEIslamabad, Pakistan, pp. 160–165, 2019. [Google Scholar]
15. Y. Pan, D. Li, J. Liu and J. Liang, “Detecting community structure in complex networks via node similarity,” Physica A: Statistical Mechanics and its Applications, vol. 389, no. 14, pp. 2849–2857, 2010. [Google Scholar]
16. A. Naik and S. Bojewar, “A survey paper on techniques used for community detection in social networks,” in Proc. ICEMTE-2017, Maharashtra, India, vol. 5, no. 3, pp. 86–90, 2016. [Google Scholar]
17. N. Kasoro, S. Kasereka, E. Mayogha, H. T. Vinh and J. Kinganga, “PercoMCV: A hybrid approach of community detection in social networks,” Procedia Computer Science, vol. 151, pp. 45–52, 2019. [Google Scholar]
18. K. Asmi, D. Lotfi and M. Mohamed, “A Novel Approach Based on the Minimum Spanning Tree to Discover Communities in Social Networks,” in Proc. Int. Conf. on Wireless Networks and Mobile Communications (WINCOMFez, Morocco, pp. 286–290, 2016. [Google Scholar]
19. K. Asmi, D. Lotfi and M. Mohamed, “Large-scale community detection based on a new dissimilarity measure,” Social Network Analysis and Mining, vol. 7, no. 17, pp. 1–10, 2017. [Google Scholar]
20. X. You, Y. Ma and Z. Liu, “A three-stage algorithm on community detection in social networks,” Knowledge-Based Systems, vol. 187, pp. 104822, 2020. [Google Scholar]
21. J. Cheng, X. Su, H. Yang, L. Li, J. Zhang et al., “Neighbor similarity based agglomerative method for community detection in networks,” Complexity, vol. 2019, pp. 1–16, 2019. [Google Scholar]
22. A. I. Hafez, A. E. Hassanien, A. A. Fahmy and M. F. Tolba, “Community detection in social networks by using Bayesian network and expectation maximization technique,” in Proc. 13th Int. Conf. on Hybrid Intelligent Systems (HIS 2013Gammarth, Tunisia, pp. 209–214, 2013. [Google Scholar]
23. M. E. J. Newman, “Modularity and community structure in networks,” Proc. of the National Academy of Sciences, vol. 103, no. 5, pp. 8577–8582, 2006. [Google Scholar]
24. W. W. Zachary, “An information flow model for conflict and fission in small groups,” Journal of Anthropological Research, vol. 33, no. 4, pp. 452–473, 1977. [Google Scholar]
25. D. Lusseau, K. Schneider, O. J. Boisseau, P. Haase, E. Slooten et al., “The bottlenose dolphin community of doubtful sound features a large proportion of long lasting associations,” Behavioral Ecology and Sociobiology, vol. 54, no. 4, pp. 396–405, 2003. [Google Scholar]
26. R. A. Rossi and N. K. Ahmed, “The network data repository with interactive graph analytics and visualization,” in Proc. AAAI’15: Twenty-Ninth AAAI Conf. on Artificial Intelligence, Austin, TX, USA, pp. 4292–4293, 2015. Online. Available: https://www.networkrepository.com. [Google Scholar]
27. D. E. Knuth, “Les Miserables,” in The Stanford Graphbase: A Platform for Combinatorial Computing, 1st ed, Reading, MA, USA: Addison-Wesley, 1993. [Google Scholar]
28. R. Guimer`a, L. Danon, A. D´ıaz-Guilera, F. Giralt and A. Arenas, “Self-similar community structure in a network of human interactions,” Physical Review E, vol. 68, pp. 65103, 2003. [Google Scholar]
29. S. H. Strogatz and D. J. Watts, “Collective dynamics of ‘small-world’ networks,” Nature, vol. 393, pp. 440–442, 1998. [Google Scholar]
30. M. Bogu˜n´a. R. Pastor-Satorras, A. D.´ıaz-Guilera and A. Arenas, “Models of social networks based on social distance attachment,” Physical Review E, vol. 70, pp. 56122, 2004. [Google Scholar]
31. G. Csardi and T. Nepusz, “The igraph software package for complex network research,” InterJournal, vol. Complex Systems, pp. 1695, 2005. [Google Scholar]
32. A. A. Hagberg, D. A. Schult and P. J. Swart, “Exploring network structure, dynamics, and function using network,” in Proc. of the 7th Python in Science Conf. Pasadena, CA, USA, pp. 11–15, 2008. [Google Scholar]
33. L. Danon, A. Daz-Guilera, J. Duch and A. Arenas, “Comparing community structure identification,” Journal of Statistical Mechanics: Theory and Experiment, vol. 2005, no. 9, pp. P09008–P09008, 2005. [Google Scholar]
 | This work is licensed under a Creative Commons Attribution 4.0 International License, which permits unrestricted use, distribution, and reproduction in any medium, provided the original work is properly cited. |