DOI:10.32604/iasc.2022.020332
| Intelligent Automation & Soft Computing DOI:10.32604/iasc.2022.020332 | |
| Article |
Using Mobile Technology to Construct a Network Medical Health Care System
1Department of Information Technology, Takming University of Science and Technology, Taipei City, 11451, Taiwan
2Department of Electrical Engineering, National Chin-Yi University of Technology, Taichung, 411030, Taiwan
*Corresponding Author: Wen-Tsai Sung. Email: songchen@ncut.edu.tw
Received: 19 May 2021; Accepted: 20 June 2021
Abstract: In this study, a multisensory physiological measurement system was built with wireless transmission technology, using a DSPIC30F4011 as the master control center and equipped with physiological signal acquisition modules such as an electrocardiogram module, blood pressure module, blood oxygen concentration module, and respiratory rate module. The physiological data were transmitted wirelessly to Android-based mobile applications via the TCP/IP or Bluetooth serial ports of Wi-Fi. The Android applications displayed the acquired physiological signals in real time and performed a preliminary abnormity diagnosis based on the measured physiological data and built-in index diagnostic data provided by doctors, such as blood oxygen concentration, systolic pressure, and diastolic pressure. In addition, in this study, the R waves, which are the highest peaks of the PQRST waves in electrocardiograms, were analyzed and detected using the heart rate variability (HRV) for time-frequency analysis and calculation of the RR interval time series. In this study, the heart rate data in the same age group were collected, and the optimal value of the standard deviation of normal to normal (SDNN) during the time domain of a normal heartbeat was found using the particle swarm optimization (PSO) algorithm and set as the risk level of the SDNN time domain analysis. A spectral analysis on the activity of the autonomic nervous system (ANS) was performed and the preliminary analysis results were displayed on the Android handheld devices for comprehensive physiological data analysis and HRV time-frequency analysis. Healthcare needs are distributed at all levels, therefore user-friendly software interfaces have been written to meet the healthcare needs at all ages.
Keywords: Internet of things (IoT); particle swarm optimization (PSO); heart rate variability (HRV); android; wireless sensing network; sensor
In recent years, technology has developed rapidly. The robotics promoted by artificial intelligence (AI) research and the development and Germany’s Industry 4.0 driven by IoT have made technology gradually become the center of global economic growth. In such a highly competitive industrial situation, because enterprises are under pressures such as the demand for product innovation, the efficiency of solving product problems, and customer returns after product use, it is more likely to create work stress and overwork for employees. Hence, in this study, a portable networking healthcare system was designed for healthcare-related employees that could allow users to carry out regular health examinations and observe changes in their physiological data.
According to the Bureau of Labor Insurance of Taiwan, from 2010 to 2014, there were 358 overwork-related cases verified by the Bureau of Labor Insurance, among which 156 people died. On average, one person got sick from overworking every five days, and one person died from overworking every 12 days, as shown in Fig. 1. The people most at risk are employees with cardiovascular and cerebrovascular diseases due to stress arising from the abuse of job responsibility systems in the technology industry, security industry, intermediary industry, and medical industry [1,2].
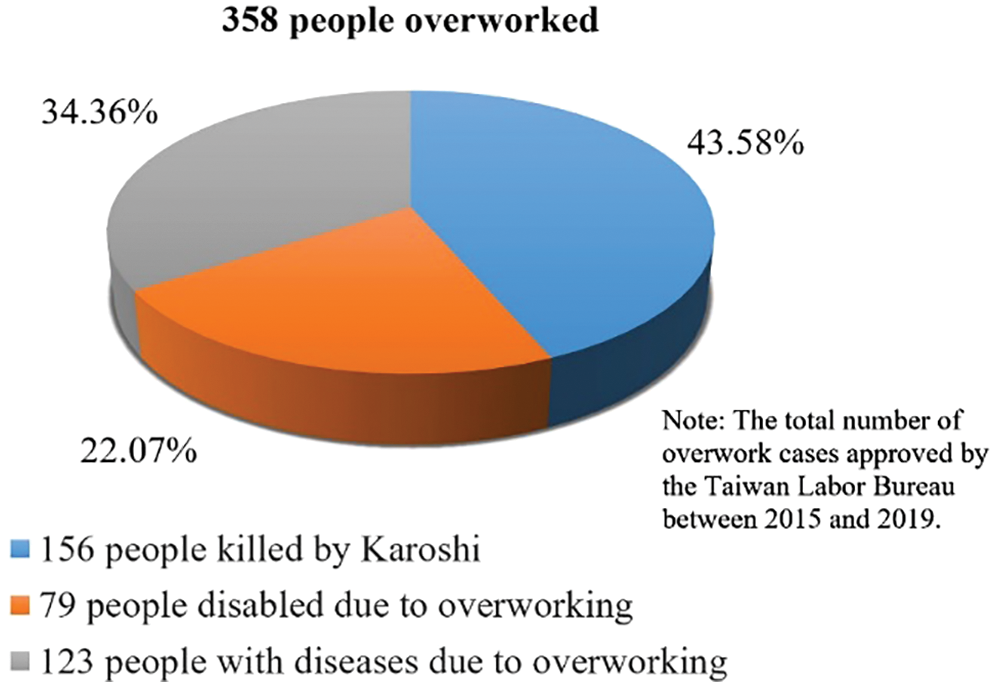
Figure 1: Statistical chart of overworked persons
The concept of IoT originated from the book The Road Ahead by Bill Gates in 1995. The technology was not taken seriously at the time, however, because it was still limited by the development of equipment and wireless networks. The information mentioned by Bill Gates in The Road Ahead has been verified repeatedly. The book deeply analyzes the integration of information technology and business strategy in future business and elaborates how to have predictive enterprises [3,4].
The Internet connects many subsystems, such as sensor systems, radio frequency identification (RFID) systems [5], wireless communication systems, and global positioning systems, to build an internetwork with the functions of sensing, communication, and monitoring. Machine to machine (M2M) communication is established to transmit the sensed physical quantity to the management or monitoring system in the form of data and texts for further analysis and processing [6,7]. As defined by the European Telecommunications Standards Institute (ETSI) [8], according to different working procedures and contents, IoT can be further subdivided into the layers: the perception layer, the network layer, and the application layer. The IoT architecture is shown in Fig. 2. In addition, the gateway connecting the network layer is composed of a Bluetooth module, a Wi-Fi module, and a passive RFID label. A communications chip is the channel connecting the perception layer and the network layer and is used to transmit the information obtained by the sensing devices to the network layer for the next stage of IoT [9].
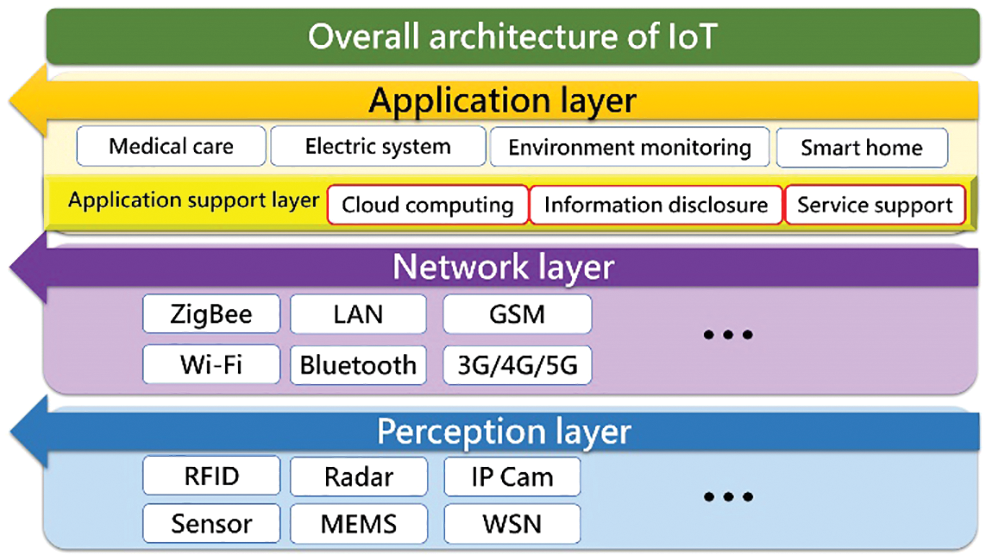
Figure 2: Proposed IoT system architecture
Through the above two technologies of sensing and networking, human beings can enjoy applications related to any object of interest around them at any time and in any place by any network access method. IoT has been applied in fields such as smart first aid kits for medical care [10,11], management and environmental monitoring for power systems [12], smart learning services for educational resources [13], and smart green buildings for construction projects [14]. Its application range covers food, clothing, residences, transportation, education, and entertainment, as shown in Fig. 3. The application layer also includes an application support layer, which mainly acts as a data and information analysis and processing platform to connect various networks and provide application services. The application support layer can be divided into three types: a cloud computing platform, a service support platform, and an information disclosure platform [15–17].
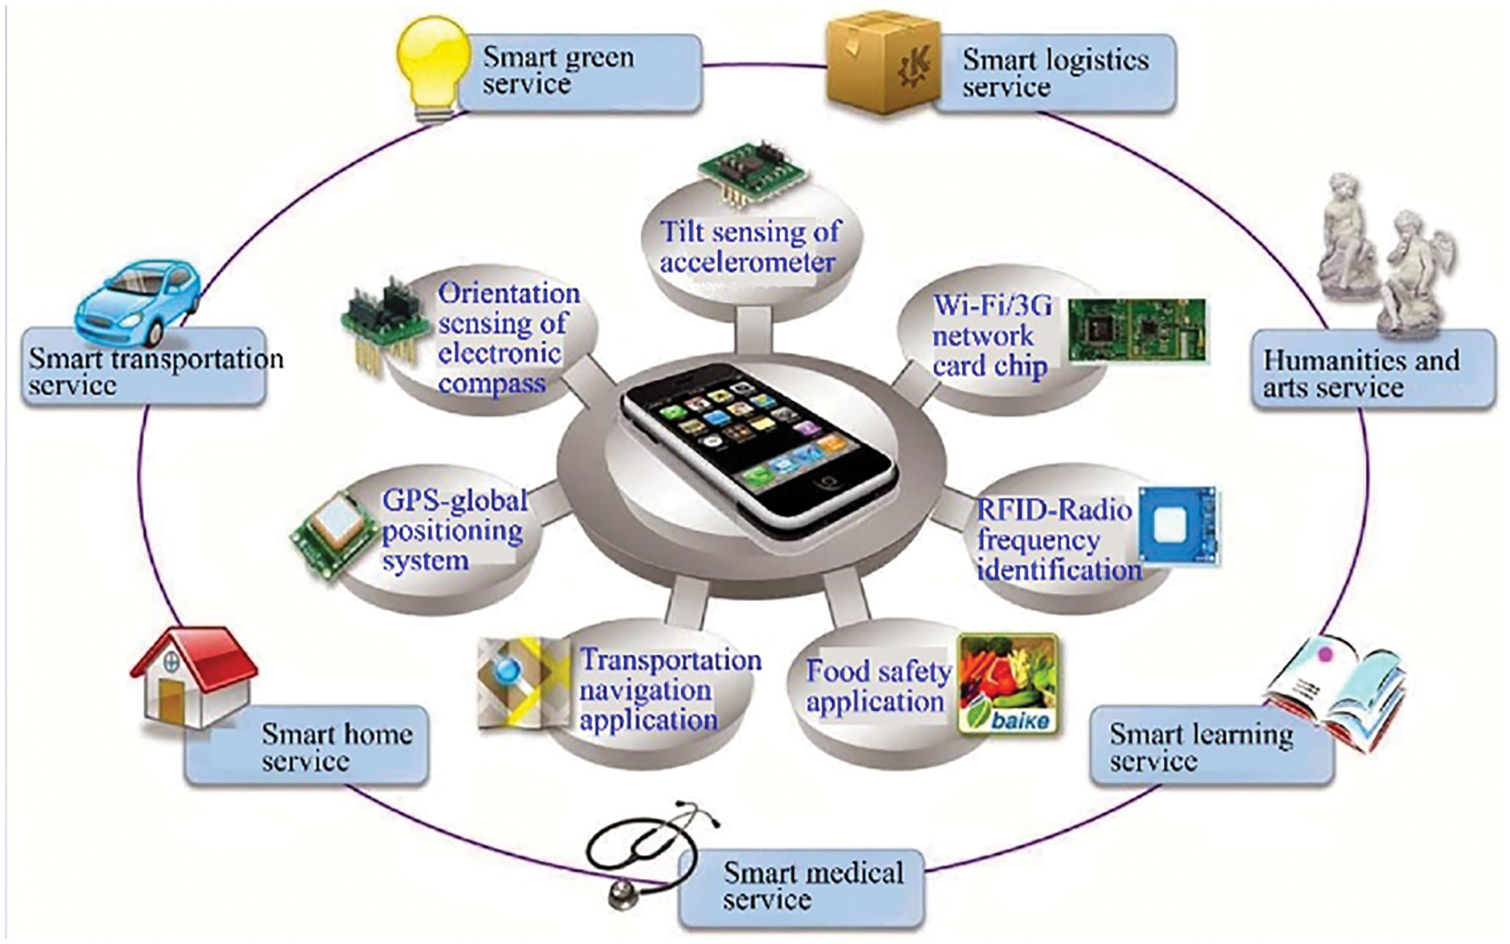
Figure 3: IoT architecture using mobile phones as the smart objects of IoT
Amazon Elastic Compute Cloud (Amazon EC2), with its architecture based on Amazon Web Services (AWS), is a cloud computing platform created by Amazon that provides numerous remote web services. The Amazon S3 architecture is also on this platform. The architecture of the Amazon EC2 and AWS service integration is shown in Fig. 4.
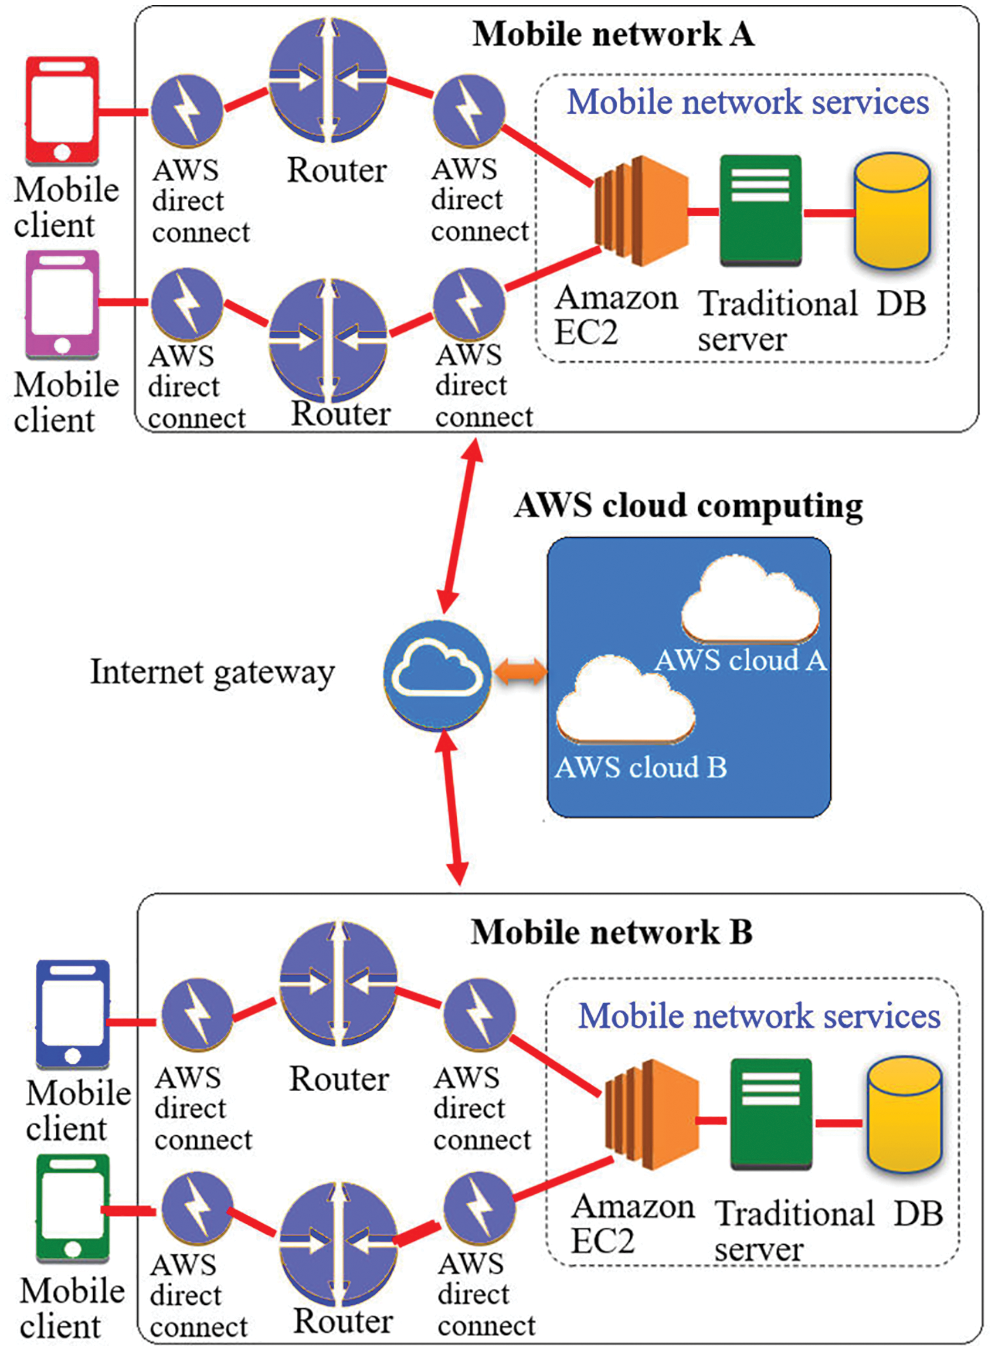
Figure 4: AWS service integration architecture
AWS provides various computing and web services that allow users to configure a virtual host server, set a firewall, configure network access, cut, and get exclusive routing IP addresses, and users can flexibly expand and increase (for example, network traffic, hard disk capacity, and CPU processing speed) according to their own needs at any time [18–20].
Aging and rapid increases in medical expenses have driven the growth of medical electronics. According to the estimation by Evaluate Pharma, the medical device market grew to about US$ 780 billion in 2016, mainly because of the increase in demand for chronic disease detection and monitoring. In 2016, the United States Congress announced approval of the 21st Century Cure Act, which is a precision medical policy. Driven by the development of medical big data analysis platforms and telemedicine, as well as portable mobile medical development, it has grown at a compound annual rate of 6.2% and is expected to grow to US$995 billion by 2020. The details are shown in Fig. 5.
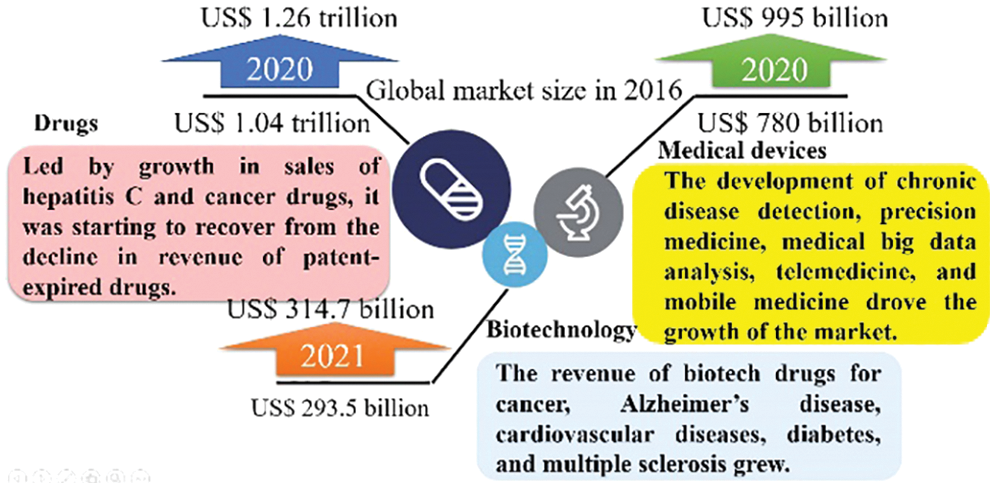
Figure 5: Market growth estimation of major life science products in 2020
By placing electrodes on specific parts of the body and using the non-combination of electrodes, a voltage record from 12 different angles can be produced, which is called the ECG lead. A 12-lead electrocardiogram is generally used, which includes three standard leads, three augmented leads, and six chest leads. The standard leads and augmented leads represent the frontal view of the heart, and the chest leads represent the horizontal view of the heart [21,22].
A standard lead, also known as a bipolar lead, contains two electrodes (a negative electrode and a positive electrode). The records are comprised of Lead I, Lead II, and Lead III, and the potential differences between each two limbs are recorded, as shown in Eqs. (1)–(4). It is also known as Einthoven’s Triangle, and the body’s bipolar leads are shown in Figs. 6a–6c [23,24].
Augmented leads continue to use the electrodes of the standard leads (left hand, right hand and left foot) but use different combinations to produce potential differences. An augmented lead is known as a unipolar lead, as only one electrode (left hand, right hand, and left foot) is used to record voltages [25,26]. The human lead diagram of the augmented leads is shown in Figs. 7a–7c, and the equations are shown in Eq. (5)–(7).
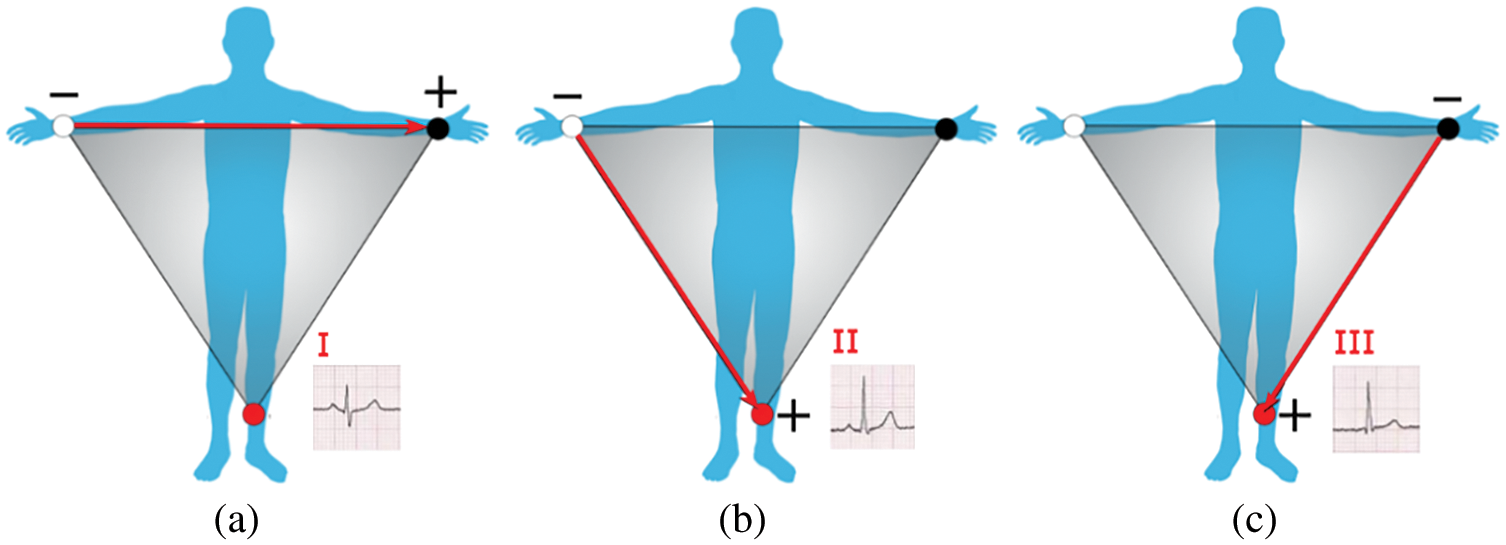
Figure 6: (a) Lead I; (b) Lead II; (c) Lead III
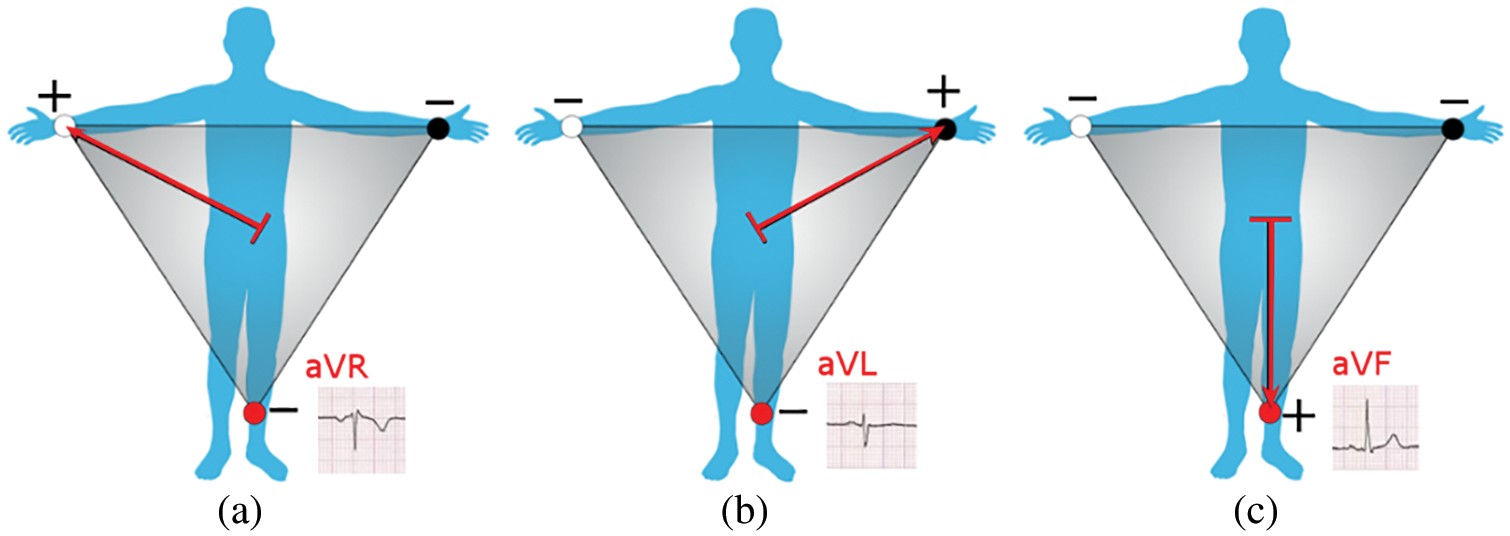
Figure 7: (a) Augmented right-hand lead; (b) Augmented left hand lead; (c) Augmented left foot lead
3.2 Blood Oxygen Concentration
Red and infrared light emitting diodes and a light sensing transistor are put above and below a finger, respectively. As shown in Fig. 8a, the light emitting diode is above the finger and the photosensitive transistor is below, to receive the intensity of the light passing through the finger. The red and infrared light emitting diodes are packaged in the same sensor and put below a finger, as shown in Fig. 8b, and a photosensitive transistor is used to sense the intensity of the red and infrared light reflected from the blood vessel.
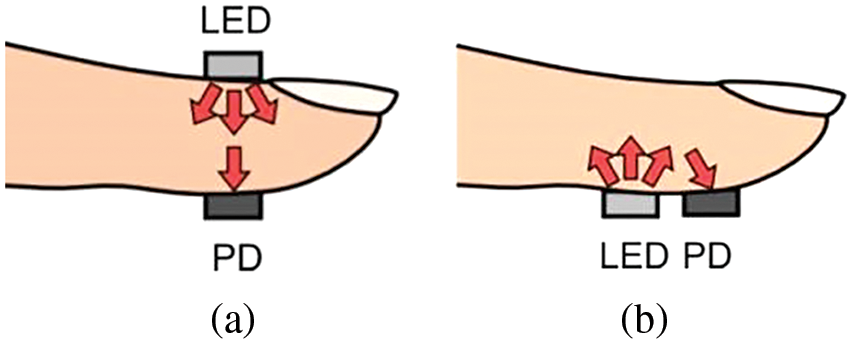
Figure 8: Blood oxygen measurement method (a) Penetrative (b) Reflecting
4 Particle Swarm Optimization (PSO)
Particle swarm optimization (PSO) is a well-known swarm intelligence algorithm used to solve and optimize problems. PSO was proposed by J. Kennedy and R. C. Eberhart who, inspired by the foraging behavior of birds, based their study on bird flocks, fish schools, and human social systems to prove that the information exchange among individuals in a group facilitates the evolution of an entire group, which is the source of the core concept of the PSO algorithm [27]. The PSO flow chart is shown in Fig. 9.’ The velocities and locations of all particles are updated using Eqs. (8) and (9).
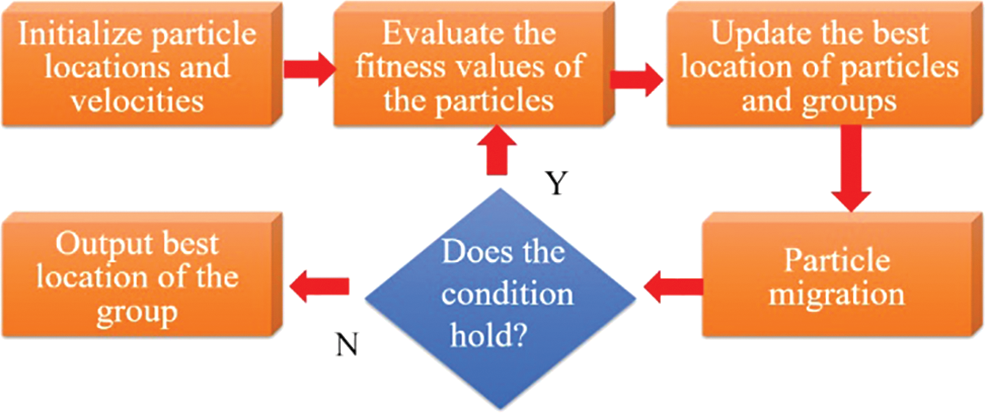
Figure 9: PSO flow chart
Assume that a group comprised of M particles travels at a certain speed in a D-dimensional space; the state of particle i at time t will be set as below:
Location:
Velocity:
Particle best location:
Group best location:
were,
The location of the particle at time t + 1
ω: Inertia weight
c1, c2: Learning factor
r1, r2: Random number
pid: The best location of particle i so far
pgd: The best locations of all particles so far
In the updated particle Eq. (10), the inertia weight and learning factor must be set. In this study, the inertia weight ω was set by referring to Wang et al. [28] After repeated experiments, the weight setting method linearly decreasing from 0.9 to 0.4 was proposed in 2000. The linear decrease is shown in Eq. (10).
Eberhart et al. (1999) analyzed limb tremors using the neural network of the PSO algorithm and diagnosed normal tremors and Parkinson’s disease [29,30]. The results show that the PSO algorithm can accurately forecast the performance and effectively improve the accuracy of optimization [31,32].
5 Research Method and Analysis
The Fig. 10 shows the block diagram of the system completed in this study.
Figure 10: Development block diagram of this study
In this study, the main equipment included a physiological signal acquisition module, a wireless transmission module, data display equipment, back-end data storage, and operational analysis, as shown in Fig. 11. The development board used in this study was HUIOT-Basic, a product researched and developed by HUAYU, as shown in Fig. 12. The electrocardiogram module used in this study is shown in the Fig. 13.
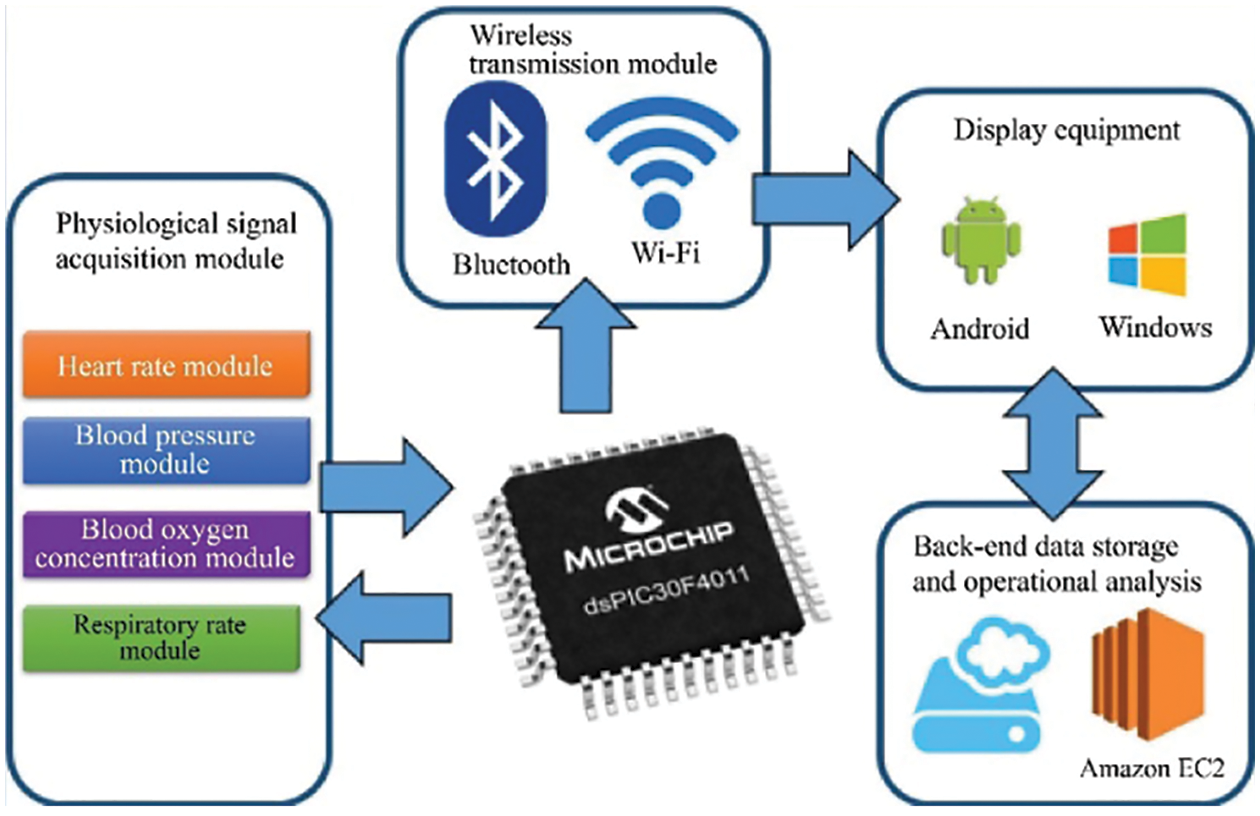
Figure 11: System architecture
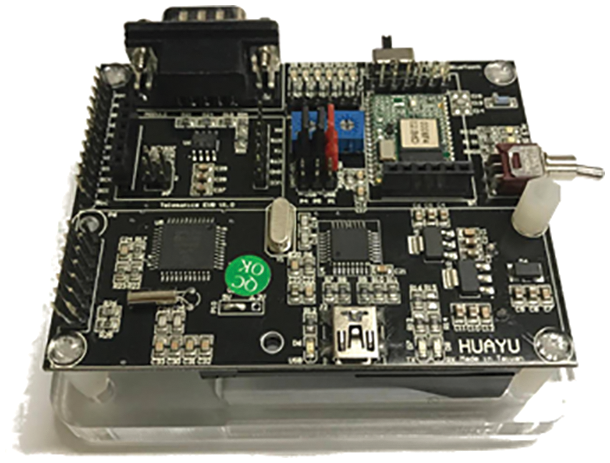
Figure 12: Development board HUIOT-Basic (Model: dsPIC30F4011-1-Mainboard)
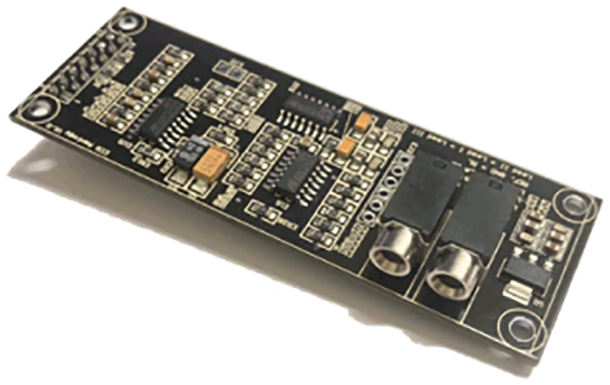
Figure 13: Electrocardiogram module (Model: dsPIC30F4011-2-Electrocardiogram)
Three leads were used as the inductions in this study, respectively labelled Lead I, Lead II, and Lead III, mainly because the small module reduced the electrode patches and time at measurement. In addition, the high-accuracy and high-reliability computation provided electrocardiogram data in real time. The block diagram of the electrocardiogram module circuit flow is shown in Fig. 14.
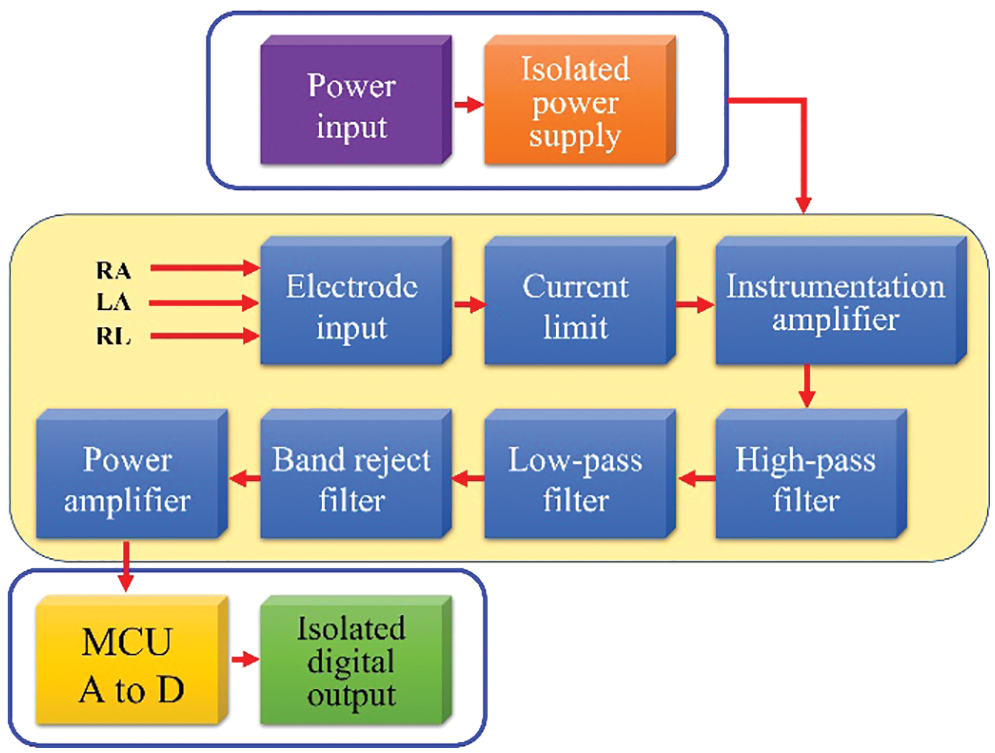
Figure 14: Block diagram of the electrocardiogram circuit flow
The blood pressure module used in this study, shown in Fig. 15, measured blood pressure by the resonance method, which is the most commonly-used noninvasive blood pressure measurement method. The advantages of this method were its simplicity and convenience. The block diagram of the blood pressure module circuit flow is shown in Fig. 16.
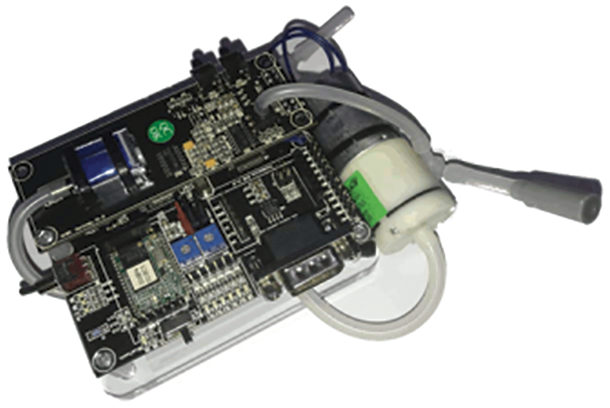
Figure 15: Blood pressure module (Model: dsPIC30F4011-3-Blood pressure)
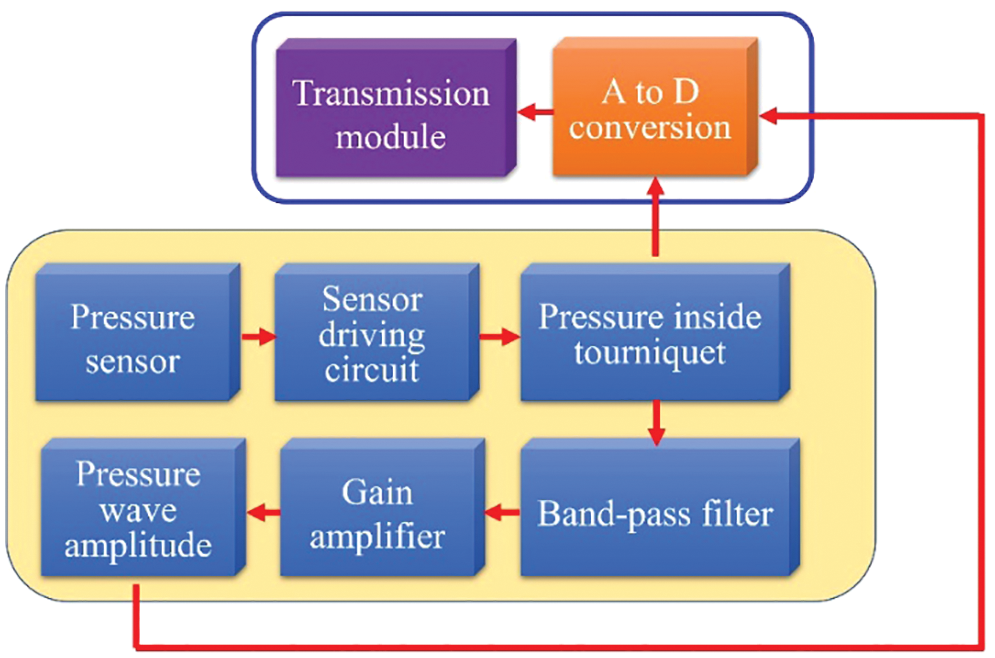
Figure 16: Block diagram of the blood pressure circuit flow
The respiratory rate module used in this study operated based on the variation of the impedance pneumography, as shown in Fig. 17. For air can be considered as a direct current insulator; the human lungs are like variable capacitors, and the capacitance increases when inhaling and decreases when exhaling. The capacitance changes with inhalation and exhalation, and the tissue outside the chest is considered as a resistance. The block diagram of the respiratory rate module circuit flow is shown in Fig. 18.
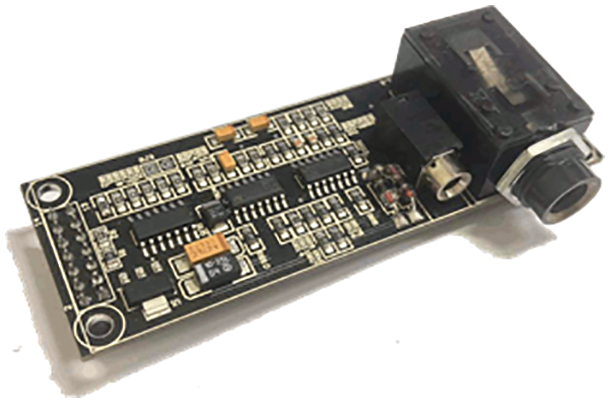
Figure 17: Respiratory rate module (Model: dsPIC30F4011-4-Respiratory rate)
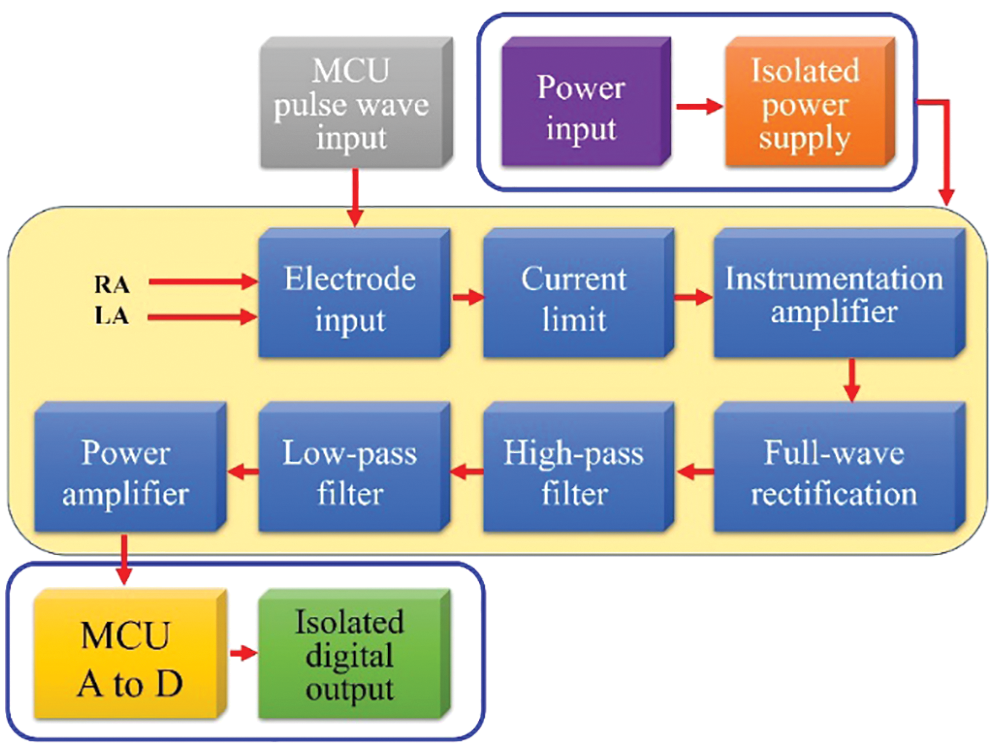
Figure 18: Block diagram of the respiratory rate circuit flow
5.4 Blood Oxygen Concentration Module
The blood oxygen concentration module used in this study, as shown in Fig. 19, performed measurements by the penetrative method. The block diagram of the blood oxygen concentration module circuit flow is shown in Fig. 20.
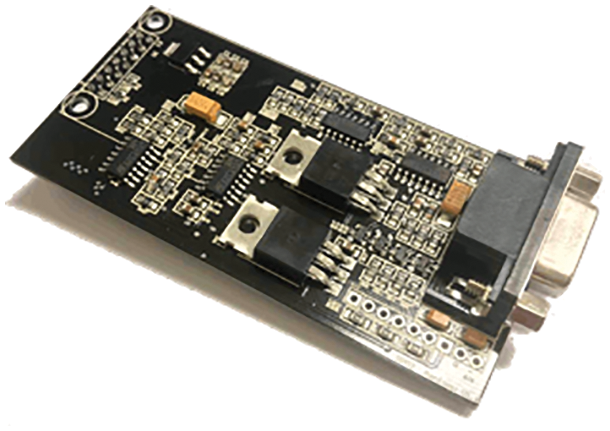
Figure 19: Blood oxygen concentration module (Model: dsPIC30F4011-5-Blood oxygen concentration)
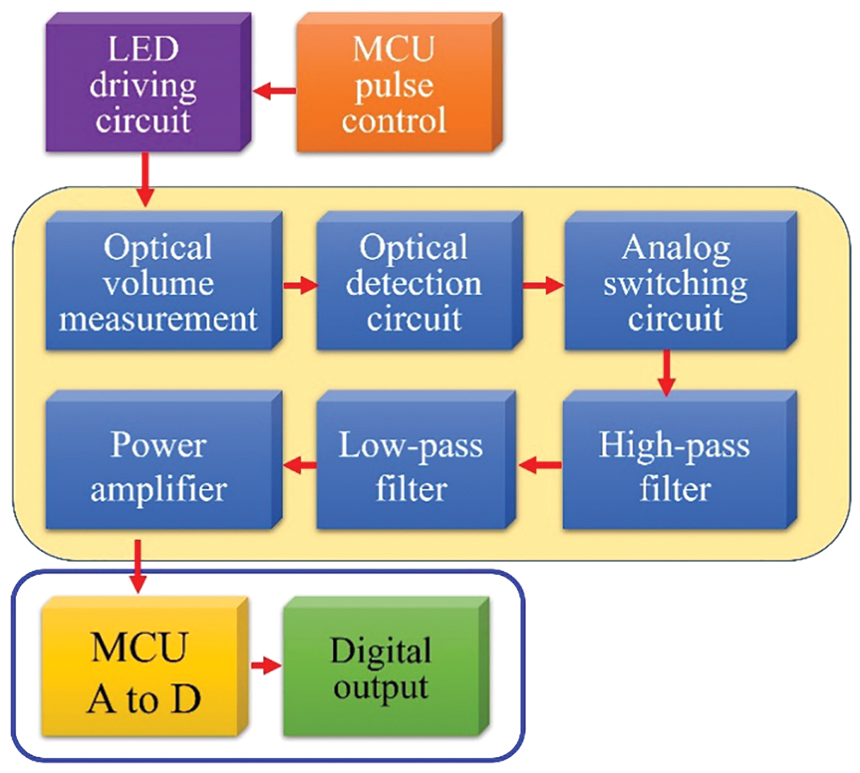
Figure 20: Block diagram of the blood oxygen concentration circuit flow
6 Experimental Simulation and Analysis
This study included a physiological data sensing module, a cloud server, and a smartphone application. The physiological sensing module used HUIOT-Basic centered on dsPIC30F4011 as the master control and was equipped with four different physiological data sensing modules, including a heart rate module, a blood pressure module, a respiratory rate module, and a blood oxygen concentration module, which were used to acquire human data in a wired way and then achieve wireless physiological data transmission through Wi-Fi and Bluetooth. The transmission control protocol architecture is shown in Fig. 21.
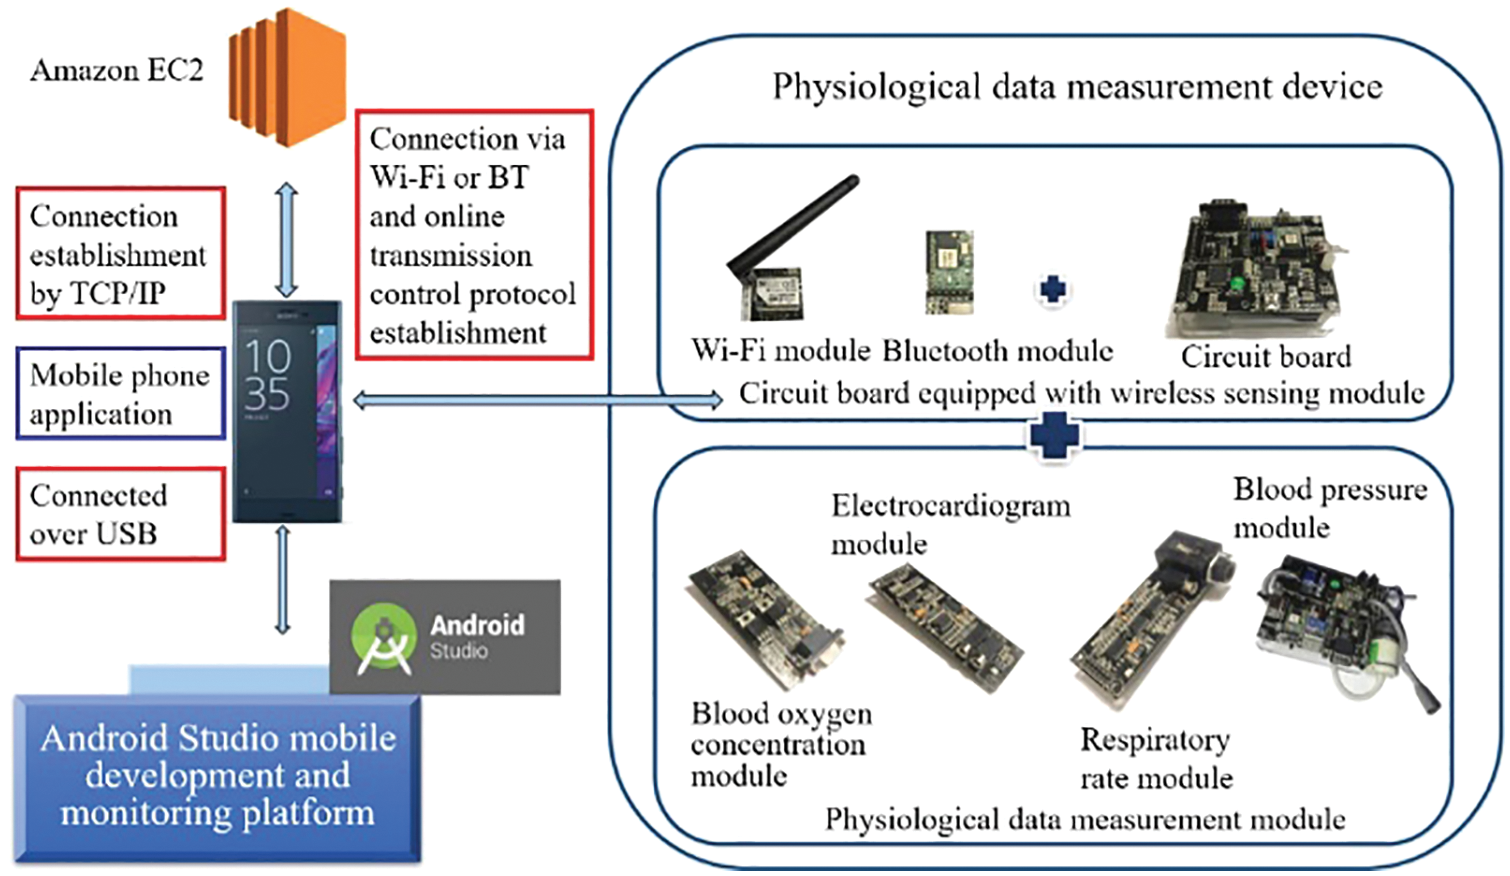
Figure 21: Transmission control protocol architecture
In this study, an Android Studio handheld device was mainly used to display the physiological data for measurement and analysis. The HUIOT-Basic circuit board of HUAYU was used as the master control device and was equipped with a physiological sensing module for physiological data acquisition. In order to clearly observe changes in the R convex waves of the electrocardiogram, Lead II was used for the electrocardiogram measurement to compute the changes in the R-R interval over a five-minute measurement period and to conduct the time frequency analysis of HRV theory. Fig. 22 shows the actual heart rate measurement. The experiment proved that the pressure amplitude in the tourniquet was the maximum when the pressure in the tourniquet was equal to the mean pressure. The Fig. 23 shows the actual blood pressure measurement.
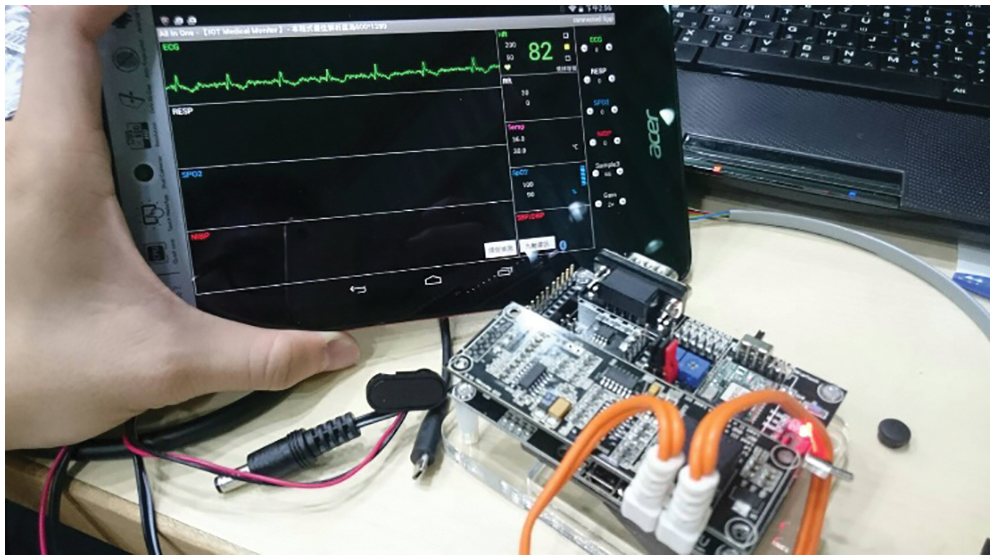
Figure 22: Actual heart rate measurement
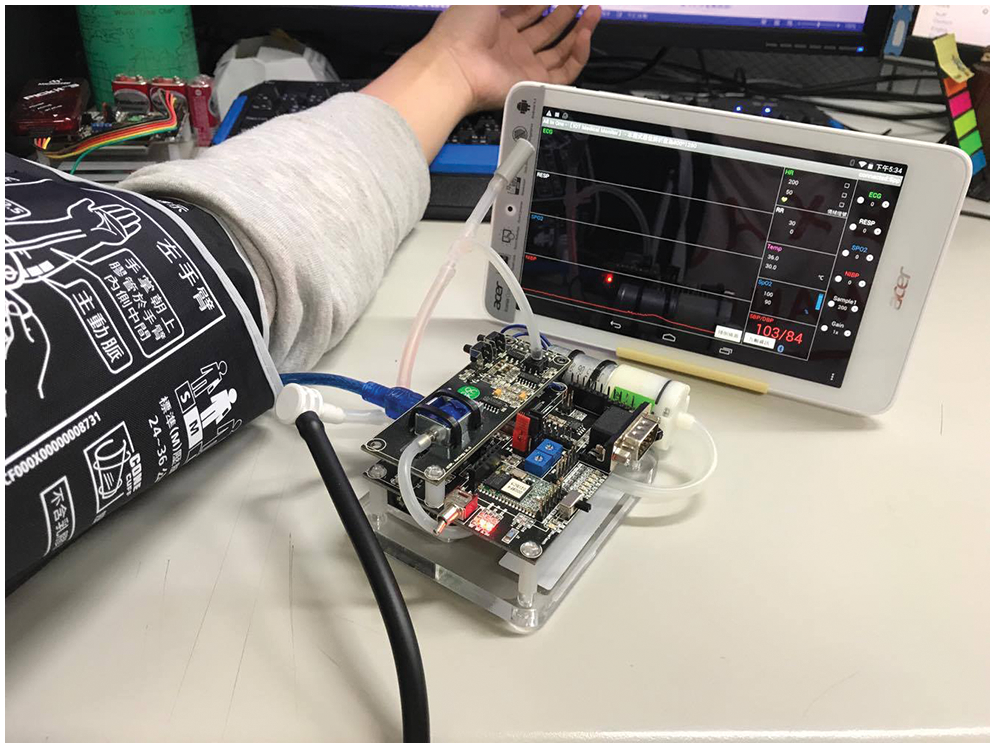
Figure 23: Actual blood pressure measurement
In this study, a blood oxygen finger sensor was worn on the finger of the subject to acquire the blood oxygen concentration. There is the red and infrared light with different wavelengths in the blood oxygen finger sensor. The blood oxygen concentration module was mainly used to further compute the accuracy of the measured values and get accurate blood oxygen concentration values. The Fig. 24 shows the actual blood oxygen concentration measurement.
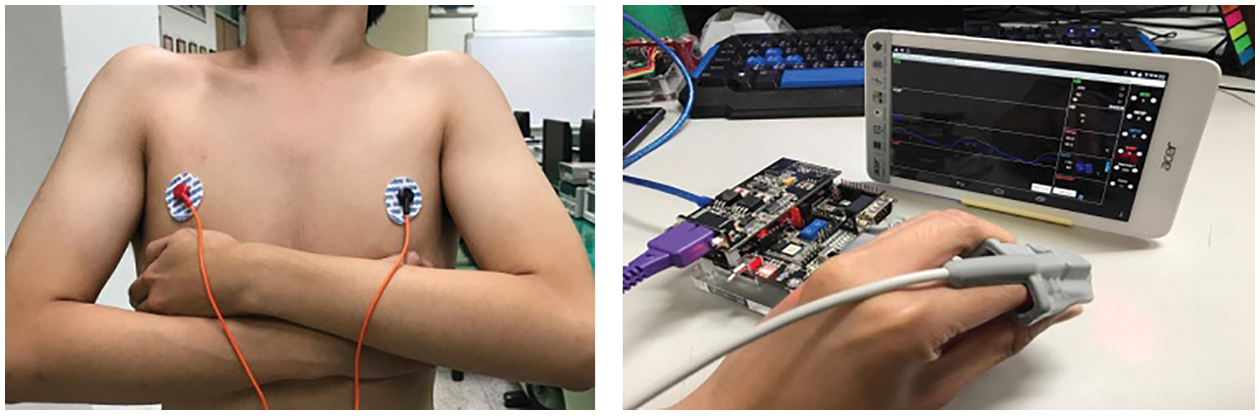
Figure 24: Actual blood oxygen concentration measurement
7 Heart Rate Analysis of HRV Theory
In this experiment, the HRV was obtained based on the heart rate measured by the electrocardiogram, and programs were used to obtain the HRV of the measured R waves of the electrocardiogram within the measured time series. The HRV flow chart is shown in Fig. 25. The R-R interval of the heartbeat actually observed by a mobile phone is shown in Fig. 26.
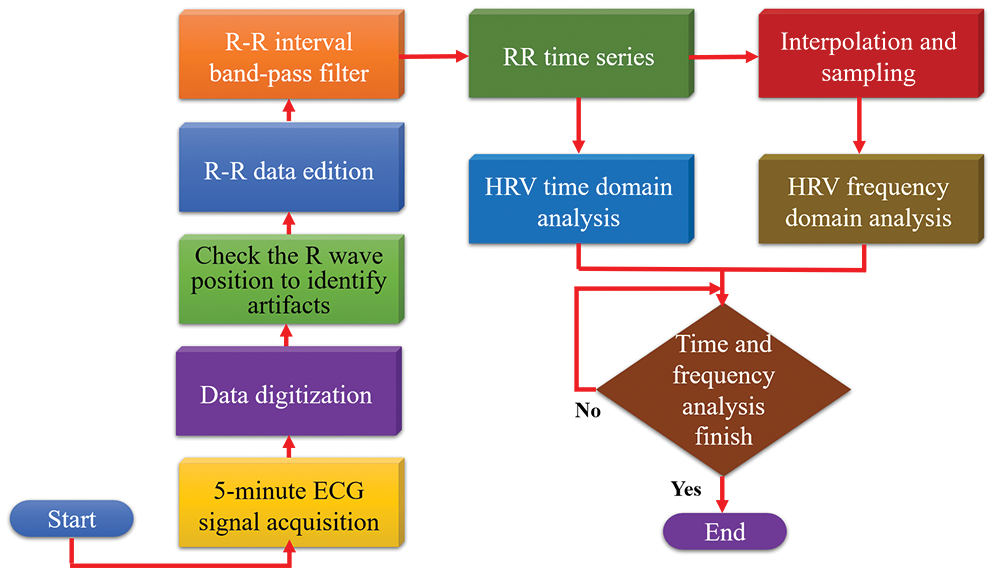
Figure 25: HRV flow chart
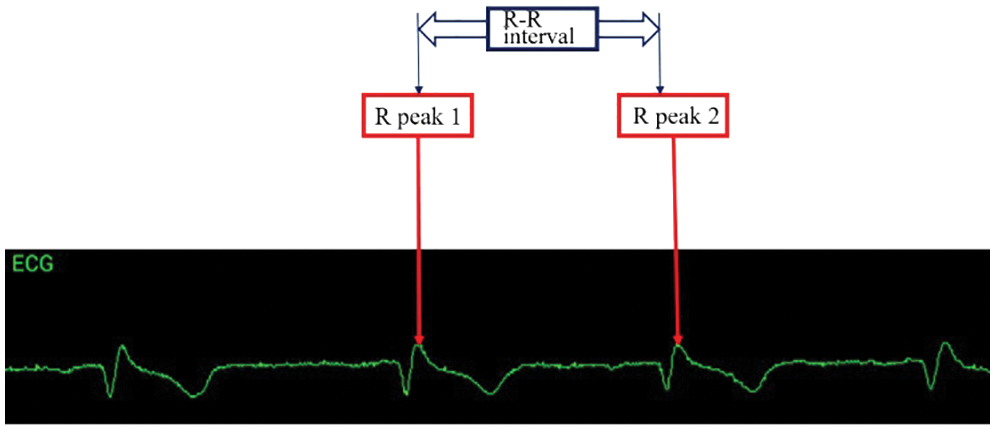
Figure 26: R-R interval of an electrocardiogram measured by a mobile phone
7.1 HRV Value Time Domain Analysis
The HRV standard deviation was mainly computed as part of the electrocardiogram time domain analysis. In this study, the main parameters of the index analysis were the SDNN analysis values, and the index values were analyzed and computed by using an algorithm, using the reference Eqs. shown in (11)–(14). The algorithm calculation was performed on the heart rate variability acquired by the electrocardiogram during a short period of time using the smartphone application [33].
Total heart beats computed by the program:
Time series of mean R-R interval: Mean
Standard deviation of NN intervals: SDNN
In this study, 200 items of physiological data from each age group were obtained using the Physio Net database, as shown in Fig. 27, in which the green bar represents the range of human values. The SDNN relation equation and PSO algorithm were used to find the optimal SDNN value of the physiological data in HRV, which changes with age [34,35]. The X-axis represents age and the Y-axis represents the range of SDNN analysis data. The optimal value of the physiological data was used to develop the index diagram of the physiological data risk levels, as shown in Fig. 28.
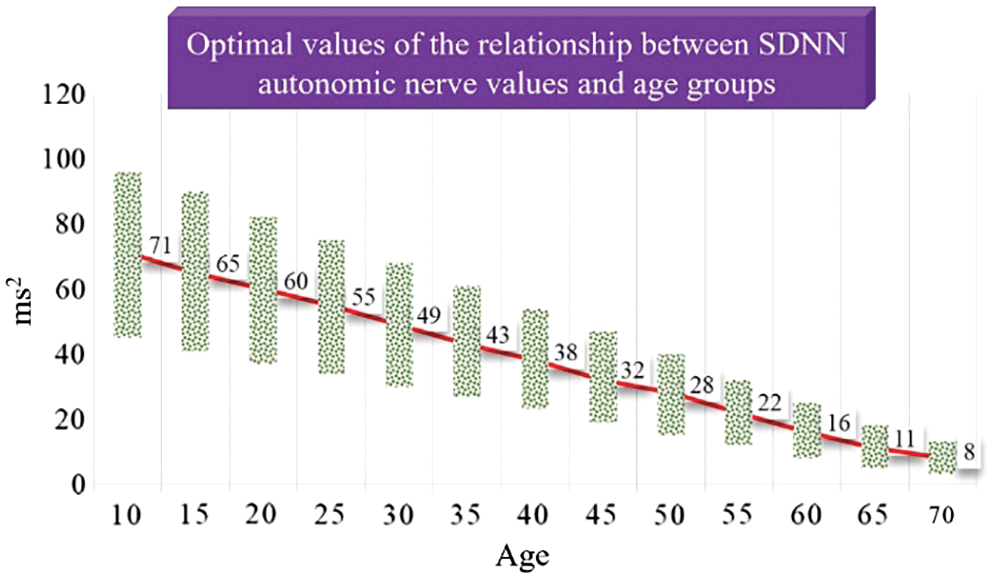
Figure 27: Optimal values of the relationship between SDNN autonomic nerve values and age groups
7.2 HRV Value Frequency Domain Analysis
The HRV frequency domain analysis was mainly computed using discrete Fourier transform. The HRV frequency domain conversion is shown in Eqs. (13) and (15). The ECG signal is γ(t), and its autocorrelation function is γ(t):
Its spectral power is W(f):
7.3 Comparison of Various Measurements
In this study, the blood pressure sensing module and heart rate sensing module in the physiological sensing module platform were compared with the sphygmomanometer (model BC30) developed by Beurer, a German company, as shown in Fig. 29. The mean absolute percentage error (MAPE) was used to determine the error rate of the system, as shown in Eq. (16).
A: Data measured by commercially available instrument
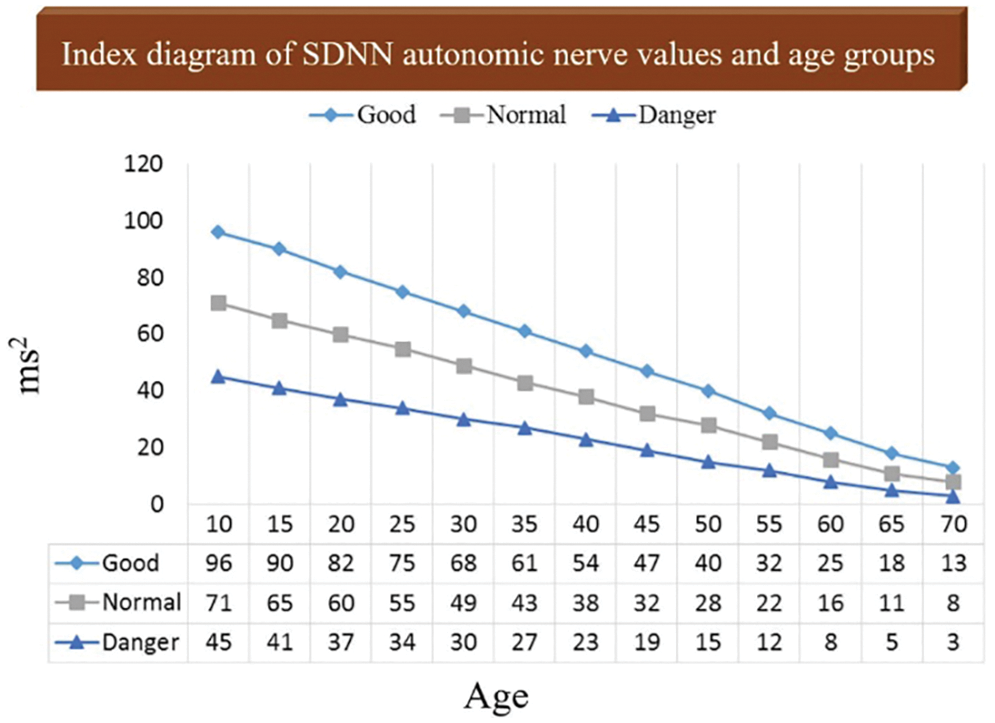
Figure 28: Index diagram of SDNN autonomic nerve values and risk levels of age groups
B: Data measured by the module of this study
C: Data measured by commercially available instruments
The Fig. 30 shows the comparison between this research module and the commercially available blood pressure meter to measure heart rate. The Fig. 31 shows the average absolute error rate of the heart rate. The Fig. 32 shows the comparison between this research module and the commercially available blood pressure meter to measure systolic blood pressure. The Fig. 33 shows the mean absolute error rate of systolic blood pressure. The Fig. 34 shows the comparison between this research module and the commercially available blood pressure meter to measure diastolic blood pressure. The Fig. 35 shows the mean absolute error rate of diastolic blood pressure [36].
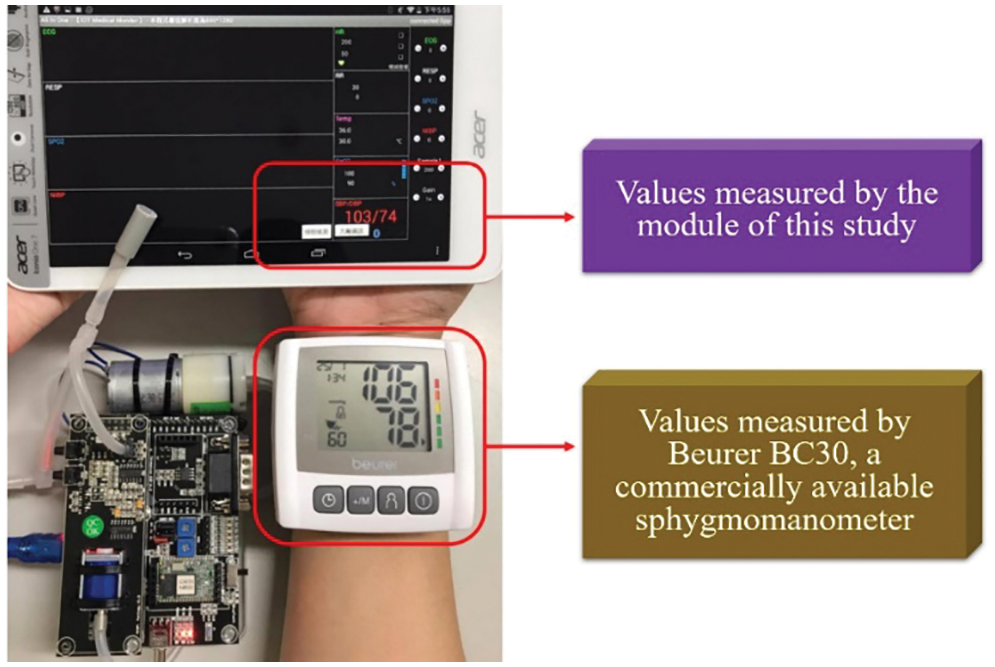
Figure 29: Comparison in measurement between the module of this study and the commercially available sphygmomanometer
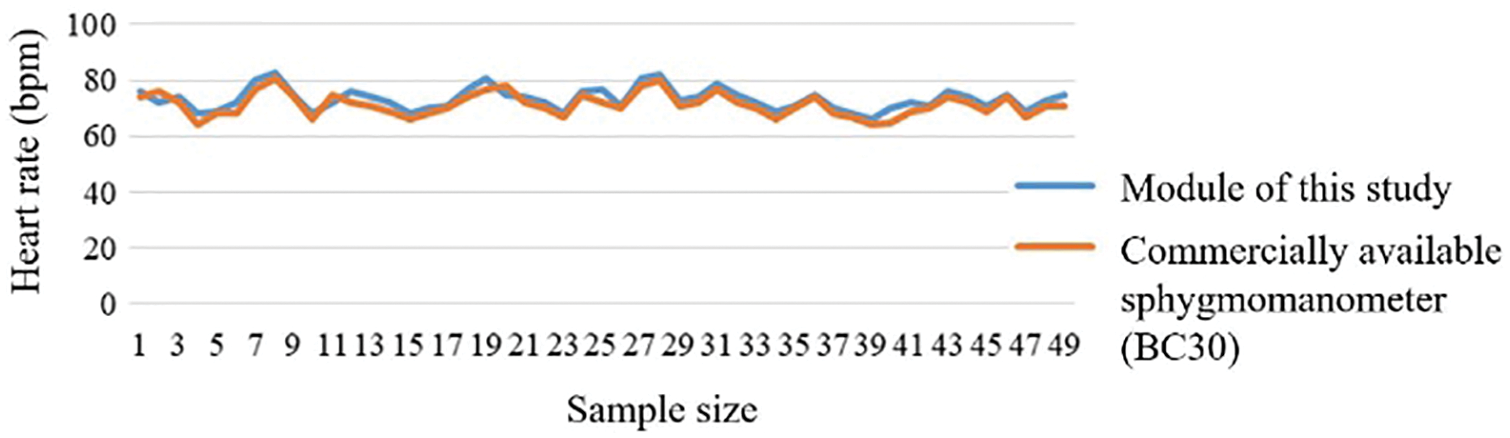
Figure 30: Heart rate comparison
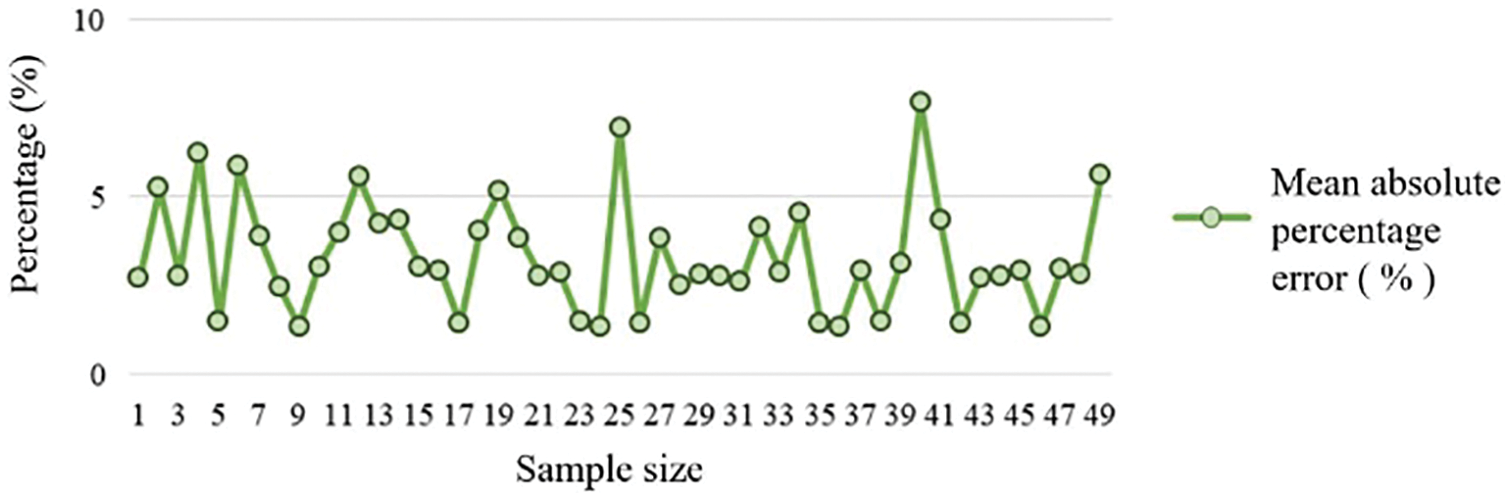
Figure 31: Heart rate mean absolute percentage error
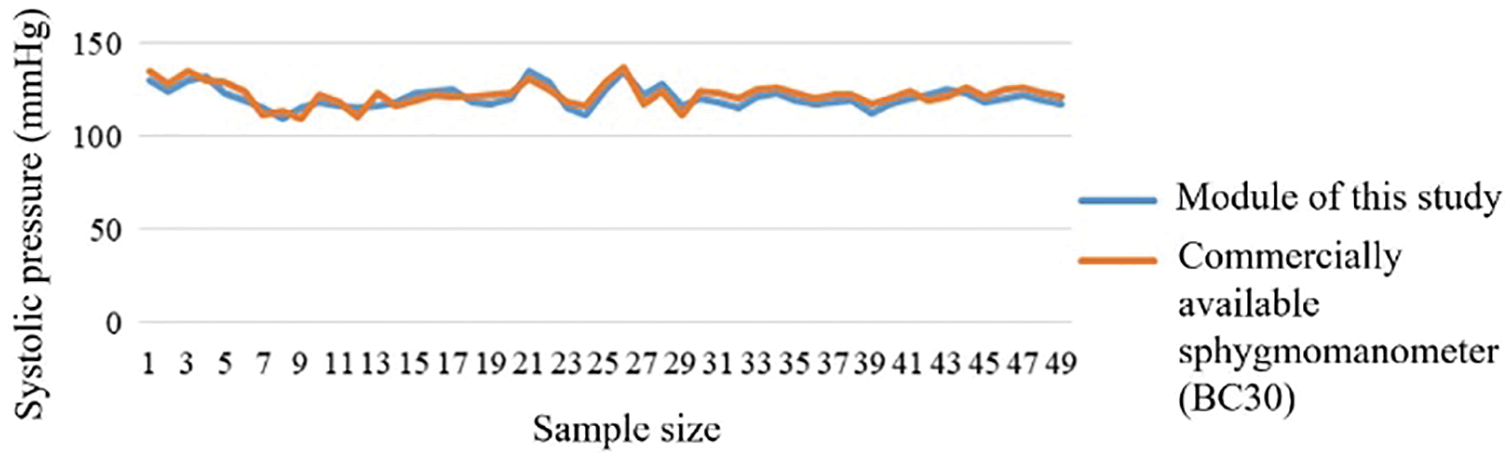
Figure 32: Systolic pressure comparison
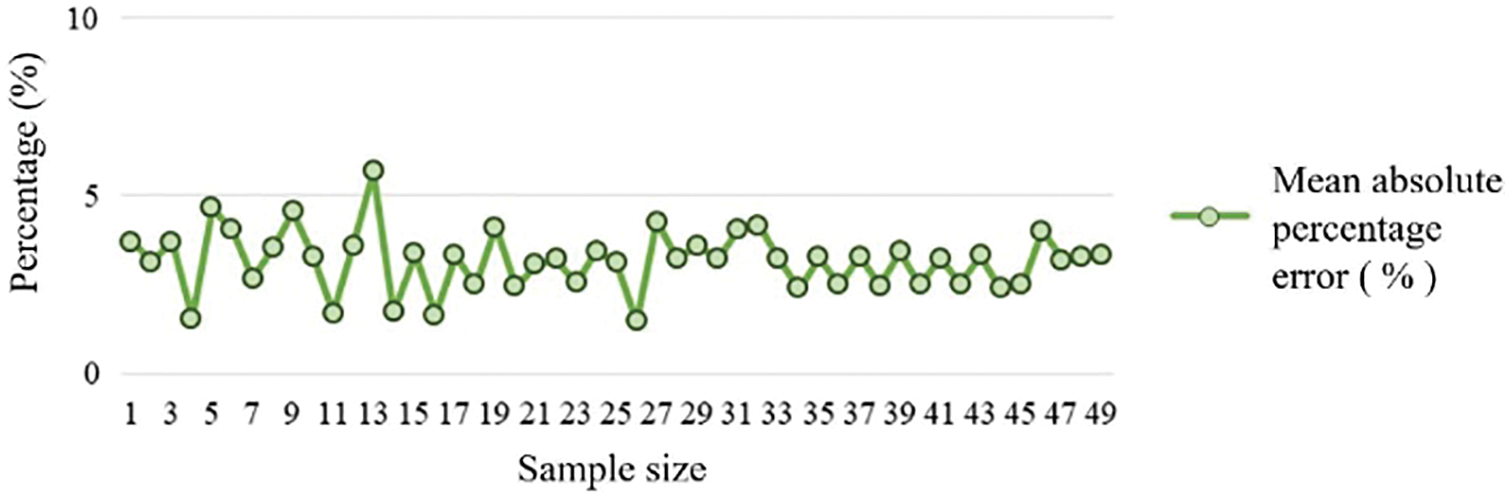
Figure 33: Systolic pressure means absolute percentage error

Figure 34: Diastolic pressure comparison
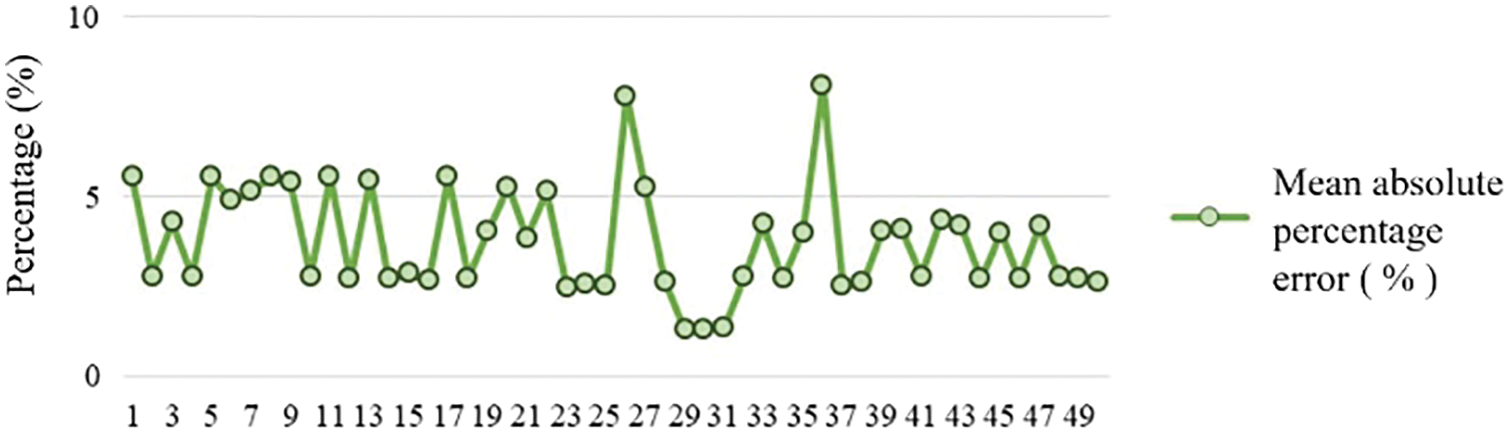
Figure 35: Diastolic pressure means absolute percentage error
According to the statistical analysis, the total number of sudden cardiac deaths is increasing every year. On average, three people have a heart attack every minute and die within an hour, and the success rate of rescue is less than 10%. In fact, it is because most young people think that they are in good health and do not immediately seek medical treatment if they feel uncomfortable, however such bad habits are the main cause of sudden death.
In the networked physiological measurement system of this study, an Android mobile phone application was used as the main physiological value display device, human physiological signals were acquired by a data acquisition module, the values were wirelessly transmitted to the handheld application via Wi-Fi and a Bluetooth module for display, and the handheld device application preliminarily diagnosed the values to advise the users. The handheld application analyzed the risk level of the indicative physiological value determination by doctors and used HRV for in-depth time-frequency analysis of the heart rate values. It could make many adjustments according to the users’ physiological conditions, use the PSO algorithm to seek the optimal value of the SDNN time domain analysis according to age, develop a range of risk levels, and store physiological values using the Amazon EC2 platform to provide a reference for the changes in measured values. The proposed system was built to prevent humans from experiencing excessive stress due to overworking and to prevent users from developing cardiovascular and cerebrovascular diseases. The unexpected karoshi is usually caused by the carelessly slow accumulation of body loads.
Acknowledgement: This research was supported by the Department of Electrical Engineering, National Chin-Yi University of Technology. The authors would like to thank the National Chin-Yi University of Technology, Takming University of Science and Technology, Taiwan, for financially supporting this research. We thank the Amazon EC2 virtual machine cloud technology.
Funding Statement: The authors received no specific funding for this study.
Conflicts of Interest: The authors declare that they have no conflicts of interest to report regarding the present study.
Availability of Data and Materials: Data sharing not applicable to this article as no datasets were generated or analyzed during the current study.
1. T. Lassila, L. Y. D. Marco, M. Mitolo, V. Iaia, G. Levedianos et al., “Screening for cognitive impairment by model-assisted cerebral blood flow estimation,” IEEE Transactions on Biomedical Engineering, vol. 65, no. 7, pp. 1654–1661, 2018. [Google Scholar]
2. F. K. McConnell and S. Payne, “The dual role of cerebral autoregulation and collateral flow in the circle of willis after major vessel occlusion,” IEEE Transactions on Biomedical Engineering, vol. 64, no. 8, pp. 1793–1802, 2017. [Google Scholar]
3. Q. Duan, J. Zeng, K. Chakrabarty and G. Dispoto, “Accurate predictions of process-execution time and process status based on support-vector regression for enterprise information systems,” IEEE Transactions on Computer-Aided Design of Integrated Circuits and Systems, vol. 34, no. 3, pp. 354–366, 2015. [Google Scholar]
4. D. Sobnath, T. Kaduk, I. U. Rehman and O. Isiaq, “Feature selection for UK disabled students’ engagement post higher education: A machine learning approach for a predictive employment model,” IEEE Access, vol. 8, pp. 159530–159541, 2020. [Google Scholar]
5. J. Zhang, X. Wang, Z. Yu, Y. Lyu and S. Mao, “Robust RFID based 6-doF localization for unmanned aerial vehicles,” IEEE Access, vol. 7, pp. 77348–77361, 2019. [Google Scholar]
6. C. Di, B. Zhang, Q. Liang, S. Li and Y. Guo, “Learning automata-based access class barring scheme for massive random access in machine-to-machine communications,” IEEE Internet of Things Journal, vol. 6, no. 4, pp. 6007–6017, 2018. [Google Scholar]
7. M. A. G. Ghasri, A. M. A. Hemmatyar, S. Bayat and M. Mahdieh, “Novel relay selection algorithms for machine-to-machine communications with static RF interfaces setting,” IEEE Access, vol. 8, pp. 189989–190008, 2020. [Google Scholar]
8. I. Soto, O. Amador, M. Urueña and M. Calderon, “Strengths and weaknesses of the ETSI adaptive DCC algorithm: A proposal for improvement,” IEEE Communications Letters, vol. 23, no. 5, pp. 802–805, 2019. [Google Scholar]
9. M. Zhang, A. Raghunathan and N. K. Jha, “Trustworthiness of medical devices and body area networks,” Proceedings of the IEEE, vol. 102, no. 8, pp. 1174–1188, 2014. [Google Scholar]
10. G. Xu, “Iot-assisted ECG monitoring framework with secure data transmission for health care applications,” IEEE Access, vol. 8, pp. 74586–74594, 2020. [Google Scholar]
11. P. P. Ray, N. Thapa and D. Dash, “Implementation and performance analysis of interoperable and heterogeneous IoT-edge gateway for pervasive wellness care,” IEEE Transactions on Consumer Electronics, vol. 65, no. 4, pp. 464–473, 2019. [Google Scholar]
12. G. Bedi, G. K. Venayagamoorthy, R. Singh, R. R. Brooks and K. C. Wang, “Review of internet of things (IoT) in electric power and energy systems,” IEEE Internet of Things Journal, vol. 5, no. 2, pp. 847–870, 2018. [Google Scholar]
13. M. Mohammadi, A. A. Fuqaha, M. Guizani and J. S. Oh, “Semisupervised deep reinforcement learning in support of IoT and smart city services,” IEEE Internet of Things Journal, vol. 5, no. 2, pp. 624–635, 2017. [Google Scholar]
14. L. P. Fraile, S. Tsampas, G. Mylonas and D. Amaxilatis, “A comparative study of loRa and IEEE 802.15.4-based IoT deployments inside school buildings,” IEEE Access, vol. 8, pp. 160957–160981, 2020. [Google Scholar]
15. H. E. Sayed, S. Sankar, M. Prasad, D. Puthal, A. Gupta et al., “Edge of things: The big picture on the integration of edge, IoT and the cloud in a distributed computing environment,” IEEE Access, vol. 6, pp. 1706–1717, 2017. [Google Scholar]
16. S. Mubeen, S. A. Asadollah, A. V. Papadopoulos, M. Ashjaei, H. P. Breivold et al., “Management of service level agreements for cloud services in IoT: A systematic mapping study,” IEEE Access, vol. 6, pp. 30184–30207, 2017. [Google Scholar]
17. B. Xu, L. D. Xu, H. Cai, C. Xie, J. Hu et al., “Ubiquitous data accessing method in IoT-based information system for emergency medical services,” IEEE Transactions on Industrial Informatics, vol. 10, no. 2, pp. 1578–1586, 2014. [Google Scholar]
18. I. Bermudez, S. Traverso, M. Munafò and M. Mellia, “A distributed architecture for the monitoring of clouds and CDNs: Applications to Amazon AWS,” IEEE Transactions on Network and Service Management, vol. 11, no. 4, pp. 516–529, 2014. [Google Scholar]
19. H. Puripunpinyo and M. H. Samadzadeh, “Design, prototype implementation, and comparison of scalable web-push architectures on Amazon web services using the actor model,” in 2017 25th Int. Conf. on Systems Engineering (ICSEng2017. [Google Scholar]
20. K. Swedha and T. Dubey, “Analysis of web authentication methods using Amazon web services,” in 2018 9th Int. Conf. on Computing, Communication and Networking Technologies (ICCCNTIndia, 2018. [Google Scholar]
21. T. Yaqoob, H. Abbas and M. Atiquzzaman, “Security vulnerabilities, attacks, countermeasures, and regulations of networked medical devices—a review,” IEEE Communications Surveys & Tutorials, vol. 21, no. 4, pp. 3723–3768, 2019. [Google Scholar]
22. Y. Xie, X. Li, S. Zhang and Y. Li, “iCLAS: An improved certificateless aggregate signature scheme for healthcare wireless sensor networks,” IEEE Access, vol. 7, pp. 15170–15182, 2019. [Google Scholar]
23. A. Argha, J. Wu, S. W. Su and B. G. Celler, “Blood pressure estimation from beat-by-beat time-domain features of oscillometric waveforms using deep-neural-network classification models,” IEEE Access, vol. 7, pp. 113427–113439, 2019. [Google Scholar]
24. F. Gao, Q. Peng, X. Feng, B. Gao and Y. Zheng, “Single-wavelength blood oxygen saturation sensing with combined optical absorption and scattering,” IEEE Sensors Journal, vol. 16, no. 7, pp. 1943–1948, 2016. [Google Scholar]
25. U. Asgher, R. Ahmad, N. Naseer, Y. Ayaz, M. J. Khan et al., “Assessment and classification of mental workload in the prefrontal cortex (PFC) using fixed-value modified beer-Lambert law,” IEEE Access, vol. 7, pp. 143250–143262, 2019. [Google Scholar]
26. T. Muhammed, R. Mehmood, A. Albeshri and I. Katib, “Ubehealth: A personalized ubiquitous cloud and edge-enabled networked healthcare system for smart cities,” IEEE Access, vol. 6, pp. 32258–32285, 2018. [Google Scholar]
27. H. Jin, Y. Luo, P. Li and J. Mathew, “A review of secure and privacy-preserving medical data sharing,” IEEE Access, vol. 7, pp. 61656–61669, 2019. [Google Scholar]
28. Z. Wang, T. Zhang, L. Kong and G. Cui, “Prediction-based PSO algorithm for MIMO radar antenna deployment in dynamic environment,” The Journal of Engineering, vol. 2019, no. 20, pp. 6646–6650, 2019. [Google Scholar]
29. Y. Shi and R. C. Eberhart, “A modified particle swarm optimizer,” in 1998 in IEEE Int. Conf. on Evolutionary Computation Proc. IEEE World Congress on Computational Intelligence (Cat. No.98TH8360USA, 1998. [Google Scholar]
30. Y. Shi and R. C. Eberhart, “Empirical study of particle swarm optimization,” in Proceedings of the 1999 Congress on Evolutionary Computation-CEC99 (Cat. No. 99TH8406USA, vol. 3, pp. 1945–1950, 2002. [Google Scholar]
31. H. M. Hasanien, “Particle swarm design optimization of transverse flux linear motor for weight reduction and improvement of thrust force,” IEEE Transactions on Industrial Electronics, vol. 58, no. 9, pp. 4048–4056, 2011. [Google Scholar]
32. L. Tong, X. Li, J. Hu and L. Ren, “A PSO optimization scale-transformation stochastic-resonance algorithm with stability mutation operator,” IEEE Access, vol. 6, pp. 1167–1176, 2017. [Google Scholar]
33. H. Jiang, Z. He, G. Ye and H. Zhang, “Network intrusion detection based on PSO-xgboost model,” IEEE Access, vol. 8, pp. 58392–58401, 2020. [Google Scholar]
34. J. Indumathi, A. Shankar, M. R. Ghalib, J. Gitanjali, Q. Hua et al., “Block chain based internet of medical things for uninterrupted, ubiquitous, user-friendly, unflappable, unblemished, unlimited health care services (BC IoMT U6 HCS),” IEEE Access, vol. 8, pp. 216856–216872, 2020. [Google Scholar]
35. J. G. García, C. T. Orriols, F. E. Romero and E. B. Delgado, “Construction of empirical care pathways process models from multiple real-world datasets,” IEEE Journal of Biomedical and Health Informatics, vol. 24, no. 9, pp. 2671–2680, 2020. [Google Scholar]
36. A. F. Klaib and M. S. Nuser, “Evaluating EHR and health care in Jordan according to the international health metrics network (HMN) framework and standards: A case study of hakeem,” IEEE Access, vol. 7, pp. 51457–51465, 2019. [Google Scholar]
 | This work is licensed under a Creative Commons Attribution 4.0 International License, which permits unrestricted use, distribution, and reproduction in any medium, provided the original work is properly cited. |