DOI:10.32604/iasc.2022.020607
| Intelligent Automation & Soft Computing DOI:10.32604/iasc.2022.020607 | |
| Article |
Computation of Aortic Geometry Using MR and CT 3D Images
1Department of Management Information System, College of Business Administration, Taif Univesity, P.O. Box 11099, Taif, 21944, Saudi Arabia
2Department of Computer Science and Information Technology, University of Malakand, Chakdara, Dir, Pakistan
3College of Computer Science and Engineering, University of Jeddah, 20959, Jeddah, Saudi Arabia
4Institute of Computing, Kohat University of Science and Technology, Kohat, 26000, Pakistan
*Corresponding Author: M. Irfan Uddin. Email: irfanuddin@kust.edu.pk
Received: 29 May 2021; Accepted: 30 June 2021
Abstract: The proper computation of geometric parameters of the aorta and coronary arteries are very important for surgery planning, disease diagnoses, and age-related changes observation in the vessels. The accurate knowledge about the geometry of aorta and coronary arteries is required for the proper investigation of heart related diseases. The geometry of aorta and coronary arteries includes the diameter of the ascending and descending aorta and coronary arteries, length of the coronary arteries, branching angles of the coronary arteries and branching points. These geometric parameters from arteries can be computed from the 3D image data. In this paper, we propose an approach for calculating geometric parameters such as length, diameter of the aorta and angles of the coronary arteries. The proposed method automatically computes the geometry of aorta and left and right coronary arteries. The geometry is computed by logically dividing the aorta, calculating the centerline and extracting the features of aorta and coronary arteries. The method has been tested on different 3D CT/MR image data. The results of the proposed method are tested on different data sets to check its accuracy. The results show more accuracy and less computation time on noisy image data as compared to the already developed method. The obtained results are visualized and compared using visualization toolkit (VTK).
Keywords: Aorta; coronary artery; catheter; angiography
Oxygenated blood is supplied to the human body through a main artery called Aorta. It is further divided into left and right coronary arteries. These arteries supply blood to the entire heart muscles. Heart attack and stroke are common results of building-up of plaques and blood clots in arteries. These plaques and clots can block blood flow to heart muscles which may cause death. Aortic stenosis and aneurysm are the most common and most serious valve diseases. In aortic stenosis, aorta becomes narrow which decreases blood flow in coronary arteries. Aortic aneurysm is an abnormal condition in which aorta swell or bulge out due to the artery wall weakness [1]. The swelling or bulge out of aorta can block blood flow to the heart. The blockage of aorta greatly increases the likelihood of pain, heart attack, and even death.
Coronary artery disease (CAD) is investigated by catheter angiography. In this procedure, a catheter is injected into the femoral artery or radial artery. The process is performed through a small incision in the skin. In the next step, the catheter is directed to the examined area and a contrast material is injected through the catheter. In the final stage, the images are captured using a small dose of contrast agent. Aorta and coronary arteries varies from person to person due to age and gender [2] and it is not possible to use common catheter for every patient. Therefore, catheters in different sizes and shapes are now available. Optimal catheter selection is important for the successful coronary artery angiography. Optimal catheter can be selected either with trial and error-based approach or by getting information about the geometry of the arteries. In the first approach, physician tries many catheters on patient and selects a best catheter from the available catheters. In the second approach geometric parameters of the aorta and coronary arteries are calculated from the 3D image data. These geometric parameters are then used for optimal catheter selection prior to the angiography. This is very efficient method and it saves time of catheter selection and reduces risk of angiography. The estimation of correct information enables physicians to select an optimal catheter [3–5]. It will also enable physicians to get correct information about aorta and coronary arteries [6].
Geometric parameters are the estimation of different parameters from 3D MR/CT images as shown in Fig. 1. These parameters can be length, diameter, and angle of curve and tips of the organs. The estimation of correct parameters provides proper diagnoses of disease and treatment. The proper estimation of diameter, curve angles and curvature of aorta and coronary arteries are very important for the proper treatment of heart diseases. Geometric parameters can be calculated manually in which a physician marks 3D image slices manually and associate their results for geometry computation [7]. This is time consuming and need expertise in the field.
We propose a novel approach in this paper for parameters extraction of the aorta and coronary arteries using 3D MR/CT images. We take 2D slices of these segments to calculate centerline of the aorta. In the next step the geometry of the aorta and coronary arteries are calculated from the centerline.
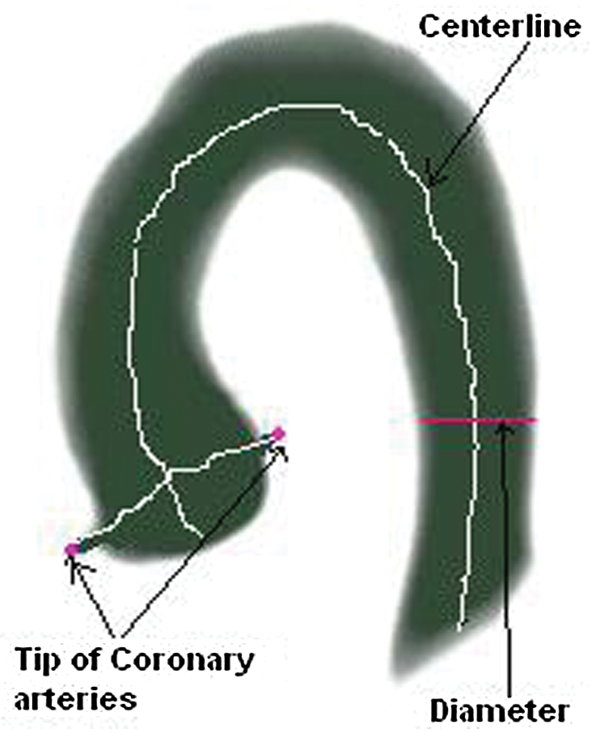
Figure 1: Geometric parameters (length, diameter, angle of curve and tips of the organs) of aorta and coronary arteries
In the literature, several methods have been proposed to compute the geometry of the aorta, but the area still needs more work. Some of these methods extract specific parameter while some are affected with input image noise or resolution. Among these methods, the model based approach for segmentation and quantification of the aortic arch was presented by Wesarg et al. [8]. This approach is based on 3D analytical model to estimate the model parameters. Another centreline based algorithm was presented by Flehmann et al. [9]. In this approach, they first use centreline 3D thinning algorithm [10]. Aorta and coronary arteries parameters are estimated using thinning algorithm.
A noninvasive method proposed by William et al. [11] estimate the aortic valve area by Doppler combined with two-dimensional echocardiography. This approach has the potential of reducing the number of cardiac catheterizations, but it needs high expertise. Another method for anatomic parameters of vascular structure from 3D image data was proposed by Rubin et al. [12] which find centerline, vessels sectional area and mean diameter. The methods proposed by John et al. [13] find aortic root shape and landmark for coronary arteries parameters. Zheng et al. [14]proposed an algorithm to calculate aortic valve landmark without any interaction. Kiviniemi et al. [15] calculated coronary arteries diameter with the use of transthoracic echocardiography (TTE). The algorithm proposed by Flehmann et al. [9] calculate the geometry of aorta. In this method, geometric parameters are calculated from centerline from 3D thinning algorithm [16]. However, the algorithm cannot find centerline of noisy image data.
Although some progress has been done in the computation of aorta and coronary arteries, but the existing methods only find centerline of aorta and coronary arteries. The existing methods have some limitations. For example, some of the existing methods calculate small number of parameters, while some of them need interaction, and some of the available methods cannot find parameters from low resolution image data.
In the proposed approach, the computation of aorta geometry is performed automatically, for example based on an algorithm that logically dividing the aorta into subregions, calculating centerline and extracting features from aorta and coronary arteries, as shown in Fig. 2. The main idea of doing this type of aorta computation is to provide more accuracy and less computation time on noisy image. In the proposed frame work, 3D image of aorta is taken at the first stage. The aorta is then logically divided into multiple segments and then the centerline of aorta is calculated. In the next step, features are extracted from aorta and coronary arteries. In the final stage, the geometry of aorta is calculated.
The proposed approach first segments the left and right coronary arteries by logically dividing the aorta into four regions. The sub-regions of aorta are A, B, C and D these are shown in Fig. 3. In logical division, 2D horizontal slices are taken from the region A. In each slice of region A, the numbers of objects are counted which finds out point i and k. In the following step, vertical slice on the midpoint of point i and k i.e. j is estimated through which point n is found. Similarly, point m is estimated by taking horizontal slice on the midpoint of j and n i.e., point l. The logical division of aorta into four regions are performed through the obtained points i, j, k, l, m and n [17].

Figure 2: Framework of the proposed aortic geometry computation approach

Figure 3: Logical division of the aorta
To calculate geometric parameters, first centerline of aorta is calculated. In order to estimate the center point of each slice with center of gravity of region A, it takes 2 dimensional horizontal slices. Mathematically the process is calculated using the following equation [17].
Region B contain descending aorta curve where it takes 2D slices from angle 0° to angle 90°on point j. The center point is estimated using the above equation. The proposed approach takes 2D slice from ascending aorta curve (region C) from angle 90° to angle 180° on point l. The center pixel is calculated from each slice. The algorithm calculates center point of 2D slices with angle 180°from region D, as shown in Fig. 4.

Figure 4: Extracting 2D slices from the 3D volumes
Combining these points with the center points of region A, B, C and D constructs center line of aorta. In the next step the geometric parameters are calculated.
The accurate estimation of the geometric parameters of coronary arteries is challenging due to the complex shape. In this work, we have shown coronary arteries in region D. The tips of coronary arteries are located by taking vertical slices of region D from outer four sides. By narrowing down our search at some slices it touches aorta tips and note these points. The algorithm selects two estimated points as tips of the coronary arteries and the maximum distance from centerline is shown by these two points. These points show the maximum distance from the centerline. From selected tips of the coronary arteries, it takes vertical slices to inner sides. Sudden change in the number of object pixels shows that it touching the aorta. As the vertical slice ostium points of left and right coronary arteries are calculated as shown in Fig. 5.

Figure 5: Tips of the coronary arteries and ostium points
The algorithm implementation procedure is summarized as follows.

The performance of the proposed aortic computation method was evaluated on 30 benchmark datasets of 3D MR/CT images obtained from different repositories available on the Internet. The algorithm was implemented in ITK & VTK tool. The geometric parameters are extracted by calculating the centerline of the aorta. Since the aorta is logically divided into four regions, the center points of 2D slices of each region and center points of each slice are calculated with midpoint equation. Results of the proposed algorithm on noisy image data are compared with the existing 3D thinning algorithm [11], as shown in Fig. 6.

Figure 6: Comparing centerline extraction algorithm on noisy image data. Result of the proposed algorithm (blue color), result of the existing algorithm (brown color)
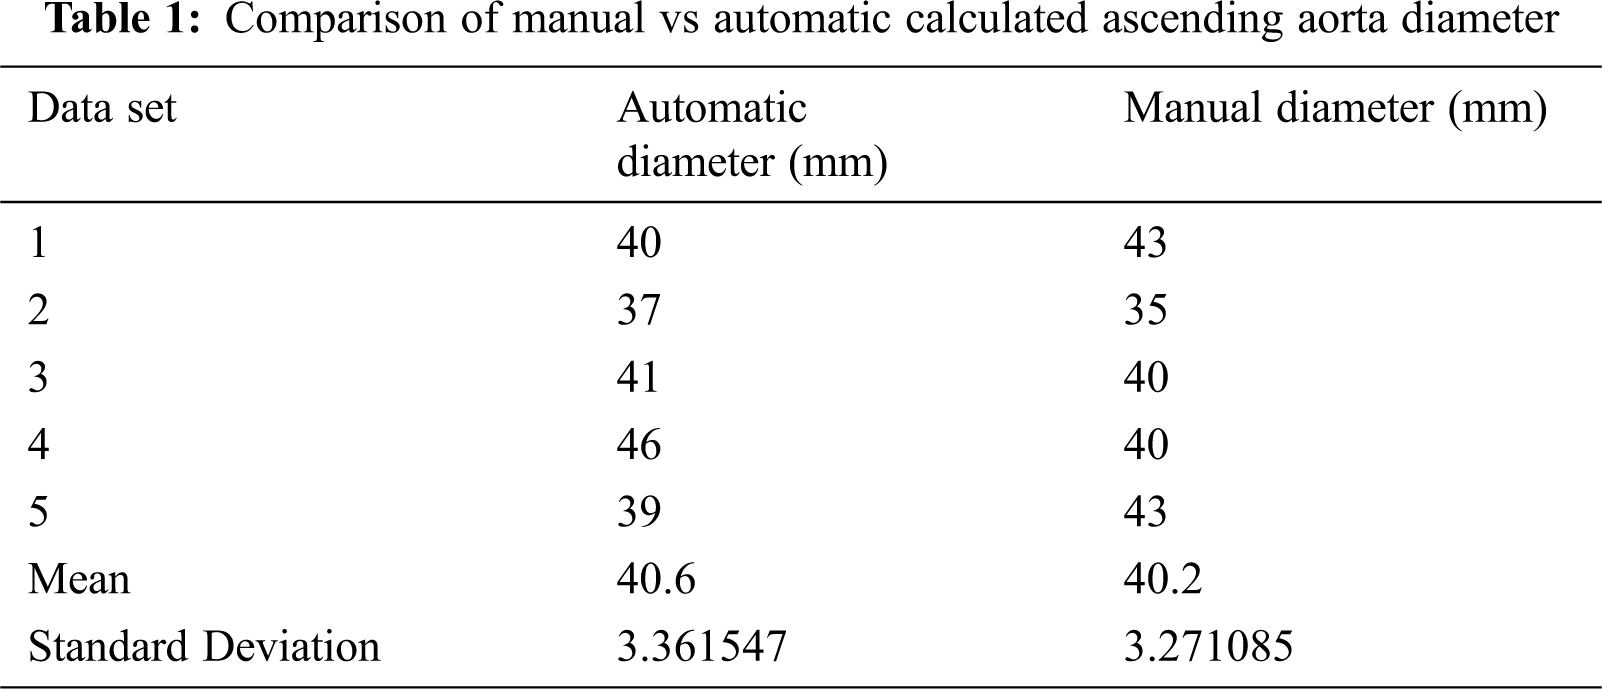
Using the proposed algorithm, the diameters of ascending and descending aorta are calculated in different slices. The average diameter of ascending and descending aorta are also calculated to reduce image noise. The accuracy of proposed is determined by comparing the obtained results with manually calculated values. Diameters of ascending aorta are compared with manually calculated diameters as shown in Tab. 1.
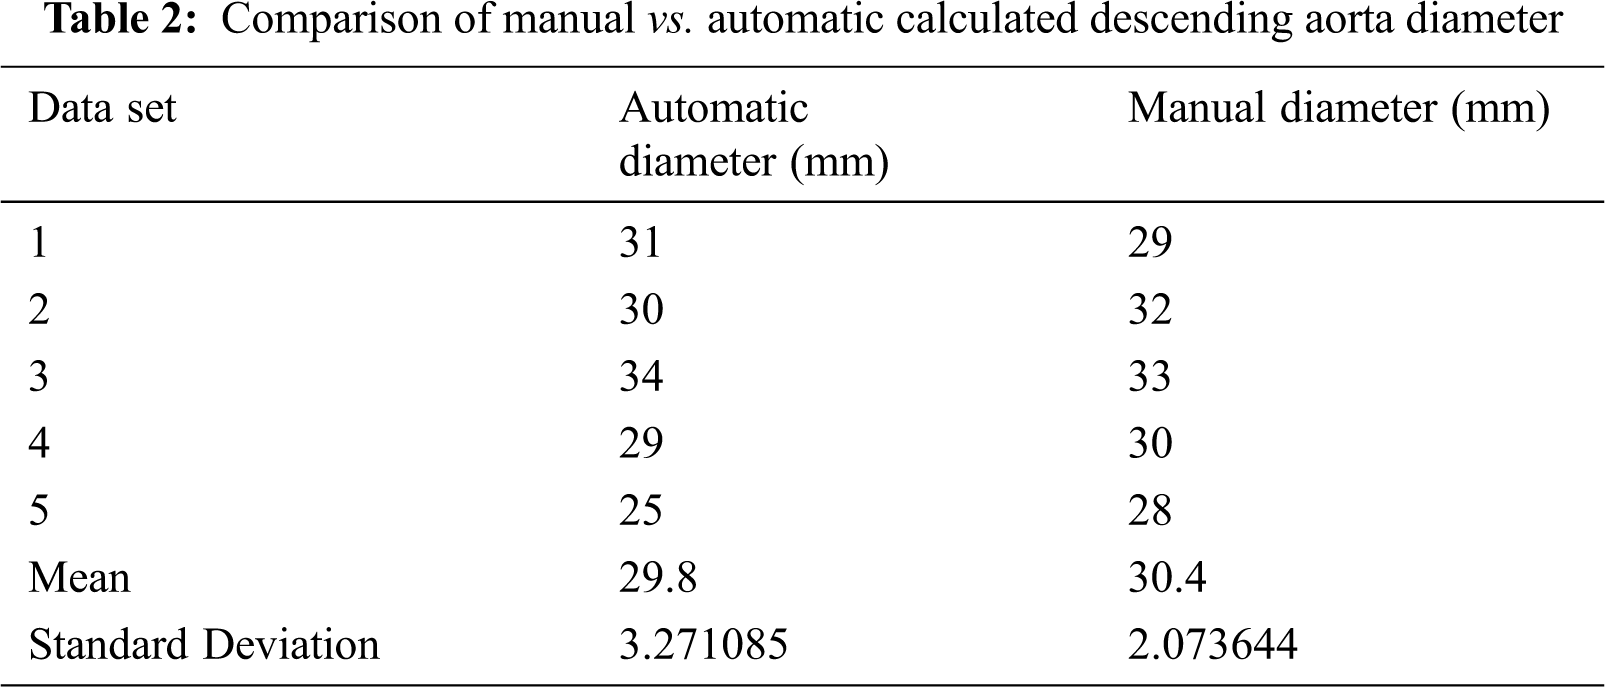
Descending aorta diameter is also calculated in many slices and compared with manually calculated diameter in Tab. 2.
Tips of the coronary arteries are in segment D which is shown in Fig. 6. First, we find tips of the coronary arteries by scanning the region from four sides and then ostium points. Now passing a ray from tip to ostium point which touch centerline at some position. This will make angles with already calculated centerline. The lengths of left and right coronary arteries are determined from the ostium point and tips of the coronary arteries. Results of the proposed method are checked by visualizing tips and ostium points in Visualization Toolkit (VTK) as shown in Fig. 7.

Figure 7: Parameters computed using the proposed algorithm
The traditional methods of calculating geometric parameters of aorta and coronary arteries are time consuming and risky due to variations in the aorta and coronary arteries in different humans. In the traditional methods, it is not possible to accurately and efficiently extract 3D curve for angle calculation. In the traditional method, the cardiologists calculate small number of parameters, need proper interaction and cannot find proper parameters from low resolution image. It will be more helpful for the cardiologists if they use enhanced image processing based method for accurate and efficient calculation prior to coronary artery angiography. Moreover, the cardiologists will know in advance the optimal catheter before they actually start angiography. Image processing based method for calculating geometric parameters (length, diameter, and angle of curve and tips of the organs) and selecting optimal catheter is a new and emerging field in the area which can overcome all these issues. The automatic computation of geometry of aorta and left and right coronary arteries and estimation of optimal catheter before coronary angiography not only reduces the exposure time to radiation but also the possible risk of artery punctures and internal bleeding.
In the present study, we have developed a novel algorithm for calculating geometric parameters of aorta and coronary arteries from 3D MR/CT images. The algorithm uses an enhanced method for extracting 3D curve to calculate the angle and there by greatly reduces the computation time and improves the accuracy. The existing methods [8–14] calculate small number of parameters, need proper interaction and cannot find parameters from low resolution image data, while in the proposed method all the geometric parameters, i.e., length, diameter, tip and angle of the coronary arteries are automatically and accurately computed in 3D. The proposed approach reduces errors in computation caused by the projection of 3D curve on a 2D plane. In the existing method, coronary artery curve is computed following the centerline, which needs extra computation to extract the curve. On the other hand, the proposed method searches for more than two connected pixels in the same slice and then finds the rest of coronary artery curve using centerline. This feature of the proposed method greatly reduces the computation time to extract the parameters from the patient image.
The results of the proposed algorithm are tested on different data sets to check its accuracy. The results show accurate information on noisy image data. We use Visualization Toolkit to visualize the obtained results from the proposed algorithm. The average diameters of both ascending and descending aorta are calculated to overcome image noise. We also compared the results of ascending and descending aorta obtained from the proposed algorithm with manually calculated results available in Tabs. 1 and 2. The results obtained from the proposed algorithm can be used for surgery planning, heart disease diagnose and for angiography. This will also reduce risk in angiography and help in optimal catheter selection.
The selection of the points and parameters estimation does not need any interaction and estimate the parameters automatically. This parameter estimation serves as a basis for the recommendation of the best fitting catheter to be used during angiography.
The purpose of the methodology described in this paper is to compute the geometry of aorta and coronary arteries. The proposed algorithm successfully computes the length, diameter, tip and angle of the coronary arteries. The automatic and accurate computation of the geometric parameters of aorta and coronary arteries provides an easy way for the physician to diagnose heart diseases and plan for surgery. The physician can also select the optimal catheter for angiography with the help of the proposed method. The accuracy of the proposed algorithm is compared with the results obtained from manual calculation. The results of the proposed algorithm are also verified by visualizing some parameters in VTK. The overall results show that the proposed method provides accuracy and efficiency when tested on noisy image data.
Acknowledgement: This study was financially supported via a funding grant by Deanship of Scientific Research, Taif University Researchers Supporting Project number. TURSP-2020/300, Taif University, Taif, Saudi Arabia.
Funding Statement: This study was financially supported via a funding grant by Deanship of Scientific Research, Taif University Researchers Supporting Project number (TURSP-2020/300), Taif University, Taif, Saudi Arabia.
Conflicts of Interest: The authors declare that they have no conflicts of interest to report regarding the present study.
1. A. M. Brinkman, P. B. Baker, W. P. Newman, R. Vigorito and M. H. Friedman, “Variability of human coronary artery geometry: An angiographic study of the left anterior descending arteries of 30 autopsy hearts,” Annals of Biomedical Engineering, vol. 22, no. 1, pp. 34–44, 1994. [Google Scholar]
2. O. Schillaci, “Hybrid SPECT/CT:A new era for SPECT imaging?” European Journal of Nuclear Medicine and Molecular Imaging, vol. 32, no. 5, pp. 521–524, 2005. [Google Scholar]
3. S. U. Rahman, S. Wesarg and W. Völker, “Patient specific optimal catheter selection for right coronary artery,” Medical Imaging 2011: Visualization Image-Guided Procedures and Modeling, vol. 7964, no. 3, pp. 796412, 2011. [Google Scholar]
4. S. U. Rahman, S. Wesarg and W. Völker, Patient specific optimal catheter selection for the left coronary artery, – Informatik schafft Communities. In: INFORMATIK 2011 – Informatik schafft Communities. Bonn: Gesellschaft für Informatik, pp. 446, 2011. [Google Scholar]
5. A. M. Taylor, S. A. Thorne, M. B. Rubens, P. Jhooti, J. Keegan et al., “Coronary artery imaging in grown up congenital heart disease: Complementary role of magnetic resonance and x-ray coronary angiography,” Circulation, vol. 101, no. 14, pp. 1670–1678, 2000. [Google Scholar]
6. J. L. Juergens, “Chronic occlusive arterial disease of the extremities,” Circulation, vol. 27, no. 5, pp. 964–969, 1963. [Google Scholar]
7. R. S. Mitchell, J. G. Michalski and T. M. Carbonell, An artificial intelligence approach. Berlin: Springer, pp. 156–234, 2013. [Google Scholar]
8. S. Worz, H. V. Tengg-Kobligk, V. Henninger, F. Rengier, H. Schumacher et al., “3-D quantification of the aortic arch morphology in 3-D CTA data for endovascular aortic repair,” IEEE Transactions on Biomedical Engineering, vol. 57, no. 10, pp. 2359–2368, 2010. [Google Scholar]
9. E. Flehmann, S. U. Rahman, S. Wesarg and W. Völker, “Towards patient specific catheter selection: Computation of aortic geometry based on fused MRI data,” in Int. Conf. on Functional Imaging and Modeling of the Heart, Berlin, Heidelberg, Germany, pp. 145–152, 2011. [Google Scholar]
10. H. Homann, “Implementation of a 3D thinning algorithm,” Insight Journal, vol. 12, no. 10, pp. 421, 2007. [Google Scholar]
11. W. A. Zoghbi, K. L. Farmer, J. G. Soto, J. G. Nelson and A. Q. Miguel, “Accurate noninvasive quantification of stenotic aortic valve area by Doppler echocardiography,” Circulation, vol. 73, no. 3, pp. 452–459, 1986. [Google Scholar]
12. G. D. Rubin, D. S. Paik, P. C. Johnston and S. Napel, “Measurement of the aorta and its branches with helical CT,” Radiology, vol. 206, no. 3, pp. 823–829, 1998. [Google Scholar]
13. M. John, R. Liao, Y. Zheng, A. Nöttling, J. Boese et al., “System to guide transcatheter aortic valve implantations based on interventional C-arm CT imaging,” in Int. Conf. on Medical Image Computing and Computer-Assisted Intervention, Berlin, Heidelberg, Germany, Springer, pp. 375–382, 2010. [Google Scholar]
14. Y. Zheng, M. John, R. Liao, J. Boese, U. Kirschstein et al., “Automatic aorta segmentation and valve landmark detection in C-arm CT: Application to aortic valve implantation,” in Int. Conf. on Medical Image Computing and Computer-Assisted Intervention, Berlin, Heidelberg, Germany, Springer, pp. 476–483, 2010. [Google Scholar]
15. T. O. Kiviniemi, M. Saraste, J. W. Koskenvuo, K. E. J. Airaksinen, J. O. Toikka et al., “Coronary artery diameter can be assessed reliably with transthoracic echocardiography,” American Journal of Physiology-Heart and Circulatory Physiology, vol. 286, no. 4, pp. H1515–H1520, 2004. [Google Scholar]
16. C. M. Ma and M. Sonka, “A fully parallel 3D thinning algorithm and its applications,” Computer Vision and Image Understanding, vol. 64, no. 3, pp. 420–433, 1996. [Google Scholar]
17. S. U. Rahman, A. U. Rahman and F. Alam, “An Algorithm for Extracting Centerline of the Aorta from CT/MR 3D Images,” in Proc. of the 3rd Int. Conf. on Biomedical Signal and Image Processing, Seoul, Republic of Korea, ACM, pp. 43–46, 2018. [Google Scholar]
 | This work is licensed under a Creative Commons Attribution 4.0 International License, which permits unrestricted use, distribution, and reproduction in any medium, provided the original work is properly cited. |