DOI:10.32604/iasc.2022.017123
| Intelligent Automation & Soft Computing DOI:10.32604/iasc.2022.017123 | |
| Article |
An Enhanced Memetic Algorithm for Feature Selection in Big Data Analytics with MapReduce
1Anna University, Chennai, 600025, India
2Department of Electronics and Communication Engineering, Excel Engineering College, Namakkal, 637303, India
*Corresponding Author: Umanesan Ramakrishnan. Email: umanesan.r@gmail.com
Received: 21 January 2021; Accepted: 19 April 2021
Abstract: Recently, various research fields have begun dealing with massive datasets forseveral functions. The main aim of a feature selection (FS) model is to eliminate noise, repetitive, and unnecessary featuresthat reduce the efficiency of classification. In a limited period, traditional FS models cannot manage massive datasets and filterunnecessary features. It has been discovered from the state-of-the-art literature that metaheuristic algorithms perform better compared to other FS wrapper-based techniques. Common techniques such as the Genetic Algorithm (GA) andParticle Swarm Optimization (PSO) algorithm, however, suffer from slow convergence and local optima problems. Even with new generation algorithms such as Firefly heuristic and Fish Swarm Heuristic, these questions have been shown to overcome. This paper introduces an improved memetic optimization (EMO) algorithm for FS in this perspective by using conditional criteria in large datasets. The proposed EMO algorithm divides the entire dataset into sample blocksandconducts the task of learning in the map steps. The partial result obtained is combined into a final vector of feature weights in the reductionprocess which defines the appropriate collection of characteristics. Finally, the method of grouping based on the support vector machine (SVM) takes place. Within the Spark system, the proposed EMO algorithm is applied and the experimental results claim that it is superior to other approaches. The simulation results show that the maximum AUC values of 0.79 and 0.74 respectively are obtained by the EMO-FS model.
Keywords: Big data analytics; metaheuristic; evolutionary algorithm; memetic optimization
Development of prediction techniques from data needs compact Machine Learning (ML), pattern recognition, as well as statistical modeling approaches. These models are appliedto Big Data and monitor the massive number of instances and numerous predictive quantities named as features [1]. Generally, the data dimensionality can be reduced, which yields a selected subset of original features of the predictive data regarding a result of interest T. In specific, the main theme of FS is referred to as exploring a feature subset that has limited size as well as optimal detection. The architecture of Hadoop MapReduce is shown in Fig. 1.

Figure 1: Architecture of Hadoop MapReduce
To remove irrelevant and repetitive data related to weakly relevant models [2], FS assiststhe learning process. This produces a simulation outcome where the prediction techniques along with minimum features are easy to analyze, understand, rely on, and also are rapid in prediction. Hence, FS offers a valid intimation of data produced in a data generation method as well as it acts as a basic tool in knowledge discovery; deep correlation of solutions to FS along with simple techniques which produce the explored data [3]. FS can be referred to as the fundamental operation in detecting a by-product. Developing an FS technique is very hard becausethe FS problem is a combinatorial issue andis also named NP-hard for linear regression problems [4]. The exhaustive searching of every feature subset is ineffective than the minimum feature subset.Heuristic search approaches, as well as approximate considerations, are essential for scaling FS, that ranges from convex relaxations and parametric consideration like linearity which is a Lasso technique [5] for causally-inspired, non-parametric modules, namely, secured data distribution for a causal method [6]. Especially, Big Data has maximum dimensions and higher instance volume, and hence processing has become CPU-based and data-intensive which is difficult to be managed using an individual system. One of the major problems in this study is topartition datahorizontally(samples) and vertically (features), which is termed as hybridpartitioning, and thus computations are processed locally for every block as well as integrated minimum communication load. Another problem is thetypes of heuristics that might be applied rapidly and protectively to remove irrelevant and repetitive features. Hybrid partitioning of data samples and learned models [7] issaid to be an open studying issue in Big ML models whereas protective FS heuristics are presented for sparse Big Data [8], which can only be applied for data with maximum values. For addressing the limitations present in this model for big volume data, Parallel, Forward–Backward with Pruning (PFBP) technology has been proposed. PFBP technologyis independent of data sparsity and henceit is used in massive and sparse datasets; and expanded for adding the optimizations particularly in sparse datasets. PFBP depends upon statistical tests of independence and is motivated by the statistical causal model which shows the merging possibility in the form of causal technique and specifically Bayesian networks and maximal ancestral graphs [9].
The application of Data Mining (DM) tools to solve the issues related to big data requires redeveloping models similar to the environment. From diverse aspects, the MapReduce concept [10] and a shared file systemhavebeen established by Google as an efficient and effective module to report the big data analysis. Hence, it might be applied in DM instead of parallelization approaches like MPI (Message Passing Interface) which has constraints of fault-tolerant and simplicity. Several experiments have been carried out in parallelization of ML devices by applying the MapReduce technique [11]. In recent times, novel and reliable workflows are used to expand the reputed MapReduce model, namely Apache Spark [12], and are effectively employed in different DM as well as ML issues [13]. Data preprocessing approaches and robust data reductiontechniques mainly focus on cleaning and simplifying the input data. Hence, it tries to simulate the DM process and enhance the accuracy by removing noisy and repetitive data. Also, specific work defines two major kinds of data reduction modules. Initially, instance selection and instance production [14] concentrate on theinstance level. When compared with other previous techniques, evolutionary models are applied effectively in feature selection. Thus, the additional improvement of a single size might restrict the usability and perform poorly in offering a preprocessed dataset within a limited duration while solving a major issue. This paper presents no models for handling feature space along with evolutionary big data techniques.
From the state-of-the-art literature, it has been found that metaheuristic algorithms perform better compared to other wrapper-based techniques for FS. However, popular techniques like the Genetic Algorithm (GA) andparticle swarm optimization (PSO) algorithm suffer from slow convergence and local optima problems. These limitations are attempted to solve using later generation algorithms like Firefly heuristic and Fish Swarm Heuristic. In this view, this paper presents an Enhanced Memetic Optimization (EMO) algorithm for FS by including conditional criteriain big datasets. The proposed EMO algorithm partitions the actual dataset into blocks of samples andperforms a learning process in the map phase. In the reduce phase, the attained partial outcome is re-merged into a final vector of feature weights which can be used to identify the required set of features. The proposed EMO algorithm has been implemented within the Spark framework and the experimental outcomes state that the proposed EMO algorithm is superior to other algorithms.The rest of the paper is organized as follows. Section 2 offers the proposed EMO-FS model and Section 3 validates the performance of the EMO-FS model. Finally, Section 4 concludes the paper.
The proposed MapReduce model for FS is acombinedform of generic classificationtasks. Specifically, the EMO-FS technique depends on the EMO technique to perform the FS process. Initially, EMO-FS has been employed on the actual dataset to attain a vector of weights that exhibits the relationship between all attributes. This vector has been employed with an alternate MapReduce function to generate minimized dataset and the resultant dataset is used by SVM. Fig. 2 shows the overall process of the EMO-FS model.

Figure 2: Overall process of the proposed EMO-FS model
Here, the proposed correlation-basedmemetic FS algorithm forclassification is shown in Fig. 3.

Figure 3: Flow chart for EMO
In the initialization step,the GA population is initiated randomly along with a chromosome by encoding the candidate feature subset. Then a local search (LS) is performed. The LS can be processed on every part of the chromosometo attainlocal optimum and enhance the feature subset. Genetic operators like crossover and mutation are carried out for producing the upcoming population. This step is repeated till the termination criteria are reached.
2.1.1 Population Initialization
In FS, the candidate feature subset is represented by selecting an encoded chromosome. A chromosome is defined as a binary string of a length similar to the overall number of features where every bit encodes in one feature. A bit is either 1 or 0 that represents the corresponding feature’s presence. A chromosome length is implied as
It can be described in a simple term by classification accuracy:
where
2.1.3 Local Search Improvement Procedure (LS)
Symmetrical uncertainty in thecorrelation-oriented filter ranking model assures that it is an effective method to eliminate repeated features and boost classification accuracy. By assuming this, the application of the correlation-based filter ranking technique iswith SU values in the form of memes.While the correlation between the feature and a class is greater for creating a related class and the link between the alternate features is up to the level to be detected by other related features, then it is known to be the best feature to perform the classification.
SU-oriented correlation values depend on the data-theoretical model of entropy which is a value of uncertainty regarding an arbitrary variable. Hence, the entropy of a variable
and theentropy of
where
Based on the obtained value, a feature
SU balances the IG's bias to features and massive values and normalizes the value to
SU value is constrained by 2 main functions as given in the following:
• It is capable of removing features that havelower SU valueswhen compared with a threshold.
• Acquires a feature weight thathelps in the population initialization for GA in memetic technology.
A feature with a higher SU measure obtains maximum weight whereas the features with minimum SU values are eliminated. For a dataset that has
In this process, benchmark GA tools are employed, including linear ranking selection, uniform crossover, as well as mutation operators relied on the elitist procedure. Nevertheless, when prior knowledge of the optimal value is given, the value of bit ‘1’ is compared with higher
For developing an efficient hybrid technique in global optimization, the merits of the exploration abilities of EA and exploitation abilities of LS have been combined in a balanced manner. In MDE, it is presented with a novel contraction procedure that integrates 2 types as given in the following:
•
•
Hence, the suggestion of
where
The parallelization of the EMO model is defined by applying the MapReduce technique to get a vector of weights. Assume
The reduce phase can be processed by a unique task that reducesthe duration of the implementation process by reducing MapReduce overhead. The complete function is carried out with limited iterations of MapReduce workflow and elimination of extra disk usage.
2.3 Support Vector Machine (SVM)
A famous classification technique used in supervised ML is the SVM. It aims to determine the best partition hyperplane that has the highest margin of the training data dividing the
2.4 Dataset Reduction with MapReduce
Here, the vector
The vector
For result analysis, a set of two datasets, namely Epsilon and ECBDL14-ROS, has been used. The details of the datasets are provided in Tab. 1. The table states that the Epsilon dataset includes a total of 400000 instances fort raining and 100000 instances for testing. It contains a set of 2000 features. The ECBDL14-ROS dataset includes a total of 65003913 instances fort raining and 2 897 917 instances for testing. It contains a set of 631 features.

The experiments are conducted on a cluster of 20 computing nodes and a master node. Each computing node is comprised of: (i) Processors: 2 x Intel Xeon CPU E5-2620, (ii) Cores: 6 per processor (12 threads), (iii) Clock frequency: 2.00 GHz, (iv) Cache: 15 MB, (v) Network: QDR InfiniBand (40 Gbps), (vi) Hard drive: 2 TB, and (vii) RAM: 64 GB. The Hadoop master performs the NameNode and JobTracker hosted ona master node. The previous techniques manage the HDFS, by coordinating the slave tools interms of corresponding DataNode operation, whereas the alternate one is responsible for TaskTrackers of every computing node that implements the MapReduce approach. Spark uses the same configuration, where the master process has been placed on a master node, and worker task has been exhibited on slave machines. These models are capable of sharing the HDFS file system. The above-mentioned details define the software applied for these works: (i) MapReduce execution: Hadoop 2.0.0-cdh4.7.1. MapReduce 1 (Cloudera’s open-source Apache Hadoop distribution), (ii) Spark version: Apache Spark 1.0.0, (iii) Higher mapping operations: 320 (16 per node), (iv) Greater reducer tasks: 20 (1 per node), and (v) Operating system: CentOS 6.6. The overall number of cores on the cluster is 240. Also, the maximum number of maps are maintained to improve the application of cluster by enabling greater parallelism and good data placement, which decreases the network overload.
Tab. 2 and Fig. 4 provide the FS results achieved by the EMO-FS model. The figure states that the EMO-FS model has chosen a set of 1342 features from the total 2000 features on the applied Epsilon dataset. Besides, the EMO-FS model has selected a total of 452 features from the available features on the applied ECBDL14-ROS dataset.

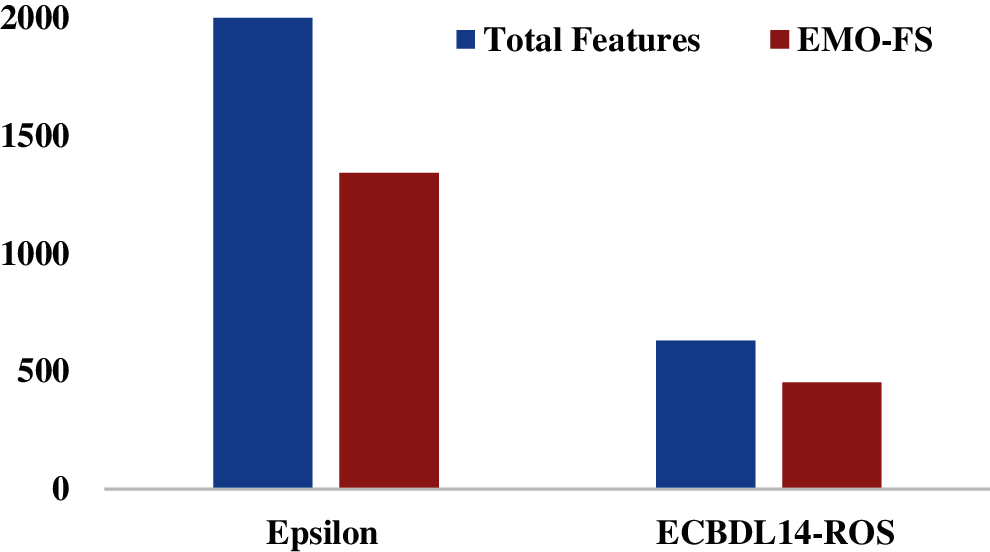
Figure 4: FS results offered by the EMO-FS model
Tab. 3 shows the execution time analysis of the EMO-FS model compared with MR-EFS and sequential CHC models on the applied Epsilon dataset. The table values indicate that the EMO-FS model requires a minimum execution time of 4587 s, whereas the MR-EFS and sequential CHC models need maximum execution times of 6531 and 162345 s respectively.

Fig. 5 and Tab. 4 provide a comparative analysis of the proposed EMO-FS model under various classifiers on the applied Epsilon dataset. Under the application of the SVM classifier on the Epsilon dataset, it is shown that the EMO-FS model has achieved a maximum AUC of 0.73 whereas the MR-EFS and sequential CHC models have attained minimum AUC values of 0.68 and 0.65 respectively. At the same time, it is noted that the SVM model has obtained a minimum AUC of 0.59 with no FS process.

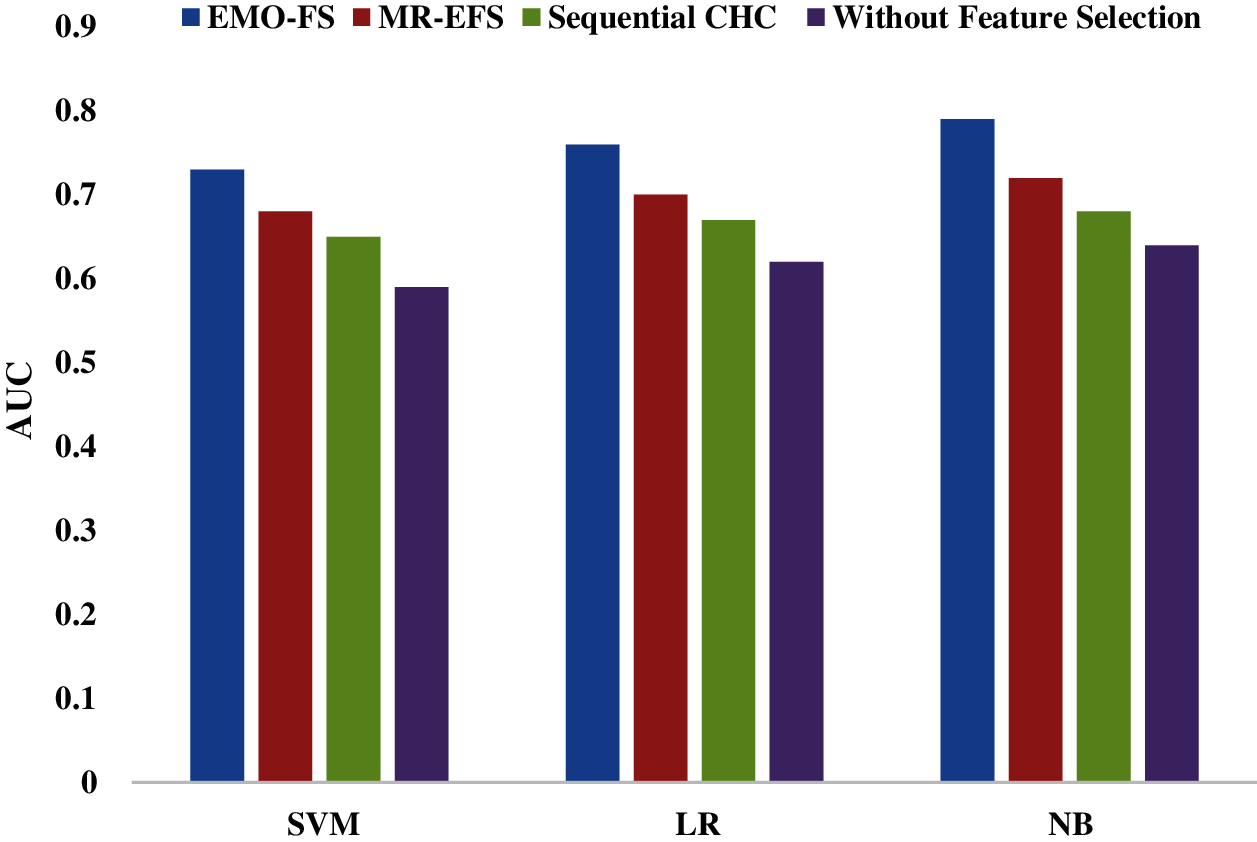
Figure 5: AUC results for the Epsilon dataset
Similarly, under the application of the LR classifier on the Epsilon dataset, it is depicted that the EMO-FS model leads to a maximum AUC of 0.76 whereas the MR-EFS and sequential CHC models have offered lower AUC values of 0.70 and 0.67 respectively. Along with that, it is observed that the LR model reaches the least AUC of 0.62 with no FS process. Finally, under the application of the NB classifier on the Epsilon dataset, it is exhibited that the EMO-FS model has offered a maximum AUC of 0.79 whereas the MR-EFS and sequential CHC models have obtained minimum AUC values of 0.72 and 0.68 respectively. At the same time, it is noted that the NB model has obtained a minimum AUC of 0.64 with no FS process.
Tab. 5 depicts the training run-time analysis for the Spark using different classifiers. On assessing the training run-time analysis under the SVM model, it can be observed that the EMO-FS model requires a minimum run-time of 310.63 s whereas the MR-EFS, Sequential CHC, and no FS models need maximum run-time values of 334.18, 345.27, and 400.38 s respectively. Likewise, while determining the training run-time analysis under LR, it can be observed that the EMO-FS model requiresa minimum time of 334.18 s whereas the MR-EFS, Sequential CHC, and no FS models need higher run-time values of 367.29, 398.07, and 430.48 s respectively. Moreover, during the training run-time assessment under NB, it can be observed that the EMO-FS model requires a lower time of 231.49 s whereas the MR-EFS, Sequential CHC, and no FS models need maximum run-time values of 264.26, 300.21, and 340.42 s respectively.

Fig. 6 and Tab. 6 provide the comparative analysis of the proposed EMO-FS method by using different classification methods on the ECBDL14-ROS dataset. By applying SVM on the ECBDL14-ROS dataset, the EMO-FS technique attains a higher AUC of 0.69, and the MR-EFS and sequential CHC frameworks achievereduced AUC values of 0.64 and 0.62 respectively. Simultaneously, it is evident that the SVM classifier accomplishes a lower AUC of 0.56 without the FS task. Likewise, by using LR classification on the ECBDL14-ROS Dataset, it is shown that the EMO-FS technique tends to achieve a greater AUC of 0.71 while MR-EFS and sequential CHC approaches provide minimum AUC measures of 0.64 and 0.63 respectively.

In line with this, it is monitored that the LR classifier has attained a minimum AUC of 0.58 in the absence of FS operation. Consequently, with the help of the NB classifier on the ECBDL14-ROS dataset, it is implemented that the EMO-FS approach has provided a qualified AUC of 0.74 while MR-EFS and sequential CHC frameworks have reached lower AUC rates of 0.67 and 0.65 respectively. Concurrently, it is pointed that the NB technology has accomplished the least AUC of 0.61 in lack of FS process.
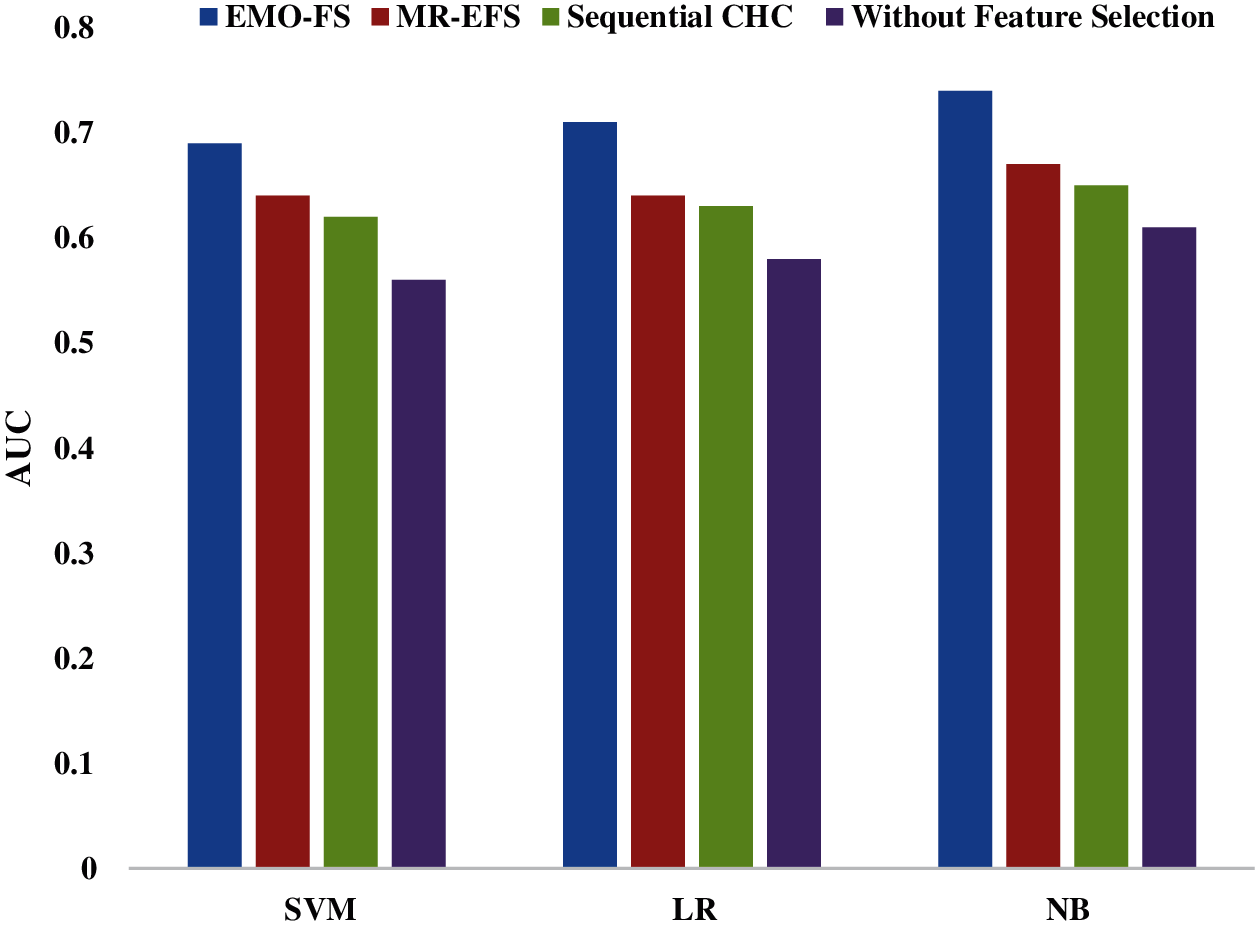
Figure 6: AUC results for the ECBDL14-ROS dataset
Tab. 7 shows a training implementation time analysis for Spark with diverse classifiers. While applying the training run-time analysis on the SVM method, it might be monitored that the EMO-FS technique needs a lower run-time of 831.49 s and the MR-EFS, Sequential CHC, and no FS models require higher implementation time rates of 864.28, 912.40, and 978.37 s correspondingly. Similarly, by computing the training run-time analysis by applying LR, it is noted that the EMO-FS framework gives a minimum time of 893.42 s while the MR-EFS, Sequential CHC, and without FS models acquire greater run-time measures of 978.38, 978.38, and 986.45 s respectively. Likewise, at the time of training run-time examined by using NB, it is tracked that the EMO-FS method provides the least time of 198.47 s and the MR-EFS, Sequential CHC, and no FS techniques require higher run-time values of 215.09, 300.26, and 396.98 s respectively.

The above experimental details show that the proposed model offers maximum performance on the applied Epsilon and ECBDL14-ROS datasets. The simulation outcome indicates that the EMO-FS model has achieved maximum AUC values of 0.79 and 0.74 respectively. The following features of the EMO algorithm contribute to this achievement: The proposed EMO algorithm partitions the actual dataset into blocks of samples and performs a learning process in the map phase. In the reduce phase, the attained partial outcome is re-merged into a final vector of feature weights which can be employed to identify the required set of features.
This paper has presented an EMO algorithm for FS in big datasets. The proposed EMO algorithm partitions the actual dataset into blocks of samples and performs a learning process in the map phase. In the reduce phase, the attained partial outcome is re-merged into a final vector of feature weights which can be employed to identify the required set of features. Finally, the SVM-based classification process takes place. The proposed EMO algorithm has been implemented within the Spark framework. The above experimental details show that the proposed model offers maximum performance on the applied Epsilon and ECBDL14-ROS datasets. The simulation outcomes indicate that the EMO-FS model has achieved maximum AUC values of 0.79 and 0.74 respectively. In the future, the proposed model can be further enhanced by the use of deep learning and parameter tuning models.
Acknowledgement: We appreciate the linguistic assistance provided by TopEdit (www.topeditsci.com) during the preparation of this manuscript.
Funding Statement: The authors received no specific funding for this study.
Conflicts of Interest: The authors declare that they have no conflicts of interest to report regarding the present study.
1. Z. Zhao, R. Zhang, J. Cox, D. Duling and W. Sarle, “Massively parallel feature selection: An approach based on variance preservation,”Machine Learning, vol. 92, no. 1, pp. 195–220, 2013. [Google Scholar]
2. G. H. John, R. Kohavi and K. Pfleger, “Irrelevant features and the subset selection problem,” in Machine learning Proceedings: Proc. of the eleventh international conf., New Brunswick, NJ, Rutgers University, pp. 121–129, 1994. [Google Scholar]
3. I. Tsamardinos and C. F. Aliferis, “Towards principled feature selection: Relevancy, filters and wrappers,” in proc. of the ninth international workshop on artificial intelligence and statistics, Florida, United States, pp. 1–8, 2003. [Google Scholar]
4. W. J. Welch, “Algorithmic complexity: Three NP-hard problems in computational statistics,” Journal of Statistical Computation and Simulation, vol. 15, no. 1, pp. 17–25, 2007. [Google Scholar]
5. R. Tibshirani, “Regression shrinkage and selection via the lasso,” Journal of the Royal Statistical Society: Series B (Methodological), vol. 58, no. 1, pp. 267–288, 1996. [Google Scholar]
6. N. Krishnaraj and K. Bellam, “Improved distributed frameworks to incorporate big data through deep learning,” Journal of Advanced Research in Dynamical & Control Systems, vol. 12, no. 3, pp. 332–338, 2020. [Google Scholar]
7. E. P. Xing, Q. Ho, P. Xie and D. Wei, “Strategies and principles of distributed machine learning on Big Data,” Engineering, vol. 2, no. 2, pp. 179–195, 2016. [Google Scholar]
8. S. R. Gallego, H. M. Taln, D. M. Rego, V. B. Canedo, J. M. Bentez et al., “An information theory-based feature selection framework for big data under apache spark,” IEEE Transactions on Systems, Man, and Cybernetics: Systems, vol. 48, no. 9, pp. 1441–1453, 2018. [Google Scholar]
9. T. Richardson and P. Spirtes, “Ancestral graph Markov models,” Annals of Statistics, vol. 30, no. 4, pp. 962–1030, 2002. [Google Scholar]
10. J. Dean and S. Ghemawat, “Map reduce: A flexible data processing tool,” Communications of the ACM, vol. 53, no. 1, pp. 72–77, 2010. [Google Scholar]
11. W. Zhao, H. Ma and Q. He, “Parallel k-means clustering based on MapReduce,” in proc. IEEE Conf. on Cloud Computing, Beijing, China, pp. 674–679, 2009. [Google Scholar]
12. M. Zaharia, M. Chowdhury, T. Das, A. Dave and J. Ma, “Resilient distributed datasets: A fault-tolerant abstraction for in-memory cluster computing,” in proc. 9th USENIX Conf. on Networked Systems Design and Implementation, San Jose, CA, pp. 1–14, 2012. [Google Scholar]
13. K. Thomas, C. Grier, J. Ma, V. Paxson and D. Song, “Design and evaluation of a real-time url spam filtering service,” in proc. IEEE Sym. on Security and Privacy, Berkeley, CA, pp. 447–462, 2011. [Google Scholar]
14. J. S. Sanchez, “High training set size reduction by space partitioning and prototype abstraction,” Pattern Recognition, vol. 37, no. 7, pp. 1561–1564, 2004. [Google Scholar]
 | This work is licensed under a Creative Commons Attribution 4.0 International License, which permits unrestricted use, distribution, and reproduction in any medium, provided the original work is properly cited. |