DOI:10.32604/iasc.2022.021006

| Intelligent Automation & Soft Computing DOI:10.32604/iasc.2022.021006 |  |
| Article |
Detection and Avoidance of Clone Attack in IoT Based Smart Health Application
1Department of Computer Science and Engineering, RMK College of Engineering and Technology, Chennai, 601206, India
2Department of Computer Science and Engineering, RMK Engineering College, Chennai, 601206, India
*Corresponding Author: S. Vaishnavi. Email: csevaishnavi309@yahoo.com
Received: 12 June 2021; Accepted: 23 July 2021
Abstract: The deployment of wireless sensors in the hostile environment makes them susceptible to malicious attacks. One of the most harmful attacks is the clone attack in which a malicious node illegitimately claims the identity of a genuine node in the network and eventually tries to capture the entire network. This attack is also termed as node replication attack. The mobile nature of wireless sensor network (WSN) in smart health environment increases the vulnerability of node replication attack. Since the data involved in smart health system are highly sensitive data, preserving the system from the attack by malicious nodes is a crucial task. In this research, we proposed a new scheme called Routing Protocol for Energy Efficient Networks (RPEEN) for the detection of clone attack in IoT-based smart health application. The main advantage of this scheme is the increase in the energy efficiency as the energy efficiency is the most important constraint in WSN systems. The performance of the proposed scheme is highlighted using parameters like time delay, residual energy, throughput, energy efficiency and error rate. Further, to portray the efficacy of the proposed algorithm, this algorithm is compared with the existing Hybrid Multi-Level Clustering (HMLC) algorithm. It has been found that the proposed RPEEN scheme achieves a time delay of 0.63 and 0.6 ms with 0 dead nodes and by avoiding clone attack respectively. Furthermore, the proposed scheme attains the highest residual energy of 49.5 J for the 2500 rounds. In addition, the proposed algorithm attains the highest throughput of 99.2% for the 50 nodes.
Keywords: Wireless sensor network; routing protocol; smart health; clone attack; energy efficiency
Authors Wireless sensor networks are widely being employed recently in various applications like remote sensing, health care, weather forecasting, security, surveillance etc. The cost of these sensor nodes varies based on the size of the node, type and duration of the battery installed, the life span of the node, weight of the sensor etc [1]. The WSN are commonly categorized into three categories. The first type is the flat based network. The second type is the cluster-based network and the third type is the hierarchical network. The routing of packets is the most challenging task in wireless sensor networks (WSN) [2]. The data packets are transmitted from the individual sensor node to the cluster head node and are then transmitted to the base station. The identification of routing path is very important especially in the presence of malicious nodes. Another major challenge is the design of energy efficient protocols [3]. This is because, the process of battery change is a tedious task, since the nodes once deployed in critical remote regions cannot be accessed easily. Hence, the routing protocols must be designed such that the energy consumption is low. Clustering routing protocols are popularly being used for the transfer of packets as these protocols have load balancing benefits and also consume minimum amount of energy [4]. The next important challenge in the WSN systems is the detection of attacks The WSN sensors are most vulnerable to various external attacks such as phishing attack, malware attack and ransomware attack. These are just a few of the malware and techniques hackers use to get access to your website, software, or infrastructure from the outside. The capacity to handle with each of these difficulties and prevent external cyber threats, regardless of their form, is an important part of any competent protection firm’s repertory. Thus, detection of abnormal behaviour is very important to identify the presence of these attacks. The detection of abnormal behaviour in WSN systems can be done using three different schemes [5]. The first scheme involves the usage of data mining techniques. The second scheme includes the usage of machine learning algorithms. The final scheme involves clustering protocols. The common types of WSN attacks include wormhole attack, black-hole attack, eaves dropping attack, clone attack and Sybil attack. The main drawbacks of these types of attacks are the loss of integrity and authenticity of the network [6]. The main characteristic of WSNs is the dynamic and self-organizing nature of the sensor nodes. Due to this, the authentication of sensor nodes is a challenging task. Thus, any malicious node can easily enter into the network without proper authentication. Also, the battery constraint makes the authentication process very difficult [7]. Jamming is another popular type of attack in which the malicious nodes transmits signals with high amplitude and same frequency as that of the network frequency to completely demolish the security of the wireless sensor network [8]. Another popular type of attack is the Sybil attack. In this type of attack, the malicious node uses the ID of another genuine node in the network and creates a huge multitude of malicious users to completely capture the network. In this type of attack, the location of all the malicious nodes remain the same [9]. Clone attack is another major threat to the WSNs. Here, a single malicious node creates multiple replica clones with the same ID to capture the WSN. Two types of techniques are used for the detection of clone attack. These includes centralized detection schemes and distributed detection schemes [10]. In this research, we present a new protocol for the detection of clone attack in wireless sensor network.
Shaukat et al. [11] has proposed a scheme in which hybrid multi-level detection was performed for the identification of clone attack. The proposed algorithm was based on the concept of danger theory. Here, in the first step the abnormal behaviour of the sensor nodes was identified. In the next step, the battery level of the nodes was checked. The danger theory is based on several detection levels: first stage (features the danger zone (DZ) by examining aberrant behaviour of mobile networks), second phase (battery assessment and pseudo random), and third phase (battery inspection and pseudo random) (inform about replica to other networks). Security factors such as true alarm, power, detection time, network bandwidth, and detection delay illustrate the DT method’s reliability. In the final step, the information about the presence of clone nodes was informed to all other nodes in the network. Vaishnavi et al. [12] has presented a new approach called novel Sybil Watch Enhanced Privacy-Aware Smart Health (E-PASH) approach for the identification of Sybil attack in the wireless sensor networks. IoT-based smart health care application was considered in this work. The detection of Sybil attack was performed in three stages. The first stage involved the initialization phase. The second stage was the secure communication phase and the final stage was the Sybil node detection phase. Angappan et al. [13] has designed a system in which the Sybil attack was detected based on the neighbourhood information of the sensor nodes. The proposed protocol was based on the intra cluster communication between the sensor nodes. Priya et al. [14] presented a countermeasure technique in which the denial-of-sleep attack was identified in wireless sensor networks. This scheme was designed based on the combination of firefly algorithm and the Hopfield neural network system. The mobile sink technique was combined with the neural network and used in the identification of denial-of-sleep attack. Numan [15] has presented a review on various techniques proposed in the literature for the detection of clone node attack. Both the theoretical survey and analytical survey was presented for the comparison purpose. Furthermore, this paper presented the challenges and drawbacks involved in clone attack detection in the wireless sensor networks. Hongsong et al. [16] has designed a new protocol for the detection of low-rate denial of service attack in the wireless sensor networks. This protocol was designed based on the Hilbert Huang transform. The non-linear traffic signal data was analysed and utilized for the identification of low-rate denial of service attack. Fotohi et al. [17] has proposed a technique based on the RSA algorithm for the detection of denial-of-sleep attack. Here, a new protocol based on interlock scheme was proposed. The RSA cryptography scheme was used in this paper for ensuring the nodes are maintained in the energy saving mode. This scheme achieved highest energy saving results. Gowshika et al. [18] has presented an intrusion detection system for the identification of man-in-the middle attack in wireless sensor networks. Here, signature activity monitoring was performed to identify the attack in which three schemes were utilized. These schemes included detection and blocking scheme, classification scheme and the system analysis scheme. Baig et al. [19] utilized the average dependence estimators for the identification of denial of service attack. This system was designed for the IoT based wireless sensor networks. Initially, data generation was performed followed by the feature ranking. Feature ranking was following by the feature generation. Finally, the system was trained and tested using datasets. Premkumar et al. [20] used the deep learning mechanism for the identification of denial of service attack. Here, light weight authentication mechanisms were utilized. This scheme involved two phases. The first phase was the deep learning phase using defence mechanism. The second phase was the data forwarding phase.
The Hybrid Multi-Level Clustering algorithm (HMLC) was used to create a multi-level replica detection methodology that uses a hybrid method (centralized and transmitted) to protect wireless sensor networks (WSNs) from clone attacks. The HMLC idea is based on a multi-level detection system: first phase (features the danger zone (DZ) by monitoring anomalous mobile node activity), second phase (battery check and pseudo random), and third phase (battery check and pseudo random) (inform about replica to other networks WSN).
Security characteristics such as false negative, resource, transmission time, network bandwidth, and detection latency emphasise the method’s effectiveness. The proposed algorithm also indicates that the HMLC technique is capable of identifying and neutralizing harmful acts started by the clone. Currently, crime is on the rise, and it is critical to adapt the systems in response. Indeed, it is recognized that transmission must be safeguarded by careful inspection at each detection limit.
3 IoT Based Smart Health Care System
IoT sensors are popularly being used in smart health care systems for supporting multiple patients in real-time. These sensors capture the medical information of the patients and transfer the data to the cloud using various wireless communication devices. The communicated data is then stored, processed and transferred to the health care community. The focus of this research was to create a secure IoT-based system that uses WSNs to transport data safely and effectively among source and destination nodes. Each sensor’s individual data is likewise saved on the server, and after confirmation, the data may be transmitted with the appropriate destination. As a result, for IoT based smart healthcare monitoring applications, secure data transfer is required. There are two types of security limitations: WSN security and data protection. Secure positioning, non-repudiation, reliability, authentication, dependability, and identification are data security needs, whereas privacy, confidentiality, consistency, and data freshness are data protection needs. This study meets network security needs by creating a secure IoT-based system that is supported by the proposed methodology to meet data security standards.
Fig. 1 shows the block diagram of the IoT-based smart health care system. Some of the IoT based medical data acquisition devices include blood pressure sensor, ECG sensor, control unit, motion sensor, EMG sensor, insulin pump and control unit. The control unit is responsible for controlling the data acquisition and data transfer. The acquired data is then transferred to the cloud using wireless medium like WiFi modem 3G/4G network etc. The data in the cloud in then sent to the servers for storage. Further, database units are used for the temporary storage of this medical data. From the servers, the data is sent to the health care system. The health care providers analyse the data and provide medical services to the patients.
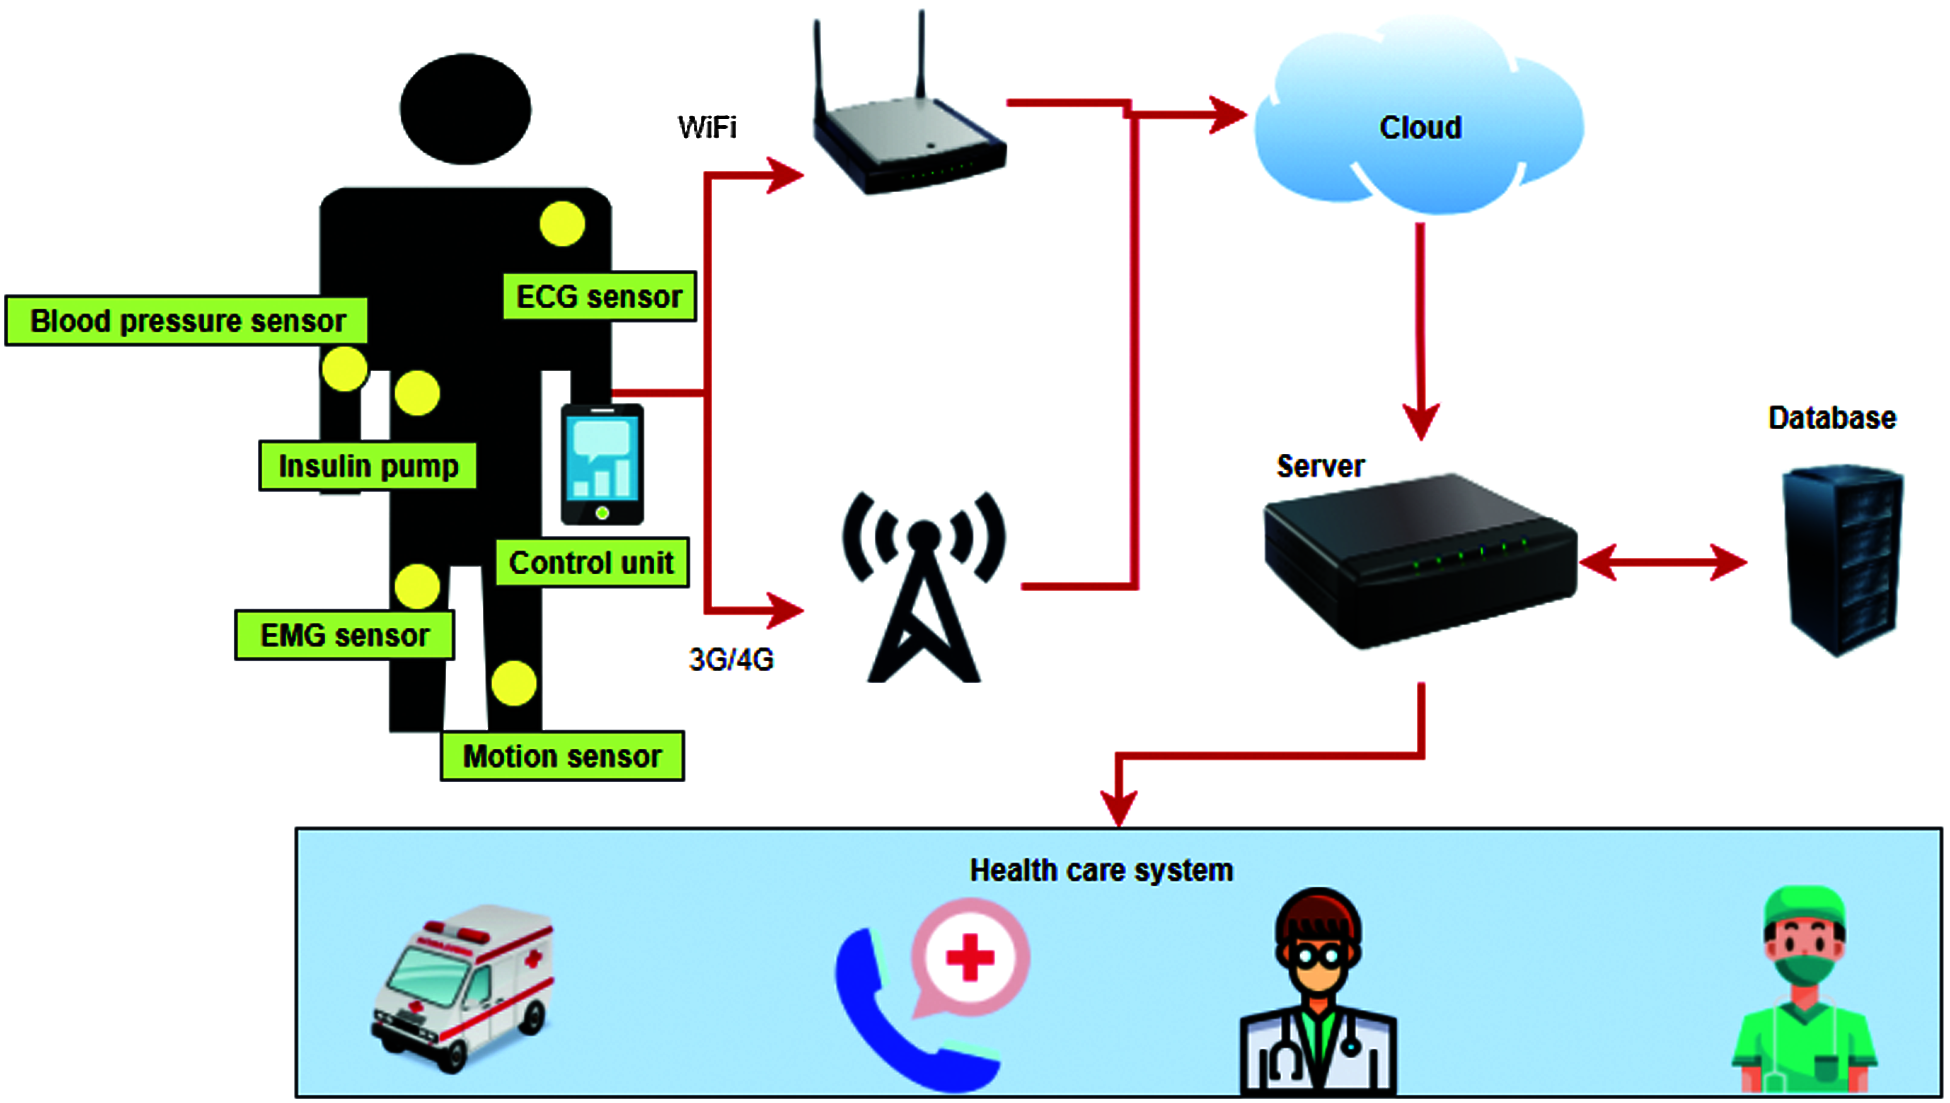
Figure 1: Block diagram of IoT-based smart health care system
In the proposed methodology, the WSN model is considered to be homogeneous, with N amount wireless sensor nodes. The random way point model is assumed in the proposed methodology per all single node mobility, even when their location and placement are distinct from neighbor nodes at T time duration. In a fixed battery situation, the system must replace dead nodes with fresh mobile nodes in order to conduct competent processes such as sensing data and transferring information in the WSN. Furthermore, it is assumed that each CH can identify each sensing node by exchanging and sending information (e.g., battery, key, position, ID) in the form of data packets to all CH.
The WSN nodes are always implemented in clusters where all cluster has a CH. In WSNs, the function of clone detection depends on the efficiency of CH, since CH is authorized to transfer data, connect with other CH and prepare the data before communication. As a result, selecting a mobile node capable of achieving the aforementioned goal is critical. The following characteristics are expected for curve based cluster deployment in this research:
1. The high battery level should be required for the CH to complete the tasks.
2. In WSN, a CH should be designated for high-level connection and coverage.
3. The chosen CH should be situated near the BS to save transmission time at the base station (BS).
4. For the specified detection interval, the CH is fixed through time.
The clusters in IoT based WSN, which are placed together in R-radius circles. In a WSN, the clustering technique is primarily used to extend the network’s life duration. During each detection phase, it performs self-organizing and re-clustering processes for CH selection. As a result, one wireless sensor node executes the functions of CH, while other nodes operate as cluster members. CH talks with node members and provides the data gathered to the BS. It relies on 2 levels: the setup phase and the equilibrium phase. In the first step, clustering and CH are formed. The CH is chosen by the nodes separately.
The message is relayed via the RPEEN algorithm by the specified CH. By computing Received Signal Strength Indication, associate mobile nodes select the cluster head (i.e., CH) (RSSI). The H) builds a TDMA detected list for its nodes and allots a time frame slot for communication for each node when the CH collects the data and communicates to the cluster. Following the selection of the cluster and CH, the second step begins. Sensor nodes establish a link to CH in steady state by allotting slots according on the period. Otherwise, mobile nodes are in a state of sleep. CH will begin sending data to BS once it gathers data from all related nodes.
The majority of previous work on WSN deploying for hurdle coverage assumes that the deployment curve is a straight line. In some circumstances, line-based deployment decreases the issue aspect and can lead to the optimal method. Analyze the circumstances in which a line-based deploying is ineffective and, for the first time, highlight the need for a curve-based deployment.
3.1 Clone Attack in Wireless Sensor Network
There are various attacks faced by the sensors in a wireless sensor network (WSN). One of the common attacks is the clone attack. The identification of this type of attack is a tedious task as it involves malicious sensor nodes that impersonate genuine sensor nodes without proper authorization mechanisms. In IoT systems, the main constraint in the energy requirement, thus design of algorithms that identify clone attack with minimal energy requirement is an important task.
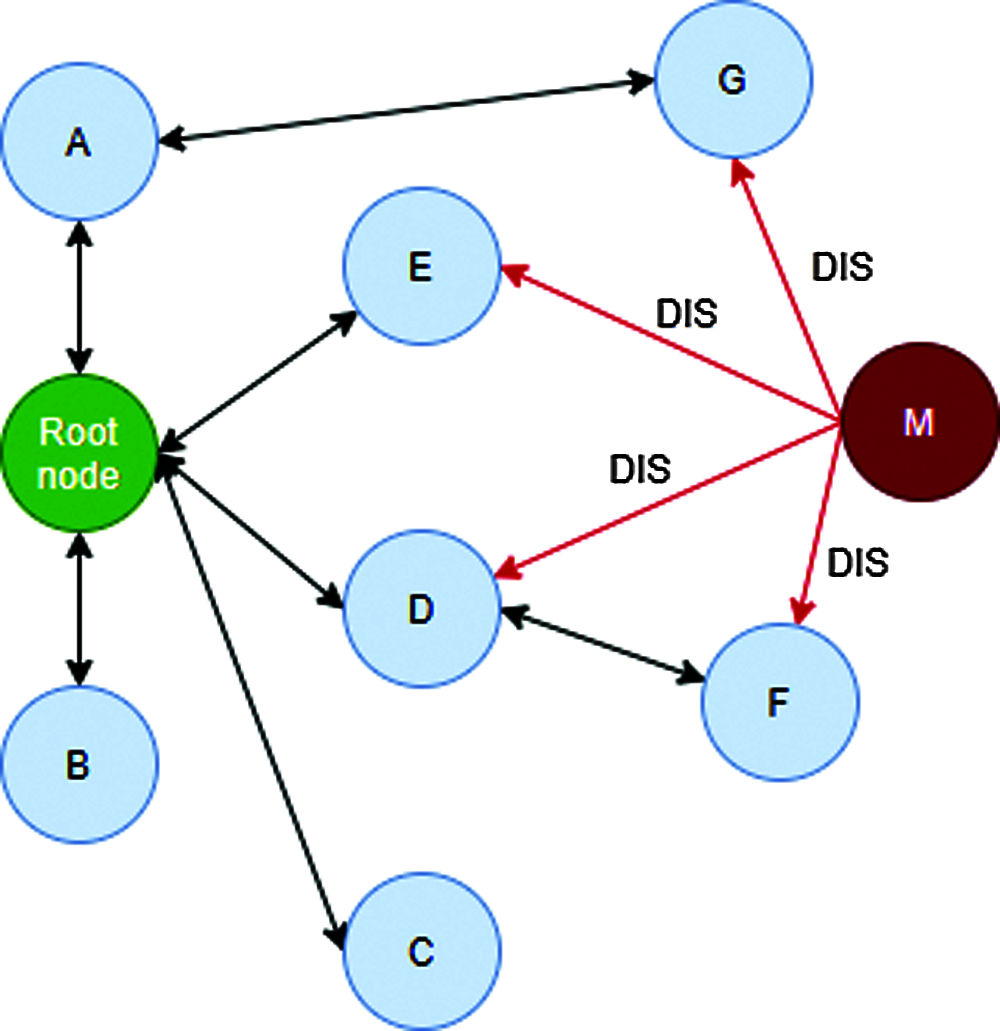
Figure 2: Clone attack in wireless sensor network
Fig. 2 illustrates clone attack in wireless sensor network for Destination-oriented Directed Acyclic Graph (DODAG) architecture. Consider the genuine nodes A, B, C, D, E, F and G. A new malicious node M impersonates the node B in the network. A DODAG configuration allows the nodes to self-configure and organize themselves. This ability allows the malicious nodes to easily attach themselves to the DODAG tree without any authorization mechanisms. They can also easily impersonate multiple nodes at various locations. In the first step, the malicious node M understands the configuration of the DODAG tree and then attaches itself to it. In the second step, a control message called DODAG Information Solicitation (DIS) is sent by the malicious node M to all its siblings. This message contains the cloned identity of the node B. In the third step, all the other nodes in the network accept the node M by sending a DODAG Information Object (DIO) control message. In the next step, the DODAG topology is reconstructed with the new member M and the transfer of data takes place in the presence of the malicious node M. In this way, clone attack is done by the node M in the wireless sensor network.
3.2 Levels of Clone Attack Detection in WSN
There are three main levels in the detection of clone attack in wireless sensor networks. Detection can be done in any one of the levels to convert an attacked network to a protected clone attack free network. The speed with which a malicious action may start in the network determines the effectiveness of a clone attack. An advisory overcomes the disadvantages of a compromised sensor node’s unattended nature by obtaining all data from its memory, including its key, identity, and communication information, among other things. As a result, an adversary’s ability to collect a node varies on how rapidly she can acquire knowledge about the system and the destination node. In this work, we offer a model for an adversary’s data collecting process. In addition, an advisory can replicate the seized mobile node and re-deploy it to the desired destination’s network. As a result, if the clone node is not noticed in a timely manner, it might be extremely dangerous.
Fig. 3 depicts the levels of clone attack detection in WSN. In the first level, the frequency monitoring is done. In this level, the cluster head nodes (CH) are employed for monitoring the frequency α at which the mobile node meeting takes place. If the value of this frequency α is below the predefined threshold, then the presence of clone node is detected. In this way, CH nodes are employed for the detection of clone attack at the first level. In the level-2 detection, the battery values of the nodes are monitored and compared.
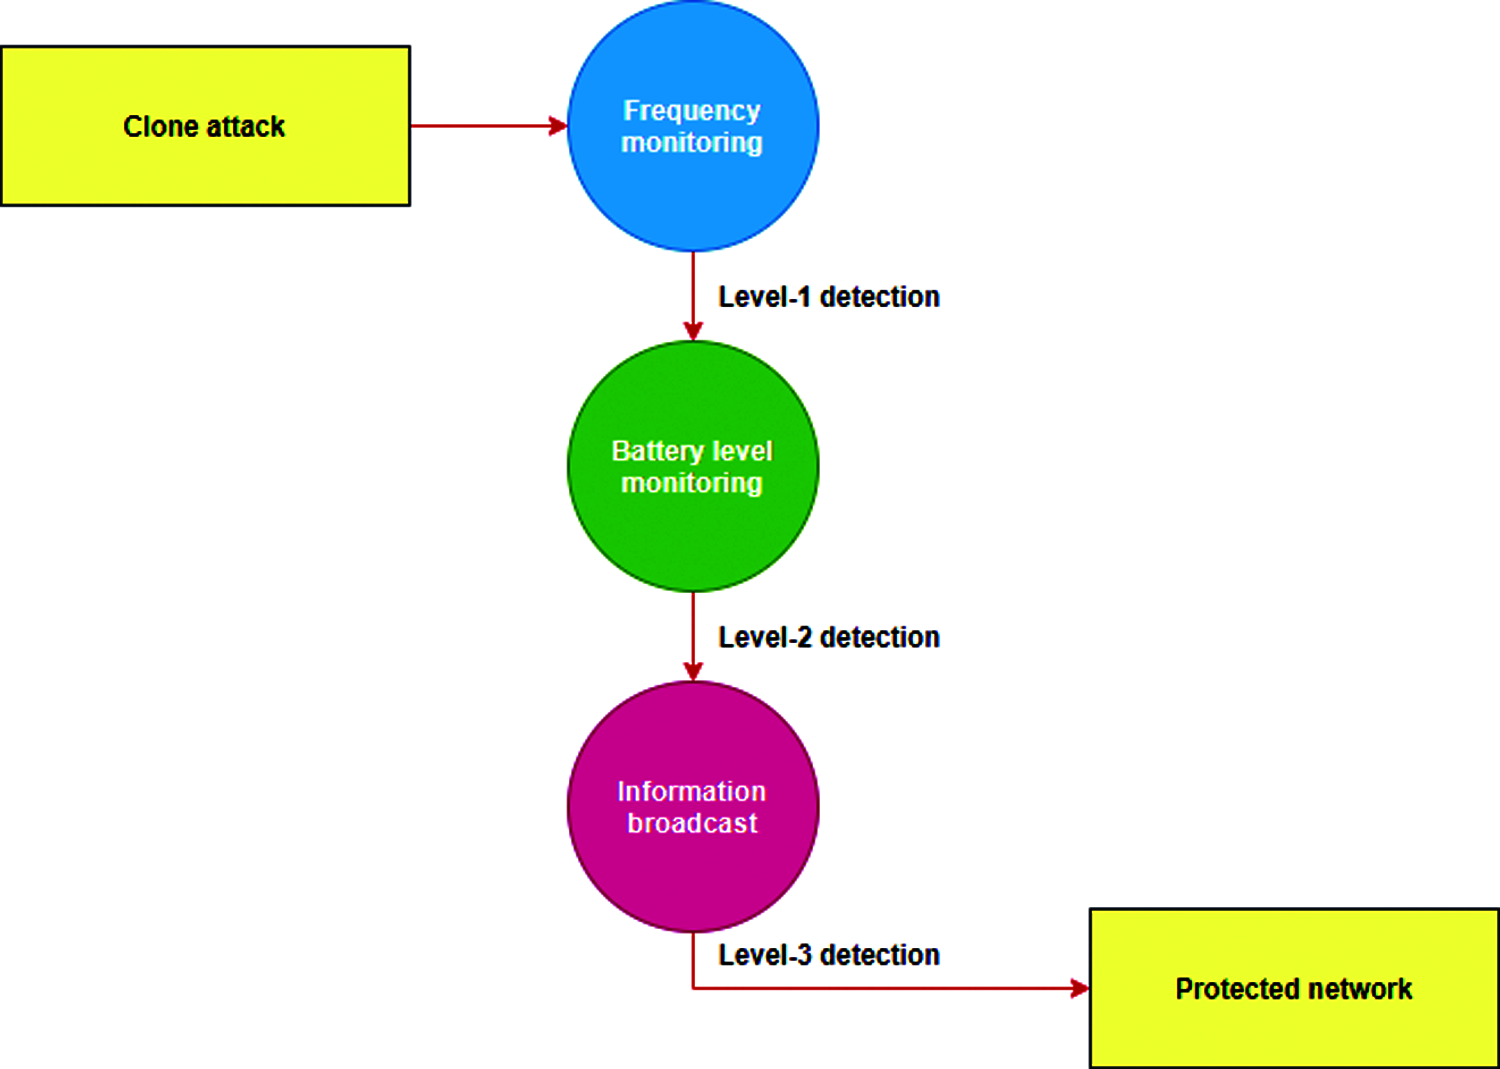
Figure 3: Levels of clone attack detection in WSN
In general, the battery levels of the clone nodes are higher compared to that of the genuine nodes. This is because the clone nodes are deployed in the network only after the deployment of the original nodes. Further, the clone nodes have higher values of battery level to ensure the complete capturing of the network. Thus, in the level-2 detection, whenever two nodes have the same key, the battery level is compared. The node with higher level of battery is used asked for the password. If the password is wrong, the node is regarded as the clone node.
During the level-3 detection, the CH nodes broadcast the details about the clone node to the base station (BS). The complete details of the clone node are transmitted to the base station. There are chances that the clone node can move to other clusters in the network. To ovoid this, the BS transmits the details of the clone node to other cluster heads as well. In this way, the clone detection is done at level-3. After the detection at three levels, the network becomes free from the clone attack.
3.3 Proposed Routing Protocol for Energy Efficient Networks (RPEEN)
The presented RWP model of the DT technique is motivated by the need to identify a clone in a safe way. The multi-step detection system consists of three phases of identification: the first phase (based on the classification model), the second phase (connection of the battery level and pseudo random), and the third phase (based on the clustering algorithm) (secure network). The presented DT technique uses the notion of clone detection with various phases to identify the presence of malicious nodes. The proposed routing protocol is designed mainly to increase the energy efficiency. The main drawback of WSN system is the energy constraint. Thus, for the detection of clone attack, the algorithm must be designed such that the energy efficiency is high.
Hence, the proposed RPEEN algorithm is used as a routing protocol for routing the data using live nodes with the attack by the clone nodes with minimal energy consumption. This algorithm is given by Algorithm 1. The Algorithm 1 has three main stages. In the first stage, the set-up phase takes place. The second stage is the node selection phase and the third stage is the steady state phase. The RPEEN protocol comprises of a data transmission routing method, a cluster head selection mechanism, and a cluster formation technique. A multistage transmitting data technique is developed based on an energy analysis of existing routing protocols. The use of an efficient cluster head selection technique is implemented, and needless re-clustering is eliminated. For efficient cluster formation, static clustering is utilized.
This approach relies on genuine nodes’ speeds being lower than the WSN high speed, and the clone will go far faster than the WSN high speed. As a result, the speed limit of sensor nodes must be checked and measured. If the WSN speed is increased by a speed restriction, there is a likelihood that sensor nodes with the same identity will exist at that time. A new technique for detecting clone threats has been developed. This technique is built on the idea of Polynomial-based group key per-distribution and Detectors, which explains why clone nodes can’t deploy in real-world scenarios and why each WSN node in the WSN has pair-wise variables.
3.4 Algorithm 1: Proposed Routing Protocol for Energy Efficient Networks (RPEEN)
This research utilised a genuine WSN node energy consumption concept. The model accounts for data decryption and gathering transmission power consumption as well as digital processing capabilities. We investigate the effects of flexible cluster size on a CH node’s power consumption, which has been overlooked in prior research. In furthermore, the compression algorithms rate is taken into account depending on the association of the obtained data. It has an impact on a CH node’s transmission power dissipation because an incorrect energy demand model of CH nodes causes network overhead. To the best of the knowledge, none of the existing works have adequately solved this problem.

To understand the amount of energy saved using the proposed algorithm, we have computed the energy dissipation of the cluster head. Let us consider that there are T number of sensors in a network. Let us assume there is n number of clusters. The average number of nodes per cluster is given by T/n. In each cluster there are T/n-1 nodes and one cluster head. We consider the assumption that all these nodes are distributed in an even manner in an area of size P × Q. Consider a sink node represented as SN. This node is located at the position (XSN, YSN). Let us consider the transmitter transmits a message comprising of c. Then, the amount of energy sent by the transmittter in sending this message is given by
Here,
Here,
Here,
Here,
where
where
Here,
where,
The path diagram of the total energy saved is given by the Fig. 4.
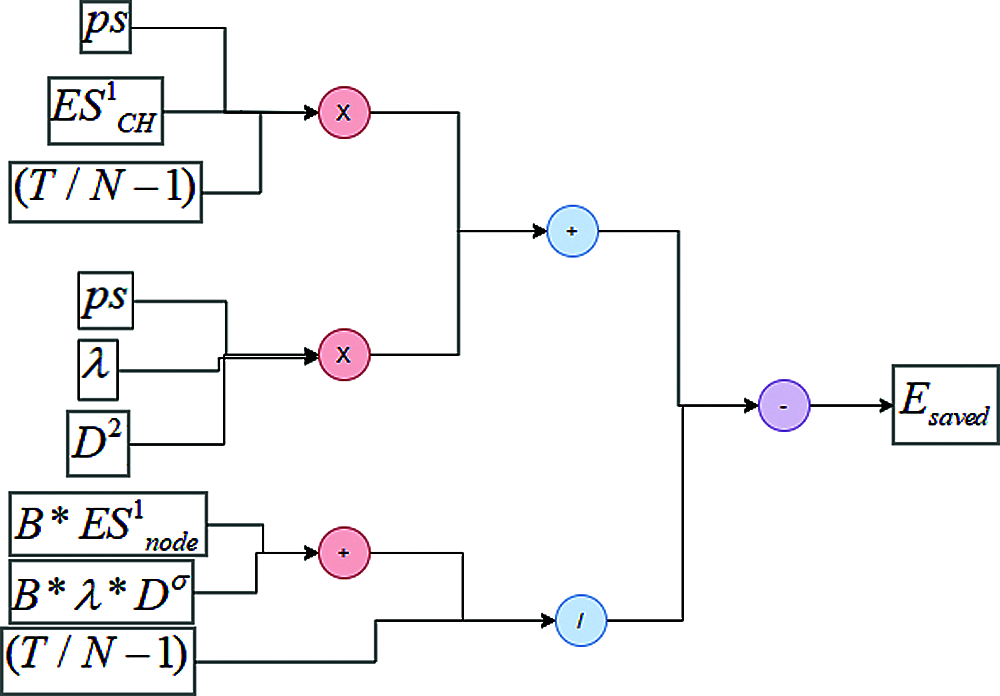
Figure 4: Path diagram for the energy saved using proposed RPEEN protocol
The path diagram of energy saved RPEEN protocol. Based on the analysis of HTTP (Hypertext Transfer Protocol) packets, the present structure of Web search traffic. Instead than measuring page response time, it examines different types of Web servers and their response times in order to forecast Web server evolution.
In this section, various results obtained by MATLAB 2018 software are discussed. The experimental setup requires MATLAB software with communication and wireless sensor network toolboxes. The MATLAB program is developed to simulate the following results and graphs.
Residual energy is defined as energy taken into account when clustering and routing approaches are taken in order to enhance network lifespan. The amount of data transferred from a source at any given moment is referred to as throughput. The ratio between the total data packets received at the destination node and the total number of packets obtained at the source node is known as energy efficiency. The error occurred between data transmission from transmitter to receiver.
The proposed RPEEN protocol is evaluated using various parameters like time delay, residual energy, throughput, energy efficiency and error rate. To secure WSNs from clone attacks, cluster-based secure routing protocols can be used to make the WSN for IoT communication greater efficient. The CH filters and combines data mobility by wireless sensor nodes in the same cluster, allowing the overall quantity of data provided to be optimised and the communication distance to be reduced. RPEEN is a clustering-based routing system that is very efficient. Each round, each cluster and CH are continuously elected. The residual energy of the sensor nodes is not taken into account when the CHs are chosen. WSN nodes with lower residual energy may be chosen, which may affect the network’s performance.
The proposed approach assesses crucial elements that have been classified as genuine positives or false positives. True positive refers to a clone that was effectively discovered; false positive refers to a clone that was unsuccessfully discovered. The proposed threat simulation performance is done at various stages. The high level of clone detection aggregation is at a different period. It’s also worth noting that the genuine positive increases with each level. The first step is meant for validation, as well as the detection of the anomalous at cluster to define the risk region, because the suggested approach comprises of numerous phases in order to detect the clones.
The system’s robustness and reproducibility are two more criteria that are even more significant than the convergence rate. The similarity rate of the results for various times with the same input values is called algorithm dependability repeatable.
Once the CHs have been elected, they will tell some other nodes that they have been elected as the CH for this round. To perform this function, each CH node will transmit an appropriate signal to all other nodes using the proposed methodology. Depending on the intensity distribution of the message delivered from the BS and each CH node, each membership node selects to choose whether or not assist in initialization.
Because the proposed approach employs the synchronous conduction transmission scheme, the selection of a cluster head is only based on signal intensity. This indicates that cluster creation does not involve all nodes in the WSN. By analyzing all of the broadband access of the data sent by the CHs, a node nearer to the CH selects to enter the group CH delivers the better signal to the nodes.
After determining which CH will enter, every node nearer to the CH must notify the CH that it has joined the group as a network element. Every node that is closer to the CH transmits an enter packet (Join-REQ) to the CH of their choice, which contains both the node’s and the CH’s identity.
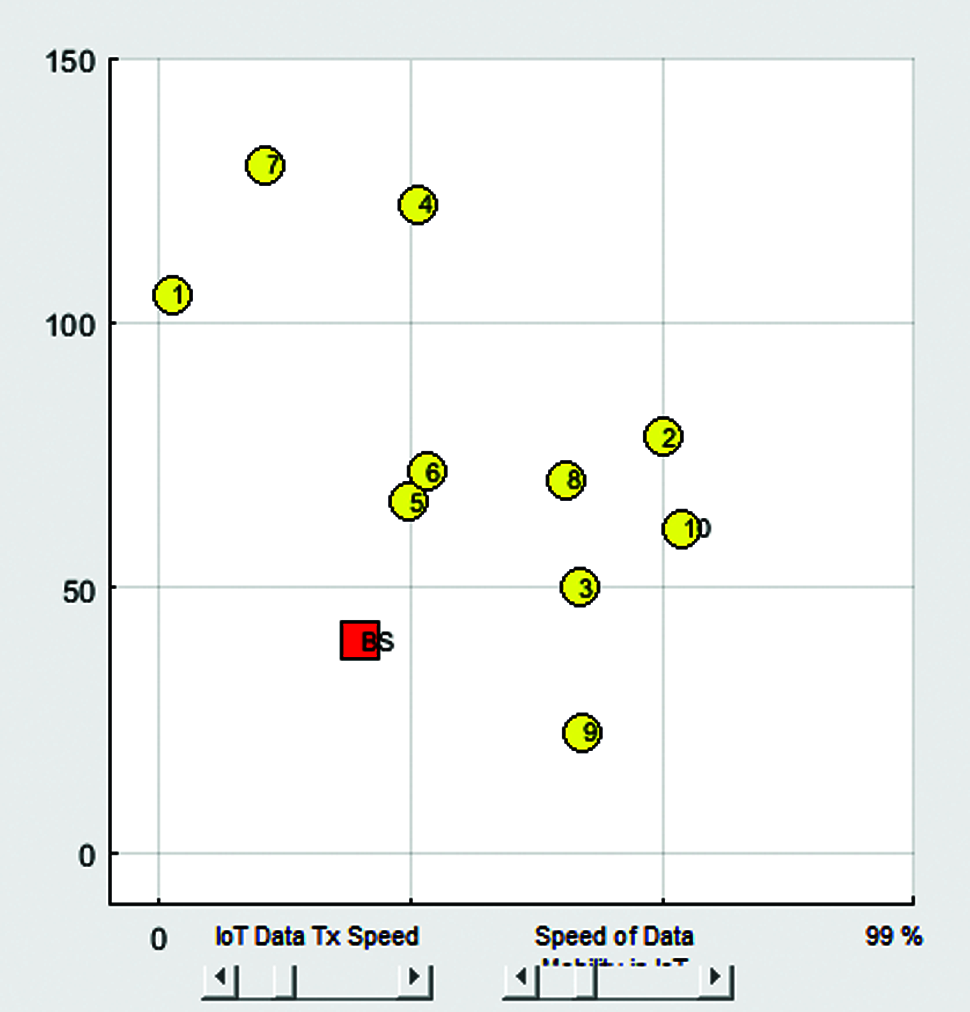
Figure 5: Deployment of simple mobility nodes in IoT based WSN system
Fig. 5 show the deployment of simple mobility nodes in IoT based WSN systems. In this Figure, 10 nodes are deployed with simple mobility. BS represents the base station node. The majority of previous research has concentrated on line-based deployment, neglecting a wide range of possible curve-based approaches. For the first time, wireless sensor deployment in a large-scale network. The sensor deployment problem may therefore be broken down into two steps: I defining an optimal deployment curve, and ii) selecting the best sites for sensors on that curve.
Due to the random deployment area, finding the best deployment curve is quite difficult. To answer the point, found a sufficient condition for the deployment curve to be optimum. To answer the question, established the notion of a length curve and offered an algorithm that can achieve efficient sensor deployment when the implementation curve is distance constant, as well as a methodology that can achieve efficient and accurate deployment when it is not.
Fig. 6 shows the deployment of 50 nodes in the original WSN system. The node range for a single quadrant is 250. Node 1 represents the transmitter base station and Node 2 represents the receiver base station. The data packets are transmitted from the node 1 to node 2. The paths of data transfer are depicted in the Fig. 5. One of the WSN limits is the energy consumption of rechargeable batteries sensor nodes, particularly for information transfers, which affects the network’s longevity and hence its usability for health and the environment objectives. One of the major obstacles of using WSN for health and environmental applications is determining how long it will last. By lengthening the duration before one of the sensor nodes reaches its end, Lifetime covers how to lower the energy costs of the sensor nodes. The health and environmental applications have been addressed in order to undertake the experiment. Finding sensor node placements that maximize coverage and longevity is quite difficult in these cases. WSN is the best option for dealing with the problem. Due to the high cost of sensor installation and battery replacement in resources, it is vital to implement WSN with the fewest possible sensors while optimizing coverage and lifetime.
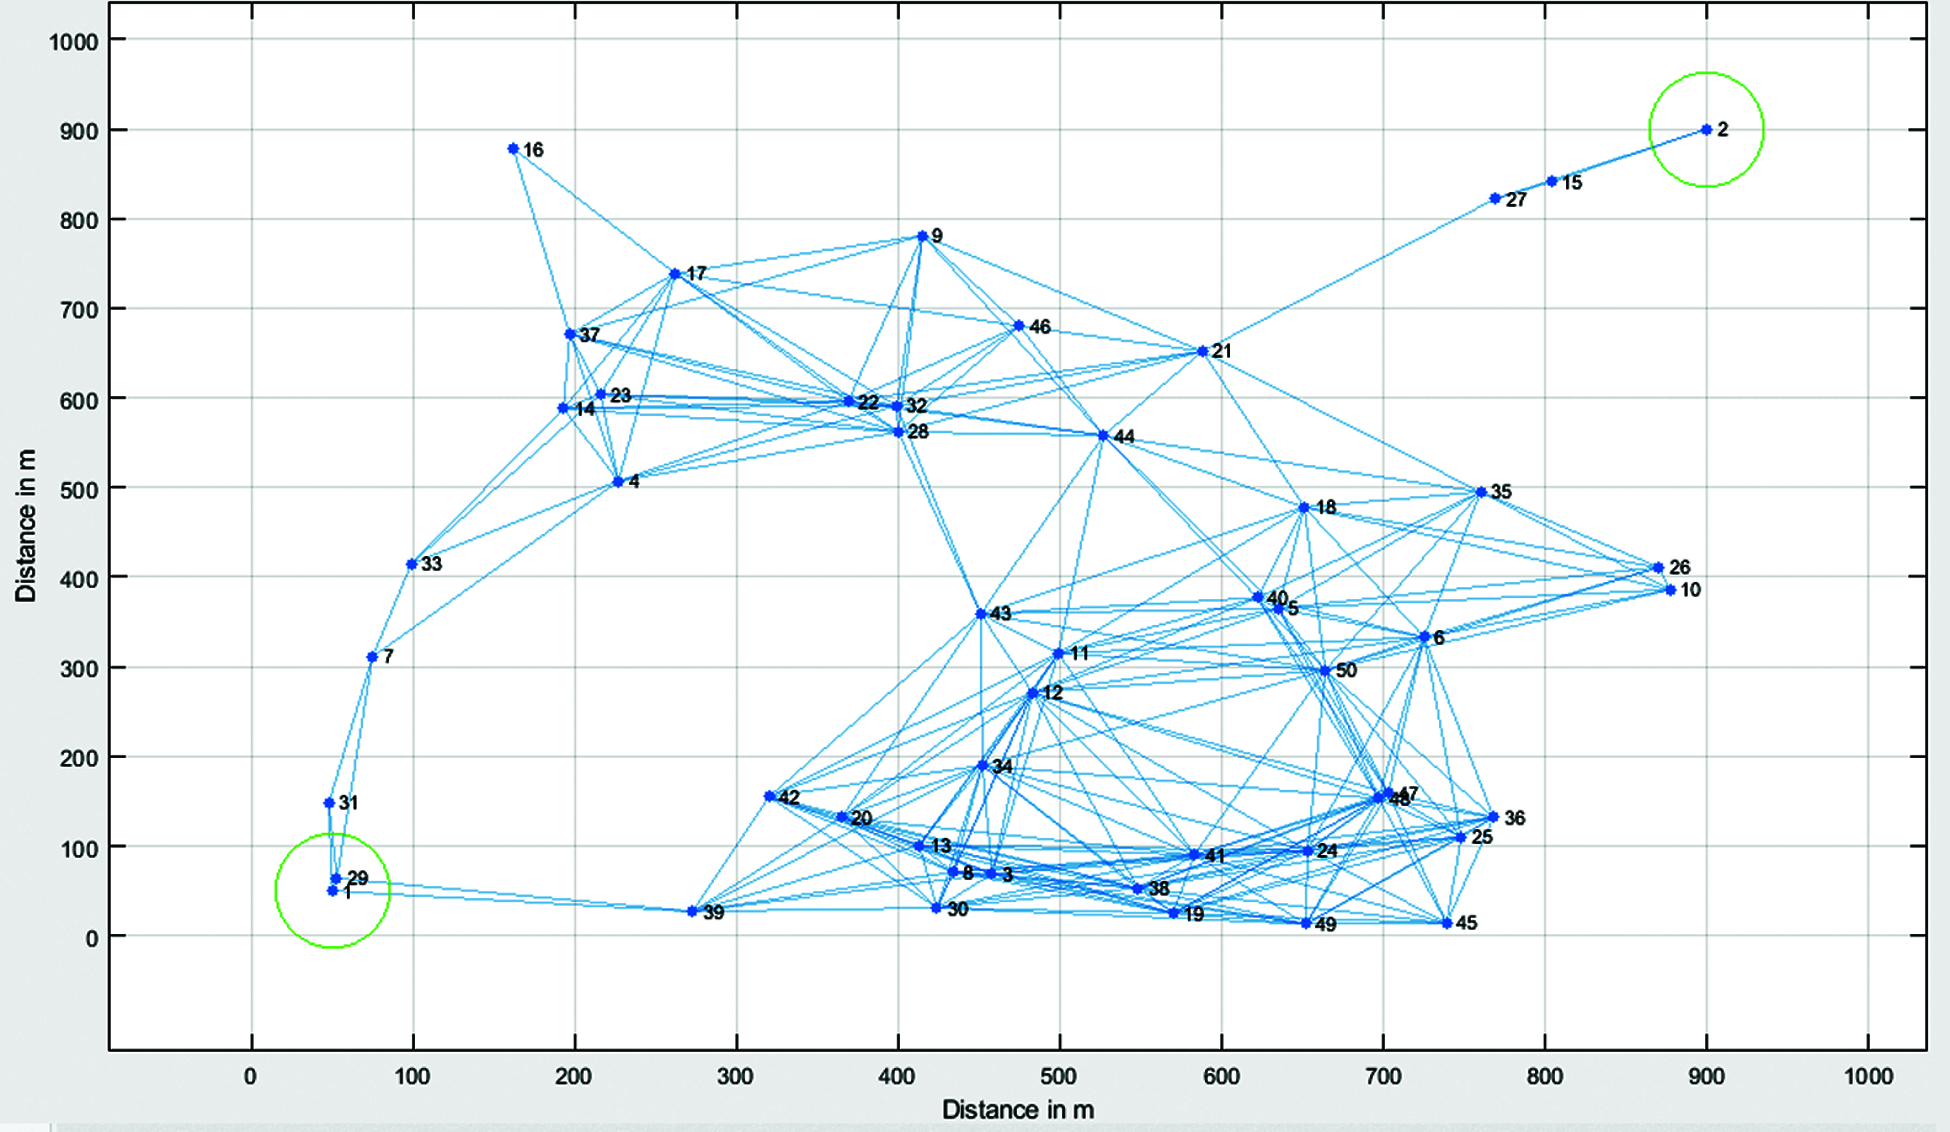
Figure 6: Deployment of 50 nodes with node range of 250 in original WSN
Fig. 7 shows the IoT routing path with a mobility path 2. This indicates that there are two possible routing paths. In this case, the total number of hops is 8. A total of 4736 number of packets are transmitted from the transmitter BS to the receiver BS. The total number of dead nodes due to clone attack is 4. The routing nodes by avoiding the clone attack was found to be ‘1 -> 29 -> 7 -> 4 -> 22 -> 21 -> 27 -> 2’.
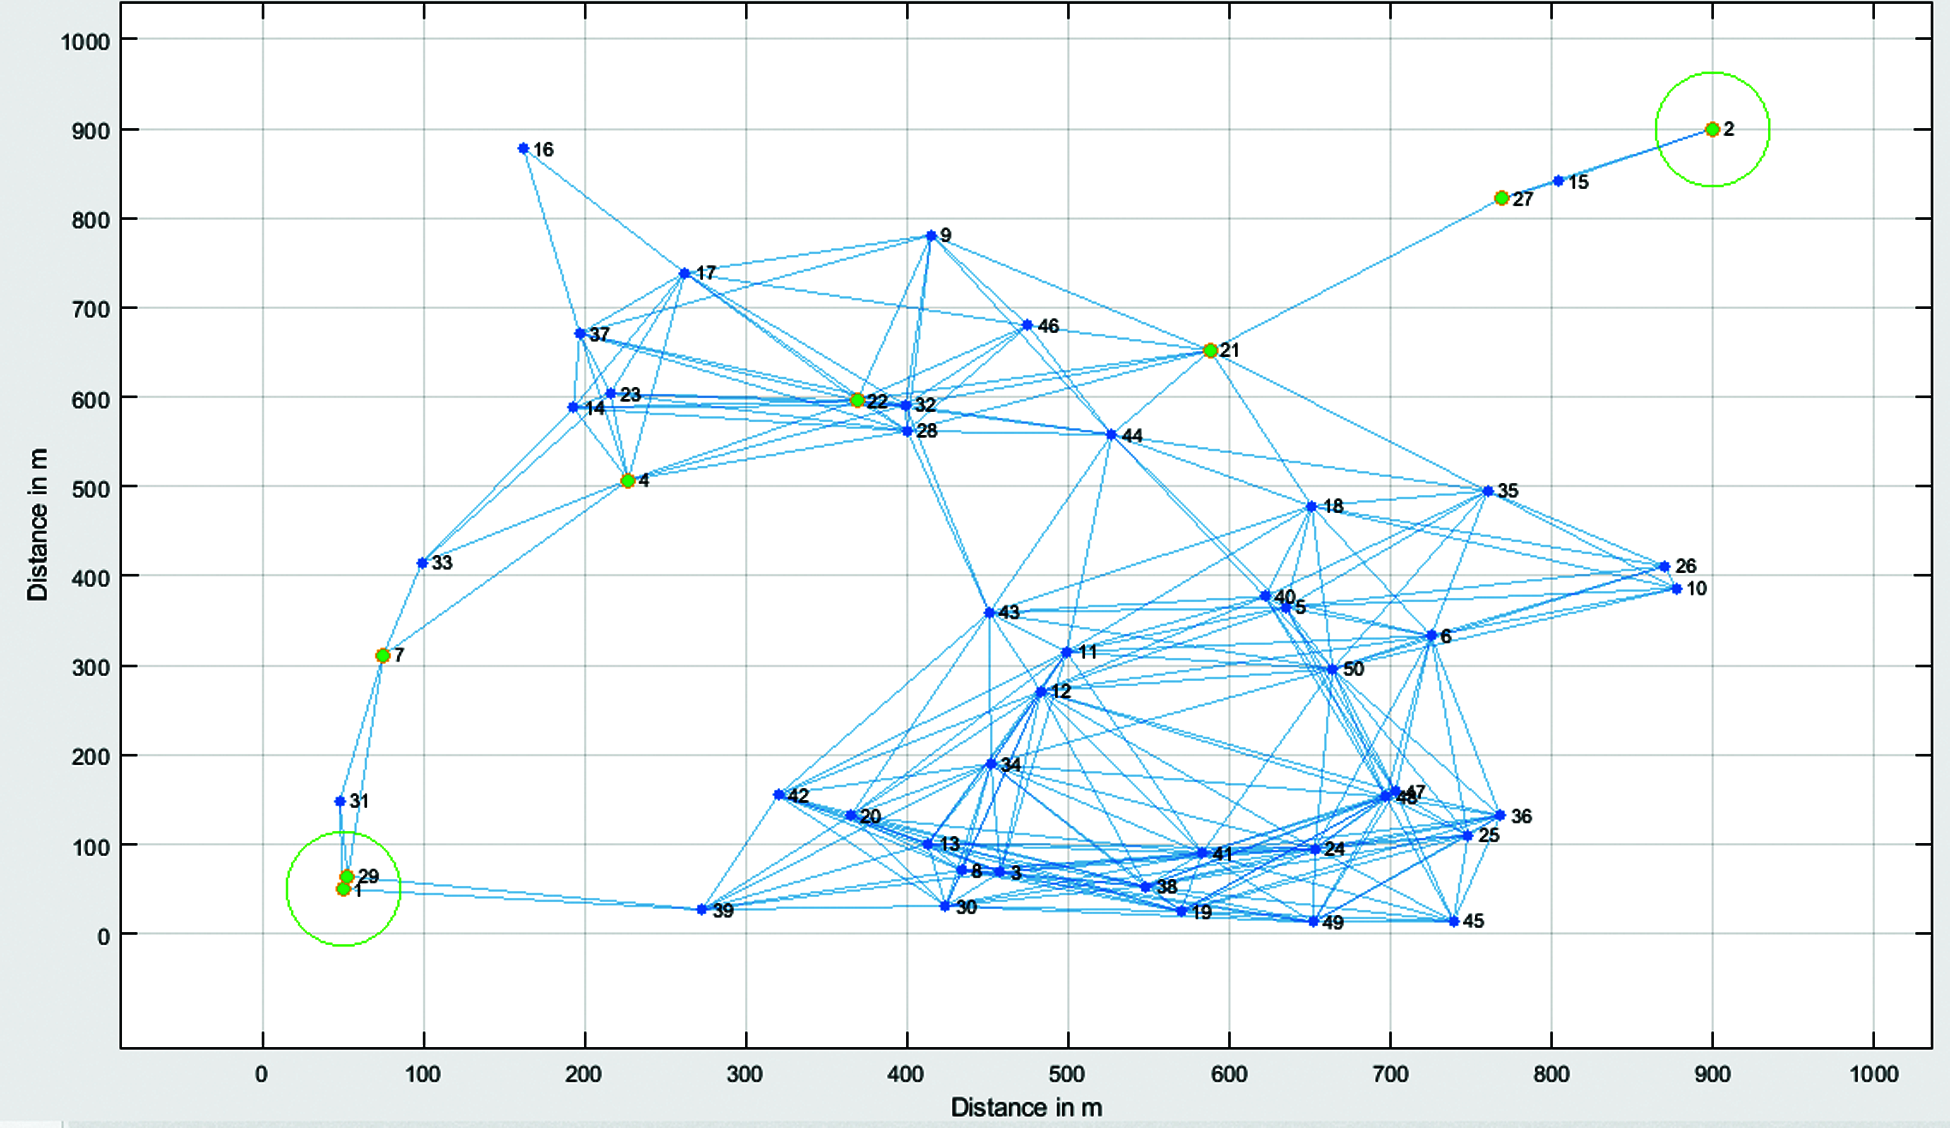
Figure 7: IoT routing path with mobility path 2
Communication overhead is defined as the total amount of messages transmitted by mobile nodes in a WSN. If nodes receive and send data through messages, and each message must be sent by CH, the entire communication overhead in a WSN is 1 N. The overhead associated with the suggested method is lower than that of previous methods. This is due to the fact that the risk theory notion is based on a cluster, and each node must provide data to CH. Furthermore, O(N) is proportional to the number of fully used nodes.
The CH has an independent queue of the same size that keeps the data of all cooperating (i.e., N) nodes. As a result, the storage overhead for battery voltage check may be characterized as O(N), whereas the storage overhead for different value based is O(1) (i.e., 1 indicates the fixed amount of counts), as previously stated. As a result, the anticipated storage overhead for the proposed method is O (N).
The network of the CH and nodes is disabled until the broadcasting slot is provided to save energy. The CH’s network, as well as any nodes that will be sending data, must be turned on. Non-CH nodes transmit data to the CH after engaging the nodes, while the CH collects the information and transfers it to the BS. Because the optimum technique to send data is to decrease the network lifetime, a single data transmission technique will enhance the nodes’ energy usage. As a result, a technique is presented for minimizing distance using a single hop, multi-hop, and composite network infrastructure.
Fig. 8 shows the IoT routing path with a mobility path 4. This indicates that there are four possible routing paths. A total of 5368 number of packets are transmitted from the transmitter BS to the receiver BS. Thus, in this case, a greater number of packets are being successfully sent. The total number of dead nodes due to clone attack is 27. The routing nodes by avoiding the clone attack was found to be ‘1 -> 39 -> 3 -> 11 -> 18 -> 21 -> 27 -> 2’

Figure 8: IoT routing path with mobility path 4
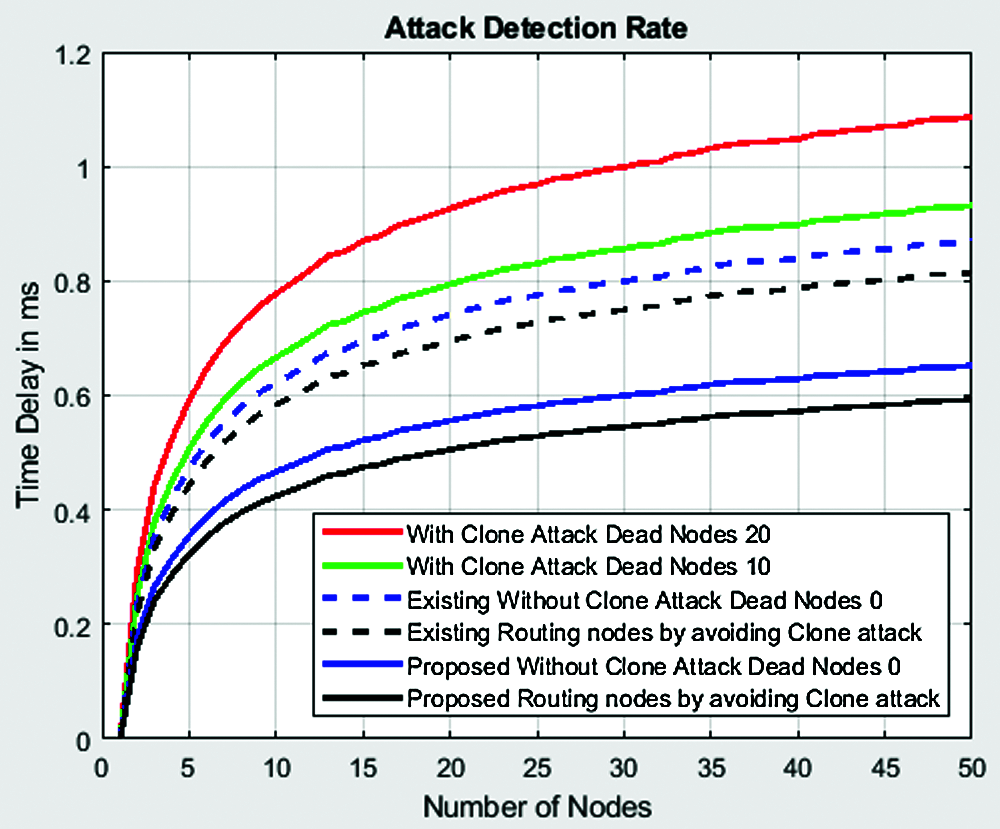
Figure 9: Variation of time delay with the no. of nodes
Fig. 9 shows the variation of time delay with the number of rounds. It is clear from the Fig. 8 that, the time delay is high with clone attack having 20 dead nodes. This reduces when the number of dead nodes decreases to 10. The existing routing algorithm called Hybrid Multi-Level Clustering (HMLC) algorithm [11] produces next highest time delay. Time delay further reduces with the existing HMLC algorithm by avoiding clone attack. The proposed RPEEN algorithm achieves next minimal time delay with 0 dead nodes. The proposed algorithm achieves the least time delay by avoiding clone attack. For instance, the time delay for 50 nodes using clone attack with 20 dead nodes and 10 dead nodes are 1.1 and 0.9 ms respectively. The existing HMLC algorithm achieves a time delay of 0.85 and 0.81 ms with 0 dead nodes and by avoiding clone attack respectively. The proposed algorithm achieves a time delay of 0.63 and 0.6 ms with 0 dead nodes and by avoiding clone attack respectively. Another key consideration for clone identification using the suggested methodology is energy, as an advisory requires a lot of power to measure and control the WSN.
Fig. 10 shows the variation of residual energy with the number of rounds. The residual energy with clone attack for 2500 rounds is around 38.2 J. The residual energy for the same 2500 rounds with the existing HMLC algorithm is 40.8 J. The proposed algorithm attains the highest residual energy of 49.5 J for the 2500 rounds. Thus, we infer that the residual energy is low for the proposed algorithm.
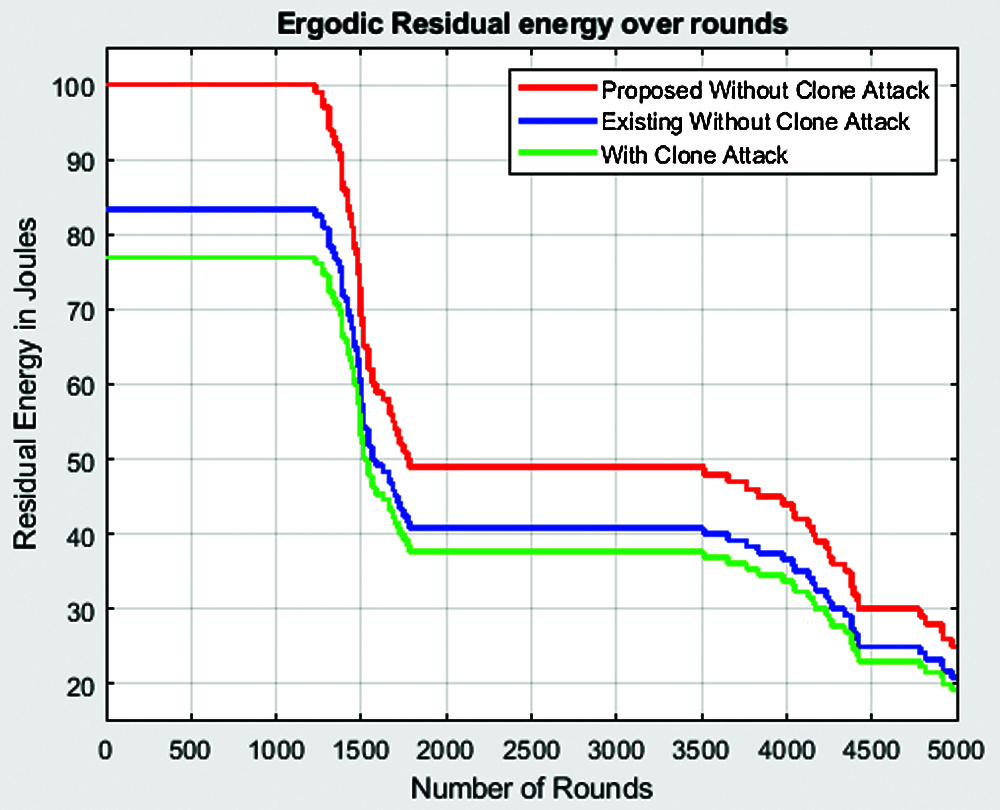
Figure 10: Variation of residual energy with the number of rounds
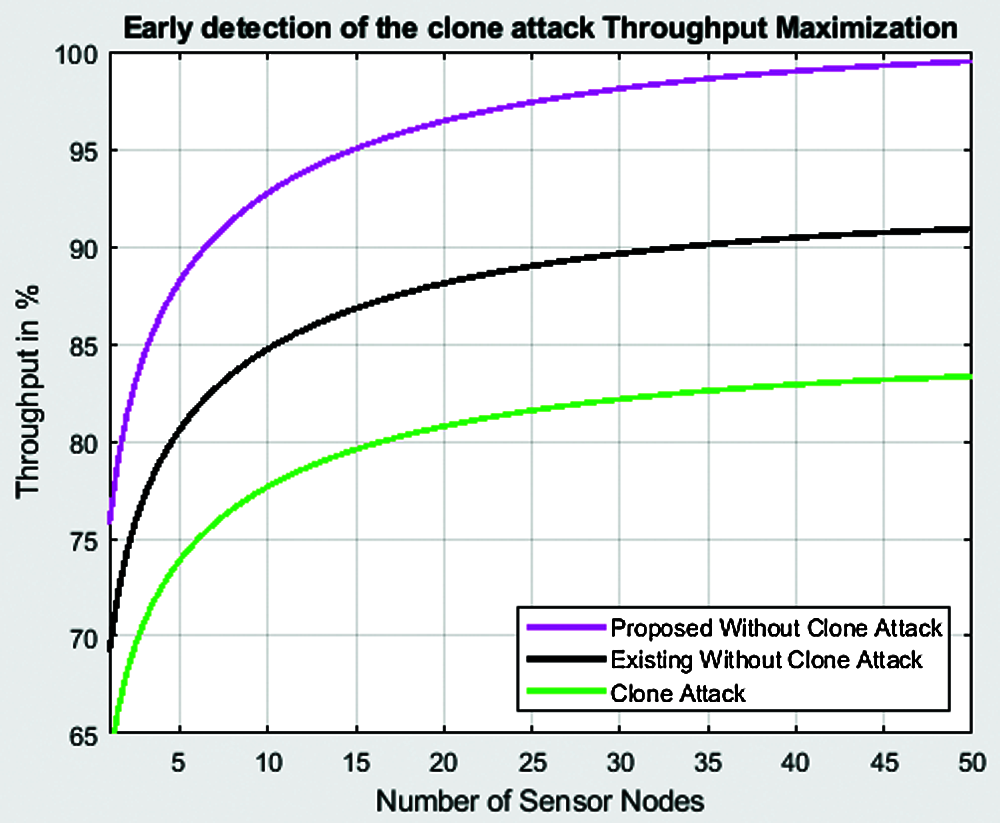
Figure 11: Variation of throughput with the number of sensor nodes
Another key metric for determining the efficiency of a routing system is throughput. A larger number of production packets at the source node do not imply a greater throughput. Taking a step back, larger clusters may imply higher packet output rates. Consider a setup with 100 nodes. Under the proposed algorithm, the expected processing time for a node to transfer its information to a cluster head is equivalent to 19 or 20 time slots if there are 5 clusters and each cluster has an increase of 20 wireless nodes. If the spectral efficiency is four packets per second, one cycle will take at least 20/4 = 5 s to make. Fig. 11 shows the variation of throughput with the number of sensor nodes. The throughput with clone attack for 50 nodes is around 83.6%. The throughput for the same 50 nodes with the existing HMLC algorithm is 92.3%. The proposed algorithm attains the highest throughput of 99.2% for the 50 nodes. Thus, we infer that the throughput is low for the proposed algorithm.
Fig. 12 shows the variation of energy efficiency with the number of sensor nodes. The energy efficiency with clone attack for 50 nodes is around 150.3 Mbps/Hz. The energy efficiency for the same 50 nodes with the existing HMLC algorithm is 281.4 Mbps/Hz. The proposed algorithm attains the highest energy efficiency of 401.3 Mbps/Hz for the 50 nodes. Thus, we infer that the energy efficiency is low for the proposed algorithm.
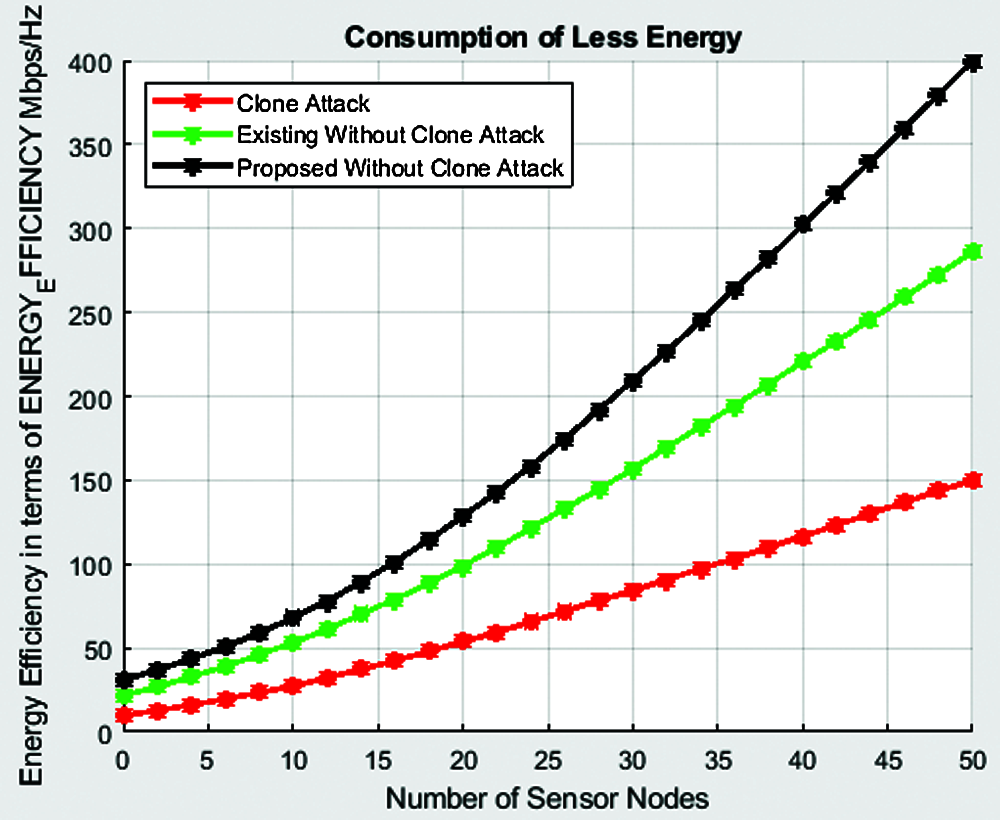
Figure 12: Variation of energy efficiency with the number of sensor nodes
Fig. 13 shows the variation of error rate with the number of sensor nodes. As the number of sensor nodes increases, the error rate decreases. For 5 sensor nodes, the error rate for the existing HMLC algorithm is 0.06. Whereas, the error rate for the proposed scheme is 0.043 for the same 5 nodes. Similarly, for 10 nodes, the error rate for the existing and proposed schemes is 0.27 and 0.21 respectively. Thus, the error rate is low for the proposed system.
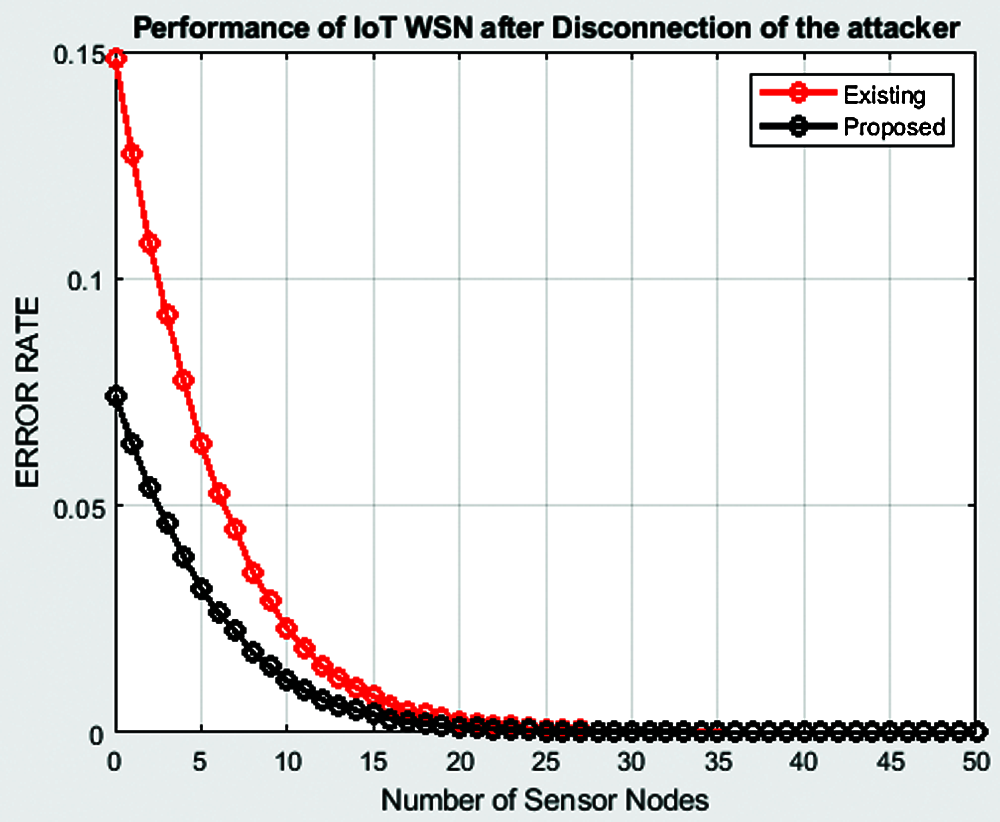
Figure 13: Variation of error rate with the number of sensor nodes
The advantage of the proposed system is early detection of the clone attack. The second advantage is that the proposed scheme is light weight approach that consumes less energy. Other main advantage is the disconnection of the attacker from the network so that attacker cannot further damage the communication in the network.
In this research, we propose a new scheme for the detection of clone attack in wireless sensor networks for IoT-based smart health care applications. The various levels of clone attack detection were presented. The three levels included frequency monitoring, battery level monitoring and information broadcast monitoring. Further, a protocol called Routing Protocol for Energy Efficient Networks (RPEEN) was proposed for the energy efficient routing of data packets belonging to health care application. The proposed algorithm involved three stages namely, the set-up phase, node selection phase and the steady state phase. The system was analysed using 50 nodes deployed at random locations. The routing path was identified for two cases, that is, with mobility path 2 and mobility path 4. It was inferred that; the proposed algorithm attained the highest energy efficiency of 401.3 Mbps/Hz for the 50 nodes. Further, the error rate using 10 nodes for the existing HMLC algorithm and proposed RPEEN scheme was found to be 0.27 and 0.21 respectively. Thus, the proposed scheme achieved better energy efficiency with minimum error rate. The vulnerabilities exploited at various IoT threat vectors, as well as the problems can be implemented in future. Then, using the current framework, the problems of measuring IoT vulnerabilities may be applied for secured communication.
Funding Statement: The authors received no specific funding for this study.
Conflicts of Interest: The authors declare that they have no conflicts of interest to report regarding the present study.
1. M. Shafiq, H. Ashraf, A. Ullah and S. Tahira, “Systematic literature review on energy efficient routing schemes in WSN—a survey,” Mobile Networks and Application, vol. 25, no. 3, pp. 882–895, 2020. [Google Scholar]
2. W. Zhang, D. Han, K. C. Li and F. I. Massetto, “Wireless sensor network intrusion detection system based on MK-ELM,” Soft Computing, vol. 24, no. 16, pp. 12361–12374, 2020. [Google Scholar]
3. M. Adil, M. A. Almaiah, A. O. Alsayed and O. Almomani, “An anonymous channel categorization scheme of edge nodes to detect jamming attacks in wireless sensor networks,” Sensors (Switzerland), vol. 20, no. 8, pp. 2311, 2020. [Google Scholar]
4. P. Subbulakshmi, “Mitigating eavesdropping by using fuzzy based MDPOP-Q learning approach and multilevel Stackelberg game theoretic approach in wireless CRN,” Cognitive Systems Research, vol. 52, no. 4, pp. 853–861, 2018. [Google Scholar]
5. V. Seeha Devi and T. Ravi, “Cluster based data aggregation scheme for latency and packet loss reduction in WSN,” Computer Communications, vol. 149, no. 5, pp. 36–43, 2020. [Google Scholar]
6. S. Neelakandan, “An automated exploring and learning model for data prediction using balanced CA-SVM,” Journal of Ambient Intelligence and Humanized Computing, vol. 12, no. 5, pp. 4979–4990, 2021. [Google Scholar]
7. M. Safaldin, M. Otair and L. Abualigah, “Improved binary gray wolf optimizer and SVM for intrusion detection system in wireless sensor networks,” Journal of Ambient Intelligence and Humanized Computing, vol. 12, no. 2, pp. 1559–1576, 2021. [Google Scholar]
8. K. Thangaramya, K. Kulothungan, S. Indira Gandhi, M. Selvi, S. V. N. Santhosh Kumar et al., “Intelligent fuzzy rule-based approach with outlier detection for secured routing in WSN,” Soft Computing, vol. 24, no. 21, pp. 16483–16497, 2020. [Google Scholar]
9. R. Bhatt, P. Maheshwary, P. Shukla, P. Shukla, M. Shrivastava et al., “Implementation of Fruit Fly Optimization Algorithm (FFOA) to escalate the attacking efficiency of node capture attack in Wireless Sensor Networks (WSN),” Computer Communications, vol. 149, no. 2, pp. 134–145, 2020. [Google Scholar]
10. S. Satpathy, S. Debbarma, S. C. Sengupta Aditya and K. D. Bhattacaryya Bidyut, “Design a FPGA, fuzzy based, insolent method for prediction of multi-diseases in rural area,” Journal of Intelligent & Fuzzy Systems, vol. 37, no. 5, pp. 7039–7046, 2019. [Google Scholar]
11. H. R. Shaukat, F. Hashim, M. A. Shaukat and K. A. Alezabi, “Hybrid multi-level detection and mitigation of clone attacks in mobile wireless sensor network (MWSN),” Sensors (Switzerland), vol. 20, no. 8, pp. 2283, 2020. [Google Scholar]
12. S. Vaishnavi and T. Sethukarasi, “Sybilwatch: A novel approach to detect sybil attack in IoT based smart health care,” Journal of Ambient Intellignet and Humanized Computing, vol. 12, no. 6, pp. 6199–6213, 2021. [Google Scholar]
13. A. Angappan, T. P. Saravanabava, P. Sakthivel and K. S. Vishvaksenan, “Novel sybil attack detection using RSSI and neighbour information to ensure secure communication in wsn,” Journal of Ambient Intellignet and Humanized Computing, vol. 12, no. 6, pp. 6567–6578, 2020. [Google Scholar]
14. S. B. Priya, M. Rajamanogaran and S. Subha, “Prediction of chest diseases using transfer learning,” Machine Learning for Healthcare Applications, vol. 4, no. 5, pp. 199–212, 2021. [Google Scholar]
15. M. Numan, “A systematic review on clone node detection in static wireless sensor networks,” IEEE Access, vol. 8, pp. 65450–65461, 2020. [Google Scholar]
16. C. Hongsong, M. Caixia, F. Zhongchuan and C. H. Lee, “Novel LDoS attack detection by spark-assisted correlation analysis approach in wireless sensor network,” IET Information Security, vol. 14, no. 4, pp. 452–458, 2020. [Google Scholar]
17. R. Fotohi, S. Firoozi Bari and M. Yusefi, “Securing wireless sensor networks against denial-of-sleep attacks using RSA cryptography algorithm and interlock protocol,” International Journal of Communication Systems, vol. 33, no. 4, pp. 89, 2020. [Google Scholar]
18. U. Gowshika and T. Ravichandran, “A smart device integrated with an android for alerting a person’s health condition: Internet of things,” Indian Journal of Science and Technology, vol. 9, no. 6, pp. 1–6, 2016. [Google Scholar]
19. Z. A. Baig, S. Sanguanpong, S. N. Firdous, V. N. Vo, T. G. Nguyen et al., “Averaged dependence estimators for DoS attack detection in IoT networks,” Future Generation Computer Systems, vol. 102, no. 7, pp. 198–209, 2020. [Google Scholar]
20. M. Premkumar and T. V. P. Sundararajan, “DLDM: Deep learning-based defense mechanism for denial of service attacks in wireless sensor networks,” Microprocessors and Microsystem, vol. 79, no. 8, pp. 103278, 2020. [Google Scholar]
 | This work is licensed under a Creative Commons Attribution 4.0 International License, which permits unrestricted use, distribution, and reproduction in any medium, provided the original work is properly cited. |