DOI:10.32604/iasc.2022.017622
| Intelligent Automation & Soft Computing DOI:10.32604/iasc.2022.017622 | |
| Article |
Heart Disease Diagnosis Using Electrocardiography (ECG) Signals
1Department of Computer Science and Engineering, Vel Tech Multi Tech Dr. Rangarajan Dr. Sakunthala Engineering College, Chennai, 600062, India
2Department of Electronics and Communication Engineering, C. Abdul Hakeem College of Engineering and Technology, Vellore, 632509, India
3Department of Electronics and Communication Engineering, Sri Venkateswara College of Engineering, Sriperumbudur, 602117, India
*Corresponding Author: V. R. Vimal. Email: vimalvrts@gmail.com
Received: 05 February 2021; Accepted: 20 July 2021
Abstract: Electrocardiogram (ECG) monitoring models are commonly employed for diagnosing heart diseases. Since ECG signals are normally acquired for a longer time duration with high resolution, there is a need to compress the ECG signals for transmission and storage. So, a novel compression technique is essential in transmitting the signals to the telemedicine center to monitor and analyse the data. In addition, the protection of ECG signals poses a challenging issue, which encryption techniques can resolve. The existing Encryption-Then-Compression (ETC) models for multimedia data fail to properly maintain the trade-off between compression performance and signal quality. In this view, this study presents a new ETC with a diagnosis model for ECG data, called the ETC-ECG model. The proposed model involves four major processes, namely, pre-processing, encryption, compression, and classification. Once the ECG data of the patient are gathered, Discrete Wavelet Transform (DWT) with a Thresholding mechanism is used for noise removal. In addition, the chaotic map-based encryption technique is applied to encrypt the data. Moreover, the Burrows-Wheeler Transform (BWT) approach is employed for the compression of the encrypted data. Finally, a Deep Neural Network (DNN) is applied to the decrypted data to diagnose heart disease. The detailed experimental analysis takes place to ensure the effective performance of the presented model to assure data security, compression, and classification performance for ECG data.
Keywords: Electrocardiogram; encryption-then-compression; burrows wheeler transform; encryption
Globally, heart-based disorders are progressively increasing because of massive factors such as stress level, the physical state of the body, present lifestyle, etc. Electrocardiogram (ECG) signal processing is a well-known technique applied to determine heart condition [1]. ECG monitoring devices are employed extensively in medical as well as telemedicine. Subsequently, transmitting the ECG information through public systems is highly tedious and imbalanced. Also, ECG signals are gathered for longer durations at high resolutions. As a result, a massive amount of information has been collected. Hence, the ECG signals are compressed for enabling effective transmission and memory. In the last decades, developers investigated ECG compression. Many works were carried out on lossy compression. The required objective is to offer high-definition images with considerable distortions [2,3]. Typically, compression models are divided into 3 classes: Direct, Parameter Extraction, and Transform Technologies. Initially, direct approaches were applied to predict. The common instances are breaking codebook, Artificial Neural Network (ANN), and Vector Quantization. The transforming schemes were involved in degrading the actual signal in terms of linear orthogonal transformation. Finally, extended coefficients accomplished better compression.
Due to the demand for the e-healthcare sector, clinical data's trust and integrity are significant problems. Generally, biomedical is transmitted through open networks and protected from external intrusions [4]. Moreover, the ever-increasing demands for computing biomedical signals are encrypted for securing the patients’ details where the security is not affected [5]. As ECG information undergo ETC, traditional works have applied compression and then encryption modalities. The ETC scheme for multimedia systems has received huge attraction from developers [6]. Therefore, the former ETC technique was used for multimedia with the help of previous methods that unavoidably led to reduced compression performance [7].
A computer-aided system is deployed for automatic prediction of MI, which helps cardiologists to make effective decisions. Thus, diverse works were performed on automated MI prediction. Following the nonlinearity of heart abnormality classification, the models relied on Neural Network (NN) applied in recent times. Conventionally, developers have introduced a training model according to the Radial Basis Probabilistic Neural Network (RBPNN) to provide a remarkable solution. The newly deployed technology sampled for ECG analysis and prediction of irregular heartbeats was divided into various pathologies. Presently, researchers have experimented with new and NN methods [8] especially, Machine Learning (ML) and Deep Learning (DL) frameworks like Convolution Neural Network (CNN) [9]. It was applied in arrhythmia prediction, coronary artery disease prediction, and beat categorization. A Deep Belief Network (DBN) was employed for classifying the quality of the ECG signals [10]. An 11-layer CNN model was developed for predicting Myocardial Infarction (MI) [11]. Afterwards, researchers insisted on the application of shallow CNN by focusing on poor myocardial infarction. It is highly beneficial by using different filter sizes in a similar convolution layer, enabling understanding features from signal sites of diverse lengths. In [12], planners have used a classifier to classify heart diseases by applying the Multi-Layer Perceptron (MLP) network and the CNN system. Specifically, the results were obtained by applying similar data sets but with various classes. In this application, two classes were employed in the MLP system. These works produced a minimum performance by applying MLP and CNN methodologies. This study presents a new ETC with a diagnosis model for ECG data, called ETC-ECG. The proposed model involves four major processes, namely, preprocessing, encryption, compression, and classification. Once the ECG data of the patient are gathered, DWT with a Thresholding mechanism is used for noise removal. Next, the chaotic map-based encryption technique is used to encrypt the data. In addition, the BWT approach is employed for the compression of the encrypted data. When the encrypted data get compressed, they are transmitted for further analysis. Finally, DNN is applied to the decrypted data for diagnosing heart disease. The detailed experimental analysis takes place to ensure the effective performance of the presented model to assure data security, compression, and classification outcome of the ECG data.
Numerous ETC techniques for ECG signals were recommended in the past decades. Compression models are categorized into two groups, namely, lossy and lossless. Initially, a collection of features for a Compression Rate (CR) with maximum value occurs, whereas the second is loss of essential data. As a result, the loss model shows the least CR and conserves applicable and essential data. Mostly, developers have gained better efficiency by integrating encryption and compression.
Compression with the removal of data repetition occurs so that memory space gets enlarged and transmission duration is reduced, which results in stability and resistance for encryption modules [13]. Finally, the nearest neighbouring coupled-map lattice and non-uniform Discrete Cosine Transform (DCT) that uses Huffman coding to compress and encrypt images are obtained [14]. Consequently, it implements maximum compression rate and security level when compared with alternate technologies. Alternatively, [15] Adaptive Fourier Decomposition (AFD) based new transform compression approach combined with Symbol Substitution (SS) algorithm was proposed. In this approach, SS is facilitated as a built-in encryption model. Compression technologies are essential in medical applications as they occupy less memory space and accomplish a suitable transmission rate [16].
One of the significant limitations of this technique is that the data are decompressed as reformed data might lose significant data. Hence, the presented approach compresses data by retaining significant data and uses the cryptographic model to conserve confidentiality. Compressed Sensing (CS) [17] produces maximum CR than the wavelet method and consumes less energy. Based on [18], ECG shows the electrical heart movements. Also, it guides in observing and examining heart-based diseases. Remote monitoring modules like telemedicine requires massive memory space to assess and diagnose data. The wireless communication applies maximum power at the time of sending uncompressed data. Therefore, data compression is more essential to limit the memory and enhance the transmission rate and bandwidth application. Various lossless compression methods were used for ECG applications, and their effectiveness was compared. Finally, low variance Huffman coding, an optimal algorithm for compressing ECG signals, was proposed. The study assumed the Massachusetts Institute of Technology-Beth Israel Hospital (MIT-BIH) arrhythmia dataset and Matrix Laboratory (MATLAB) tool for result analysis. Based on the obtained simulations, most of the memory could be conserved with low variance and by applying a Huffman code with computation complexity of NLog2N. Thus, the proposed method achieves optimal consumption of bandwidth with an elegant buffer design.
3 The Proposed Encryption-Then-Compression-Electrocardiogram Model
The schematic representation of the presented ETC-ECG is represented in Fig. 1. First, ECG biomedical signal is fed into the developed approach. Then, denoising is performed using DWT with successive Thresholding and block development of ECG signal. Subsequently, the encryption model based on a chaotic map approach is deployed. Afterwards, the compression mechanism is applied using BWT for every block of ECG signal. Eventually, once the ECG signal block is received, decryption and decompression are carried out. Finally, DNN based classification process takes place.
Here, DWT is applied to remove the noise that exists in the ECG signal with a thresholding concept. Wavelets are numerical functions that are operated on signal data as per the resolution. DWT is classified as wavelets that are discretely sampled. The primary benefit of DWT over Fourier Transform (FT) is that it simultaneously examines frequency and time. Soft or Hard threshold models describe the shrinkage rule [19]. Thresholding is employed to a signal vector according to the features.
Hard thresholding Eq. (1)
Soft thresholding Eq. (2):
where hard or soft thresholds are employed.
3.2 Chaotic Map-Based Encryption
Chaos-related clinical image security system involves two working stages, namely confusion and diffusion. For the allocated input images, the image is encrypted and decrypted using two phases, and the behaviour of the projected approach was managed using fundamental keys and control attributes. In order to enhance the security level of Chaos-Function (C-F), dual keys have been produced to encrypt and decrypt images where double keys have been produced by 16-character byte keys [20]. The performance involved in Chaos is an image encryption task that depends upon the features and Chaos with randomness in the academic application. In the encryption process, the newly developed C-F was coupled with XOR to enhance the randomness in cipher image and maximum key space is used for attack resistance. In the input image, C-F is estimated under the application of the map function (Fig. 1).
The chaotic map is applied for creating random sequences during the encryption process. The principle behind chaos theory is mixing and sensitivity for primary conditions and attributes that map with cryptography. The two fundamental features of the C-F are sensitivity for the initial state and combining property. Followed by that, C-F streams have been applied in diverse chaotic maps.
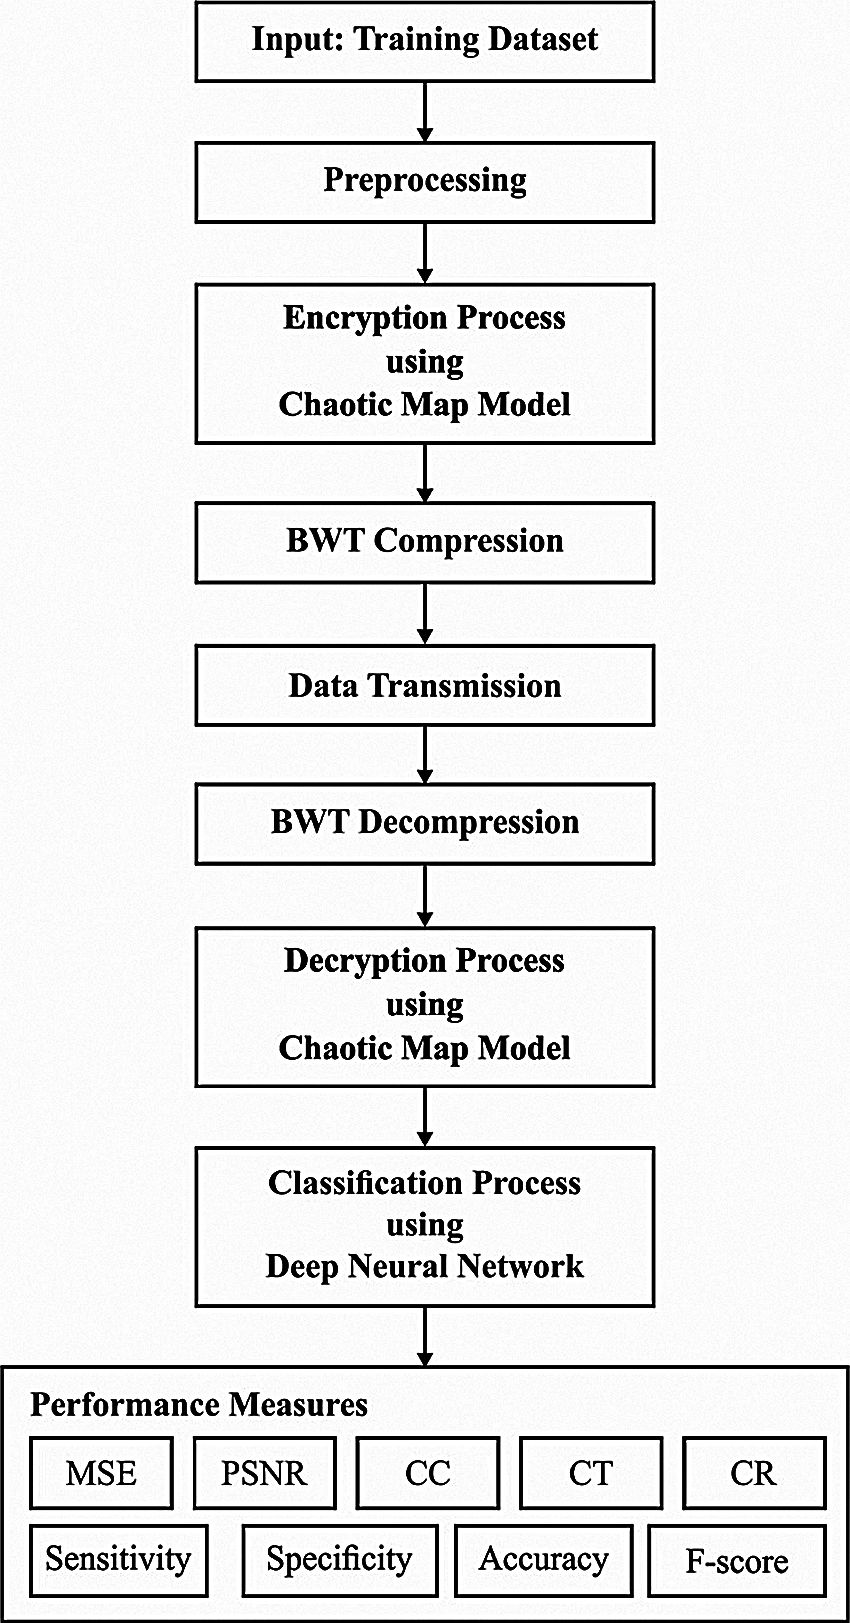
Figure 1: Block diagram of ETC-ECG
It is defined as a direct, non-linear, and polynomial state of degree 2 with output and input parameters, represented as one major condition and control parameters as given in below Eq. (3)
In the logistic map, a semi-group was developed by a collection of functions, as
It is defined as a repetitive task in the place of the tent, making a discrete-time dynamical approach. In the map, point
Based on the constant value, the tent map forecasts the chaotic function. The mapping in C-F converges
It is a well-known phrase used while the pixel change is carried out and the location of pixels is integrated with the entire image with no pixel estimation where the images are unpredicted. Hence, the strategy behind this phase is to limit maximum correlation among adjoining pixels in the primary image. Here, the security method produces arbitrary keys
where
The overall image is encoded at the diffusion process using different chaotic values according to the tent map and arbitrary values. Furthermore, it is applied to ensure the sensitivity for images; thus, minimum pixel changes must be distributed in all pixels of the entire image. It is computed according to the given function Eq. (6)
where
It’s expanded as Eq. (8)
Based on the security, keystream ‘r’ has been upgraded for a pixel, and an estimated encrypted pixel measures ‘Di’ depending on the encrypted pixels and a keystream. Therefore, this method assures the resistance for various attacks like plaintext attacks, selected plaintext attacks, and known cipher images.
The BWT is defined as a data transformation mechanism used to redevelop data where the transformed messages are compressible. Assume that
The BWT [21] is defined in the following: a word
The significant features of BWT are that it intends to collect various characters from the exact contents of input text by generating the results with high compressible factors. Various developers have referred to this feature as clustering BWT. Then, the similar characters are arranged in column
The permutation
In permutation
It is one of the DNN models where DCNN has captured the maximum attention of developers in the latest times. A common DCNN has convolution, pooling, and Fully Connected (FC) layers and feature learning is attained by effective alternate and stacking convolution and pooling layers. Therefore, FC layers apply convolutional and pooling layers to map the Two-Dimensional feature vectors into One-Dimensional feature vectors. In the case of convolution layers, an output feature map of the lth layer
where
where kernel size is s×s. In the convolutional task, the size of the input map is 7×7, the kernel size is 3×3, and the stride is 2. Hence, the pooling layer applies a convolutional layer, which has consumed the activations and applies the average operator for extracting measures for the spatial area; thus, the same local features are combined as 1. One of the major benefits of pooling layers is that it is consistent for joining the same features in a local position. Lastly, the processing time, as well as attributes of the complete network, is limited effectively. The pooling tasks can be classified into 2 classes, namely, max pooling and average pooling. Initially, max-pooling is applied for computing local patch of feature map whereas average pooling estimates average. The max-pooling and average pooling tasks of the input map size are 4×4, kernel size is 3×3, and the stride is 2. In the pooling layer, the estimation process of the resultant feature map of the lth layer is the same as Eq. (13), and it is defined as:
where βjl implies the multiplicative bias equivalent to jth filter; down() signifies the sub-sampling function.
Then, convolutional, pooling, and FC layers are applied for classifying the features obtained from actual data. The learned feature vectors are suppressed as a One-Dimensional vector where the input of FC layers consumes them. In the case of the FC layer, a value of the input vector is linked for a value of the output vector using a neuron. When the length of the input and output vector is represented as M and N, the output vector of the lth layer is estimated as
where
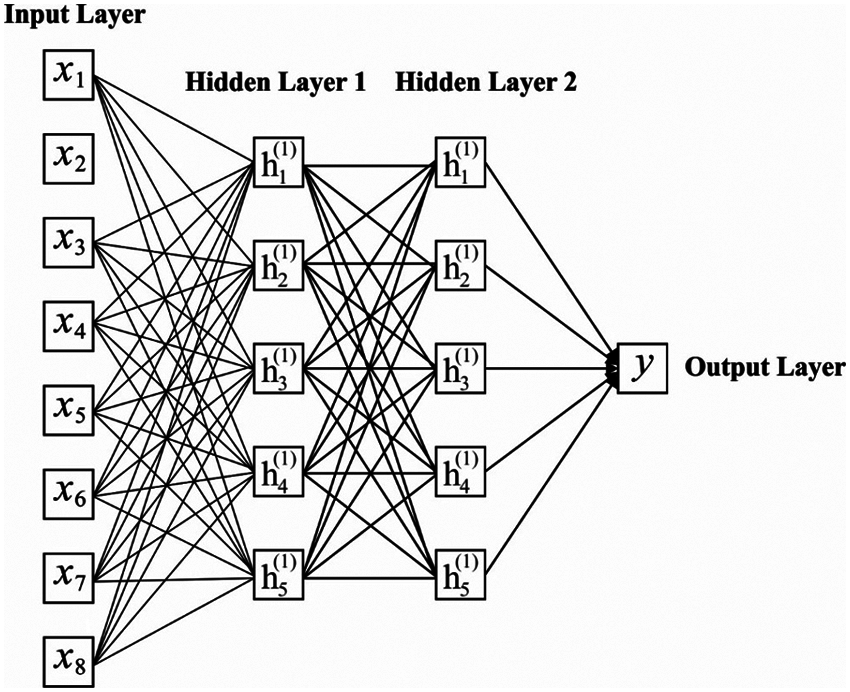
Figure 2: Structure of DNN model
For experimentation, the MIT-BIH Arrhythmia Database is used [22]. Many cardiologists have annotated a record independently, and disagreements have been solved for gaining machine-readable reference annotation for every beat in a database. The results are determined in terms of different dimensions. Tab. 1 presents the analysis of the results obtained by the Continuing Medical Education (CME) with existing Patient Safety Organizations (PSO) and ECC for Mean-Square Error (MSE) and Peak Signal-to-Noise Ratio (PSNR). Fig. 3 investigates the MSE analysis of the proposed CME and the existing methods applied on different datasets. Fig. 3 shows that ME has performed better over the PSO and Hanover MSE on the applied dataset. For instance, on the applied dataset 100, the CME has attained a minimum MSE of 0.132, whereas the PSO and ECC models have obtained a higher MSE of 0.277 and 0.564, respectively. Likewise, on the applied dataset 112, the CME method has gained a lower MSE of 0.161, while the PSO and ECC methodologies have obtained a maximum MSE of 0.306 and 0.619, respectively. Later on, in the applied dataset 213, the CME has achieved a minimum MSE of 0.154, and the PSO and ECC have obtained a higher MSE of 0.372 and 0.549, respectively.
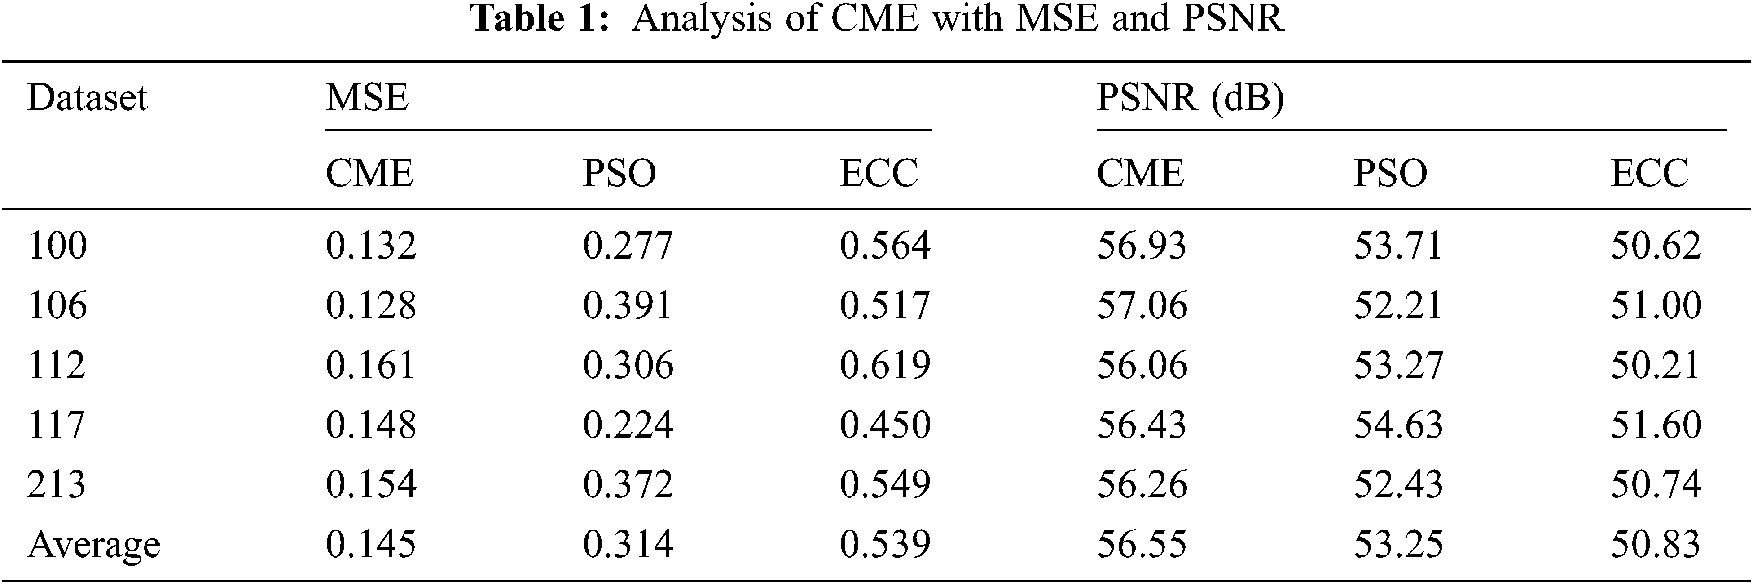
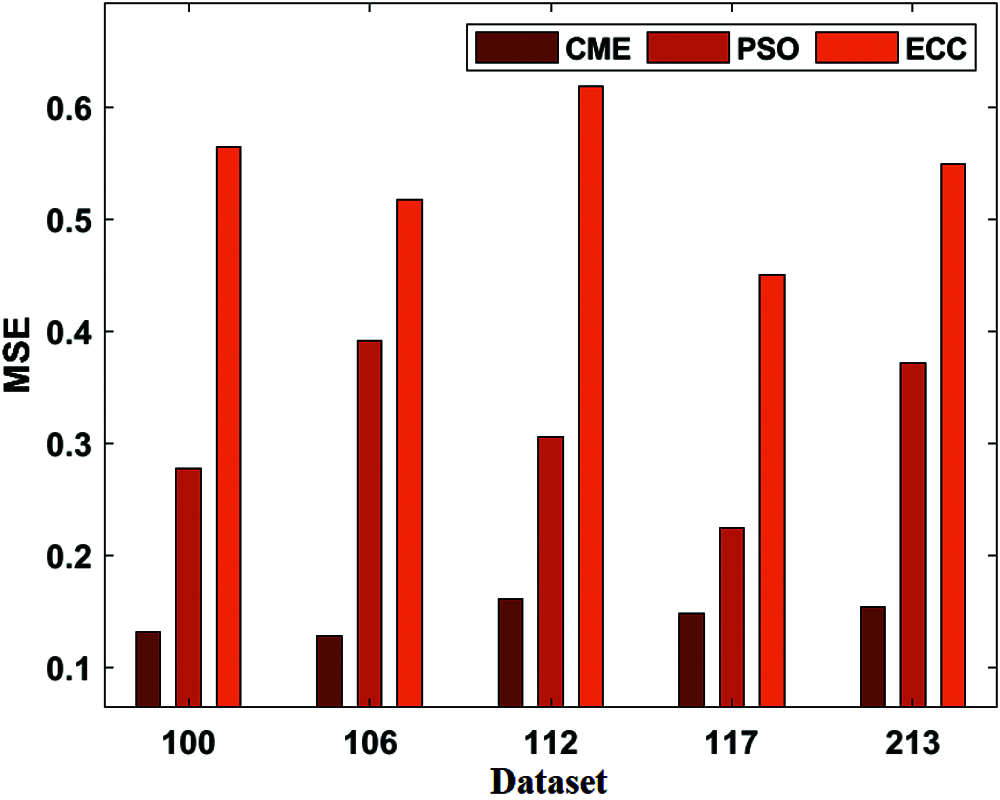
Figure 3: MSE analysis of CME model
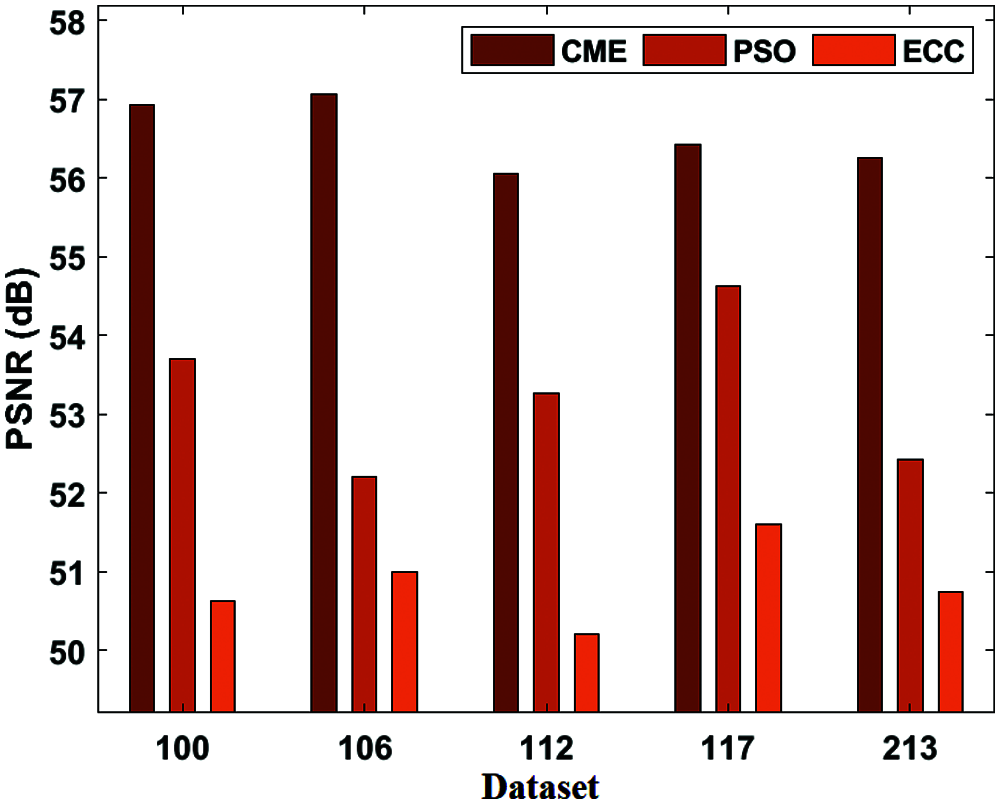
Figure 4: PSNR analysis of CME model
Fig. 4 displays the PSNR result analysis of the presented CME and existing methods applied on different datasets. Fig. 4 shows that the CME model has performed better over the PSO and ECC techniques by reaching higher PSNR values on the applied dataset. For instance, on the applied dataset 100, the CME model has attained a minimum PSNR of 56.93 dB, whereas the PSO and ECC models have obtained a higher PSNR of 53.71 dB, 50.62 dB, respectively. At the same time, on the applied dataset 112, the CME model has achieved the least PSNR of 56.06 dB, whereas the PSO and ECC models have gained a maximum PSNR of 53.27 dB, 50.21 dB, respectively. Similarly, on the applied dataset 213, the CME model has obtained a minimum PSNR of 56.26 dB while the PSO and ECC models have obtained a higher PSNR of 52.43 dB and 50.74 dB correspondingly.
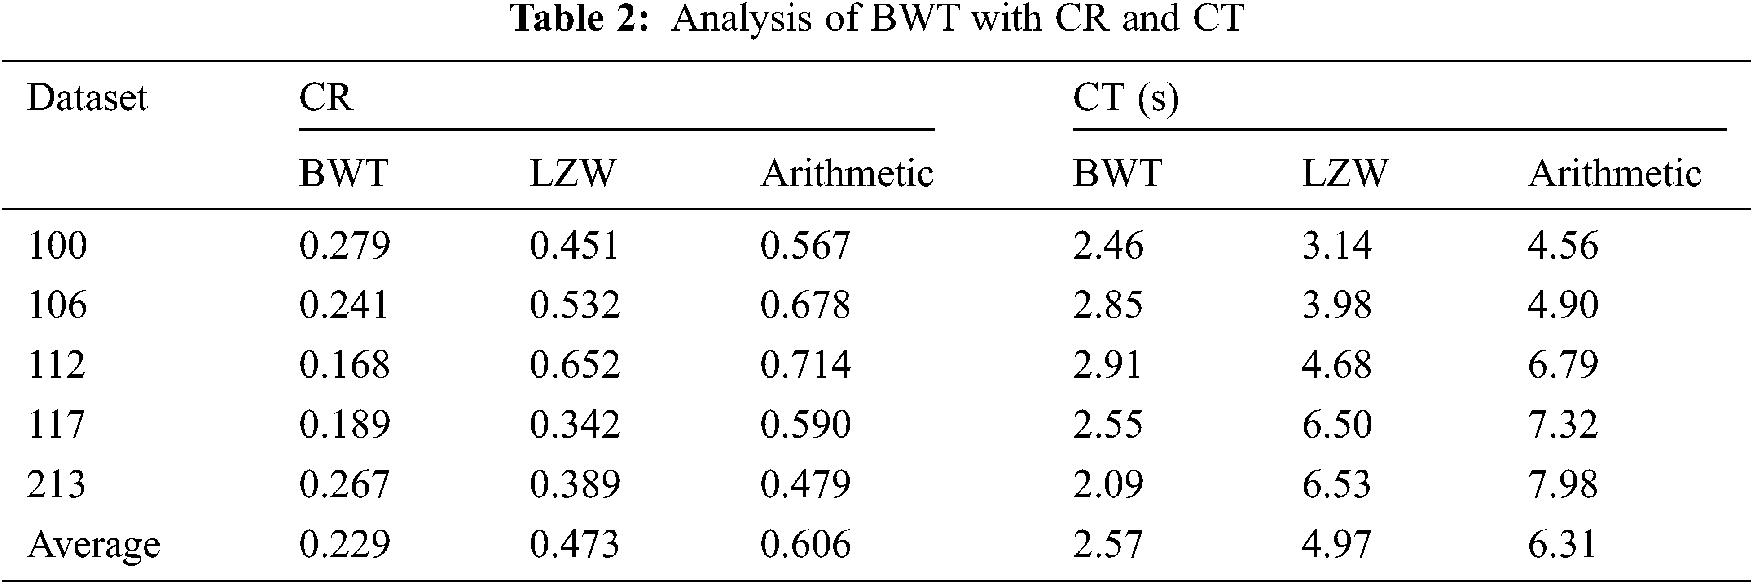
Tab. 2 presents the analysis of the results of the BWT with existing methods in terms of CR, and CT. Fig. 5 shows the CR result analysis of the projected BWT and previous methodologies on the applied dataset. Fig. 5 portrays the better performance of the BWT scheme over the Lempel–Ziv–Welc (LZW) and Arithmetic methods by gaining maximum CR values on the given dataset. For the sample, on the applied dataset 100, the BWT technology has accomplished a lower CR of 0.279, and the LZW and Arithmetic schemes have achieved greater CR of 0.451 and 0.567, respectively. At the same time, on the applied dataset 112, the BWT approach has obtained the least CR of 0.618, whereas the LZW and Arithmetic models have accomplished maximum CR of 0.652 and 0.714, respectively. Along with that, on the applied dataset 213, the BWT framework has reached a minimal CR of 0.267, whereas the LZW and Arithmetic models have attained supreme CR of 0.389 and 0.479, respectively. Fig. 6 examines the CT analysis of the developed BWT and previous methods on different datasets. Fig. 6 exhibits the BWT approach that showcased moderate performance over the PSO and ECC models by gaining minimum CT on the applied dataset.
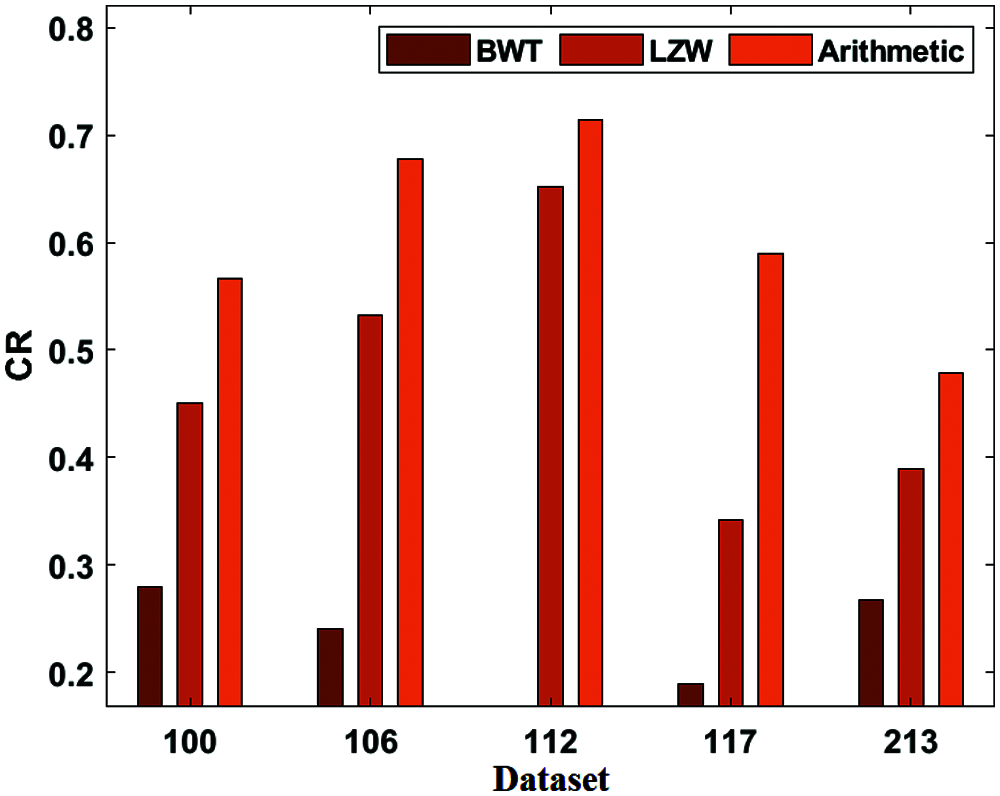
Figure 5: CR analysis of BWT
For sample, on the applied dataset 100, the BWT framework has gained a low CT of 2.46 s while the LZW and Arithmetic approaches have reached a maximum CT of 3.14 and 4.56 s respectively. In this line, on the applied dataset 112, the BWT model has obtained a lower CT of 2.91 s and the LZW and Arithmetic technologies have gained a higher CT of 4.68 and 6.79 s respectively. Then, on the applied dataset 213, the BWT scheme has attained a minimum CT of 2.09 s while the LZW and Arithmetic models have obtained a higher CT of 6.53 and 7.98 s respectively.
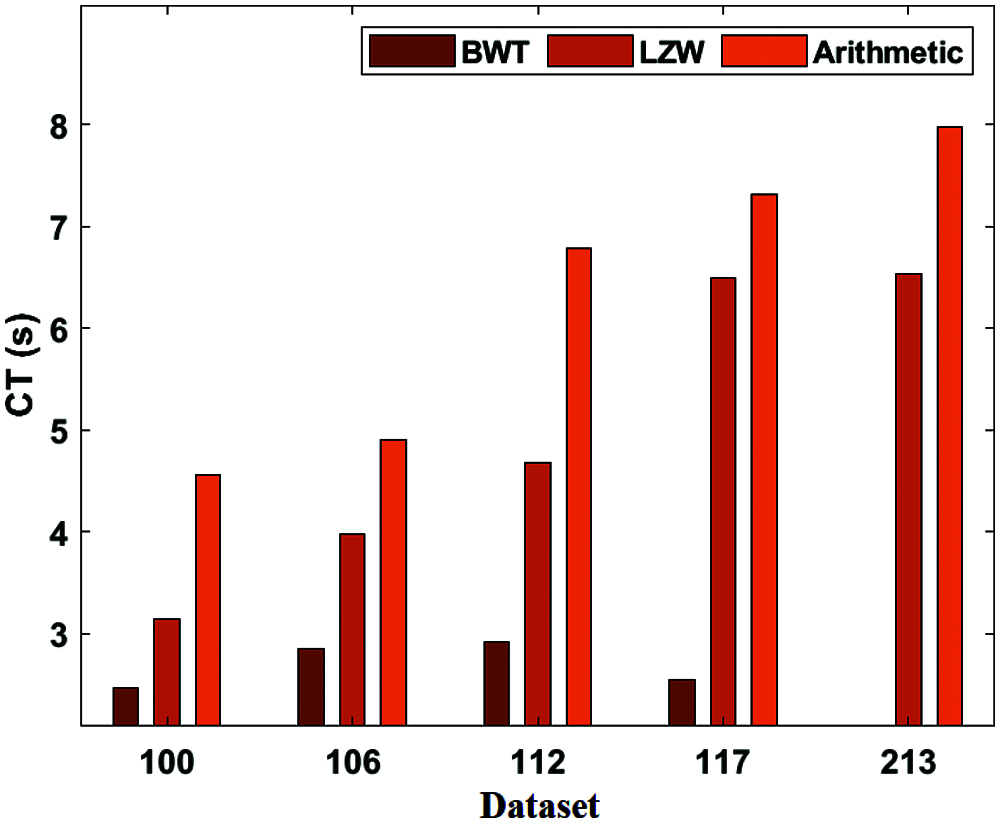
Figure 6: CT analysis of BWT
Tab. 3, Figs. 7 and 8 depict the result analysis of the classified heart disease of the DNN using the ECG signals. Fig. 7 examines the Sensitivity and Specificity analysis of the DNN with compared methods. Fig. 7 portrays the observation of bad classification outcomes of the MLP model with a minor sensitivity of 89.87% and specificity of 87.42%. In addition, the Federatie Nederlandse Vakvereniging (FNV) has tried to showcase slightly better results with a sensitivity of 93.89% and specificity of 88.94%. Moreover, the Support Vector Machines (SVM) have obtained a moderate performance sensitivity of 94.63% and specificity of 89.41%. Furthermore, the k-Nearest-Neighbor (K-NN) has achieved greater sensitivity of 95.31% and specificity of 89.48%. But the proposed DNN has proficiently classified the disease with the sensitivity of 96.06% and specificity of 91.49%.
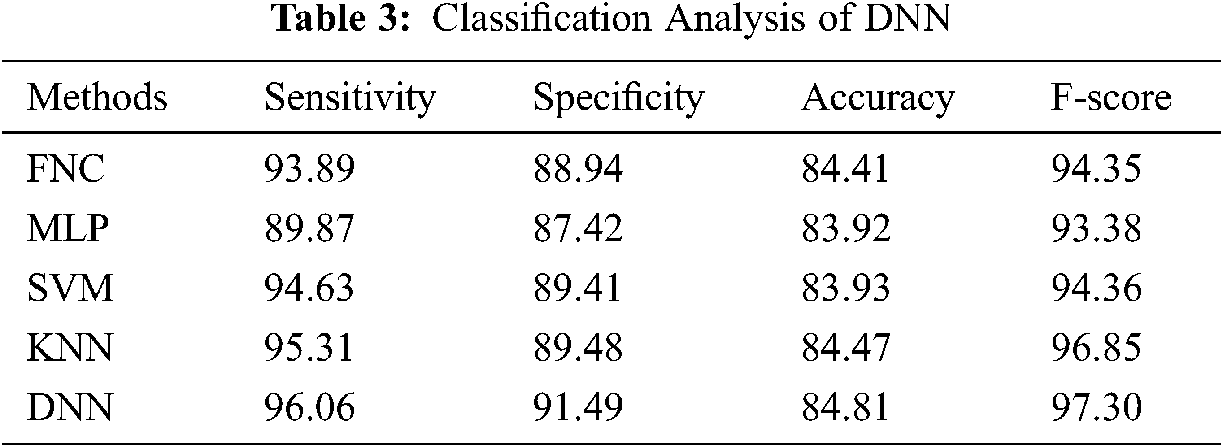
Fig. 8 investigates the accuracy and F-score analysis of the DNN with traditional models. Fig. 8 represented the inferior classification results achieved by the Medical Language Processing (MLP) approach with a minimum accuracy of 83.92% and F-score of 93.38%. Also, the SVM approach has managed to show intermediate results with an accuracy of 83.93% and a F-score of 94.36%. In addition, the Fine Needle aspiration Cytology (FNC) has gained a considerable function with an accuracy of 84.41% and a F-score of 94.35%. Moreover, the KNN has achieved competing accuracy of 84.47% and a F-score of 96.85%. Thus, the proposed DNN has significantly classified the disease with an accuracy of 84.41% and a F-score of 94.35%.
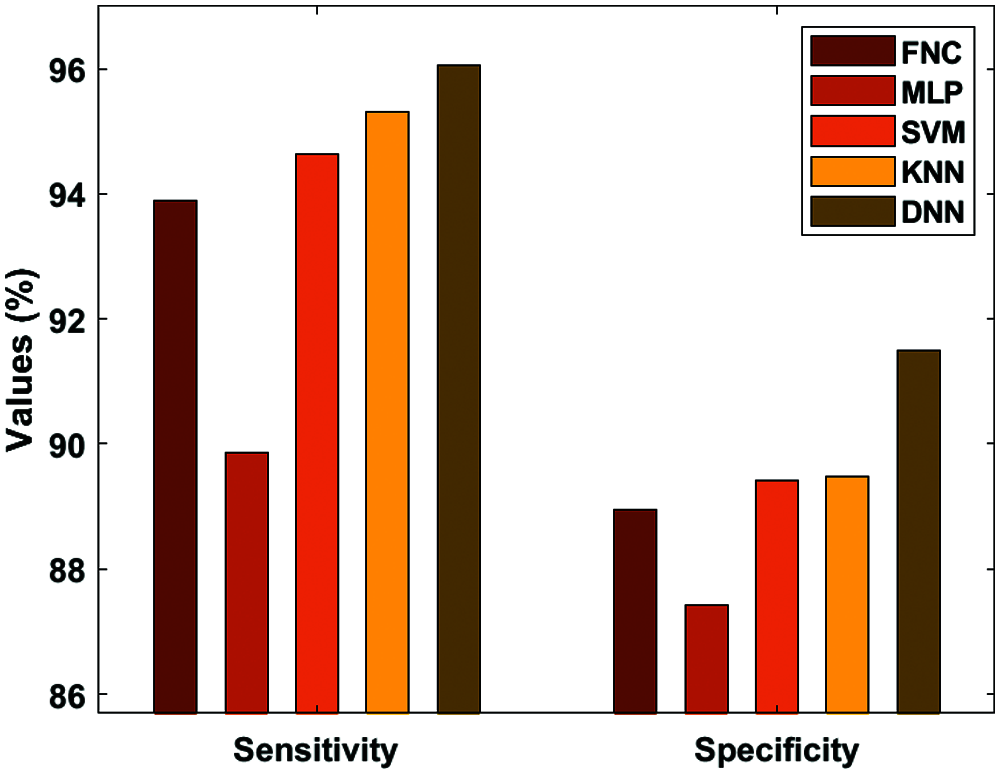
Figure 7: Analysis of DNN-sensitivity and specificity
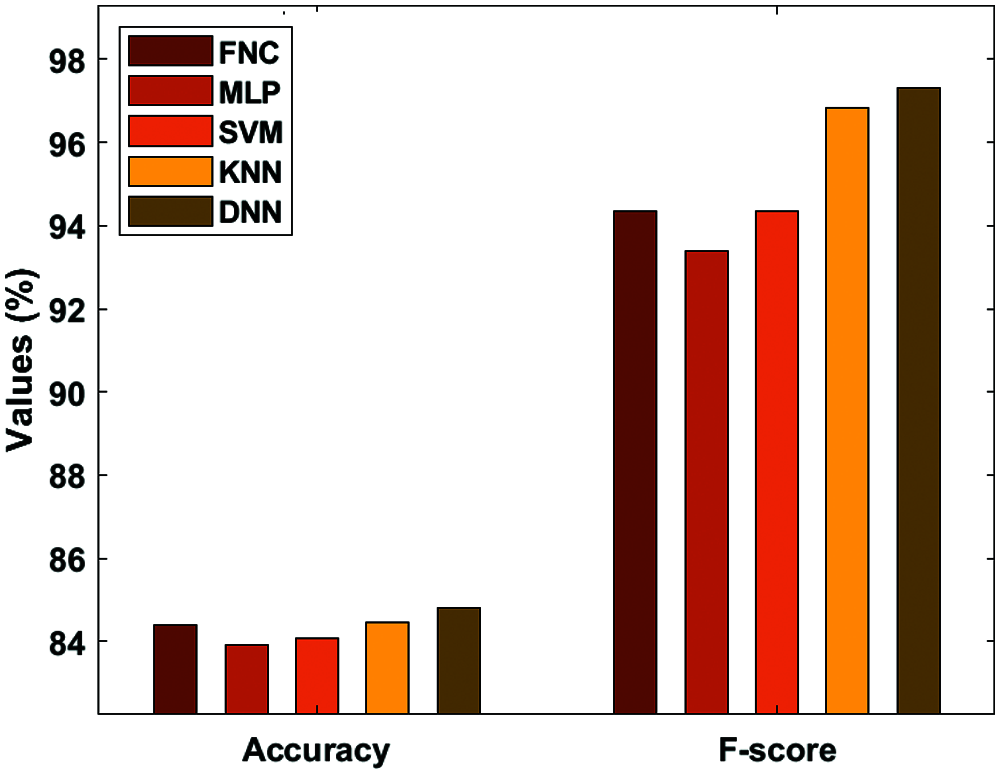
Figure 8: Analysis of DNN-accuracy and F-score
This study has presented a new ETC-ECG with a classification model for the examination of ECG data. The proposed model involves four major processes, namely: Preprocessing, Encryption, Compression, and Classification. When the gathered input of ECG signal data is preprocessed, the encryption process uses the chaotic map technique. Once the encrypted data get compressed, they are transmitted for further analysis. At last, the DNN is applied to determine the existence of heart diseases. An experimental analysis takes place to ensure the effective performance of the presented model to assure data security, compression, and classification performance for ECG data. The obtained experimental values that the ETC-ECG attains have maximum compression efficiency, security, and detection rate. In future, the proposed ETC-ECG can be deployed in an Internet of Things based cloud platform for remote monitoring of patients.
Funding Statement: The authors received no specific funding for this study.
Conflicts of Interest: The authors declare that they have no conflicts of interest to report regarding the present study.
1. A. Ibaida and I. Khalil, “Wavelet-based ECG steganography for protecting patient confidential information in point-of-care systems,” IEEE Transactions on Biomedical Engineering, vol. 60, no. 12, pp. 3322–3330, 2013. [Google Scholar]
2. A. Alesanco and J. Garcia, “Automatic real-time ECG coding methodology guaranteeing signal interpretation quality,” IEEE Transactions on Biomedical Engineering, vol. 55, no. 11, pp. 2519–2527, 2008. [Google Scholar]
3. S. M. S. Jalaleddine, C. G. Hutchens, R. D. Strattan and W. A. Coberly, “ECG data compression techniques—A unified approach,” IEEE Transactions on Biomedical Engineering, vol. 37, no. 4, pp. 329–343, 1990. [Google Scholar]
4. W. Lee and C. Lee, “A cryptographic key management solution for HIPAA privacy/security regulations,” IEEE Transactions on Information Technology in Biomedicine, vol. 12, no. 1, pp. 34–41, 2008. [Google Scholar]
5. L. R. Lagendijk, Z. Erkin and M. Boarni, “Encrypted signal processing for privacy protection,” IEEE Signal Processing Magazine, vol. 30, no. 1, pp. 82–105, 2013. [Google Scholar]
6. J. Zhou, X. Liu, O. C. Au and Y. Y. Tang, “Designing an efficient image encryption-then-compression system via prediction error clustering and random permutation,” IEEE Transactions on Information Forensics and Security, vol. 9, no. 1, pp. 39–50, 2014. [Google Scholar]
7. F. Beritelli, G. Capizzi, G. L. Sciuto, C. Napoli and M. Wozniak, “A novel training method to preserve generalization of RBPNN classifiers applied to ECG signals diagnosis,” Neural Networks, vol. 108, pp. 331–338, 2018. [Google Scholar]
8. F. Beritelli, G. Capizzi, G. L. Sciuto, F. Scaglione, D. Połap et al., “A neural network pattern recognition approach to automatic rainfall classification by using signal strength in LTE/4G networks,” in Proc. Int. Joint Conf. on Rough Sets, Olsztyn, Poland, pp. 505–512, 2017. [Google Scholar]
9. R. Avanzato, F. Beritelli, F. D. Franco and V. F. Puglisi, “A convolutional neural networks approach to audio classification for rainfall estimation,” in Proc. 10th IEEE Int. Conf. on Intelligent Data Acquisition and Advanced Computing Systems: Technology and Applications, Metz, France, pp. 285– 289, 2019. [Google Scholar]
10. B. Taji, A. D. C. Chan and S. Shirmohammadi, “Classifying measured electrocardiogram signal quality using deep belief networks,” in Proc. of IEEE Int. Instrumentation and Measurement Technology Conf. (I2MTCTurin, pp. 1–6, 2017, 2017 [Google Scholar]
11. U. R. Acharya, H. Fujita, S. L. Oh, Y. Hagiwara, J. H. Tan et al., “Application of deep convolutional neural network for automated detection of myocardial infarction using ECG signals,” Information Science,vol. 415-416, pp. 190–198, 2017. [Google Scholar]
12. S. Savalia and V. Emamian, “Cardiac Arrhythmia classification by multi-layer perceptron and convolution neural networks,” Bioengineering, vol. 5, no. 35, pp. 35, 2018. [Google Scholar]
13. R. Gupta and M. Mitra, “Wireless electrocardiogram transmission in ISM band: An approach towards telecardiology,” Journal of Medical Systems, vol. 38, no. 10, pp. 90, 2014. [Google Scholar]
14. M. Zhang and X. Tong, “A new algorithm of image compression and encryption based on spatiotemporal cross chaotic system,” Multimedia Tools and Applications, vol. 74, no. 24, pp. 11255–11279, 2015. [Google Scholar]
15. J. Ma, T. Zhang and M. Dong, “A novel ECG data compression method using adaptive Fourier decomposition with security guarantee in e-health applications,” IEEE Journal of Biomedical and Health Informatics, vol. 19, no. 3, pp. 986–994, 2015. [Google Scholar]
16. M. Raeiatibanadkooki and S. R. Quchani, “Compression and encryption of ECG signal using wavelet and chaotically Huffman code in telemedicine application,” Journal of Medical Systems, vol. 40, no. 3, pp. 1–8, 2016. [Google Scholar]
17. H. Mamaghanian, N. Khaled, D. Atienza and P. Vandergheynst, “Compressed sensing for real-time energy-efficient ECG compression on wireless body sensor nodes,” IEEE Transactions on Biomedical Engineering, vol. 58, no. 9, pp. 2456–2466, 2011. [Google Scholar]
18. R. Tornekar and S. Gajre, “Comparative study of lossless ECG signal compression techniques for wireless networks,” in Proc. Computing in Cardiology (CinCRennes, vol. 44, pp. 1–4, 2018. [Google Scholar]
19. M. E. Hameed, M. M. Ibrahim and M. A. Manap, “Compression and encryption for ECG biomedical signal in healthcare system,” Telkomnika, vol. 17, no. 6, pp. 2826–2833, 2019. [Google Scholar]
20. K. Shankar, M. Elhoseny, E. D. Chelvi, S. K. Lakshmanaprabu and W. Wu, “An efficient optimal key-based chaos function for medical image security,” IEEE Access, vol. 6, pp. 77145–77154, 2018. [Google Scholar]
21. G. Rosone and M. Sciortino, “The burrows-wheeler transform between data compression and combinatorics on words,” in Proc. Conf. on Computability in Europe CiE 2013: The Nature of Computation. Logic, Algorithms, Applications, Milan, Italy, pp. 353–364, 2013. [Google Scholar]
22. PhysioNet, [Online]. Available: https://physionet.org/content/mitdb/1.0.0/. [Google Scholar]
 | This work is licensed under a Creative Commons Attribution 4.0 International License, which permits unrestricted use, distribution, and reproduction in any medium, provided the original work is properly cited. |