DOI:10.32604/iasc.2022.017748
| Intelligent Automation & Soft Computing DOI:10.32604/iasc.2022.017748 | |
| Article |
Heart Rate Detection Using SVM Based on Video Imagery
1School of Electrical and Electronic Engineering, Wuhan Polytechnic University, Wuhan, 430000, China
2Gina Cody School of Engineering and Computer Science, Concordia University, W. Montreal, Quebec, H3G 1M8, Canada
*Corresponding Author: Yi Sheng. Email: whsyg10@163.com
Received: 09 February 2021; Accepted: 09 May 2021
Abstract: According to the World Health Organization, the death rate of cardiovascular diseases ranks first in the composition of disease deaths. Research shows that the heart rate can be employed as an important physiological parameter to measure the health status of people’s cardiac health. A pressure pulse is formed by the periodic beating and contraction of the heart, so its rate and the pressure pulse signal have a distinct synchronous periodicity. Certain wavelengths of light are known to be absorbed by the capillaries in the human skin, where this absorption fluctuates in accordance with the heartbeat as the capillary blood volume changes. Therefore, the intensity of the reflected light on the skin surface changes periodically, as manifested by a change of skin color. A dynamic target tracking algorithm was used for tracking the region of interest (ROI) in real time, where with this approach multiple targets can be monitored simultaneously. Our approach uses Photoplethysmography (IPPG) imaging technology, in conjunction with an ordinary camera to capture subtle periodic changes of intensity of reflected light from the surface skin. We then use a Support Vector Machine (SVM) algorithm for the video image data. The results of our research show that heart rate information of subjects can be detected quickly and accurately even when monitoring multiple targets.
Keywords: Heart rate; IPPG; SVM; target tracking
Traditional Chinese medicine methods of heart rate detection include directly sensing the pulse by touch. Using this method can roughly get the heart rate of the subject without any equipment and relies on a skilled practitioner. Manual methods are prone to variations due to the differences in pulse characteristics and the subjective nature of the practitioner’s interpretation of the pulse [1]. On the other hand, there are applications of electronic devices for heart rate measurement and monitoring. For example, with the Electrocardiogram (ECG), sensors detect physiological changes related to a heart rate and convert them into electrical signals to obtain the rate. While the accuracy of ECGs is better than manual methods, ECG measurements are limited in many ways. The devices are expensive and cumbersome, and the measurement requires multiple external sensors, which is clearly not appropriate for newborns or patients with extensive burns.
In recent years, there is a growing interest in non-contact medical and health devices, especially in the wake of the COVID-19 outbreak in 2019, so research into non-contact heart rate detection is of practical importance. There are many non-contact methods. For example, Liang et al. [2] proposed a non-contact human physiological signal detection method based on 2.4 GHz WiFi environment in their study. Lee et al. [3] used pulsed radio ultra-wideband (IR-UWB) radar to obtain heartbeat information without contact.
In 1937, Hertzman [4] proposed Photoplethysmography (PPG), which is a non-invasive application that can be used to obtain information about the change of blood volume in human blood vessels, and PPG has been widely used in modern medical industry [5]. Heart rate detection based on video images, namely image-Photoplethysmography (IPPG), is developed on the basis of traditional Photoplethysmography [6]. In this study, we utilized IPPG technology to detect subtle changes of human skin color by using ordinary cameras to determine the heart rate and other signals [7]. The optical properties of skin are mainly caused by the absorption of light by subcutaneous fluid, hemoglobin, and melanin, etc. In comparison, the absorption of light by blood is higher than that by other absorption factors. When the light enters the subcutaneous tissue, the periodic fluctuation of blood will affect the intensity of light reflection, in which the fluctuation of blood causes periodic changes in reflected light, while the light reflected by surrounding tissues and bones hardly shifts [8]. By capturing the light from the imaging equipment, changes in the reflected light signal can be observed [9] and the periodic components of the signal can be analyzed to obtain physiological parameters related to the human body, such as heart rate, blood pressure, etc. [10].
Li et al. [11], Kai [12] and Sanyal et al. [13] used human facial images to study heart rate detection. However, the innovation part lies in we propose a heart rate detection method based on video images of the neck rather than facial images, and this approach has certain advantages. Firstly, facial capillaries are numerous and thin, and it is relatively difficult to detect changes in the light signal reflected by the capillary network. Moreover, facial nerves are prevalent across the face, and even slight changes in human expression causes changes in blood vessel volume. Such changes will have a huge impact on the experimental results. Secondly, during the COVID-19 outbreak, wearing a mask was purported to minimize the risk of contracting or transmitting the novel Coronavirus [14]. With this in mind we must consider the risk of taking off the mask to collect the facial video image data [15]. In addition, facial image data is important personal privacy information, and collecting facial images increases the risk of personal information leaks [16]. Capturing video images of the neck however, avoids these problems. Moreover, the main arteries of the human body are located in the neck, therefore capturing video of the neck region improves the accuracy of the experiment and constitutes the basis of the theoretical research we put forward in this research.
One limitation of using facial images for non-contact heart rate research is that it requires the patient to remain still while capturing the video image in order to avoid motion interference. When using the neck region for similar research, relatively simple and mature edge detection algorithms are able to identify and track the region of interest (ROI), thus avoiding motion interference issue.
The advantages of this study are mainly the combination of IPPG technology and SVM algorithms. By using the dynamic target tracking algorithm, a specific region of the neck was selected as the ROI for the experiment, and corresponding optimization was made to correct for motion interference during data acquisition. Cao et al. [17] analyzed the effect of the Red Green Blue (RGB) video image channel for non-contact heart rate measurement and the study showed that optimizing the RGB channel resulted in higher measurement accuracy. Therefore, in this study, we also employed RGB channel optimization. In order to eliminate the noise in pulse wave signals and improve the accuracy of the experiment, an SVM algorithm was adopted to process the selected RGB channel data. The effects of environment and hardware parameters, such as illumination, camera frame rate and resolution, on the measurement accuracy are also studied. The measurement accuracy of the system was verified by experiments.
Lambert–Bill’s Law
When a monochromatic light with a wavelength of λ, light intensity of
where
Oxygenated hemoglobin in the blood in human blood vessels absorbs light in some wavelength ranges. As the heart beats periodically, the percentage of oxygenated hemoglobin in the vascular blood changes, which affects the absorption and reflection of light by the blood. Thus, by detecting and characterizing the periodic color changes in the skin the heart rate can be determined.
2.2 Data Acquisition and Processing
In IPPG measurement, certain regions of the human body are typically selected as signal acquisition ROI, considering the strength of movement noise generated by muscles in the static or moving state of the human body, vascular distribution, etc.
In 2008, Verkruysse et al. [18] selected the face as the ROI for image-based photoelectric volume tracing. In their study they selected various segments of the facial area to extract the pulse wave signal. The results show that in general the frontal facial area produced a more distinct pulse wave signal with less noise, and that the entire facial area in aggregate was useful to extract additional information such as the breath rate. Their work also concluded that if the ROI area is very small, such as a localized point on the forehead the signal noise tends to be larger.
The experiment uses the camera that comes with the mobile phone, the video size is 640 * 480, and the format is set to 30 frames per second (fps), and video image data was subsequently stored in AVI format. During video image acquisition, the experimental subjects sat approximately 0.5 m from the camera so as to occupy the full video frame, and were advised to avoid large movements as much as possible during the image capture. The actual heart rate was measured synchronously with a fingertip pulse oximeter. In order to test whether the research plan we designed meets the requirements, 10 subjects of different genders and ages were selected. Each participant underwent multiple video capture trials and synchronous heart rate comparison tests.
According to physiological data, skin melanin absorbs light in the 460–560 nm region of the spectrum, and fluid absorbs a lot of ultraviolet and infrared rays. Most of the green light and yellow light pass through the skin and will not be reflected back after entering the blood, the green light changes more obviously after passing through the blood. Therefore, when extracting the signal from the video, it is best to select the pixel green channel value. The experimental results are shown in Figs.1 and 2.
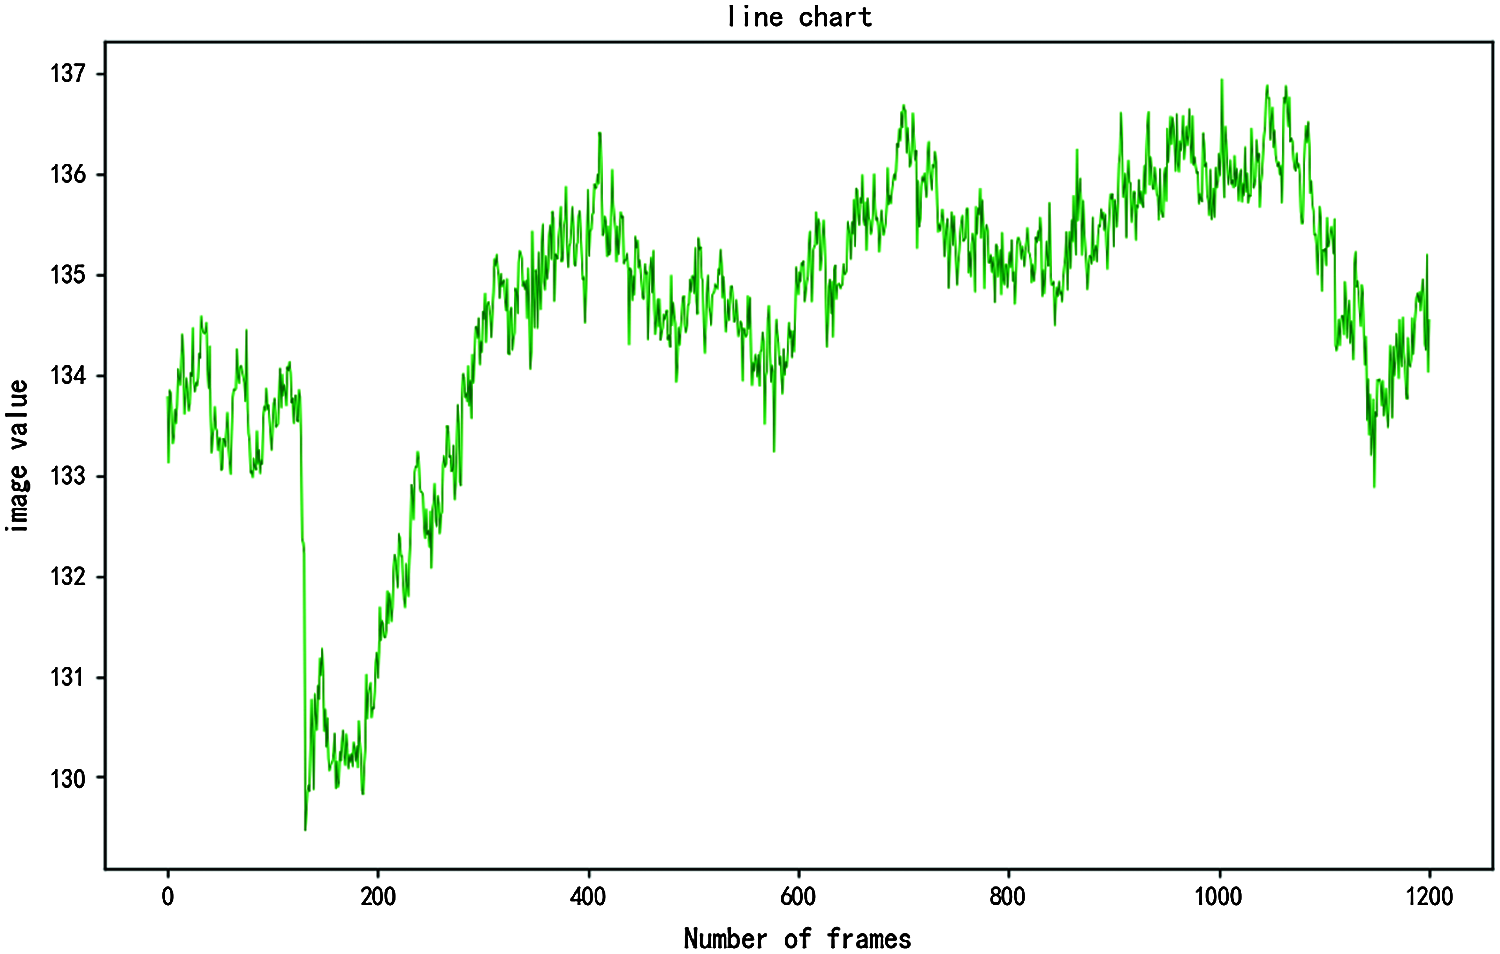
Figure 1: Green channel pixel value by video frame
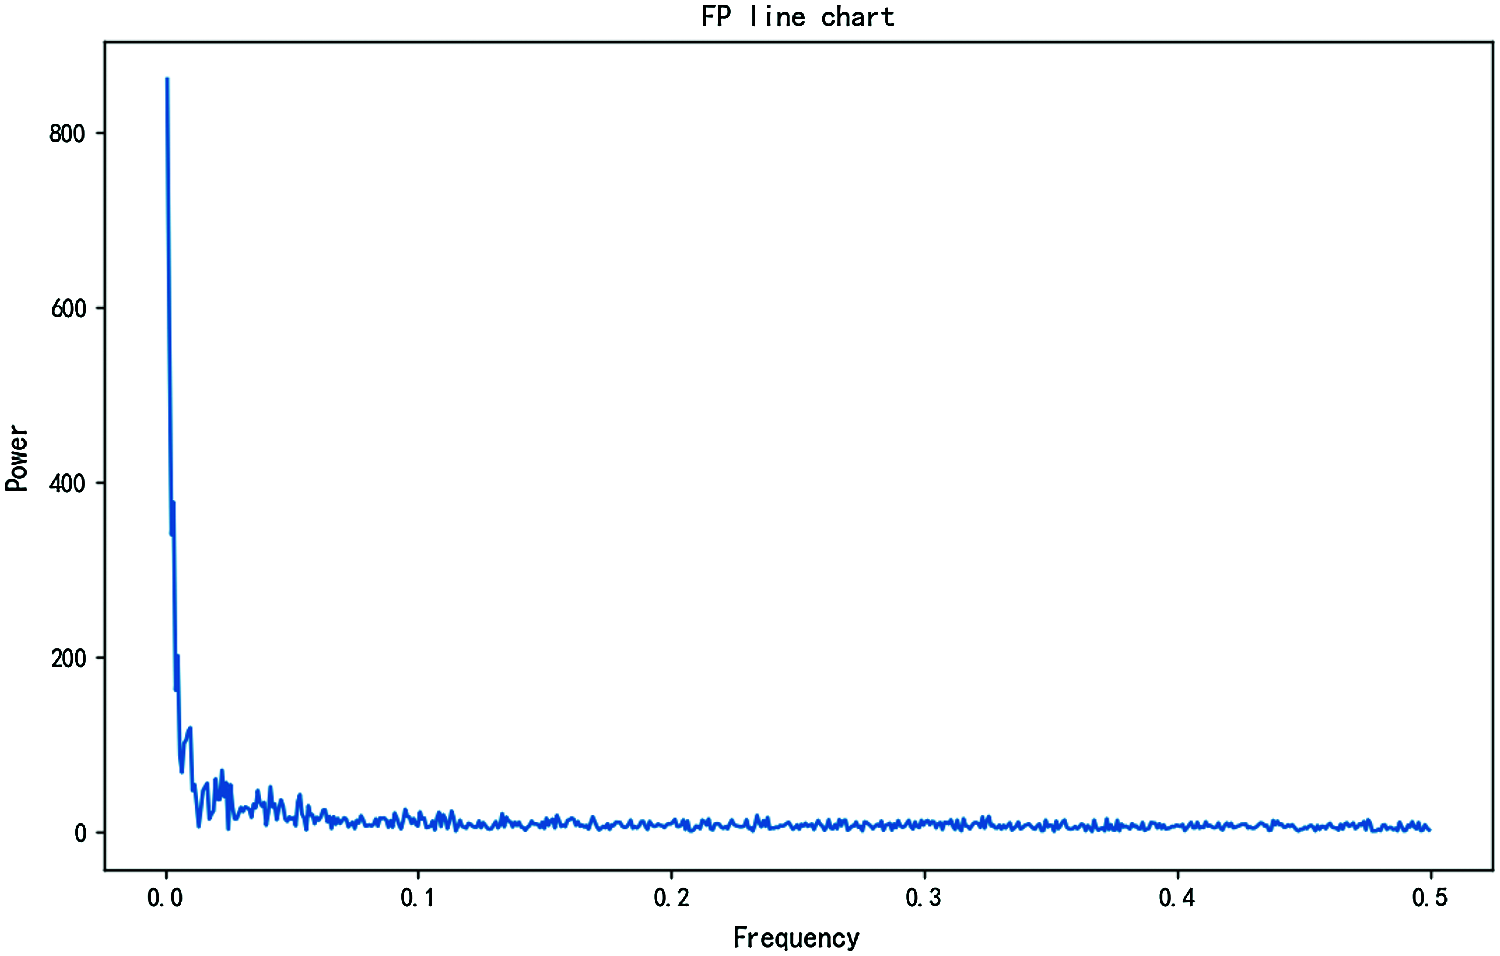
Figure 2: Frequency power spectrum
Fast Fourier Transform (FFT) is then performed using the time domain of green channel signal, and the power spectrum is obtained. The position with the highest value in the signal spectrum represents the frequency of the heart rate and respiratory rate we measured.
In 1995, Zhang et al. [19] presented a supervised learning model, namely a Support Vector Machine (SVM). The SVM is a basic algorithm, and has excellent learning ability and generalization performance. As a result, SVM have always attracted much attention in the field of machine learning, and its related basic concepts are discussed as follows.
Given a set of labeled training samples
where “
Suppose an optimal hyperplane can divide
In order to get the best data, we make changes to the Eq. (4), the Lagrange function can be introduced and the optimal classification function can be solved according to the Kuhn-Tucker condition, namely
where,
Generally speaking, the general idea of SVM is to obtain an interval maximized hyperplane in the feature space. Therefore, we want to get the corresponding classification function, we must choose the function that meets the Mercer conditions, namely
Among them, the Function
With the continuous deepening of research, various models and methods extended by support vector machines have been obtained [20–23], and these have been used in many places. We can also use it in our daily work. Of course, this algorithm is used in the core idea of this research.
3 Experimental Verification and Result Analysis
A method based on SVM is proposed to track the peak of heart rate spectrum. This method regards the tracking of peak of heart rate spectrum as a pattern classification task, and the statistical characteristics of multi-channel IPPG signals are fully considered in this process. This article uses the method of heart rate signal peak tracking and the method of SVM, namely, peak discovery followed by peak selection.
The detection of spectral peaks is mainly used to locate all spectral peaks in the IPPG signal spectrum. First set the threshold to K according to the conditions, namely
where, z refers to the IPPG signal spectrum of each channel after noise reduction;
The threshold is then used to form a candidate spectrum peak set, such that, when the detected peak value of the spectrum is higher than the initially set threshold, this value will be saved for the next step of comparison. If it is lower than the threshold, this value will be excluded.
The ultimate goal of using this method is to select the most accurate heart rate signal spectral peak from a set of spectral peaks that meet the threshold. The heartbeat is periodic, and there is only one spectral peak corresponding to the true heart rate in a time period. In order to distinguish the correct heart rate peak from the wrong heart rate peak, we need to find the particularity of the correct heart rate peak, and then perform statistical analysis.
1. After comparing the detected correct heart rate peaks, we found that most of the heart rate peaks have the largest peak coefficient among the peaks detected in the corresponding time period.
2. Among the detected correct heart rate peaks, the distance between most of the heart rate peaks and the correct heart rate peak in the previous time period is the smallest.
According to some of the characteristics of the correct heart rate spectral peak mentioned above, the detected spectral peak can be distinguished according to the crest factor and the peak-to-peak value of the adjacent time period. Assuming that there are
where
The distance of spectral peaks that meet the initial threshold in adjacent time periods can be expressed as:
where
SVM has good robustness and accuracy in signal processing, and can be used in this research to deal with the problem of spectral peak classification. In addition, because of the specific properties of the SVM decision surface, we can extend it to more applications. In this paper, the coefficient ratio and distance between candidate peaks are extracted from the set of candidate peaks. Secondly, perform the labeling operation, and mark the correct peak of the heart rate spectrum as “1” and the wrong peak as “0”. Then start learning according to the characteristics of the correct spectral peaks to find the support vector. Finally, the optimal hyperplane is determined according to the above support vectors.
In the testing stage, the coefficient ratio and the distance between the candidate spectral peaks should be selected first, and the feature vectors should be constructed. Then we can use the trained classifier to detect the correct peak of the heart rate spectrum, which corresponds to the true heart rate value. The position of the spectral peak corresponding to the true heart rate value in its time period can be divided into three categories, namely
Case 1: If only one heart rate peak is filtered out by the SVM detector, then this peak is the heart rate peak corresponding to the current time period, and the corresponding frequency is recorded as
Case 2: If multiple heart rate spectrum peaks are detected by the SVM detector, the spectrum peak closest to the last heart rate spectrum peak of the adjacent time period is selected from the spectrum peaks of the corresponding period, and the corresponding frequency is recorded as
Case 3: If the correct heart rate peak is not obtained through the SVM detector, then we believe that the signal extracted in the corresponding time period contains interference noise such as motion. Cannot get the correct frequency corresponding to the peak of the spectrum.
Based on the above-mentioned various situations, we have proposed a prediction mechanism that can accurately locate the peak of the heart rate spectrum. The corresponding frequency is recorded as
This mechanism can be expressed as,
where
If the correct heart rate peak is obtained, the frequency
where
For evaluating the performance of the SVM based algorithm, we chose our own data set to test the effectiveness of the algorithm. In this dataset there are 15 sets of data. During the experiment the subjects sat 1 meter from the camera, and remained still so as to avoid large movements. The signals were collected from healthy men age 18–35 years old with light skin, and IPPG signal was collected from the tester’s wrist by a pulse oximeters with green light LED (515 nm) distributed at different locations. The subjects also wore a finger clip oximeter which recorded the heart rate during the video image acquisition. The synchronous motion acceleration signal was collected from the wrist using a triaxial accelerometer, and ECG signals were collected from the tester’s chest using ECG electrodes and the ECG readings were considered as the actual heart rate. All the collected signals were sent wirelessly to nearby mobile devices which included computers and mobile phones.
In the simulation experiment, the input data is divided into a continuous series of overlapping time windows each with a descrete 8-s time interval and a 2-s time incement step-size between adjacent windows. In the same time period, estimate the current heart rate value through the obtained IPPG signal and motion acceleration signal, and the continuous heart rate is obtained by aggregating the heart rates from the sliding time windows.
The Least Mean Square Adaptive Filter (LMS-ANC) is used to eliminate some motion noise in multi-channel IPPG signal, whose filtering order is 25 and optimized value
1. the parameters of the formula
2. the order of the smoothing algorithm is 2
3. the smoothing parameter is 20
In addition, this study selected 5 training data sets (training datasets) and 5 test data sets (test datasets) for training the classifier. All training data sets are then used to evaluate the overall performance of the algorithm.
This paper uses three evaluation criteria to evaluate the function of each heart rate measurement algorithm, namely, average absolute error (Error 1), and Bland-Altman method and Pearson correlation coefficient. At the same time, the generalization performance of SVM classifier is evaluated by 10% discount cross validation.
Tab. 1 list the average absolute error (Error 1) of the algorithms respectively. In these tables we compare an SVM based heart rate measurement algorithm with several other mainstream algorithms, such as GREEN, ICA and CHROM [24–27]. The results show that on average, the SVM-based algorithm performs better than all other algorithms, although the ICA and CHROM perform marginally better for some specific datasets.
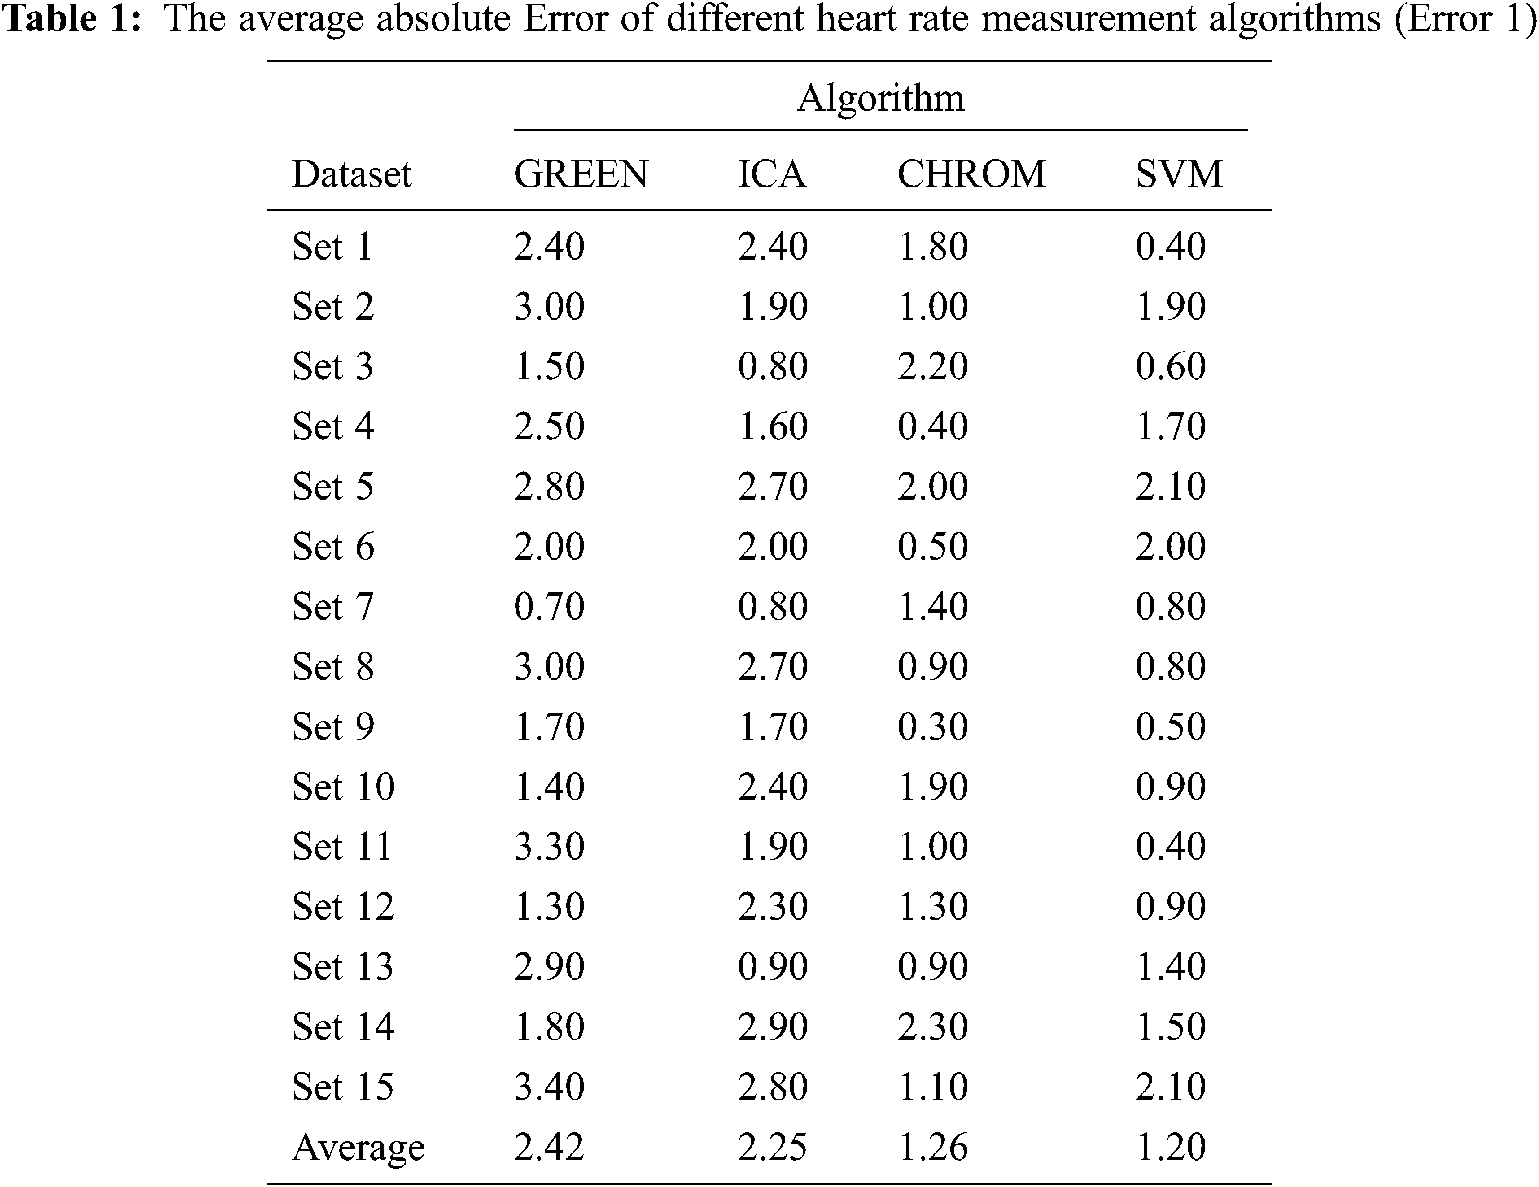
It can be seen from the observation in the Tab. 1 that the estimated heart rate curve of this algorithm basically coincides with the real heart rate curve, while the estimated heart rate curves of GREEN algorithm and ICA algorithm have incorrect heart rate estimates at some time points. For example, in the period of 0–50 s, the estimated heart rate value of CHROM algorithm is greatly deviated from the real heart rate value. In addition, in the time periods of 110–116 s, 140–149 s, 210–225 s and 263–270 s the estimated heart rate value of SVM algorithm also has obvious deviation from the actual heart rate value. As the performance of this algorithm is completely superior than GREEN, ICA and CHROM. Furthermore, the estimated heart rate 110–116 s, 140–149 s, 210–225 s and 263–270 s, the estimated heart rate value of SVM algorithm also has obvious deviation from the real heart rate value. Since the performance of this algorithm is completely better than that of GREEN, ICA and CHROM. Pearson correlation coefficient is the linear correlation between real heart rate and estimated heart rate through a scatter plot. Its evaluation criteria: the greater the absolute value of the correlation coefficient, the stronger the correlation. The Fig. 3 shows the results of correlation analysis on the test data. Most of the data points fall on the linear line, and the correlation coefficient is 0.9637, indicating a strong correlation.
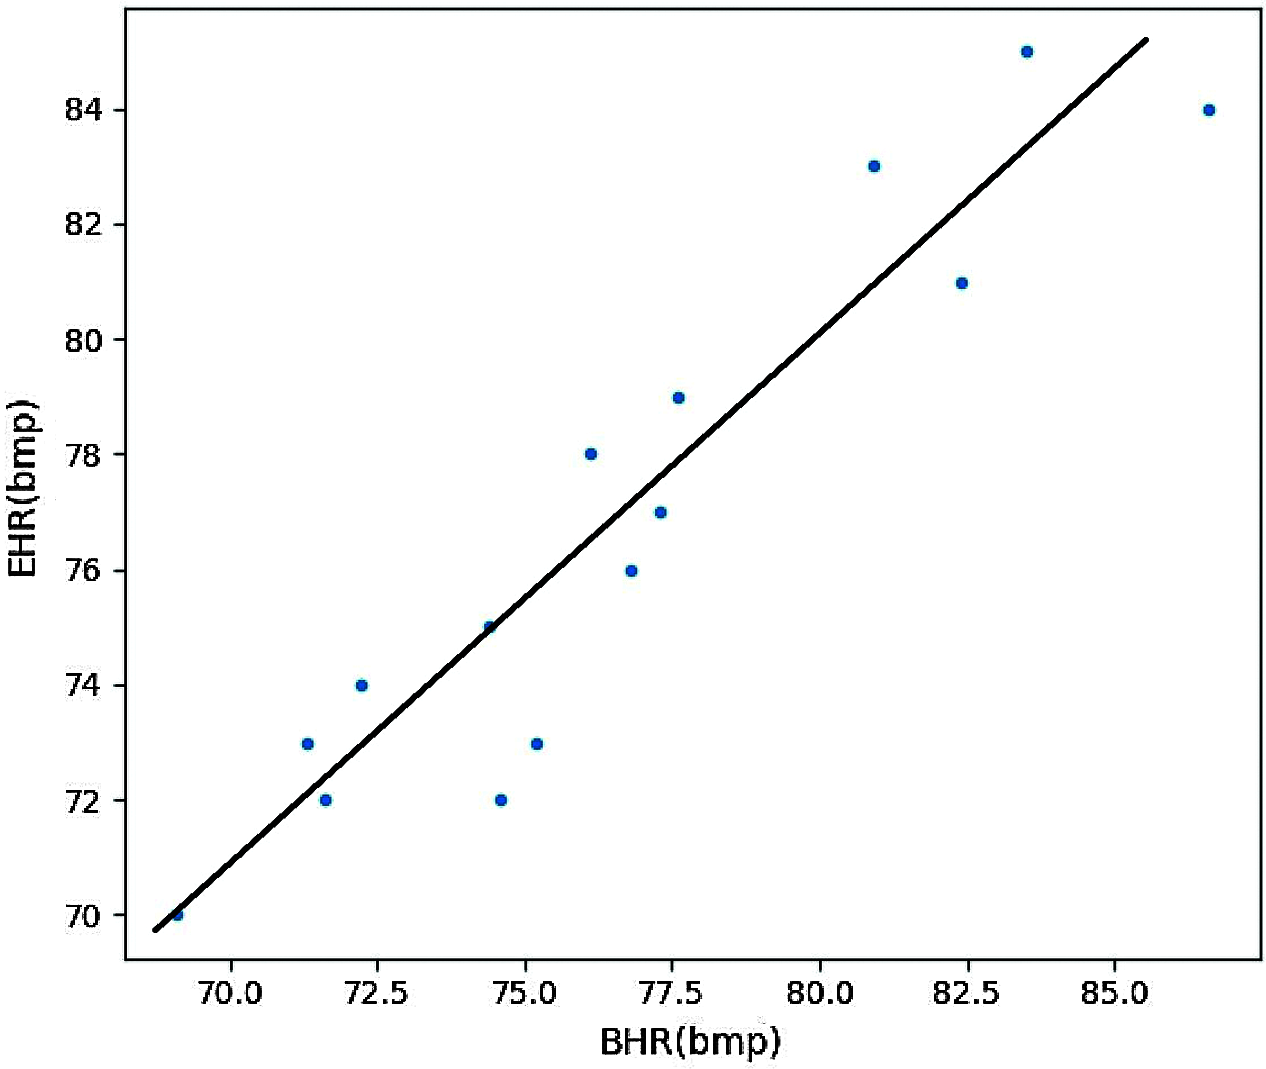
Figure 3: Pearson correlation coefficient
Heart rate value can be used as an important physiological parameter to measure human health, and it plays an important role in disease detection and prevention. The traditional tactile method of heart rate detection relies on skilled medical personnel to perform, and may be inconvenient for the patient. This article introduces a non-contact real-time heart rate measurement method based on the principle of IPPG. This method can obtain a more accurate heart rate value. The important thing is that it does not need to touch the human body and will not interfere with people’s daily life. It provides a lot of convenience for modern medical treatment. In this paper, we describe an SVM-based algorithm to optimize the spectral peak tracking method and improve the generalization ability and robustness of non-contact heart rate measurements. The algorithm divides motion noise reduction in multi-channel IPPG signals into two parts. First, a principal component analysis method (PCA) is used to process the motion acceleration signal to obtain the motion noise-related reference signal, and then band-pass filter (BPF) is used to filter the motion noise. The compression and the row thinning characteristic of the spectrum matrix are combined to form a sparse signal reconstruction model, and the objective function of the model is optimized by a FAST-ICA method. Then the down-step work to remove the motion noise is completed by spectral subtraction. Finally, using SVM-based heart rate spectrum peak tracking method, it can detect the spectrum peak corresponding to the heart rate in the optimized IPPG signal.
This paper tests the performance of the heart rate measurement algorithm based on SVM. The average absolute error (Error1) of the algorithm on 15 sets of data is 1.20 beats/min, the correlation coefficient is 0.9637. In addition, the heart rate measurement of the SVM algorithm based on SVM describe in this paper is compared with several well-known algorithms. From the results, we can observe that the SVM algorithm is consistent and provides an accurate real heart rate estimate on most datasets. Hence, the proposed algorithm effectively removes motion noise in multi-channel IPPG signals and achieves accurate measurements of the heart rate. Meanwhile, because less manual adjustment parameters are involved in the heart rate spectral peak tracking stage, and the SVM classifier is used, compared with the traditional IPPG, the SVM-based algorithm proposed in this paper is more robust and adaptable to the environment, and has higher accuracy.
Acknowledgement: The authors gratefully acknowledge the laboratory of electronic and information engineering, Multimedia Computing Laboratory, Guizhou Normal University, Guizhou Province, China.
Funding Statement: This work was financially supported by the National Nature Science Foundation of China (Grant Number: 61962010).
Conflicts of Interest: The authors declare that they have no conflicts of interest to report regarding the present study.
1. W. Tang, C. Liu and Y. Zhao, “Study on the detection method of long and short pulse in traditional Chinese medicine,” Chinese Journal of Basic Medicine of Traditional Chinese Medicine, vol. 14, no. 8, pp. 618–620, 2008. [Google Scholar]
2. Q. Liang, L. Xu, N. Bao, L. Qi, J. Shi et al., “Research on non-contact monitoring system for human physiological signal and body movement,” Biosensors, vol. 9, no. 2, pp. 58, 2019. [Google Scholar]
3. Y. Lee, J. Y. Park, Y. W. Choi, H. K. Park, S. H. Cho et al., “A novel non-contact heart rate monitor using impulse-radio ultra-wideband (IR-UWB) radar technology,” Scientific Reports, vol. 8, no. 1, pp. 13053, 2018. [Google Scholar]
4. A. B. Hertzman, “Photoelectric plethysmography of the fingers and toes in man,” Experimental Biology and Medicine, vol. 37, no. 3, pp. 529–534, 1937. [Google Scholar]
5. J. Allen, “Photoplethysmography and its application in clinical physiological measurement,” Physiological Measurement, vol. 28, no. 3, pp. 1–39, 2007. [Google Scholar]
6. J. Zhang, T. Qiu and J. Ma, “Non-contact heart rate detection and estimation based on improved chromaticity model,” Chinese Journal of Biomedical Engineering, vol. 36, no. 6, pp. 641–646, 2017. [Google Scholar]
7. J. Zheng, S. Hu, V. Chouliaras and R. Summers, “Feasibility of imaging photoplethysmography,” in Proc. of the 2008 Int. Conf. on BioMedical Engineering and Informatics, Sanya, China, pp. 72–75, 2008. [Google Scholar]
8. M. W. Wukitsch, M. T. Petterson, D. R. Tobler and J. A. Pologe, “Pulse oximetry: Analysis of theory, technology and practice,” Journal of Clinical Monitoring and Computing, vol. 4, no. 4, pp. 290–301, 1988. [Google Scholar]
9. T. Wu, V. Blazek and H. J. Schmitt, “Imaging: A new photoplethysmography noninvasive and noncontact method for mapping of the dermal perfusion changes,” Proc SPIE, vol. 4163, pp. 62–70, 2000. [Google Scholar]
10. H. Zhu, Y. Zhao and L. Dong, “Non-contact detection of cardiac rate based on visible light imaging device,” in Proc. SPIE, vol. 8498, pp. 849806, 2012. [Google Scholar]
11. X. Li, P. Wu, Y. Liu, H. Si and Z. Wang, “Heart rate parameter extraction based on face video,” Optics and Precision Engineering, vol. 28, no. 3, pp. 548–557, 2020. [Google Scholar]
12. L. Kai, “Research on dynamic non-contact heart rate detection based on video image,” China CIO News, no. 3, pp. 131–132, 2015. [Google Scholar]
13. S. Sanyal and K. Nundy, “Algorithms for monitoring heart rate and respiratory rate from the video of a user’s face,” IEEE Journal of Translational Engineering in Health and Medicine, vol. 6, pp. 1–11, 2018. [Google Scholar]
14. H. Agrawal, S. Singh and N. Gupta, “What all we should know about masks in COVID-19 pandemic,” Indian Journal of Surgery, vol. 82, pp. 295–296, 2020. [Google Scholar]
15. B. J. Cowling, Y. D. Zhou, D. K. Ip, G. M. Leung and A. E. Aiello, “Face masks to prevent transmission of influenza virus: A systematic review,” Epidemiology & Infection, vol. 138, pp. 449–456, 2010. [Google Scholar]
16. Y. Lu and Y. Luo, “Privacy and ethical dimension of personal information collection and processing in big data era,” Philosophical Trends, no. 2, pp. 63–68, 2017. [Google Scholar]
17. J. J. Cao, J. Feng, W. M. Tang and Y. Yu, “Color space selection of non-contact heart rate detection method,” Computer Science, vol. 44, no. Z2, pp. 260–262, 2017. [Google Scholar]
18. W. Verkruysse, L. O. Svaasand and J. S. Nelson, “Remote plethysmographic imaging using ambient light,” Optics Express, vol. 16, no. 26, pp. 21434–21445, 2008. [Google Scholar]
19. Z. Zhang, Z. Pi and B. Liu, “TROIKA: A general framework for heart rate monitoring using wrist-type photoplethysmography signals during intensive physical exercise,” IEEE Transactions on Biomedical Engineering, vol. 62, no. 2, pp. 522–531, 2015. [Google Scholar]
20. W. Zeng, Z. Huo, Y. Xie, Y. Jiang and K. Hu, “Chinese spirits identification model based on mid-infrared spectrum,” Computers Materials & Continua, vol. 64, no. 3, pp. 1869–1883, 2020. [Google Scholar]
21. M. El Mamoun, Z. Mahmoud and S. Kaddour, “SVM model selection using PSO for learning handwritten Arabic characters,” Computers, Materials & Continua, vol. 61, no. 3, pp. 995–1008, 2019. [Google Scholar]
22. Z. Wang, R. Jiao and H. Jiang, “Emotion recognition using WT-SVM in human-computer interaction,” Journal of New Media, vol. 2, no. 3, pp. 121–130, 2020. [Google Scholar]
23. T. Li, L. Wang, Y. Chen, Y. Ren, L. Wang et al., “A face recognition algorithm based on LBP-EHMM,” Journal on Artificial Intelligence, vol. 1, no. 2, pp. 59–68, 2019. [Google Scholar]
24. Z. Zhang, “Photoplethysmography-based heart rate monitoring in physical activities via joint sparse spectrum reconstruction,” IEEE Transactions on Biomedical Engineering, vol. 62, no. 8, pp. 1902–1910, 2015. [Google Scholar]
25. J. Zou, T. Chen and X. Yang, “Non-contact real-time heart rate measurement algorithm based on PPG-standard deviation,” Computer, Materials & Continua, vol. 60, no. 3, pp. 1029–1040, 2019. [Google Scholar]
26. C. Zong and R. Jafari, “Robust heart rate estimation using wrist-based PPG signals in the presence of intense physical activities,” in Proc. of the 2015 37th Annual Int. Conf. of the IEEE Engineering in Medicine and Biology Society (EMBCMilan, Italy, pp. 8078–8082, 2015. [Google Scholar]
27. S. Zhu, K. Tan, X. Zhang, Z. Liu and B. Liu, “MICROST: A mixed approach for heart rate monitoring during intensive physical exercise using wrist-type PPG Signals,” in Proc. of the 2015 37th Annual Int. Conf. of the IEEE Engineering in Medicine and Biology Society (EMBCMilan, Italy, pp. 2347–2350, 2015. [Google Scholar]
 | This work is licensed under a Creative Commons Attribution 4.0 International License, which permits unrestricted use, distribution, and reproduction in any medium, provided the original work is properly cited. |