DOI:10.32604/iasc.2022.020665
| Intelligent Automation & Soft Computing DOI:10.32604/iasc.2022.020665 | |
| Article |
Applying t-SNE to Estimate Image Sharpness of Low-cost Nailfold Capillaroscopy
1Department of Industrial Design, National Taipei University of Technology, Taipei, Taiwan
2College of Design, National Taipei University of Technology, Taipei, Taiwan
*Corresponding Author: Chih-Ping Chen. Email: roychen092@hotmail.com
Received: 02 June 2021; Accepted: 13 July 2021
Abstract: Machine learning can classify the image clarity of low-cost nailfold capillaroscopy (NC) and can be applied to the design verification for other medical devices. The method can be beneficial for systems that require a large number of image datasets. This investigation covers the design, integration, image sharpness estimation, and deconvolution sharpening of the NC. The study applies this device to record two videos and extract 600 photos, including blurry and sharp images. It then uses the Laplace operator method for blur detection of the pictures. Statistics are recorded for each image’s Laplace score and the distribution of clear photos in NC. In this investigation, an algorithm called t-distributed stochastic neighbor embedding (t-SNE) is introduced into the NC image sharpness estimation issue. The t-SNE is employed as a data visualization tool to determine the cluster distribution of sharp images. The result shows the t-SNE method to classify sharp images of NC is close to the method combine statistic and Laplace operator for sharp image distribution. And the image captured from the low-cost NC that applying deconvolution can sharpen the image. It shows that the NC equipment combines with low-cost hardware and software computing advantages has broader, powerful, and complex applications. For long-term purposes, it is conducive for detecting people who have Raynaud’s phenomenon in rural areas of developing countries to realize the vision of health equity.
Keywords: Nailfold capillaroscopy; deconvolution sharpening; blur detection; laplace operator; t-SNE; machine learning
The nailfold capillaroscopy (NC) can examine the blood vessels of the nail fold. The device consists of an optical microscope lens and a sensor that is connected to a computer that can calculate microvessel measurements like diameter and distance between microvessels. Clinicians can observe the capillaries here by observing skin at the nail fold. During the NC evaluation of human microvessels, many different morphological and functional changes can be evaluated, including microvessel visibility, diameter, length, distribution, density, and blood flow [1]. The diagnosis of Raynaud’s phenomenon, scleroderma, and rheumatoid arthritis is crucial.
Although related studies have shown that NC is an effective way to detect Raynaud’s phenomenon, it is still not common in rural areas in developing countries because of the high price of testing equipment and insufficient medical knowledge of doctors in these areas [2]. Therefore, it is necessary to develop a low-cost nailfold capillaroscopy (NC). Secondly, developing a medical decision support system is conducive to the realization of health equity in rural areas in developing countries. Because medical devices with AI can improve the efficiency of doctors and improve the quality of medical services.
However, to realize the development of a low-cost NC with an AI medical decision support system requires a long-term, sustainable, and step-by-step plan. Therefore, for NC applications in rural areas in developing countries, we will build a vision to be gradually realized. There are two main directions to complete this vision. The short-term goal is how to build a low-cost NC device and verification. The long-term goal is to collect an image database of sufficient patient samples and develop a medical decision support system with AI. This research purpose is the above-mentioned short-term goal because this investigation is at the initial stage of the project. During the research, it might be the following contributions as follows:
• The investigation is regarding the design, integration, and verification of low-cost NC devices.
• The study applying Laplace and t-SNE could estimate image sharpness, and applying the sharpening method could enhance the blurry images resulted from the low-cost NC device.
• This research proposes a set of procedures and provides a combination method that demonstrates its technique to getting good practice results.
The remainder of this paper is organized as follows. In Section 2, we have discussed the low-cost nailfold capillaroscopy (NC) device, the various survey of examining the morphology of nailfold microcirculation, Laplace operator, and t-SNE method. The research method of this NC device is discussed in Section 3. In Section 4, the content describes the prototype of NC and verification using Laplace operator and t-SNE method. Section 5 compares the two methods described above and applies the deconvolution method to realize image sharpening. Section 6 describes the conclusion.
Microvascular examination is a method used to test the microcirculation of patients and assess pathological changes [3]. Nailfold capillaroscopy is an increasingly useful diagnostic tool, dating back to the late 17th century. Later studies conducted by Maurice Raynaud and others in the late 19th and early 20th centuries first established the correlation between nail wrinkle microvessels and certain diseases. Capillary microscopy is a diagnostic technic first introduced in 1912 [4,5]. Nailfold capillaroscopy will become an important tool for rheumatologists. The new nailfold video capillaroscopy has some advantages, such as real-time control to obtained images, high-fidelity image storage, and reproduction [6]. Manually changing the focusing mechanism and using the camera head will provide a sharp image of capillary branches [7]. Nailfold capillaroscopy is completely safe and non-invasive procedure. Clinicians can observe the capillaries here by observing the skin along the nail fold.
In most people’s skin, capillaries run perpendicular to the skin’s surface, and only the nail fold can be easily observed. Because at the front nail fold, the capillaries are parallel to the skin surface instead of perpendicular to the skin surface, so they can be observed non-invasively after magnification [8]. During the nailfold capillaroscopy evaluation of human microvessels, many different morphological and functional changes in microvessels can be evaluated, including microvessel visibility, morphology, diameter, length, distribution, density, and blood flow [9]. The normal microvascular ring shows a U-shaped starting clip. The microvessels are parallel to the skin surface. There is no bleeding or dilated microvascular ring. Its density should be 9-12/mm. The use of nailfold capillaroscopy is shown in Fig. 1.
The current main application of nailfold capillaroscopy is to assess patients with Raynaud’s phenomenon. Raynaud’s phenomenon is the earliest and the most common clinical manifestation of diffuse connective tissue diseases, including systemic sclerosis, mixed connective tissue disease, systemic lupus erythematosus, and dermatomyositis/polymyositis [10]. However, secondary Raynaud’s phenomenon is related to other medical conditions, the most common being connective tissue diseases. For clinicians, it is recognized that Raynaud’s phenomenon is sometimes accompanied by other diseases, such as vasculitis, hematological diseases and malignant tumors. Therefore, if the patient has structural vascular damage, it can be observed by observing the crease at the tip of the nail.

Figure 1: Screening procedure of NC device, including (a) nailfold capillaroscopy; (b) test examines; (c) capillary observation; (d) microvessel patterns recognition
Nailfold capillaroscopy (NC) is a screening tool for examining the morphology of nailfold microcirculation. While many studies on NC have investigated the pattern and classification, a few studies have been focusing on how to improve the reliability of the assessment [11]. Within the current research scope in this field, as shown in Tab. 1, there have been two main practical issues regarding NC imaging quality. For telemedicine, to obtain sharp images is the most important consideration. However, high-end NC is often not a cost-effective choice for measurement, while low-end NC is affordable though time-consuming (adjusting the focus manually is needed). Therefore, this paper aims to find a solution to obtain sharp images using low-end NC in a time-efficient way.

2.2 Blur Detection and Laplace Operator
Sharp images are essential for analyzing microvascular abnormalities. However, everyone’s finger width is different, and the depth of field (DOF) of the NC is shorter. Therefore, quickly and accurately finding the correct focal length from low-priced NC is challenging. Sharp images are essential for the analyze microvascular abnormalities. Therefore, it is necessary to measure the blurred image quality and determine the sharp image. Basically, they prefer sharp images instead of blurred images [24]. Therefore, the microvascular microscope needs an autofocus function. The price of the equipment with the auto-focus function is usually not affordable for everyone. Generally, medical institutions in undeveloped countries cannot afford such expensive equipment, which prevents the nailfold capillaroscopys from being fully utilized in every corner of the world. The reason is that, in addition to the need for a stepping motor to drive the lenses up and down, it also requires the lenses to stay in the right position to allow persons with different fingerbreadths to find the precise focal length. Thus, the goal to obtain the correct data information about the microvascular of the nail fold.
Based on blur detection, many techniques can detect whether the image is blurred and the degree of blurring. The methods include Haar wavelet transform, fast Fourier transform, and Laplacian operator [25]. The Laplacian technique simply sharpens an image by emphasizing the high gradient information in an image [26]. In addition, the Laplacian score is proved discriminative in the application of several areas [27]. The Laplacian score for blur detection is used as the examination criteria in this study. Finally, blur detection and the degree of blurring is performed with Open CV, and implementation of the variance of the Laplacian method provides a single value to represent the blurriness of an image. The related paper presents an analysis of what factors cause blur on an image, especially macroscopic images of wood [28]. Therefore, the Laplacian operator is the simplest and most common method of edge detection.
2.3 Data Visualization and t-distributed Stochastic Neighbor Embedding (t-SNE)
Continuing from the above, the Laplacian operator is not suitable for data visualization and generally can only make sharpness evaluation for individual images. Therefore, one way we can see the distribution of clarity is to combine the Laplacian operator and statistical method, and the data can then be visualized. The other method is t-distributed stochastic neighbor embedding, which is used for the researcher to classify image-type data. Data visualization is an important task in machine learning, as people prefer visual representations of data over numerical ones [29]. The method of stochastic neighbor embedding (SNE) proposed by Hinton and Roweis [30], and the other method is the t-distributed stochastic neighbor embedding mentioned in this article (t-SNE). In machine learning, t-SNE is an unsupervised non-linear technique mainly used for data mining and visualization of high-dimensional data. This technique has become very common in the machine learning community because of its remarkable ability to scale high-dimensional data to lower dimensions [31].
Both t-SNE and PCA (Principal Component Analysis) are useful tools for dimensionality reduction and visualization. The problem of mapping high-dimensional data points to low dimensions while preserving as much structure as possible is known as dimensionality reduction [32]. In simple terms, dimensionality reduction is a technique to represent multi-dimensional data in two or three dimensions. One of the most common dimensionality reduction methods is the principal component analysis (PCA) proposed by Karl Pearson [33]. Another way is multi-dimensional scaling (MDS). This method is one of the earliest efficient non-linear dimensionality reduction methods [34]. And t-SNE can map multi-dimensional data to two-dimension or three-dimension suitable for human observation.
The non-linear dimensionality reduction algorithm t-SNE identifies observed clusters based on the similarity of data points with multiple features. The objective is to find patterns in the data. But t-SNE is not a clustering algorithm, but a dimensionality reduction algorithm. It is mainly a data mining and data visualization technology. When mapping high-dimensional data to lower-dimensional data, it is important to preserve the distance between similar samples and discover the relationship between nearby samples through visual inspection [35]. t-SNE is widely used in image processing, natural language processing, genomic data, and speech processing. Additional applications include facial expression recognition [36], Medical Imaging [37], and text analysis [38].
2.4 Formula of t-SNE and Laplace Operator
The process of Stochastic Neighbor Embedding (SNE) starts by converting high-dimensional Euclidean distances between data points into conditional probabilities that represent similarity. The conditional probability
Such that
For the reason to detect edges, the second derivative is used. The image must be distinguished in two directions since it is two-dimensional. The formula of the two-dimensional Laplace operator is as follows, where x and y are the standard Cartesian coordinates of the xy-plane [40]. And the Laplacian operator is implemented in OpenCV of Python by the function Laplacian.
The investigation includes a data set of 600 images captured from the NC device. It contains sharp and blurred images. This research aims to reduce the cost of nailfold capillaroscopy design, integrate, preliminary verification, image clarity estimation, and deconvolution sharpening. The method of image clarity estimation uses two methods: the t-SNE and the statistical results of the Laplacian operator, for the goal to confirm whether the results of the two methods are consistent. The following describes the image database used for analysis and two methods described above.
The research procedure of this investigation has six main steps. The first step is to confirm the design requirements of low-cost Nailfold capillaroscopy. The second step is to construct a low-cost NC device structure for observation and testing. The third step is to build a prototype, combining hardware and motor drivers to make this low-cost NC device work [41]. The fourth step is to produce and record the statistics of the Laplacian operator and to analyze the image quality of recorded video of finger capillaries. The fifth step is sharp image data visualization, which uses the t-SNE method to capture sharp pictures cluster of finger capillaries. The last step is sharpening the image by applying deconvolution. And the six steps are shown in the Fig. 2.

Figure 2: Research procedure
The software used in the design NC device in the first part of this research is PTC Creo 3.0. The components include a stepping motor module, a metal bracket module, a lens and sensor module, and a finger placement module. The software for rendering the NC 3D model is KeyShot, and the calculation of gears and racks uses DraftSight. The calculation in the latter part of this research uses the Laplace operator, which uses Python to calculate the Laplace score of 600 images. Then SAS’s JMP software is used to apply statistics and visualize the data. In addition, in this research, the machine learning method t-distributed stochastic neighbor embedding (t-SNE) was used. The tool used is Python and its software package t-SNE model. The model refers to the image t-SNE model of Micah P. Dombrowski [42]. This study modified the image data set of the above model to identify sharp and blurry images captured from the NC device.
The collected image data set is from the actual operation of the designed and built NC device prototype. In this investigation, 600 images were taken from two videos recorded. It contains 13 sharper images (2.17% ratio) and 587 blurry images (97.83% ratio).
4 Product Design and Development of NC Device
4.1 Define Design Requirements
The first design requirement is to build a low-cost NC using a digital microscope. Secondly, the microscope needs to add some components, including a stepping motor with a screw, a sharper microscope lens for observation, a camera sensor to receive images, a control driver for the stepping motor movement, and some mechanical parts to fix these modules, as shown in Fig. 3.

Figure 3: Low-cost nailfold capillaroscopy rendering, including (a) perspective; (b) side view
In the process of designing NC, an important step is to calculate the number of steps of the stepping motor. It involves whether a lens with a short depth of field can capture sharp photos. If the step spacing is too large, it is likely to skip the range of focal length. In addition to the stepper motor, another important condition is the screw feed rate. So a good choice would be a stepper motor with a screw, and this prototype design of the study would choose this module. In this module, the stepping angle of the stepping motor is 15 degrees. The rotation is 4.16 revolutions per second, and the resolution is 24 degrees in a circle. The total length of the screw is 54 mm, and the pitch is 0.5 mm. So every time the stepping motor rotates one step, the screw can move 0.02 mm. The meaning of RPS is revolution per second, PPS is pulses per second, and PPR is Pulses per revolution. The formula is as follows:
4.2 Building Architecture of NC Device
The next step is to establish the structure of the low-cost nailfold capillaroscopy product. There are four modules in total. The architecture of the low-cost NC device is shown in Fig. 4. The metal bracket is made of metal, and its function is to avoid the vibration caused when the stepper motor drives the lens to move. In the meantime, it also provides the space for the finger placement module. The finger placement module is located above the metal bracket, and its function is to place the finger of the patient. And it is designed with gears and racks for adjustment.
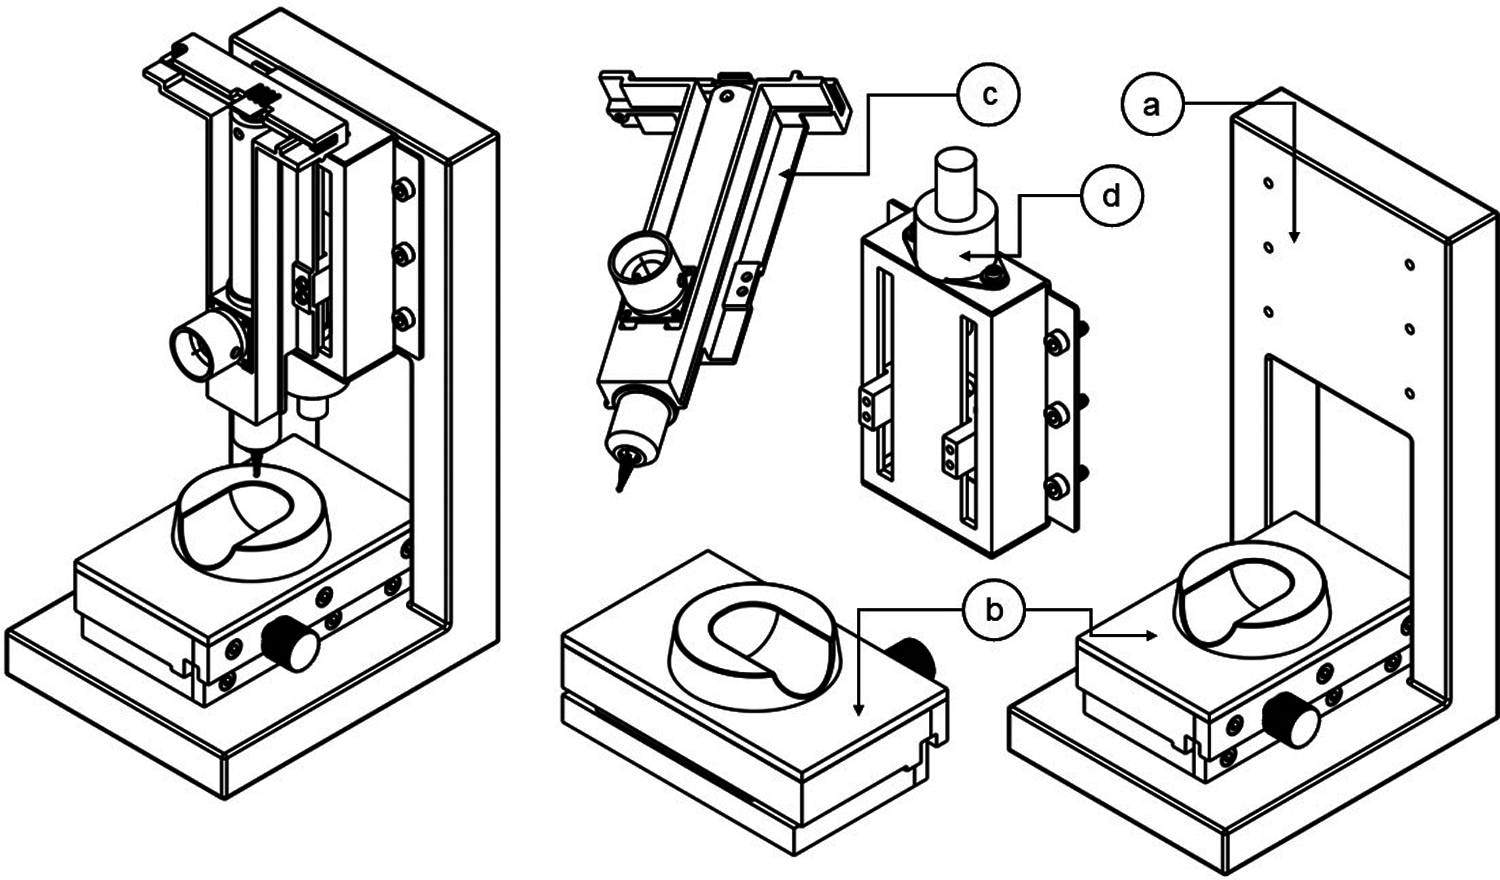
Figure 4: Low-cost nailfold capillaroscopy architecture, including (a) metal bracket; (b) finger placement module; (c) optical lens and sensor module; (d) stepper motor module
The optical lens and sensor module are important modules for this device, and the image of finger capillaries can be observed with this module. The stepping motor module includes a stepping motor with a screw, which provides the optical lens and sensor module to move to a suitable position. With the rotation of the stepping motor driving the screw, the lens, and the sensor module to rise and fall, each user can clearly observe the finger capillaries. Since each user’s finger is different in thickness and length, the finger placement module is designed with a knob that can be adjusted back and forth according to different finger lengths. Different finger thicknesses require the stepper motor module to drive the optical lens and sensor module up and down. In addition, the circuit board of the stepper motor is also needed to drive the movement of the stepper motor. In this study, the system used the Texas Instruments DRV8846 customer evaluation module, and the stepper motor used Portescap’s 20dam series stepper motor.
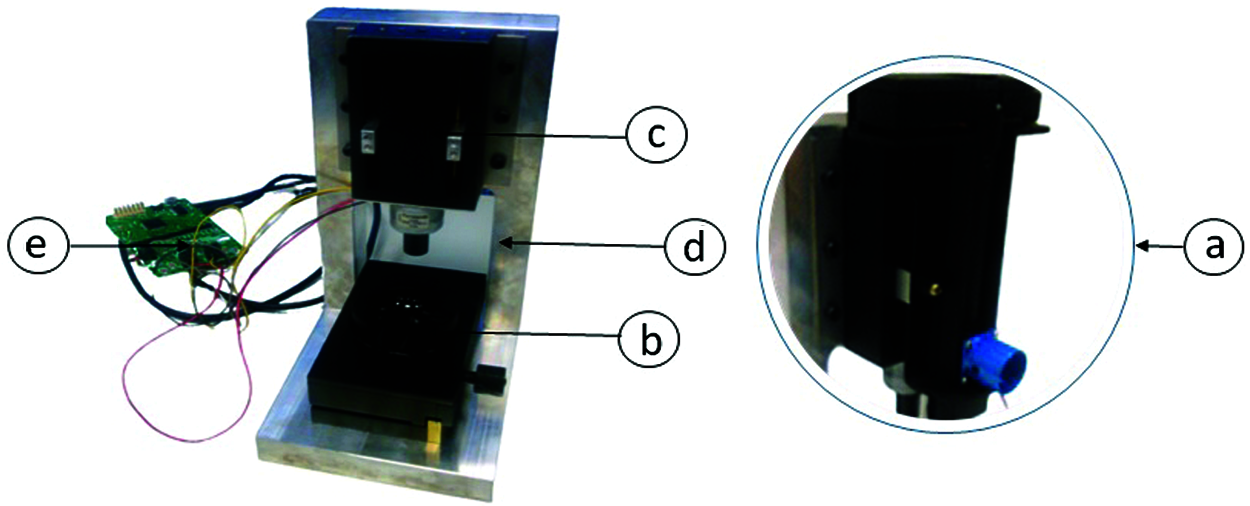
Figure 5: Components of low-cost NC device, including (a) lens with image sensor module; (b) finger placement module; (c) stepper motor module; (d) metal bracket; (e) drive motor circuit board
At this step a low-cost NC prototype is built, as shown in Fig. 5. First of all, a low-cost NC is engineered, including a stepping motor with a screw and contains the slide rails system on the left and right sides to ensure stability when moving. Secondly, a module for placing fingers is constructed, including a gear structure that can adjust the front and back displacement. The gear structure includes a spur gear and a steel gear rack. The spur gear is 25 teeth, the circular pitch is 1 mm, and the module is 0.32 mm. The steel gear rack is 80 teeth, the pitch is 1mm, and the module is 0.32 mm.
The integrated design phase includes cross-disciplinary professional cooperation. Taking UX and ID as examples aims to realize this device’s operation, making it more convenient and user-friendly. Taking mechanical design as an example, the design and simulation of motion in dynamic devices enable it to move and locate in an accurate position. And taking optics as an example, calculate the depth of field, and ensure the proper lens and sensor match. Take the hardware and firmware as examples, driving the stepping motor and operating the sensors to realize the lens’s movement to capture images. Also, using the concept of modular design, design a platform can observe and focus finger capillaries.
Another important component in this process is the lens. This experiment uses a long lens. The flange focal distance is 59.8 mm, and the effective focal length is 19.45 mm. The longer the focal length, the shallower the depth of field. Therefore, the depth of field of the lens in the prototype is only 0.06 mm. This sensor is a USB video device class-compliant camera module designed for portable notebook PC image applications. It achieves high quality and smooth video images with the integrated CMOS sensor and color processor. The integrated microcontroller is in charge of this module, and there are built-in statistics for auto exposure and auto white balance. The sensor used with it is 5 inches and a 4:3 sensor. The maximum resolution is 1200 pixels by 1600 pixels. The lens module contains a sharper microscope lens for observation, a camera sensor to receive images, some mechanical parts to mount these modules, related parts, and circuit boards. At last, the microscope needs to add some components, including a control driver for the stepping motor movement, as shown in Fig. 6.

Figure 6: Prototype of low-cost NC device, including (a) step motor module; (b) metal bracelet and finger placement module; (c) total assembly
4.4 Recording Video for Statistics of Laplacian Operator
The device needs a stepping motor to drive the lens and sensor up and down. It is also necessary to let the lens remains in the correct position. Thus, one way is a high-end device with an autofocus function. Another way is to capture sharp images from the recorded video, as shown in Fig. 7. The experiment recorded the chart using two MP4 videos (video-A 73 seconds and video-B 68 seconds) to capture thirty seconds from each video. And ten photos per second. In total, the device capture 600 photos in JPG format. As for the rest of the video which contained only the remaining more blurred images and no additional information, thus were discarded and not used.
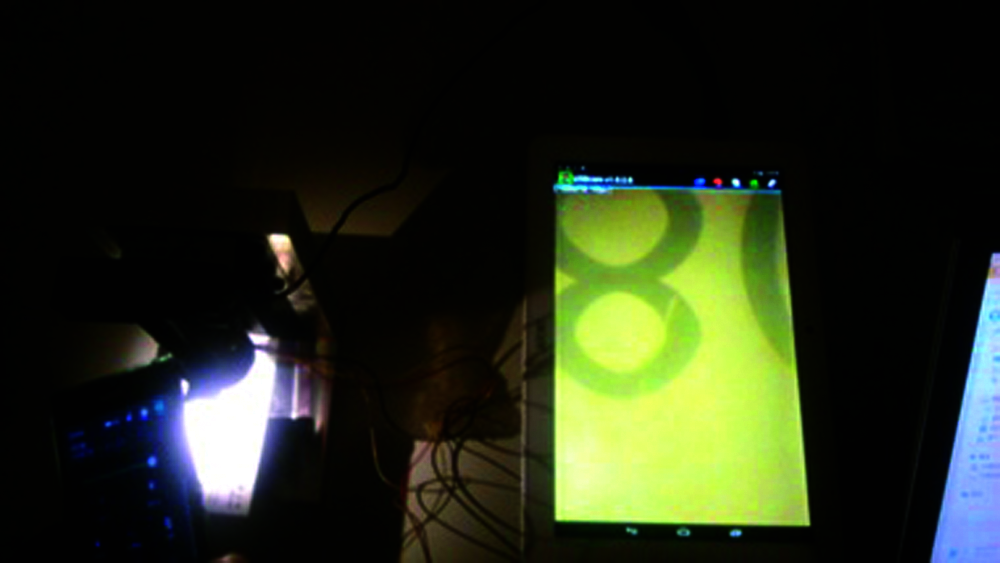
Figure 7: Recording video and capturing images from prototype
After the completion of this low-cost nailfold capillaroscopy, there is a key question: How to verify that this equipment is feasible. Because there is no actual sampling of the microvascular data of multiple people’s fingers, we will use the chart to replace the sampling of microvascular data. And actually, obtain the observation chart image from the operation of the device. As for the light source in this investigation, the original plan is the standard light source of the general office, which is 300~500 lux. But the fact we found it isn't easy to collected videos. Then we turned off the light and used the mobile phone spotlight to assist the lens with the sensor module of the NC device to collect videos.
A total of 600 images were obtained from the above steps. This investigation uses the Laplace score as a criterion for judging whether a photo is sharp or blurry. At first, assign a number to each image to facilitate subsequent observations. The software used is Visual Watermark and uses Python to calculate and record each image’s Laplace score. In this investigation, the Laplacian score is used as a judgment tool for blur detection. This investigation can obtain Laplacian scores of all images, and the identification time for 600 images is about 2.62 seconds.
We can see that if the Laplacian score exceeds 5.8, it is marked with shading, which can be determined in two ways. The first method is determined by referring to the above statistical graph, and the second method refers to the clusters classified by t-SNE and the number of images. Therefore, a total of six even numbers from 288 to 300 are marked as sharp images. The rest of the Laplacian scores are not more than 5.8, which are regarded as unclear photos as shown in Tab. 2. The number 298 from Video A has the highest Laplace score. Fig. 8 shows the statistics of the Laplacian operator with OpenCV library in Python. Due to the consideration of data visualization of 600 images, some optimizations have been made as far as possible without affecting the original data. We compared images of the same scene at different focal depths to determine which image is the sharpest. A well-focused image is expected to have a high variation in grey levels, and the Laplace score is higher.


Figure 8: Laplacian score of the images from video A and B, the arrow indicates the highest score image
4.5 Applying t-SNE for Visual Design Verification
The t-Distributed Stochastic Neighbor Embedding (t-SNE) is an unsupervised nonlinear technology in machine learning, and the method is mainly used for data mining and visualization of high-dimensional information. Applying t-SNE in Python is used to classify all the 600 images in the dataset from the video described above. Fig. 9 shows that the serial numbers of sharp images are 288~300. The figure shows the quality of each image and the image cluster of different sharp degrees. Cluster B to cluster D images become more blurry compare to the upper left corner with the cluster of sharp images. It also shows that the t-SNE can be a visualized tool for design verification of low-cost NC.

Figure 9: Applying t-SNE to estimate image sharpness of low-cost NC, the arrow indicated a cluster with clear photos (The number of photos is about 12–13, and the serial numbers are between 288~300)
The t-SNE can automatically distinguish several categories. Then manual judgment is applied to assist detection or automatic suggestion from the cluster of blurry and clear images, for the threshold of the Laplacian score is 5.8. Although t-SNE is a useful visualization tool for image data and can thus perform data classification, there is still a need to differentiate clear images from the dataset manually. Moreover, while t-SNE can determinate the threshold of Laplacian score, unable to automatically identify the clarity of the image data has limited its visualization capability. Therefore, t-SNE can only serve as a decision support system during the design and verification process.
5.1 Compare the Meaning of Laplace Operator and t-SNE Method
As for the t-SNE technique, it could only be used as a visual decision support system during the design and verification step, assisting us in identifying clear image clusters from the chart and determining whether the NC device can effectively capture clear images. In this study, 13 images were classified as better clarity from the total 600 sample images. This classification result was then compared with the statistics and distribution results using (1) the Laplace operator, (2) the Laplace operator with statistical methods, and (3) the t-SNE method.
The Laplace operator can evaluate a single image and obtain a value as a standard for blur detection. Still, it cannot show the distribution or its relationship with other images. By combining the Laplace operator with the statistical methods, we can obtain the distribution of all data content. Therefore, taking the vibration, light source quality, lens quality, and sensor configuration into consideration, the Laplace operator value cannot be regarded as the final assessment standard. Nonetheless, it can still assist us in visualizing the image data captured by the self-made low-cost NC device. During the visualizing process, the images have gone from fuzzy to clear and then from clear back to fuzzy. As for applying the t-SNE method, we can identify the visual distribution of the image data, automatically obtain the clearer and fuzzy clusters, and display the number of images in each cluster.
The t-SNE method can be used for classification, though the classification label remains unknown. We can tell that there are roughly four categories in Fig. 9. However, since the t-SNE is an unsupervised machine learning method, the meaning of each cluster’s classification requires manual identification. The advantage of t-SNE’s cluster of images is that it can be divided into several clusters randomly and automatically. In this study, it can distinguish a cluster of sharp images (cluster A). The relationship between clusters only provides indicators for sharp and blurred images. In addition, there are a few indicator clues for the cluster of blurry images (in this study, cluster B, C, and D). The farther away from cluster A, and the worse sharpness quality. The threshold of 5.8 is from the sharpest clusters generated by t-SNE. Cluster A has the sharpest images, with a quantity about 12–13, numbered 288–300. Therefore, the Laplacian scores of No.288–300 are 5.85–7.06, so those lower than 5.85 are classified as unclear. Thus, we discover the threshold of Laplacian scores is 5.8 from the t-SNE cluster with the sharpest images.
The Laplace operator method can obtain a determined value, but the extent of clarity and which value represents the standard cannot be known. As for combining the Laplace operator with the statistical method, we can also identify the data visualization process from vague to clear, in addition to the numerical value alone. Therefore, if we combine the above methods, the unsupervised machine learning method can first make a classification based on the image clarity of each cluster and display the number of each cluster. Next, the Laplace operator method can be applied to verify the implied meaning behind the obtained value, thus obtaining the accessing standard of clear and unclear images. In this study, the threshold of the Laplacian score can be calculated as 5.8, which can be used as the classification boundary for clear and fuzzy images.
To sum up, t-SNE can divide images into several categories according to different image sharpness. Although it is still necessary to manually identify which category is the high sharpness category, there are still several potential applications for the development of low-cost NC. First, it can help determine the threshold of the Laplacian score, which is the standard for clear images. Secondly, it can be used to explore and confirm the attributes that affect the shooting of clear images, such as the appropriate position of the stepper motor. After obtaining more microscope focusing action data, it becomes the data database of the microscope group, which helps to define the focus parameters of clear images using the microscope. Finally, it may improve the automatic quality assurance of low-cost NC.
5.2 Applying Deconvolution Sharpening for Low-cost Nailfold Capillaroscopy Images
The six captured images were analyzed with various processing methods. First, we used the Laplace operator to measure the blurred image quality. According to the blurred detection results, the score of the first image is 142.94, which shows that it is the clearest of all the images. Then, based on these finger-detection clarity results from the Laplace operator, we were able to complete the verification of the low-cost NC device and turned it into practical use accordingly, as shown in Fig. 10.
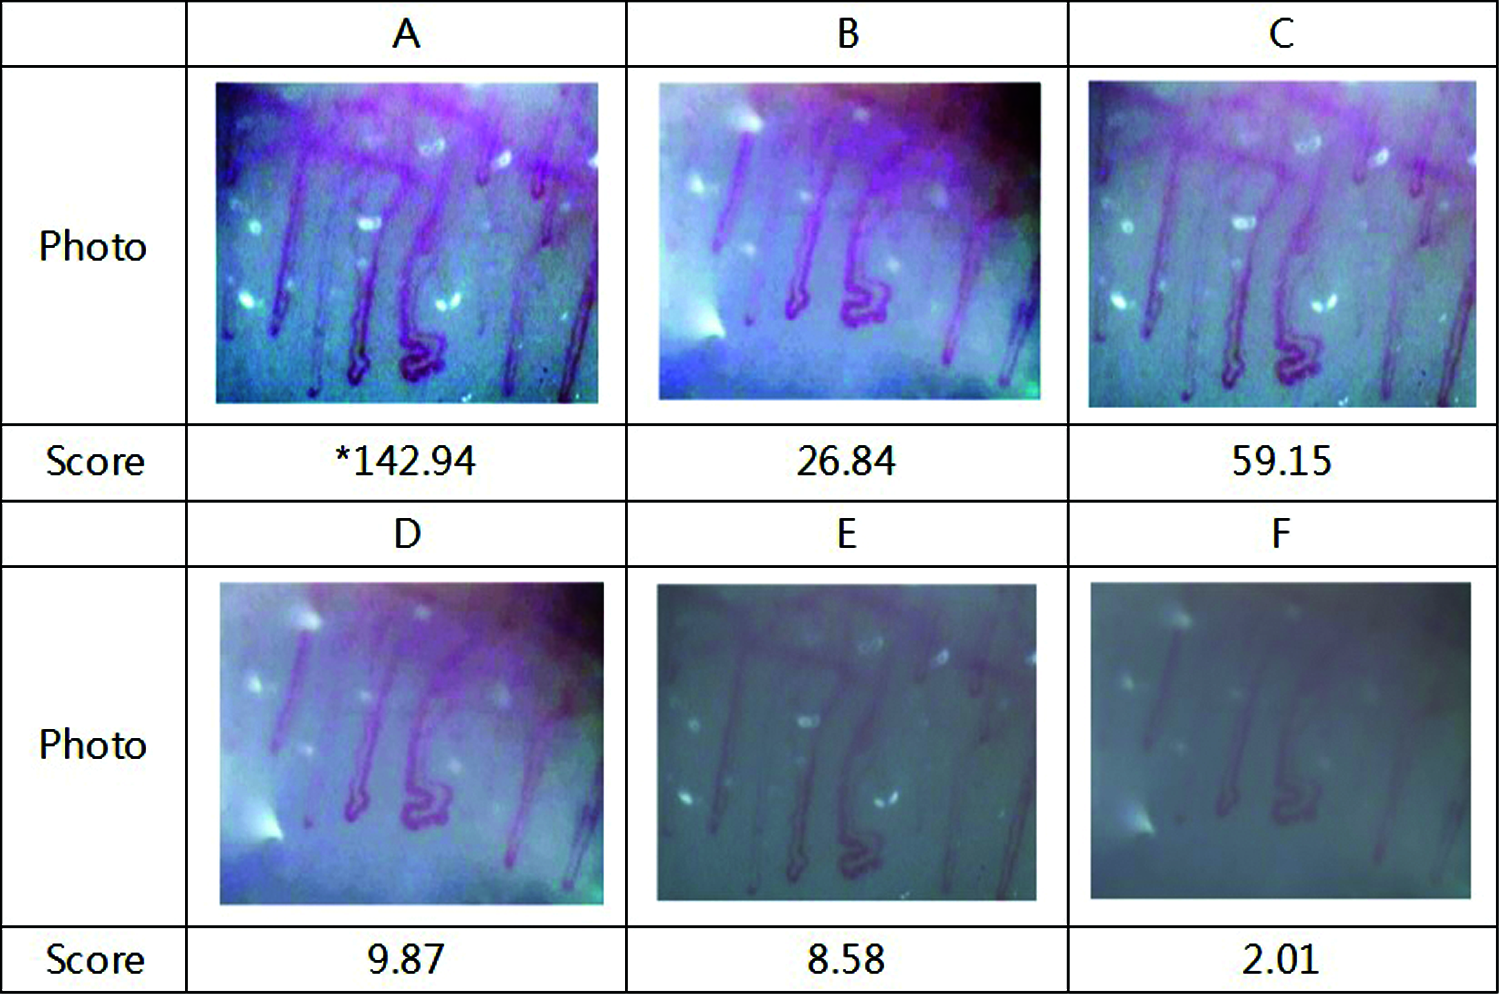
Figure 10: Laplacian score as judging sharp capillary images criterion (“*” indicated the sharpest images)
Deconvolution microscopy has been a primary image processing technique for visualizing the cellular configurations of fixed and living organisms in three dimensions and at sub-resolution scales since its invention in 1983 [43]. The deconvolution method is also mentioned on the official website of Olympus. Deconvolution is an image processing technique used to improve the contrast and resolution of images. It is increasingly used to improve the contrast and resolution of digital images captured in a microscope. Therefore, image deconvolution can improve the clarity of any image. This also helps to reduce product manufacturing costs or research and development costs while meeting the needs of low-level products.
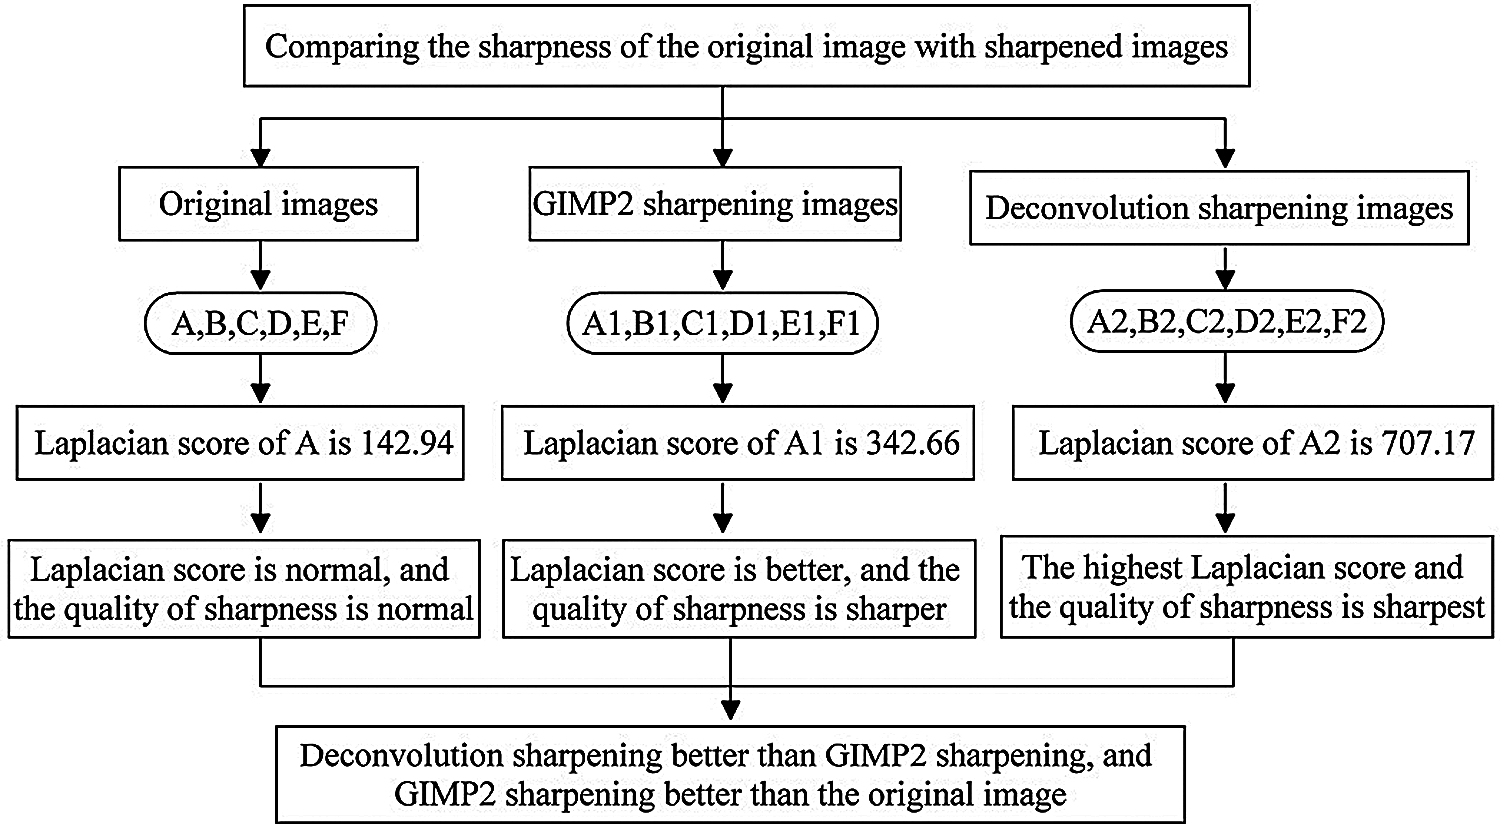
Figure 11: The flow chart of sharpening method
The current investigation compares with the original image, deconvolution sharpening, and GIMP2 sharpness optimization. Still, it may be more meaningful if the test can compare several methods to improve the definition of the image. The time of the deconvolution sharpening process is about 1.65 seconds for one image. This research uses Python to execute the Richardson-Lucy algorithm [44,45]. However, similar functions can be found in other software such as Focus Magic, Blurity, Photoshop, Topaz Infocus, and Gimp2. The flow chart of the sharpening method refers to Fig. 11.
So after completing the design and verification method of low-cost nailfold capillaroscopy in this research. Then we will use two ways to adjust the sharpness include the Gimp2 open-source software sharpening function, and the deconvolution method will be used to improve the sharpness of the image. Finally, the study uses the above-mentioned Laplace operator method to compare the difference with the original picture. The result shows that the image, after using the deconvolution method, its Laplace Score is greater than using the sharpening function of Gimp2 software and the original image. Moreover, the Laplace Score using the sharpening function of the Gimp2 software is greater than the original image. The result is shown in Fig. 12.
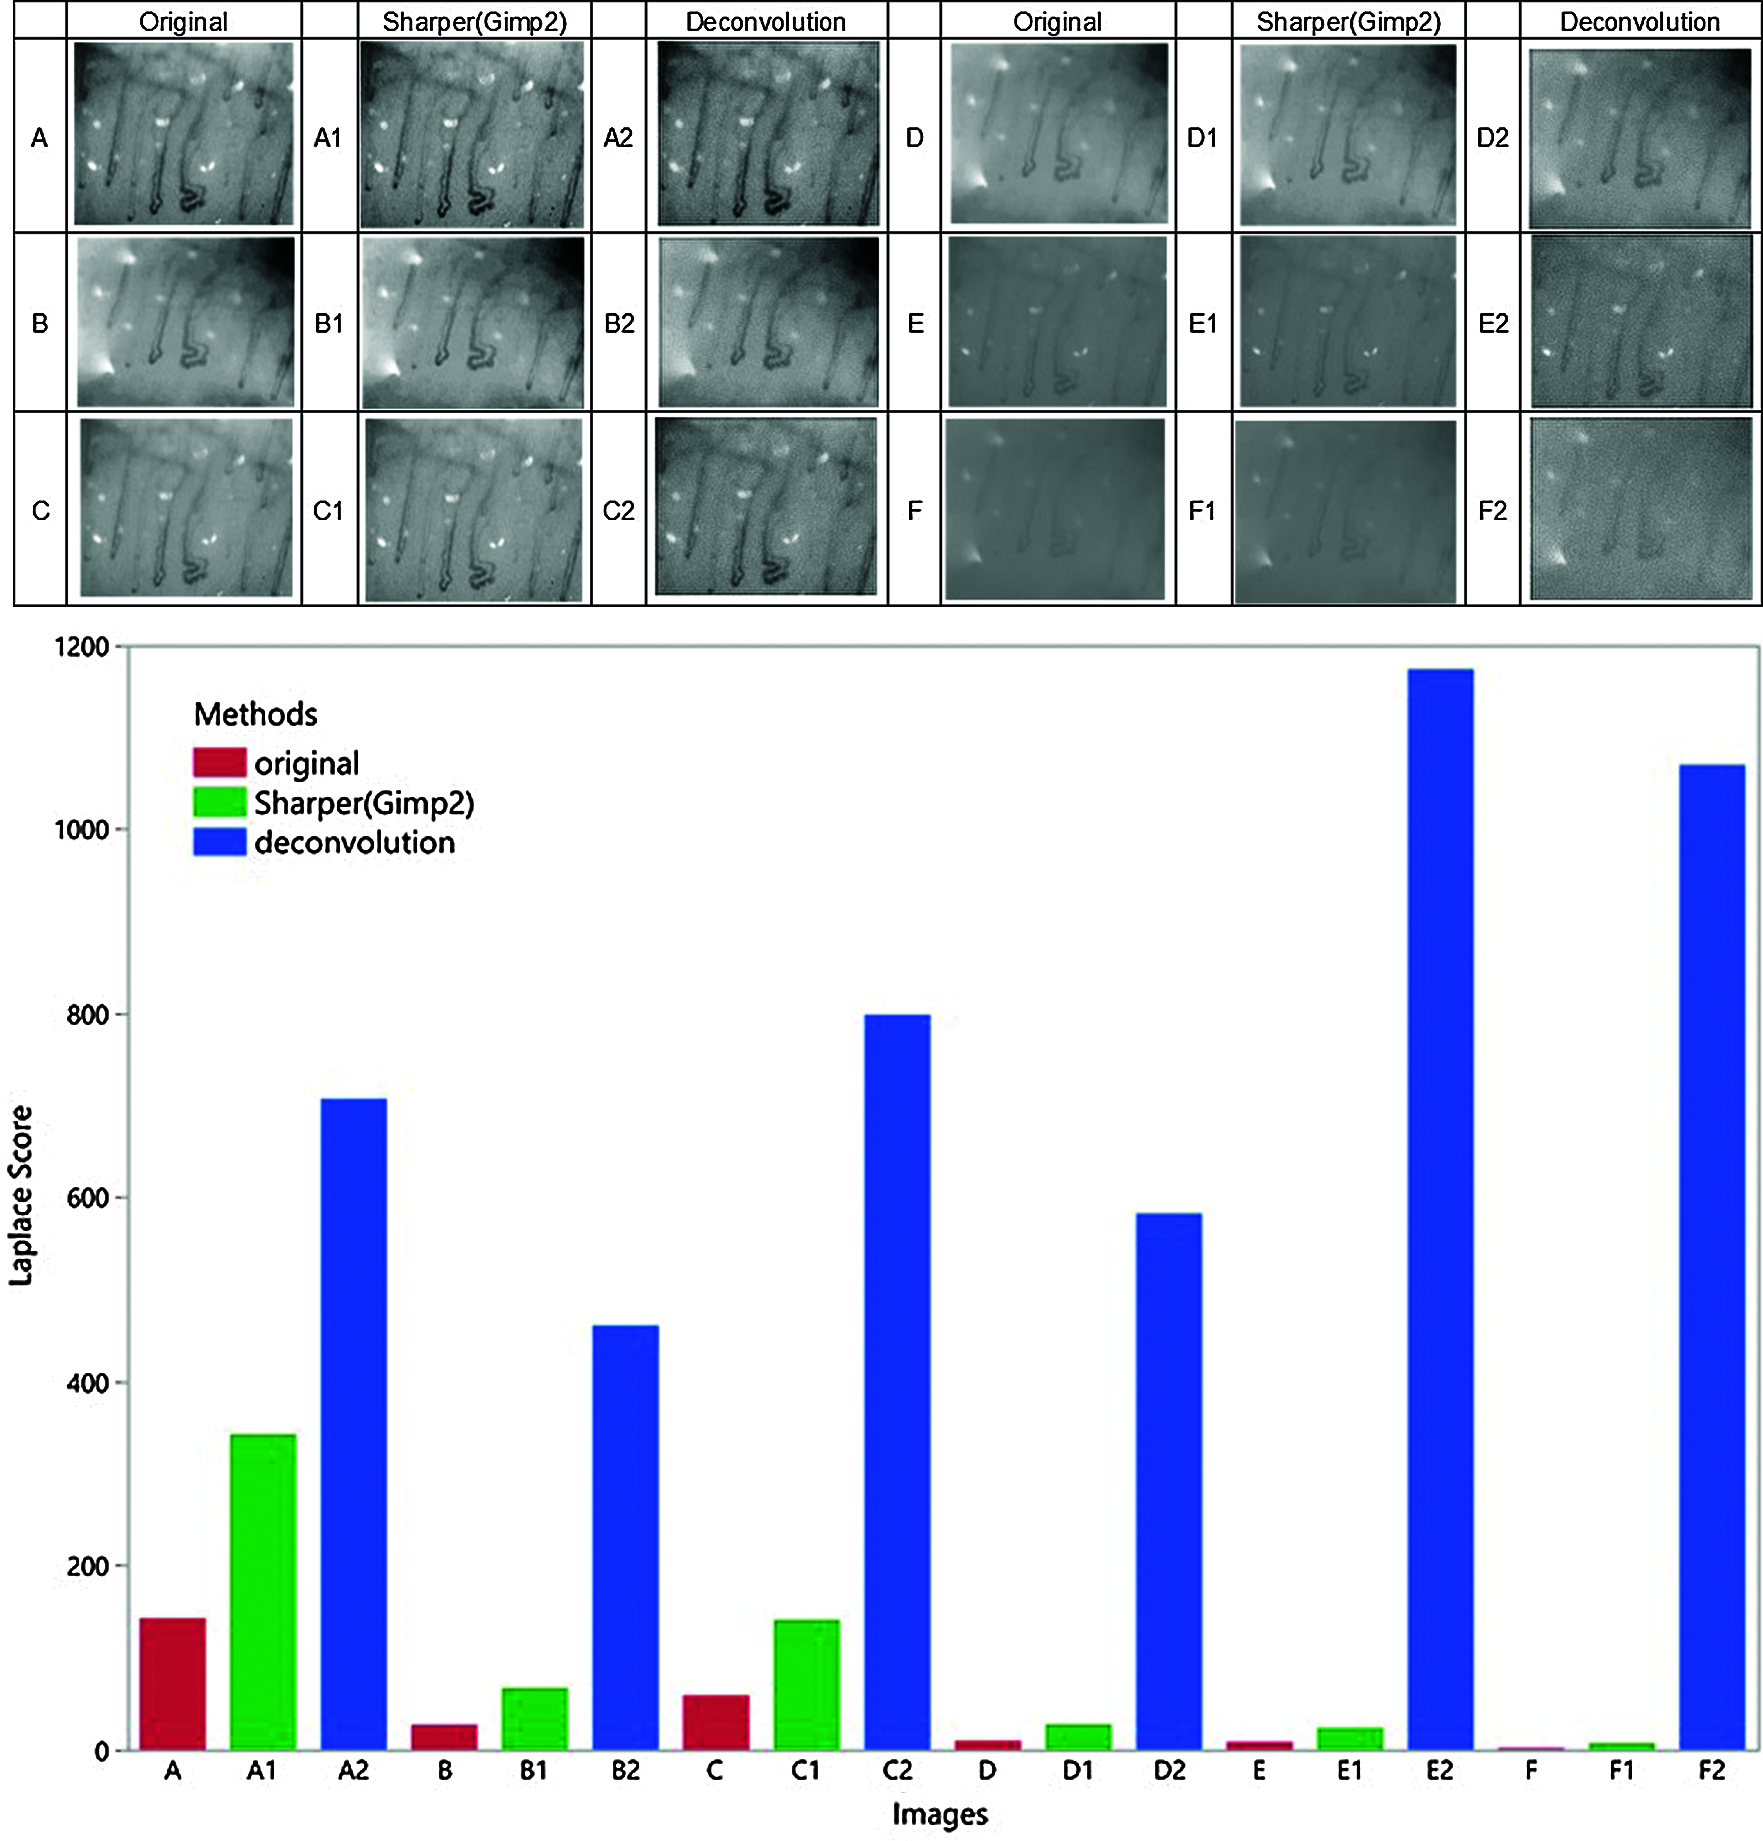
Figure 12: Comparison of sharpening methods and original images
This investigation demonstrated the low-cost NC design, integration, image sharpness estimation, and deconvolution sharpening. Moreover, we also showed evidenced data, indicating the feasibility of completing the verification experiments of image analysis with a low-cost NC device. The investigation shows similar data visualization results regarding the blur detection from both the t-SNE method and the Laplace operator method. The visualization of t-SNE data is presented in a non-linear way, while the Laplacian combined with the statistics has shown linear changes. Both methods have displayed how the stepping motor on the NC drives the lens up and down, thus presenting clear and blurred images.
For follow-up research in the future, if the images demonstrated in this research can be replaced with normal and abnormal nailfold microvascular pattern images, this technology can not only assist in quickly and accurately identifying the clear images that required for remote medical services but also help with the diagnosis of Raynaud’s phenomenon in rural areas of developing countries. With this AI-based low-cost NC technology, the healthcare environment would soon be improved in developing countries’ rural communities, thus realizing the vision of health equity.
Acknowledgement: The authors appreciated Leadtek Research, Inc. for their kind assistance.
Funding Statement: Funding for the present work was provided by MOST, Taiwan under Grant no. 109-2410-H-027-005.
Conflicts of Interest: The authors declare that they have no conflicts of interest to report regarding the present study.
1. E. J. Souza and C. Kayser, “Nailfold capillaroscopy: Relevance to the practice of rheumatology,” Revista Brasileira de Reumatologia, vol. 55, no. 3, pp. 264–271, 2015. [Google Scholar]
2. J. Guo and B. Li, “The application of medical artificial intelligence technology in rural areas of developing countries,” Health Equity, vol. 2, no. 1, pp. 174–181, 2018. [Google Scholar]
3. I. Francesca, G. Roberta, L. Chiara, B. Chiara, G. Marwin et al., “Nailfold capillary patterns in healthy subjects: A real issue in capillaroscopy,” Microvascular Research, vol. 90, no. 2, Suppl. 71, pp. 90–95, 2013. [Google Scholar]
4. M. Wilfred and B. R. Nathan, “Office nail fold capillary microscopy using ophthalmoscope,” Journal of the American Academy of Dermatology, vol. 7, no. 2, pp. 190–193, 1982. [Google Scholar]
5. W. P. Lombard, “The blood pressure in the arterioles, capillaries, and small veins of the human skin,” American Journal of Physiology-Legacy Content, vol. 29, no. 3, pp. 335–362, 1912. [Google Scholar]
6. H. Hofstee, E. Serne, C. Roberts, R. Hesselstrand, A. Scheja et al., “A multicentre study on the reliability of qualitative and quantitative nail-fold videocapillaroscopy assessment,” Rheumatology, vol. 51, no. 4, pp. 749–755, 2012. [Google Scholar]
7. M. Etehad Tavakol, A. Fatemi, A. Karbalaie, Z. Emrani and B. E. Erlandsson, “Nailfold capillaroscopy in rheumatic diseases: Which parameters should be evaluated?,” BioMed Research International, vol. 2015, pp. 974530, 2015. [Google Scholar]
8. A. L. Herrick, G. Dinsdale and A. Murray, “New perspectives in the imaging of Raynaud’s phenomenon, (in eng),” European Journal of Rheumatology, vol. 7, no. Suppl 3, pp. S212–S221, 2020. [Google Scholar]
9. M. E. Anderson, P. D. Allen, T. Moore, V. Hillier, C. J. Taylor et al., “Computerized nailfold video capillaroscopy--a new tool for assessment of Raynaud’s phenomenon,” Journal of Rheumatology, vol. 32, no. 5, pp. 841–848, 2005. [Google Scholar]
10. W. Po-Chang, H. Min-Nung, K. Yu-Min, H. Song-Chou and Y. Chia-Li, “Clinical applicability of quantitative nailfold capillaroscopy in differential diagnosis of connective tissue diseases with Raynaud’s phenomenon,” Journal of the Formosan Medical Association, vol. 112, no. 8, pp. 482–488, 2013. [Google Scholar]
11. A. Karbalaie, Z. Emrani, A. Fatemi, M. Etehadtavakol and B. Erlandsson, “Practical issues in assessing nailfold capillaroscopic images: a summary,” Clinical Rheumatology, vol. 38, no. 9, pp. 2343–2354, 2019. [Google Scholar]
12. M. Hughes, T. Moore, N. O’Leary, A. Tracey, H. Ennis et al., “A study comparing videocapillaroscopy and dermoscopy in the assessment of nailfold capillaries in patients with systemic sclerosis-spectrum disorders,” Rheumatology, vol. 54, no. 8, pp. 1435–1442, 2015. [Google Scholar]
13. N. Mazzotti, M. Bredemeier, C. Brenol, R. Xavier and T. Cestari, “Assessment of nailfold capillaroscopy in systemic sclerosis by different optical magnification methods,” Clinical and Experimental Dermatology, vol. 39, no. 2, pp. 135–141, 2014. [Google Scholar]
14. D. Sage, L. Donati, F. Soulez, D. Fortun, G. Schmit et al., “DeconvolutionLab2: An open-source software for deconvolution microscopy,” Methods, vol. 115, no. 5910, pp. 28–41, 2017. [Google Scholar]
15. V. Smith, S. Beeckman, A. Herrick, S. Decuman, E. Deschepper et al., “An EULAR study group pilot study on reliability of simple capillaroscopic definitions to describe capillary morphology in rheumatic diseases, (in eng),” Rheumatology (Oxford), vol. 55, no. 5, pp. 883–890, 2016. [Google Scholar]
16. M. Gutierrez, C. Bertolazzi, M. Tardella, A. Becciolini, M. Di Carlo et al., “Interreader reliability in assessment of nailfold capillary abnormalities by beginners: pilot study of an intensive videocapillaroscopy training program, (in eng),” Journal of Rheumatology, vol. 39, no. 6, pp. 1248–1255, 2012. [Google Scholar]
17. A. Murray, A. Vail, T. Moore, J. Manning, C. Taylor et al., “The influence of measurement location on reliability of quantitative nailfold videocapillaroscopy in patients with SSc,” Rheumatology (Oxford, England), vol. 51, no. 7, pp. 1323–1330, 2012. [Google Scholar]
18. A. Karbalaie, M. Etehadtavakol, F. Abtahi, A. Fatemi, Z. Emrani et al., “Image enhancement effect on inter and intra-observer reliability of nailfold capillary assessment,” Microvascular Research, vol. 120, no. 2, pp. 100–110, 2018. [Google Scholar]
19. M. Cutolo, A. Trombetta, K. Melsens, C. Pizzorni, A. Sulli et al., “Automated assessment of absolute nailfold capillary number on videocapillaroscopic images: Proof of principle and validation in systemic sclerosis, (in eng),” Microcirculation, vol. 25, no. 4, pp. e12447, 2018. [Google Scholar]
20. A. Karbalaie, F. Abtahi, A. Fatemi, M. Etehadtavakol, Z. Emrani et al., “Elliptical broken line method for calculating capillary density in nailfold capillaroscopy: Proposal and evaluation, (in eng),” Microvascular Research, vol. 113, pp. 1–8, 2017. [Google Scholar]
21. R. Nivedha, M. Brinda, K. Suma and B. Rao, “Classification of nailfold capillary images in patients with hypertension using non-linear SVM,” in Int. Conf. on Circuits, Controls, Communications and Computing (I4CBangalore, India, pp. 1–5, 2016. [Google Scholar]
22. K. V. Suma, K. Indira and B. Rao, “Fuzzy logic based classification of nailfold capillary images in healthy, hypertensive and diabetic subjects,” in 2017 Int. Conf. on Computer Communication and Informatics (ICCCICoimbatore, India, pp. 1–5, 2017. [Google Scholar]
23. M. Berks, P. Tresadern, G. Dinsdale, A. Murray, T. Moore et al., “An automated system for detecting and measuring nailfold capillaries, (in eng),” Med Image Comput Comput Assist Interv, vol. 17, no. Pt 1, pp. 658–665, 2014. [Google Scholar]
24. E. Tsomko, K. Hyoung Joong, P. Joonki and Y. In-Kwon, “Automatic blurry pictures deletion tool for digital cameras,” in 2008 5th Int. Conf. on Visual Information Engineering (VIE 2008Xi'an, China, pp. 198–202, 2008. [Google Scholar]
25. R. Bansal, G. Raj and T. Choudhury, “Blur image detection using Laplacian operator and Open-CV,” in 2016 Int. Conf. System Modeling & Advancement in Research Trends (SMARTMoradabad, India, pp. 63–67, 2016. [Google Scholar]
26. Z. Al-Ameen, S. Al-Ameen and A. Al-Othman, “Improving the sharpness of digital images using a modified laplacian sharpening technique,” IPTEK The Journal for Technology and Science, vol. 29, pp. 44–48, 2019. [Google Scholar]
27. H. Wang and M. Hong, “Distance variance score: An efficient feature selection method in text classification,” Mathematical Problems in Engineering, vol. 2015, pp. 1–10, 2015. [Google Scholar]
28. D. T. Barus, P. H. Gunawan and E. Prakasa, “Macroscopic wood blurred image analysis to determine the factors of causing blur,” in 2020 8th Int. Conf. on Information and Communication Technology (ICoICTYogyakarta, Indonesia, pp. 1–5, 2020. [Google Scholar]
29. O. Marek and J. Norbert, “Fast t-SNE algorithm with forest of balanced LSH trees and hybrid computation of repulsive forces,” Knowledge-Based Systems, vol. 206, pp. 106318, 2020. [Google Scholar]
30. G. Hinton and S. T. Roweis, “Stochastic neighbor embedding,” in NIPS. Vol. 15, Citeseer, pp. 833–840, 2002. [Google Scholar]
31. Binu and G. Sony, “Dimensionality reduction and visualisation of hyperspectral ink data using t-SNE,” Forensic Science International, vol. 311, pp. 110194, 2020. [Google Scholar]
32. G. Andrej, S. Alexander and H. Barbara, “Parametric nonlinear dimensionality reduction using kernel t-SNE,” Neurocomputing, vol. 147, no. 3, pp. 71–82, 2015. [Google Scholar]
33. H. Hotelling, “Analysis of a complex of statistical variables into principal components,” Journal of Educational Psychology, vol. 24, no. 6, pp. 417, 1933. [Google Scholar]
34. W. S. Torgerson, “Multidimensional scaling: I. Theory and method,” Psychometrika, vol. 17, no. 4, pp. 401–419, 1952. [Google Scholar]
35. E. Taskesen and M. J. Reinders, “2D representation of transcriptomes by t-SNE exposes relatedness between human tissues,” PLoS One, vol. 11, no. 2, pp. e0149853, 2016. [Google Scholar]
36. J. Yi, X. Mao, Y. L. Xue and A. Compare, “Facial expression recognition based on t-SNE and adaboostM2,” in 2013 IEEE Int. Conf. on Green Computing and Communications and IEEE Internet of Things and IEEE Cyber, Physical and Social Computing, Beijing, China, pp. 1744–1749, 2013. [Google Scholar]
37. W. Abdelmoula, B. Balluff, S. Englert, J. Dijkstra, M. Reinders et al., “Data-driven identification of prognostic tumor subpopulations using spatially mapped t-SNE of mass spectrometry imaging data,” Proceedings of the National Academy of Sciences of The United States of America, vol. 113, no. 43, pp. 12244–12249, 2016. [Google Scholar]
38. H. Heuer, “Text comparison using word vector representations and dimensionality reduction,” arXiv preprint arXiv: 1607. 00534, 2016. [Google Scholar]
39. L. Van der Maaten and G. Hinton, “Visualizing data using t-SNE,” Journal of Machine Learning Research, vol. 9, no. 11, pp. 2579–2605, 2008. [Google Scholar]
40. L. J. Van Vliet, I. T. Young and G. L. Beckers, “A nonlinear Laplace operator as edge detector in noisy images,” Computer Vision, Graphics, and Image Processing, vol. 45, no. 2, pp. 167–195, 1989. [Google Scholar]
41. D. G. Ullman, Product Generation. In: The mechanical design process. Boston: McGraw-Hill Higher Education (in English2010. [Google Scholar]
42. M. Dombrowski, Imported from image-tsne.ipynb. In: Image t-SNE. Berlin, Berlin, Germany: Nextjournal, 2019. [Online]. Available at: https://nextjournal.com/ml4a/image-t-sne. [Google Scholar]
43. J. B. Sibarita, “Deconvolution microscopy,” Advances in Biochemical Engineering/Biotechnology, vol. 95, pp. 201–243, 2005. [Google Scholar]
44. W. H. Richardson, “Bayesian-based iterative method of image restoration,” JoSA, vol. 62, no. 1, pp. 55–59, 1972. [Google Scholar]
45. L. B. Lucy, “An iterative technique for the rectification of observed distributions,” Astronomical Journal, vol. 79, pp. 745, 1974. [Google Scholar]
 | This work is licensed under a Creative Commons Attribution 4.0 International License, which permits unrestricted use, distribution, and reproduction in any medium, provided the original work is properly cited. |