DOI:10.32604/iasc.2022.021426
| Intelligent Automation & Soft Computing DOI:10.32604/iasc.2022.021426 | |
| Article |
Automated Learning of ECG Streaming Data Through Machine Learning Internet of Things
Department of Networks and Information Security, Faculty of Information Technology, Al-Ahliyya Amman University, Amman, 19328, Jordan
*Corresponding Author: Nidal M. Turab. Email: N.turab@ammanu.edu.jo
Received: 02 July 2021; Accepted: 12 August 2021
Abstract: Applying machine learning techniques on Internet of Things (IoT) data streams will help achieve better understanding, predict future perceptions, and make crucial decisions based on those analytics. The collaboration between IoT, Big Data and machine learning can be found in different domains such as Health care, Smart cities, and Telecommunications. The aim of this paper is to develop a method for automated learning of electrocardiogram (ECG) streaming data to detect any heart beat anomalies. A promising solution is to use medical sensors that transfer vital signs to medical care computer systems, combined with machine learning, such that clinicians can get alerted about patient’s critical condition and act accordingly. Since the probability of false alarms pose serious impact to the accuracy of cardiac arrhythmia detection, it is the most important factor to keep false alarms to the lowest level. The proposed method in this paper demonstrates an example of how machine learning can contribute to health technologies with in detecting heart disease through minimizing negative false alarms. Stages of heartbeat learning model are proposed and explained besides the stages heartbeat anomalies detection stages.
Keywords: Machine learning; heartbeat anomalies; K-means clustering algorithm; T-Digest algorithm
The enormous growth of the IoT sensors leads to a giant amount of sensed data over time for a wide fields of applications. Based on the nature of those applications, the resultant revenue is big data streams. Applying machine learning techniques on IoT data streams will help achieve better understanding, predict future perceptions, and make crucial decisions based on those analytics. That makes IoT a worthy prototype of life improving technology [1].
The collaboration between IoT, big Data and machine learning can be found in different domains such as [2–6]:
• Health care: remote patient monitoring and IoT medical sensors that read vital signs continually.
• Smart cities: effect of seismic forces at work of bridges, traffic patterns and congestion management of highways and foundation subsidence, seismic activity of buildings.
• Production: IoT sensors automatically can monitor development cycles, and manage warehouses as well as records. Optimization and foreseen maintenance.
• Transportation: traffic Management such as smart parking, smart accident assistance.
• Cars: Vehicle to Vehicle (V-V) communication that exchange information about the speed and existence of surrounding vehicles to avoid crashes and easiness traffic congestion.
• Telecommunications: telecommunications companies use IoT in asset management, remote systems monitoring and anomalies detection.
• Retail: IoT is used to enhance supply chain management and smart inventory management.
Machine learning recall that algorithms are used to solve certain problems, based on predefined set of instructions, they organize enormous amounts of data into information and services, while in machine learning, algorithms build a model based on training data and then make predictions or decisions accordingly as illustrated in Fig. 1 [7,8].
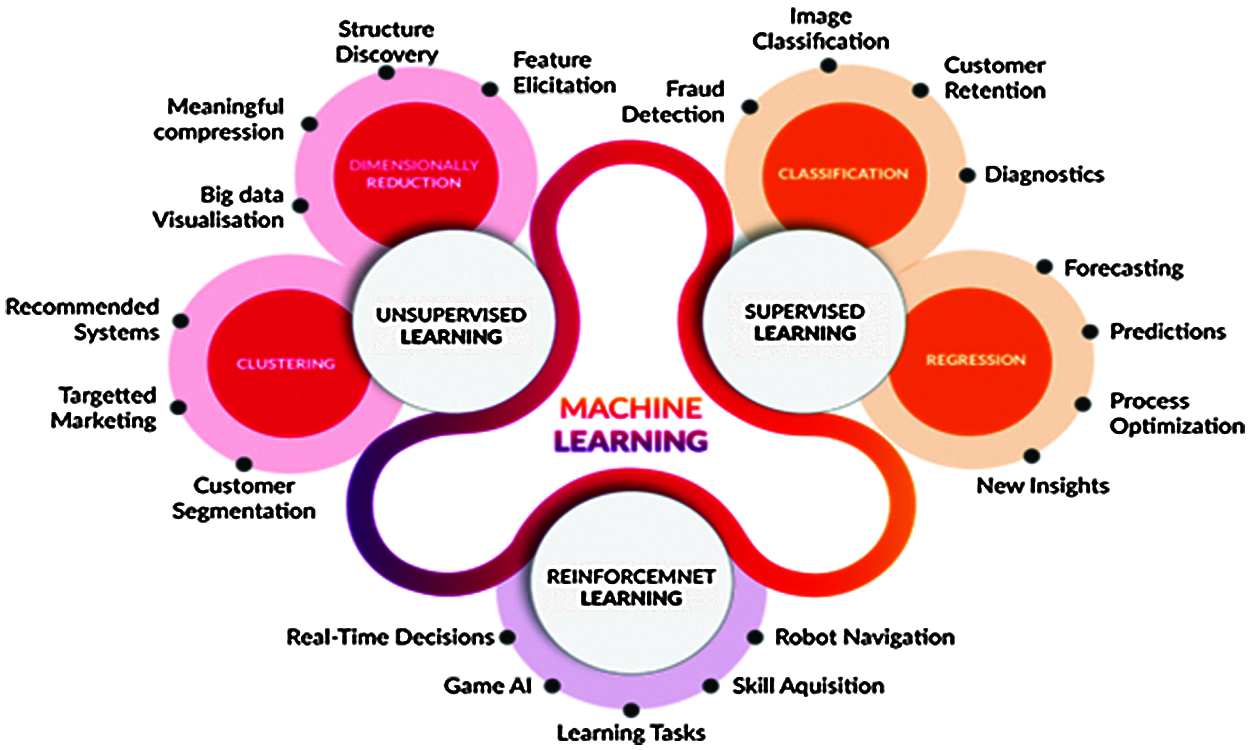
Figure 1: Machine learning
Anomaly detection is the process of finding the outliers of a dataset, and considered as an example of uncontrolled tactic to machine learning [9]. Uncontrolled algorithms find correspondences or patterns in the input data that do not have a label or target result foreseen in advance as shown in Fig. 2C [10]. The first phase of anomaly detection is the recognition or definition of the expected normal behavior. Afterwards, the second phase is the comparison of the normal behavior with the collected or measured behavior, and sequentially the final phase is the creation of alerts if the deviation is significant from the mean. As an example, in the case of heart arrhythmia, the process is started by looking for deviations from the typical readings and then applying this estimate in the near real time.

Figure 2: Different anomaly detection modes. (a) Supervised anomaly detection (b) Semi-supervised anomaly detection (c) Unsupervised anomaly detection
In this paper, we will try to figure out the importance of combination of IoT data, data streaming and machine learning with the intention of providing a helping hand in medical care.
Chronic diseases, such as cardiovascular disease, are the main causes of death, with big concerns of transferring such patients to medical care centers at the appropriate time. A promising solution is to use medical sensors that transfer vital signs to medical care computer systems, combined with machine learning, such that clinicians can get alerted about patient’s critical condition and act accordingly [11].
A deep-learning model was developed by Stanford University researchers, which can detect cardiac arrhythmia on an electrocardiogram (ECG) with accuracy of that of a cardiologist-level. Fig. 3 part (a) shows a portable sensor used to collect 30,000 30-second clips from patients with arrhythmia, while part (b) illustrates the output of Deep-learning algorithm of to identify different types of arrhythmia, collected from the ECG data sources [12].

Figure 3: (a) Portable ECG devices (b) Deep-learning algorithm output data
Heart arrhythmia and other chronic diseases require unplanned severe hospital visits and use. Current evidence examining Remote Patient Monitoring (RPM) can possibly help in reducing expensive severe hospital usage and cost by a considerable amount [13]. Data collected from sensors can be analyzed in real time and while notifications are sent to physicians, who are kept updated for any critical changes in the patient’s health.
However, the probability of false alarms pose serious opposing impact to the accuracy of cardiac arrhythmia detection, it is the most important factor to keep false alarms to the lowest level. A patient in UCSF medical center hardly survived a 39-fold overdose as physicians ignored the alarms since they received too many alarms [14].
Plentiful researches using data mining techniques in the diagnosis of Heart disease have inspired this work, a brief survey is presented here.
Abderrahmane in his research paper proposed a real-time heart disease prediction system based on apache Spark. The proposed system consists of two parts: streaming processing and data storage and visualization. The streaming processing uses Spark MLlib with Spark streaming and a classification model to predict heart disease. The data storage and visualization uses Apache Cassandra for storing the large bulk of generated data [15].
Hlaudi commenced an experiment for predicting heart diseases using various data mining algorithms. The experiment showed that there is no vivid difference in the prediction using different classification algorithms. The analytical accuracy determined by J48, REPTREE and SIMPLE CART algorithms are reliable indicators of heart diseases [16].
Shadman and his team proposed a machine learning technique that was derived from several machine learning algorithms in a Java Based Open Access Data Mining Platform, Waikato Environment for Knowledge Analysis (WEKA). They validated the proposed algorithm using 10-fold cross-validation. They achieved an accuracy, sensitivity and specificity levels of 97.53%, 97.50% and 94.94%, respectively [17].
Aditi’s team developed an application based on machine learning algorithm neural networks which can predict the exposure of heart disease given basic symptoms such as: pulse rate, age, and sex parameters [18].
Experiments were performed by Amin and his team to categorize the performance of various feature selection algorithms. The experiments proved that Super Vector Machine classifier had excellent performance among other classifiers and achieved 86% classification accuracy [19].
Ricardo and his team proposed a heart disease detection method using the Random Forests algorithm, based on clinical data and patient test results. The algorithms showed an overall accuracy of 84.448% when using 10 times cross-validation, while the archived accuracy was 82.895% without the cross validation [20].
Sonam and his colleagues introduced a heart disease prediction system with Naïve Bayes and decision tree classifiers. The analysis showed that the decision tree classifier has better accuracy than naïve Bayes classifier [21].
A good comparison of the different algorithms of Decision Tree classification was held by Jaymin and his team looking for better performance using WEKA. They found that the J48 tree technique is the best classifier [22].
The aim of this paper is to develop a method for automated learning of ECG streaming data to detect any heart beat anomalies. Stages of heartbeat learning model are proposed and explained besides the stages heartbeat anomalies detection stages. The proposed method demonstrates an example of how health technologies can contribute with machine learning in heart disease detection.
3 Building a Model for Typical Heart Rate Activity
The electrocardiogram (ECG) is a plot of electrical impulses vs. time of the electrical of the heart. Heartbeats follow steady pattern (frequency) about 60 to 100 beats per minute. Heartbeat rate anomalies result from atrial fibrillation leading to rapid increases and irregularities (impulses) of heartbeat rate.
In the proposed method, the repetitive readings of heartbeat are used to train a model on normal heart rate. After that, these readings are used to compare successive observations with the model to judge abnormal behavior.
Fig. 6 illustrates the complete flowchart of building representative heart rate activity model. In the first stage, we collect ECG from patient/(s), either from ECG repository or from free ECG data sets such as PTB-XL (freely accessible clinical 12-lead ECG-waveform dataset encompassing 21837 chronicles from 18885 patients) [23]. ECG readings need to be sampled (encoded) in fragments. The sampling rate can be obtained through utilizing the running mean algorithm to compute the running average of the ECG data stream (running mean is a calculation to analyze data points by creating a series of means of different partitions of the full data set). The goal of this stage is to choose a sampling rate that is higher than the running mean of the data. A good starting mean average algorithm is Welford algorithm [24]. In the case of ECG, the running mean of the normal ECG is about 3 samples per second as the normal ECG readings are from 60 to 150 pulses per minute (maximum running mean of 2.5 beats per second). Based on this running mean, ECG is sampled at one third of a second time interval as shown in Fig. 4.
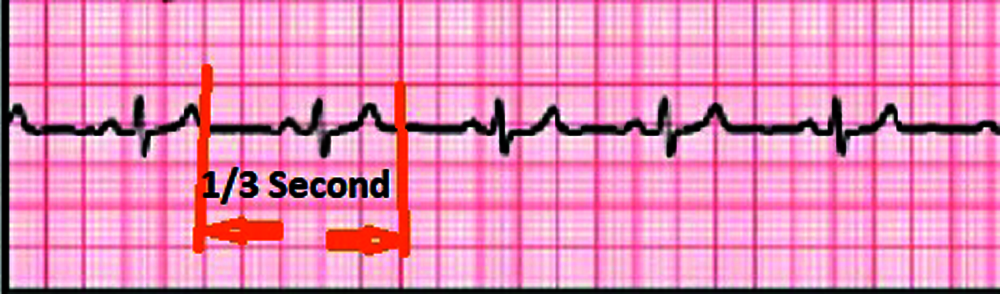
Figure 4: The normal ECG with one third second interval
In the k-means clustering algorithm stage, the algorithm classifies the data from fragments obtained from the encoding (sampling) stage into categories based on similarities between them. The algorithm will next combine observations into k-clusters, with each cluster containing observations with the nearby average from the cluster it belongs to [25]. Fig. 5 illustrates the working principle of the K-means clustering algorithm.
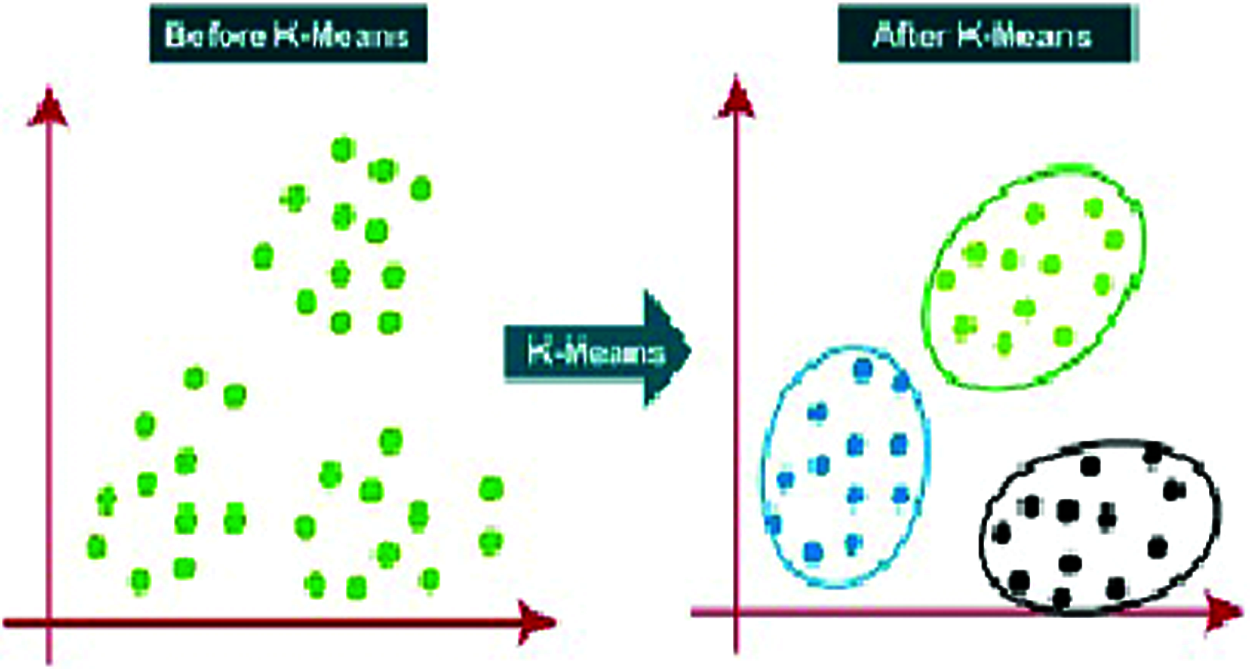
Figure 5: K-means clustering algorithm
After classifying the fragmentations into clusters, they are used to teach the system, i.e., the process of creating the model. The model created is then used to be reconstruct the ECG of any incoming data. Fig. 6 illustrates a flowchart of a building normal ECG Model.
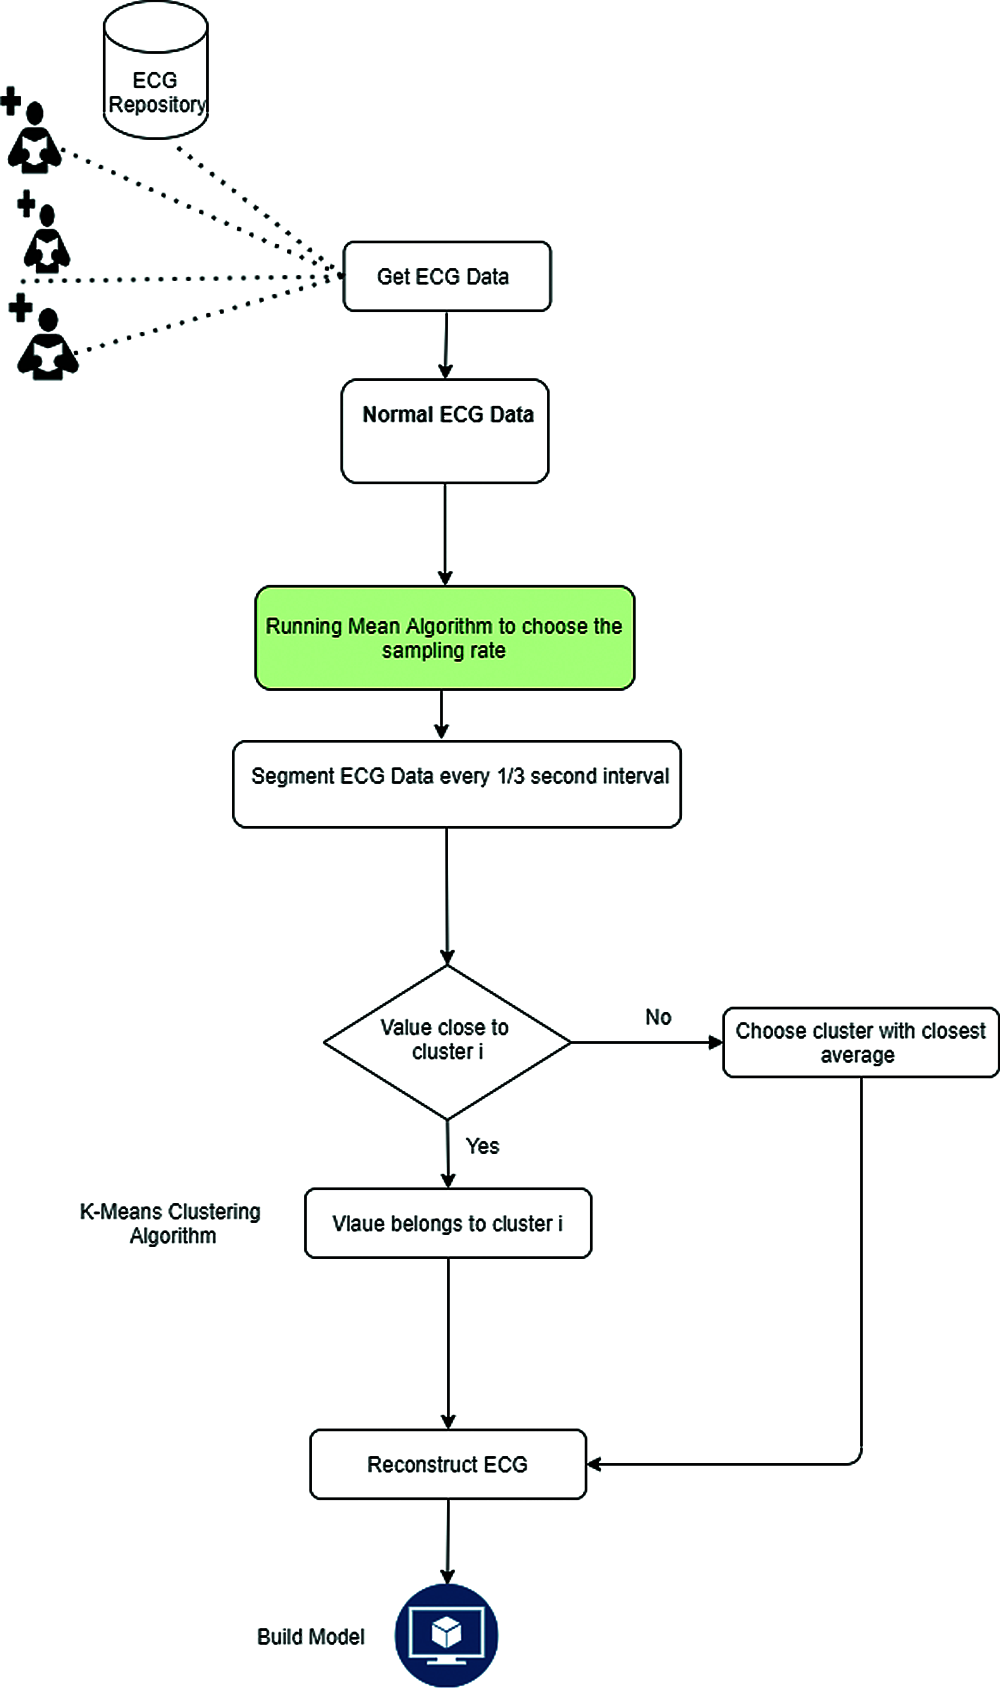
Figure 6: Building ECG model
Heartbeat rate anomalies lead to irregularities (impulses) of heartbeat rate. Hence, the next stage is detecting anomalies, i.e., the irregularities in upcoming ECG readings. Starting at getting patient’s ECG data, the running mean algorithm will choose the sampling rate and the k-means clustering algorithm will classify the data from fragments obtained from encoding (sampling) stage into categories based on similarities between them. The ECG readings are consequently reconstructed.
To find residues in the reconstructed ECG, T-Digest algorithm is used compare it with normal behavior in the model. The T-digest is an algorithm that estimates quantiles from a solid sketch [26]. In this anomaly detection, the threshold of T-Digest is set to 99.9% quantile; this means that any anomalies less than 0.1% of anomalies in the ECG data is considered as normal and will be helpful in minimizing negative false alarms. Any anomalies above 0.1% would be regarded as a symptom of heart arrhythmia and will thus trigger an alarm. The anomalies detection procedure is shown in Fig. 7.
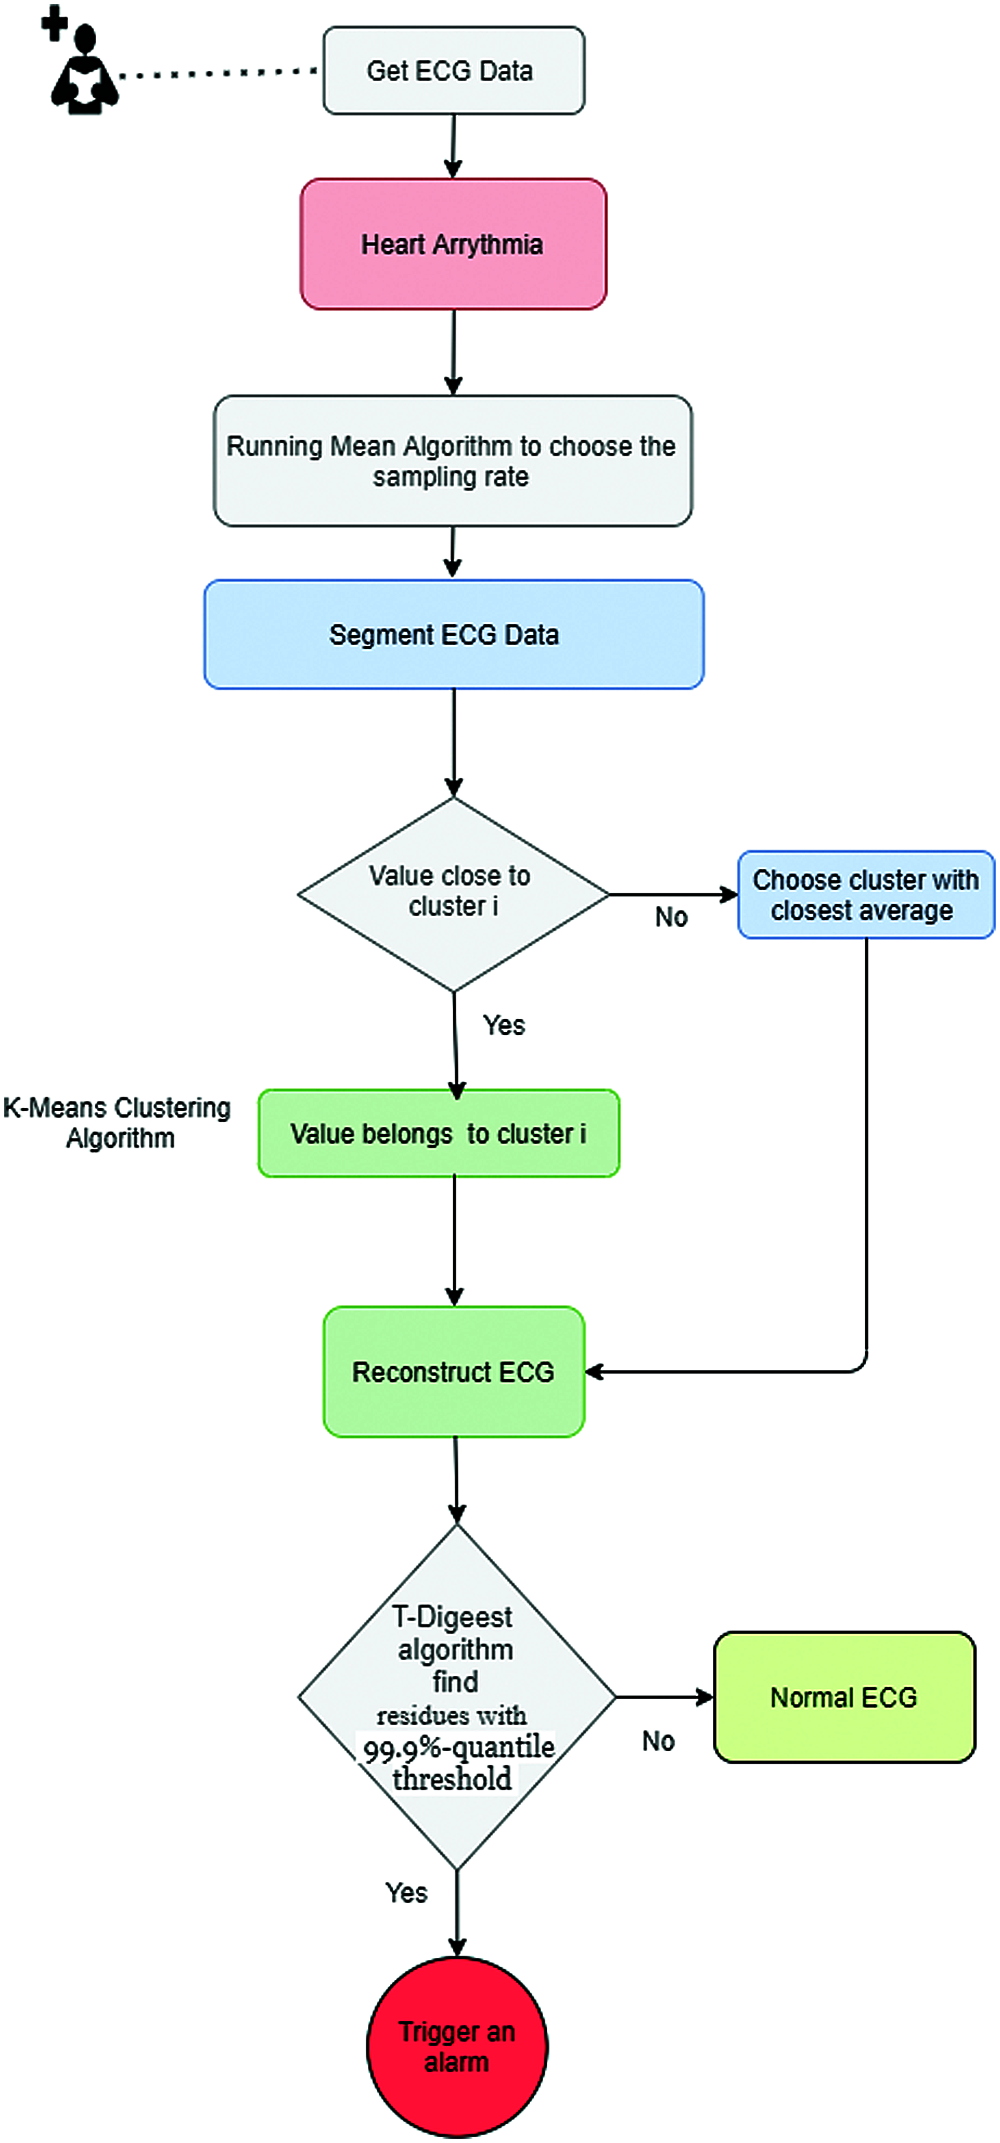
Figure 7: Anomalies detection
This paper proposed an integration of machine learning and IoT streaming system to detect heart disease by monitoring heartbeat data. Our proposed model aims at automating the ECG data learning process in order to detect any heart beat anomalies. This proposed method takes in the repetitive readings of normal heart rate heartbeat, often from ECG repository or from free ECG data sets such as PTB-XL. Those readings are later used to create the heart rate model representing normal heart beat rate.
ECG will be sampled at one third of a second time interval to best achieve 3 samples per second, as the normal ECG readings are from 60 to 150 pulses per minute. With k-means clustering algorithm, the data from fragments obtained from the encoding (sampling) stage is classified into categories based on similarities between them, building the basis of the teaching process of our proposed model. After that, these readings are used to compare successive observations with the model to detect and judge abnormal behavior, and the ECG readings are consequently reconstructed. The system compares patient’s signals in the framework of stored repository to detect asymmetrical heartbeats in real time.
To find residues in the reconstructed ECG, the threshold of T-Digest algorithm is set to 99.9% quantile; this means that any anomalies less 0.1% of anomalies in the ECG data is considered as normal and will be helpful in minimizing negative false alarms. With such a threshold, it is guaranteed that only anomalies above 0.1% would be considered a symptom of heart arrhythmia and will trigger an alarm.
Funding Statement: The authors received no specific funding for this study.
Conflicts of Interest: The authors declare that they have no conflicts of interest to report regarding the present study.
1. M. Mohammadi, A. Al-Fuqaha, S. Sorour and M. Guizani, “Deep learning for IoT big data and streaming analytics: A survey,” IEEE Communications Surveys & Tutorials, vol. 20, no. 4, pp. 2923–2960, 2018. [Google Scholar]
2. H. Tran-Dang, N. Krommenacker, P. Charpentier and D. Kim, “Toward the Internet of Things for physical Internet: Perspectives and challenges,” IEEE Internet of Things Journal, vol. 7, no. 6, pp. 4711–4736, 2020. [Google Scholar]
3. I. Machorro-Cano, G. Alor-Hernández, M. Paredes-Valverde, L. Rodríguez-Mazahua, J. Sánchez-Cervantes et al., “HEMS-IoT: A big data and machine learning-based smart home system for energy saving,” Energies, vol. 13, no. 5, pp. 1097–1121, 2020. [Google Scholar]
4. M. Syafrudin, G. Alfian, N. Fitriyani and J. Rhee, “Performance analysis of IoT-based sensor, big data processing, and machine learning model for real-time monitoring system in automotive manufacturing,” Sensors, vol. 18, no. 9, pp. 2946–2970, 2018. [Google Scholar]
5. A. Onal, O. Sezer, M. Ozbayoglu and E. Dogdu, “Weather data analysis and sensor fault detection using an extended IoT framework with semantics, big data, and machine learning,” in IEEE Int. Conf. on Big Data (Big DataBoston, USA, pp. 2037–2046, 2017. [Google Scholar]
6. B. Qolomany, A. Al-Fuqaha, A. Gupta, D. Benhaddou, S. Alwajidi et al., “Leveraging machine learning and big data for smart buildings: A comprehensive survey,” IEEE Access, vol. 7, pp. 90316–90356, 2019. [Google Scholar]
7. M. Fatima and M. Pasha, “Survey of machine learning algorithms for disease diagnostic,” Journal of Intelligent Learning Systems and Applications, vol. 9, no. 1, pp. 1–16, 2017. [Google Scholar]
8. D. Dhall, R. Kaur and M. Juneja, “Machine learning: A review of the algorithms and its applications,” in Proc. of ICRIC 2019, Jammu, India, pp. 47–63, 2020. [Google Scholar]
9. S. Eltanbouly, M. Bashendy, N. AlNaimi, Z. Chkirbene and A. Erbad, “Machine learning techniques for network anomaly detection: A survey,” in 2020 IEEE Int. Conf. on Informatics, IoT, and Enabling Technologies (ICIoT, Doha, Qatar, pp. 156–162, 2020. [Google Scholar]
10. M. Goldstein and S. Uchida, “A comparative evaluation of unsupervised anomaly detection algorithms for multivariate data,” PLOS One, vol. 11, no. 4, pp. e0152173, 2016. [Google Scholar]
11. S. Somani, A. Russak, F. Richter, S. Zhao, A. Vaid et al., “Deep learning and the electrocardiogram: Review of the current state-of-the-art,” EP Europace, vol. 23, no. 8, pp. 1–31, 2021. [Google Scholar]
12. W. Knight, “The machines are getting ready to play doctor,” 2017. [Online]. Available: https://synergycap1.com/the-machines-are-getting-ready-to-play-doctor/. [Google Scholar]
13. M. Taylor, E. Thomas, C. Snoswell, A. Smith and L. Caffery, “Does remote patient monitoring reduce acute care use? A systematic review,” BMJ Open, vol. 11, no. 3, pp. e040232, 2021. [Google Scholar]
14. P. Salber, “Watcher’s Digital Doctor explores the dark side of health IT,” Mhealth, vol. 1, no. 18, pp. 1–3, 2015. [Google Scholar]
15. A. Ed-Daoudy and K. Maalmi, “Real-time machine learning for early detection of heart disease using big data approach,” in Int. Conf. on Wireless Technologies, Embedded and Intelligent Systems (WITSFEZ, Morocco, pp. 1–5, 2019. [Google Scholar]
16. K. M. Almustafa, “Prediction of heart disease and classifiers’ sensitivity analysis,” BMC Bioinformatics, vol. 21, no. 1, pp. 242, 2020. [Google Scholar]
17. S. Nashif, M. Raihan, M. Islam and M. Imam, “Heart disease detection by using machine learning algorithms and a real-time cardiovascular health monitoring system,” World Journal of Engineering and Technology, vol. 06, no. 04, pp. 854–873, 2018. [Google Scholar]
18. A. Gavhane, G. Kokkula, I. Pandya and K. Devadkar, “Prediction of heart disease using machine learning,” in Second Int. Conf. on Electronics, Communication and Aerospace Technology (ICECACoimbatore, India, pp. 1275–1278, 2018. [Google Scholar]
19. A. Haq, J. Li, J. Khan, M. Memon, S. Parveen et al., “Identifying the predictive capability of machine learning classifiers for designing heart disease detection system,” in 16th Int. Computer Conf. on Wavelet Active Media Technology and Information Processing, Chengdu, China, pp. 130–138, 2019. [Google Scholar]
20. R. Buettner and M. Schunter, “Efficient machine learning based detection of heart disease,” in IEEE Int. Conf. on E-health Networking, Application & Services (HealthComBogotá, Colombia, pp. 1–6, 2019. [Google Scholar]
21. S. Nikhar and A. Karandikar, “Prediction of heart disease using machine learning algorithms,” International Journal of Advanced Engineering, Management and Science, vol. 2, no. 16, pp. 214–220, 2016. [Google Scholar]
22. J. Patel, D. TejalUpadhyay and S. Patel, “Heart disease prediction using machine learning and data mining technique,” Heart Disease, vol. 7, no. 1, pp. 129–137, 2015. [Google Scholar]
23. P. Wagner, N. Strodthoff, R. Bousseljot, D. Kreiseler, F. Lunze et al., “PTB-XL, a large publicly available electrocardiography dataset,” Scientific Data, vol. 7, no. 1, pp. 1–15, 2020. [Google Scholar]
24. A. Efanov, S. Ivliev and A. Shagraev, “Welford’s algorithm for weighted statistics,” in 3rd Int. Youth Conf. on Radio Electronics, Electrical and Power Engineering (REEPEMoscow, Russia, pp. 1–5, 2021. [Google Scholar]
25. A. K. P. Sinaga and M. S. Yang, “Unsupervised K-means clustering algorithm,” IEEE Access, vol. 8, pp. 80716–80727, 2020. [Google Scholar]
26. T. Dunning, “The T-digest: Efficient estimates of distributions,” Software Impacts, vol. 7, no. 1, pp. 100049, 2021. [Google Scholar]
 | This work is licensed under a Creative Commons Attribution 4.0 International License, which permits unrestricted use, distribution, and reproduction in any medium, provided the original work is properly cited. |