DOI:10.32604/iasc.2022.021538
| Intelligent Automation & Soft Computing DOI:10.32604/iasc.2022.021538 | |
| Article |
Video Surveillance-Based Urban Flood Monitoring System Using a Convolutional Neural Network
1Department of Computer Science, King Khalid University-Sarat Abidha Campus, Abha, Saudi Arabia
2Department of Computer Engineering, King Khalid University, Abha, Saudi Arabia
*Corresponding Author: R. Dhaya. Email: dambika@kku.edu.sa
Received: 06 July 2021; Accepted: 07 August 2021
Abstract: The high prevalence of urban flooding in the world is increasing rapidly with the rise in extreme weather events. Consequently, this research uses an Automatic Flood Monitoring System (ARMS) through a video surveillance camera. Initially, videos are collected from a surveillance camera and converted into video frames. After converting the video frames, the water level can be identified by using a Histogram of oriented Gradient (HoG), which is used to remove the functionality. Completing the extracted features, the frames are enhanced by using a median filter to remove the unwanted noise from the image. The next step is water level classifiers using a Convolutional Neural Network (CNN), which is utilized to classify the water level in the images. The performance analysis of the method is analyzed by various parameters. The accuracy of the proposed method is 11% higher than that of the k-Nearest Neighbors (KNN) classifiers and 5% higher than that of the ANN classifiers, and the processing time is 7% less than that of the KNN classifiers and 4% less than that of the Artificial Neural Network (ANN) classifiers.
Keywords: Convolutional neural network; histogram of oriented gradient; automatic flood monitoring system; median filter
Natural catastrophes such as landslides, hurricanes, typhoons and others pose a significant risk to life and property worldwide [1,2]. Floods are the most common natural disasters, accounting for 41% of all-natural hazards that have arisen worldwide during the past decade [3]. Therefore, these estimates only account for “reported” large-scale flooding events, generally considered to be outpouring [4]. A flood that severely interacts with human and social activities; however, floods are usually caused by the presence of water in arid areas [5]. The value of flood forecasting cannot be overstated given the growing complexity of rising sea levels and the number of people living in flood-prone situations [6]. Major catastrophes, such as earthquakes, have negative effects, such as collateral damage, and financial disruption, that cannot be prevented, but thorough preparation should minimize the calamitous consequences [7]. According to these findings, it is impossible to include details on watercourse ailment, forms of flooding, etc. [8]. This results in vast amounts of water, even more than can be handled by the natural or man-made conveyance method [9]. Therefore, it is necessary to implement first, a final flood detection, warning and response system that can forecast more accurately and reliably [10].
In 2020, Zakaria et al. [11] analyzed a flood monitor, prediction and rescue (FMPR) system. Centred on the abstractions of management. Gaia role model-based agent functions were defined, standard expression-based existence properties were specified, and predicate-based security properties were specified. In 2015, Kamilaris et al. [12] generated the test plan, installation and subsequent analysis of the SMS. At the request of users, water flow elevation notifications are sent via SMS. When the water flow exceeds a user-defined threshold, the device offers timely updates and warnings via SMS to fragile populations and relevant agencies. In 2019, Senthilnath et al. [13] presented a flood monitoring analysis based on SMAP. The outcome shows that, based on SWAP results, the flood region can be mirrored, and H emission data are more adaptive to V polarization data. Muhadi et al. [14] developed a model of a real-time flood water level tracking device using Arduino Uno. The first test tested the total amount of time; the second test determined whether the machine should use three LEDs as its early warning mechanism to alert people from afar. In 2015, Menon et al. [15] proposed that the surface water transformation identity is a combination of image features. Subsequently, to retrieve and map the described modifications, an ANN support vector machine (SVM) and maximum probability (ML) classification techniques were used.
This section describes video surveillance-based identification of the water level by using CNN classifiers. Here, the video sequences are collected from a video surveillance camera, and the video sequences are converted into video frames. After that, the HoG is utilized to extract the video frames, and median filters are applied to the extracted frames. After finishing the enhancement process, CNN classifiers are used to identify the water level. The structure of the method is given in Fig. 1. The median filter is a non-linear digital filtering method for removing noise from images and signals. This type of background subtraction is a common pre-processing step used to combine the reliability of image acquisition. Sliding a window over the images accomplishes the median data processing. The filtered image is created by taking the median of the variables in the input window and inserting it in the source images at the middle of that frame.
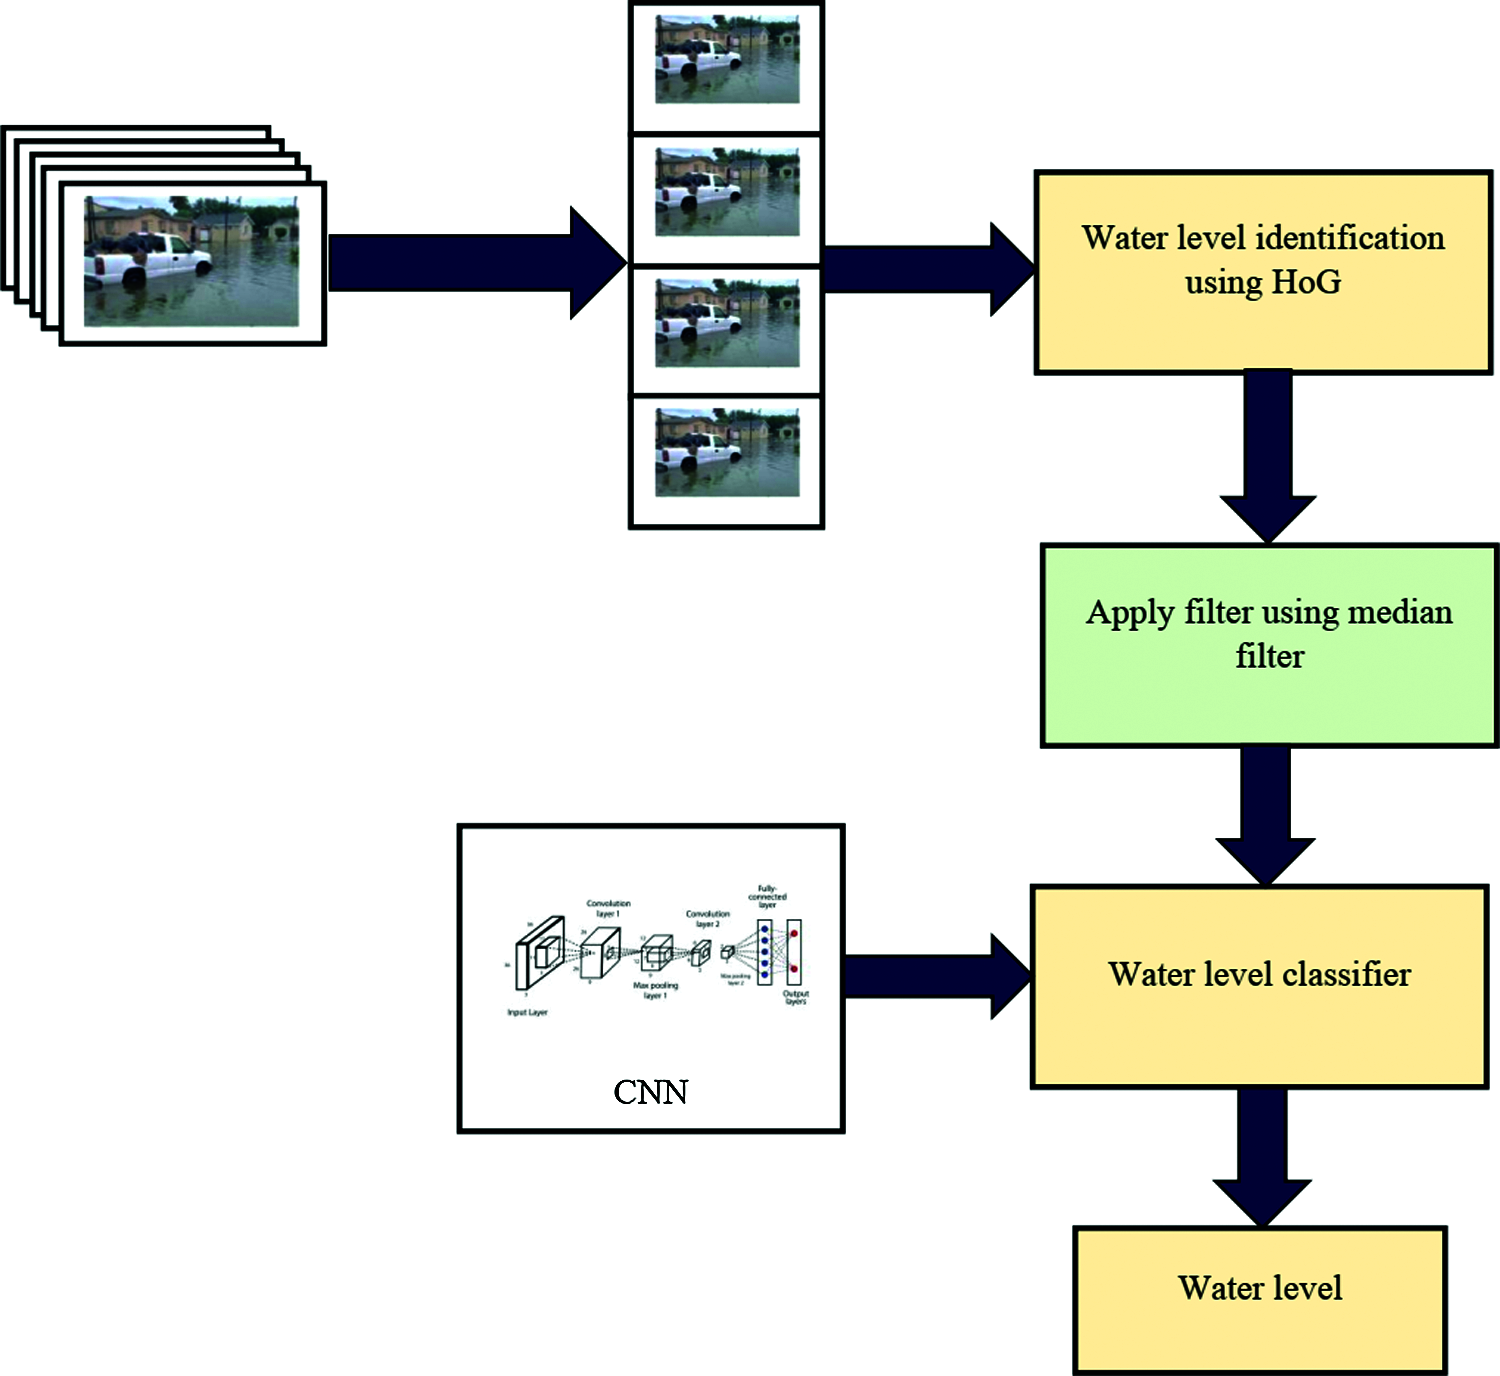
Figure 1: Overall diagram of the proposed method
2.1 Histogram of Oriented Gradients (HoG)
The HoG descriptor is based on the aggregation of the gradient path over the pixel of the limited geographic region known as the ‘node’ and the subsequent creation of a 1D graph. Let lD be a function of intensity (grey scale) outlining the picture to be analyzed. The image is divided into M-M pixel cells, and the orientation of the gradient in each pixel is computed as:
Consecutively, the orientations
Fig. 2 represents the HoG feature recovery process, and the images are classified as M × M pixels. All pixel orientations are calculated and stored in an alignment histogram of N-bins. Finally, the histograms are standardized to create the final vector of characteristics.
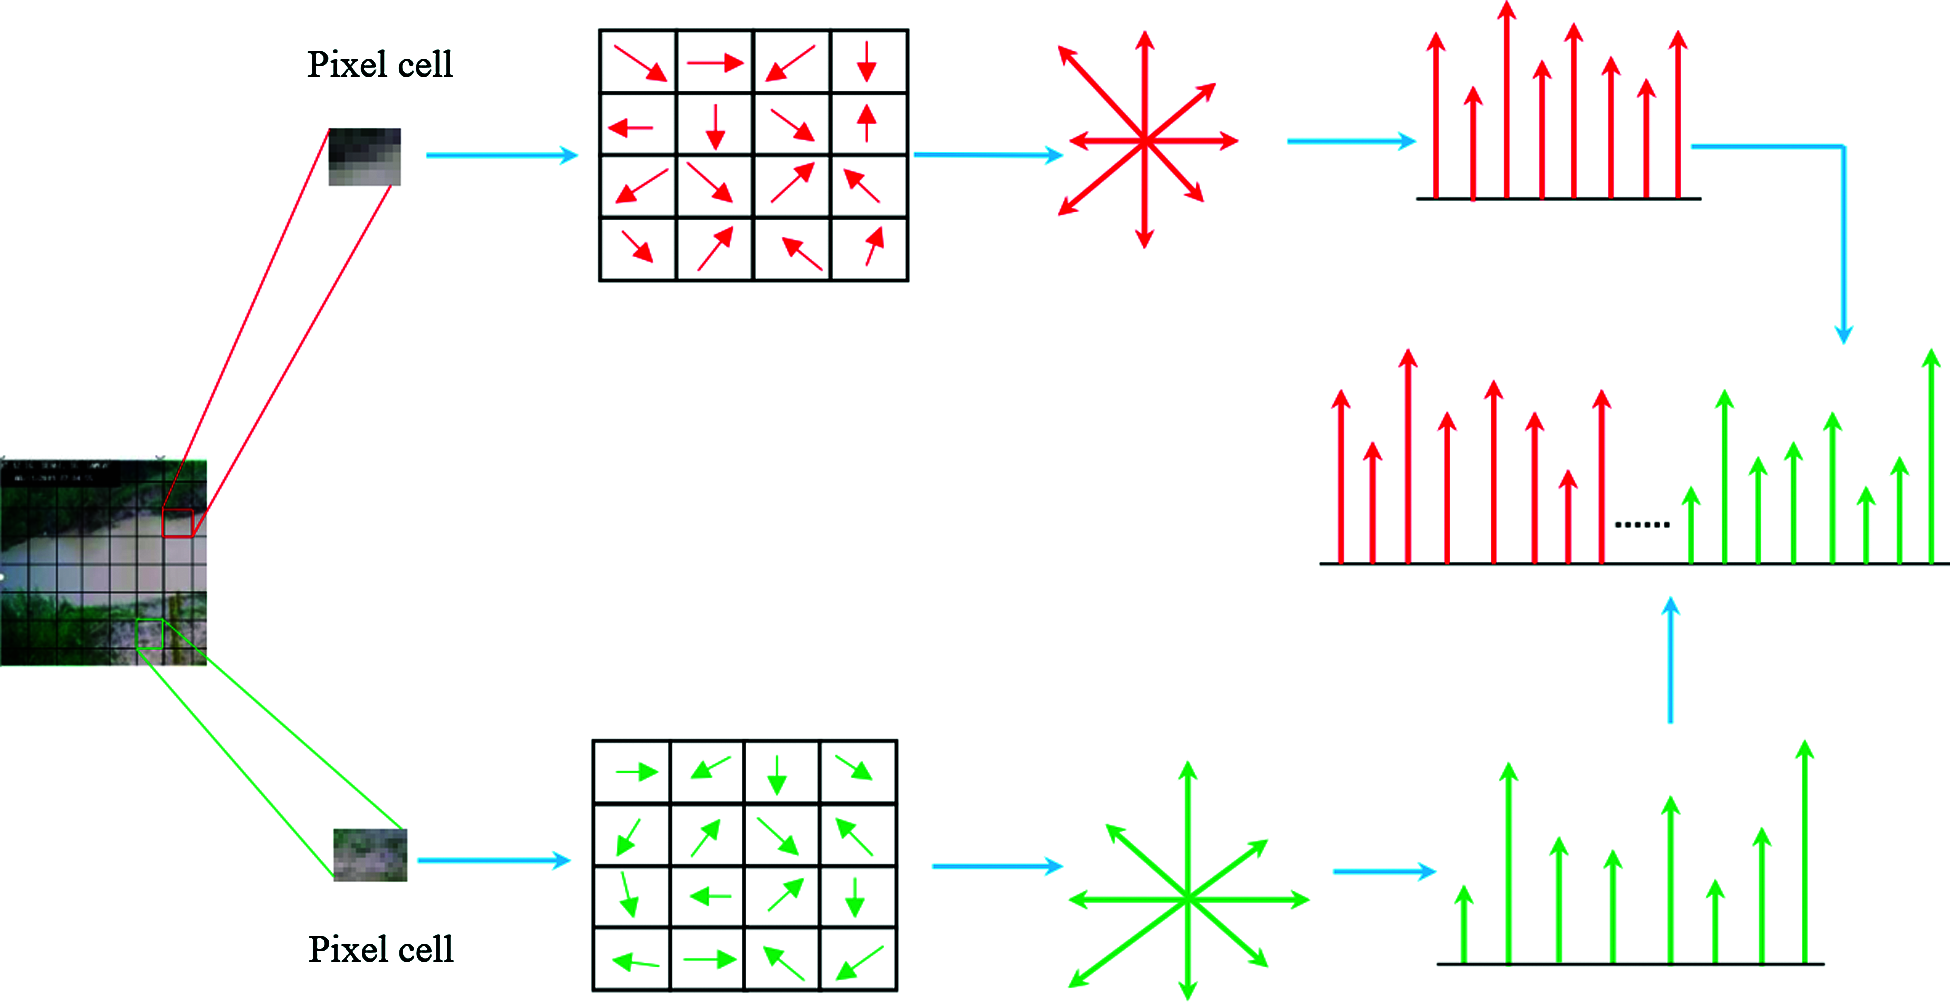
Figure 2: HoG process
2.2 Noise Reducing Performance of the Median Filter
In the case of a picture with normal distribution variance under sample data, the standard deviation is given below:
where
After removing the unwanted noise in the images, the water level is classified by using a CNN. The Structure of the CNN is given in Fig. 3.
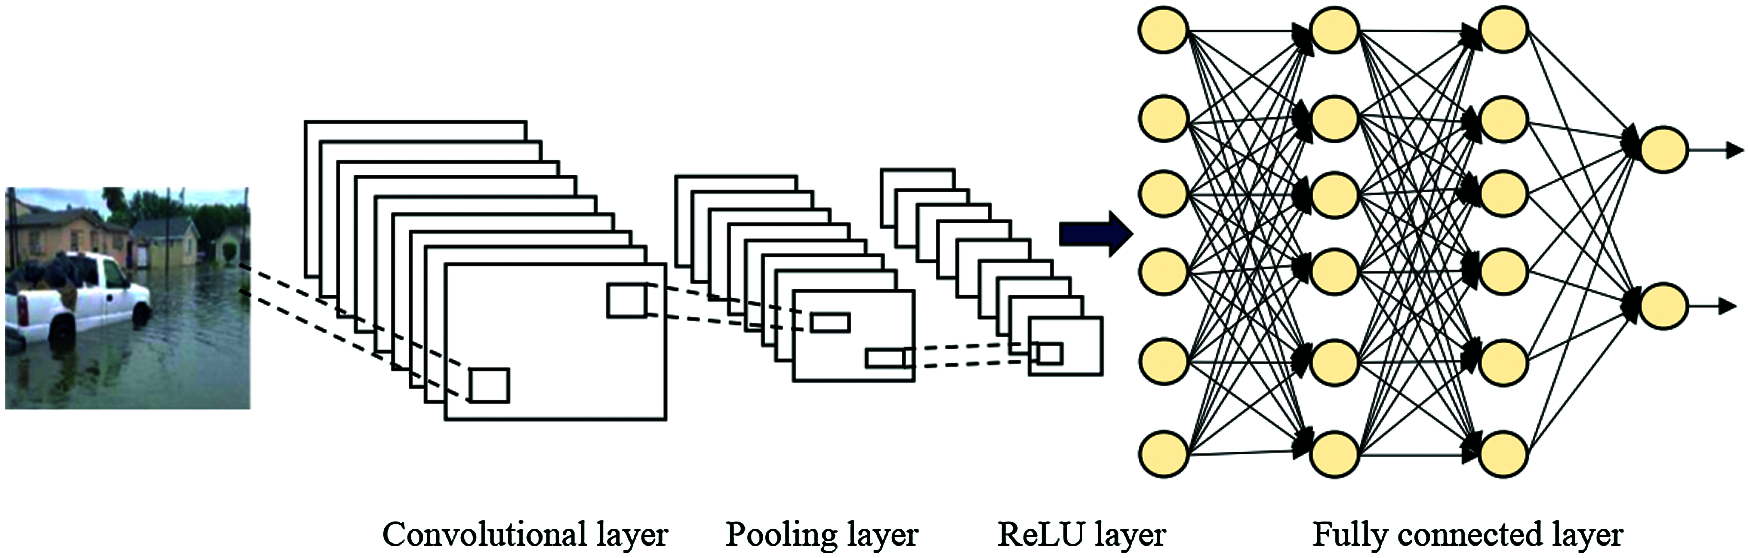
Figure 3: Structure of the CNN
2.3 Convolutional Neural Network
Convolutional layer: A convolutional operation is applied to the input by moving the effects to the next layer. It converts all the pixels in its receptive field into a single value. Let fk be the n-mapped filter of the kernel size [17]. The number of input connections of each neuron is defined by n*m and the resulting output of the layer measurements is given below:
To measure a richer and more diverse representation of the input, several fk filters with k∈M can be added to the input. fk is realized by exchanging the weights of the adjacent neurons [18].
Max pooling: This is a mixture mechanism that determines the optimal values to eliminate feedback by adding the full function to the xi input. Let n be the filter size; then, the output is calculated as follows:
Rectified linear unit: As a way, using ReLU means avoiding the fast increase of the compute needed to run the neural network. The higher complexity of introducing more ReLUs velocity is increased as the capacity of the CNN grows. In practice, the ReLU operational amplifier is used immediately following a convolution layer, and the result is then maximally aggregated. In multi-layer neural networks or deep neural networks, ReLu is a non-linear training process. The following is a representation of this structure: wherein x is an input value. The largest value between zero and the input value is ReLu's output. ReLU is a neural network cell that utilizes the following activation function to measure its output given x [19]:
Using cells is more powerful than using perception cells and provides more information than binary units.
Fully connected layer: The input to the fully connected layer is the output from the final pooling, which is flattened and then fed into the fully connected layer [20]. These results in a matrix are as follows,
Output layer: The output layer in a CNN, as mentioned previously, is a fully connected layer, where the input from the other layers is flattened and sent to transform the output into the number of classes as desired by the network [21]. The output vector x is:
Softmax layer: The softmax function is a function that turns a vector of K real values into a vector of K real values that sum to 1 [22]. For this reason, it is usual to append a softmax function as the final layer of the NN.
For each component 1 ≤ j ≤ M, the output is calculated as follows:
In this section, photographs were taken by surveillance cameras mounted along the water. Various images are shown in Fig. 4, one image under standard conditions and the other under overflowing conditions were used to analyze the practicality of each picture [23]. The photographs had a resolution of 1270 × 620, and the ground reality images were segmented manually.
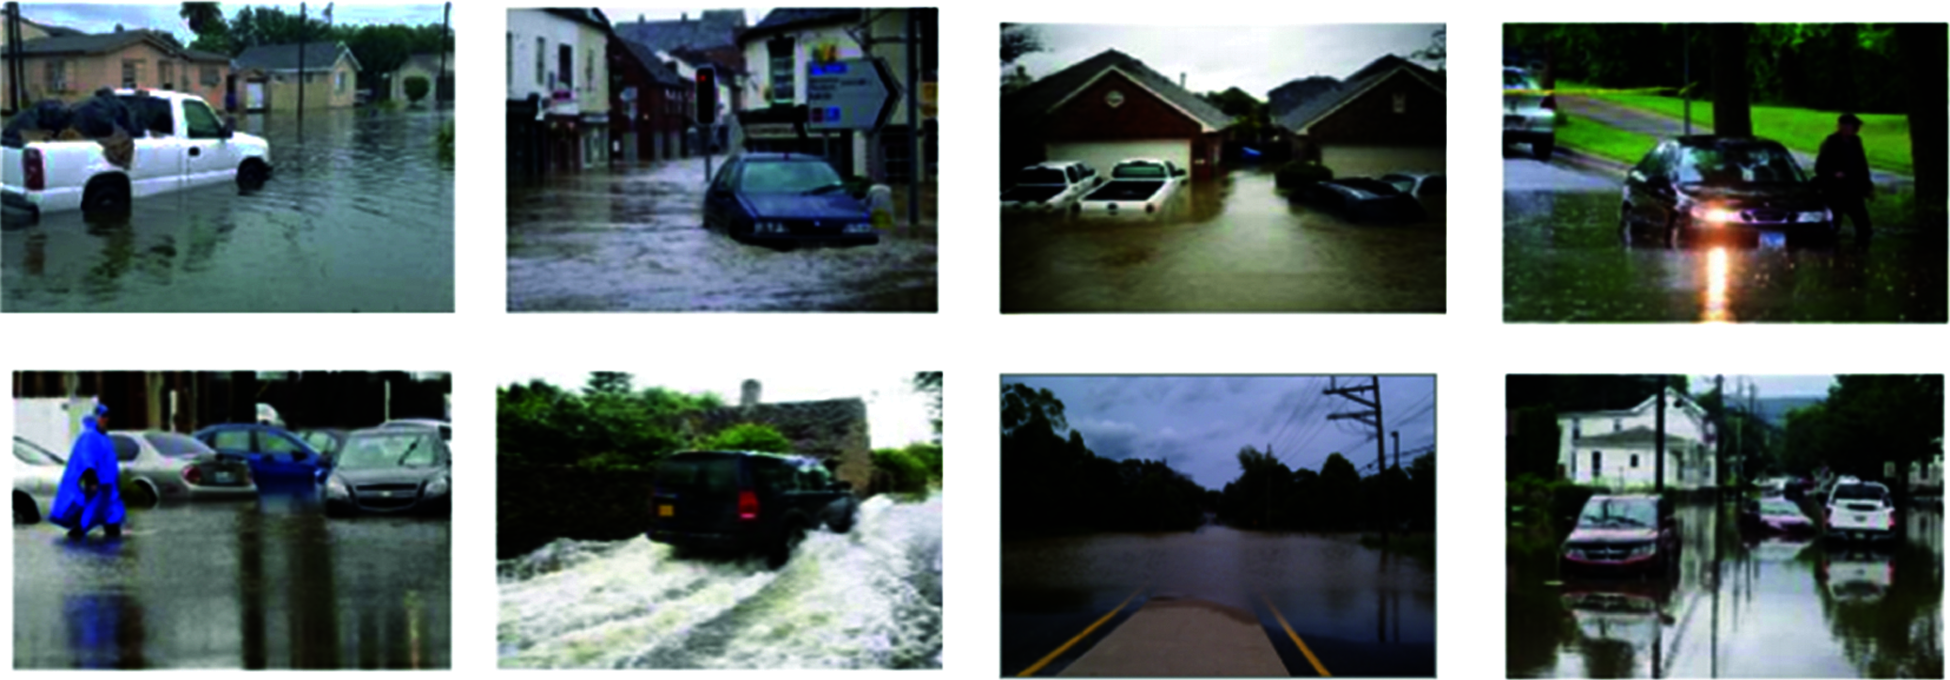
Figure 4: Different surveillance camera images
The flood image dataset includes diverse scenes from residential, suburban and geological settings, and it is useful for more flood monitoring analysis, as shown in Fig. 4. Fig. 5 shows the final water level analysis after applying the CNN, which is used to remove the unwanted noise from the water. Performance measures such as precision, recall and F1-scores are shown below:
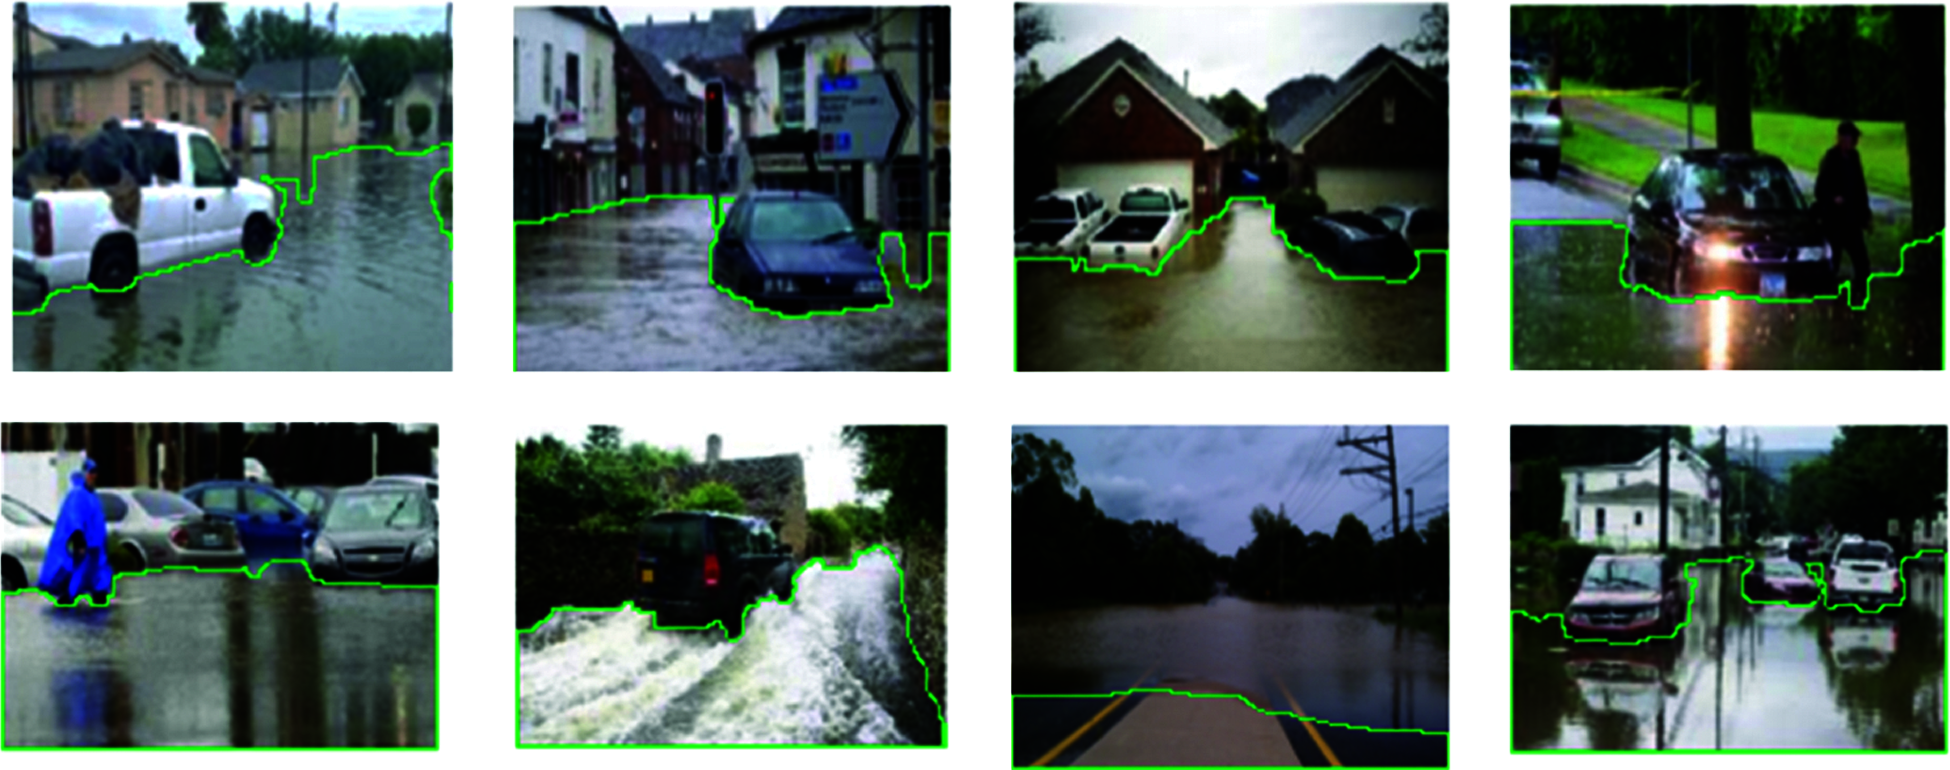
Figure 5: Water level analysis
Fig. 6 represents the performance metrics of the F1-score, recall and precision values, which are compared with two existing KNN methods and the ANN algorithm. In Fig. 6a, the F1-score measures that the existing algorithm has a low-quality image when compared with our proposed method because our proposed technique enhances the quality of the image, so the water level analyses should be noted accurately. In the Fig. 6b recall images, when the blurred KNN and ANN images are compared to the CNN method, the images are enhanced. In Fig. 6c, our proposed CNN method increases in each image captured from the surveillance. However, it was proven that our method has higher precision, higher recall and higher F1-score than those of the existing method.
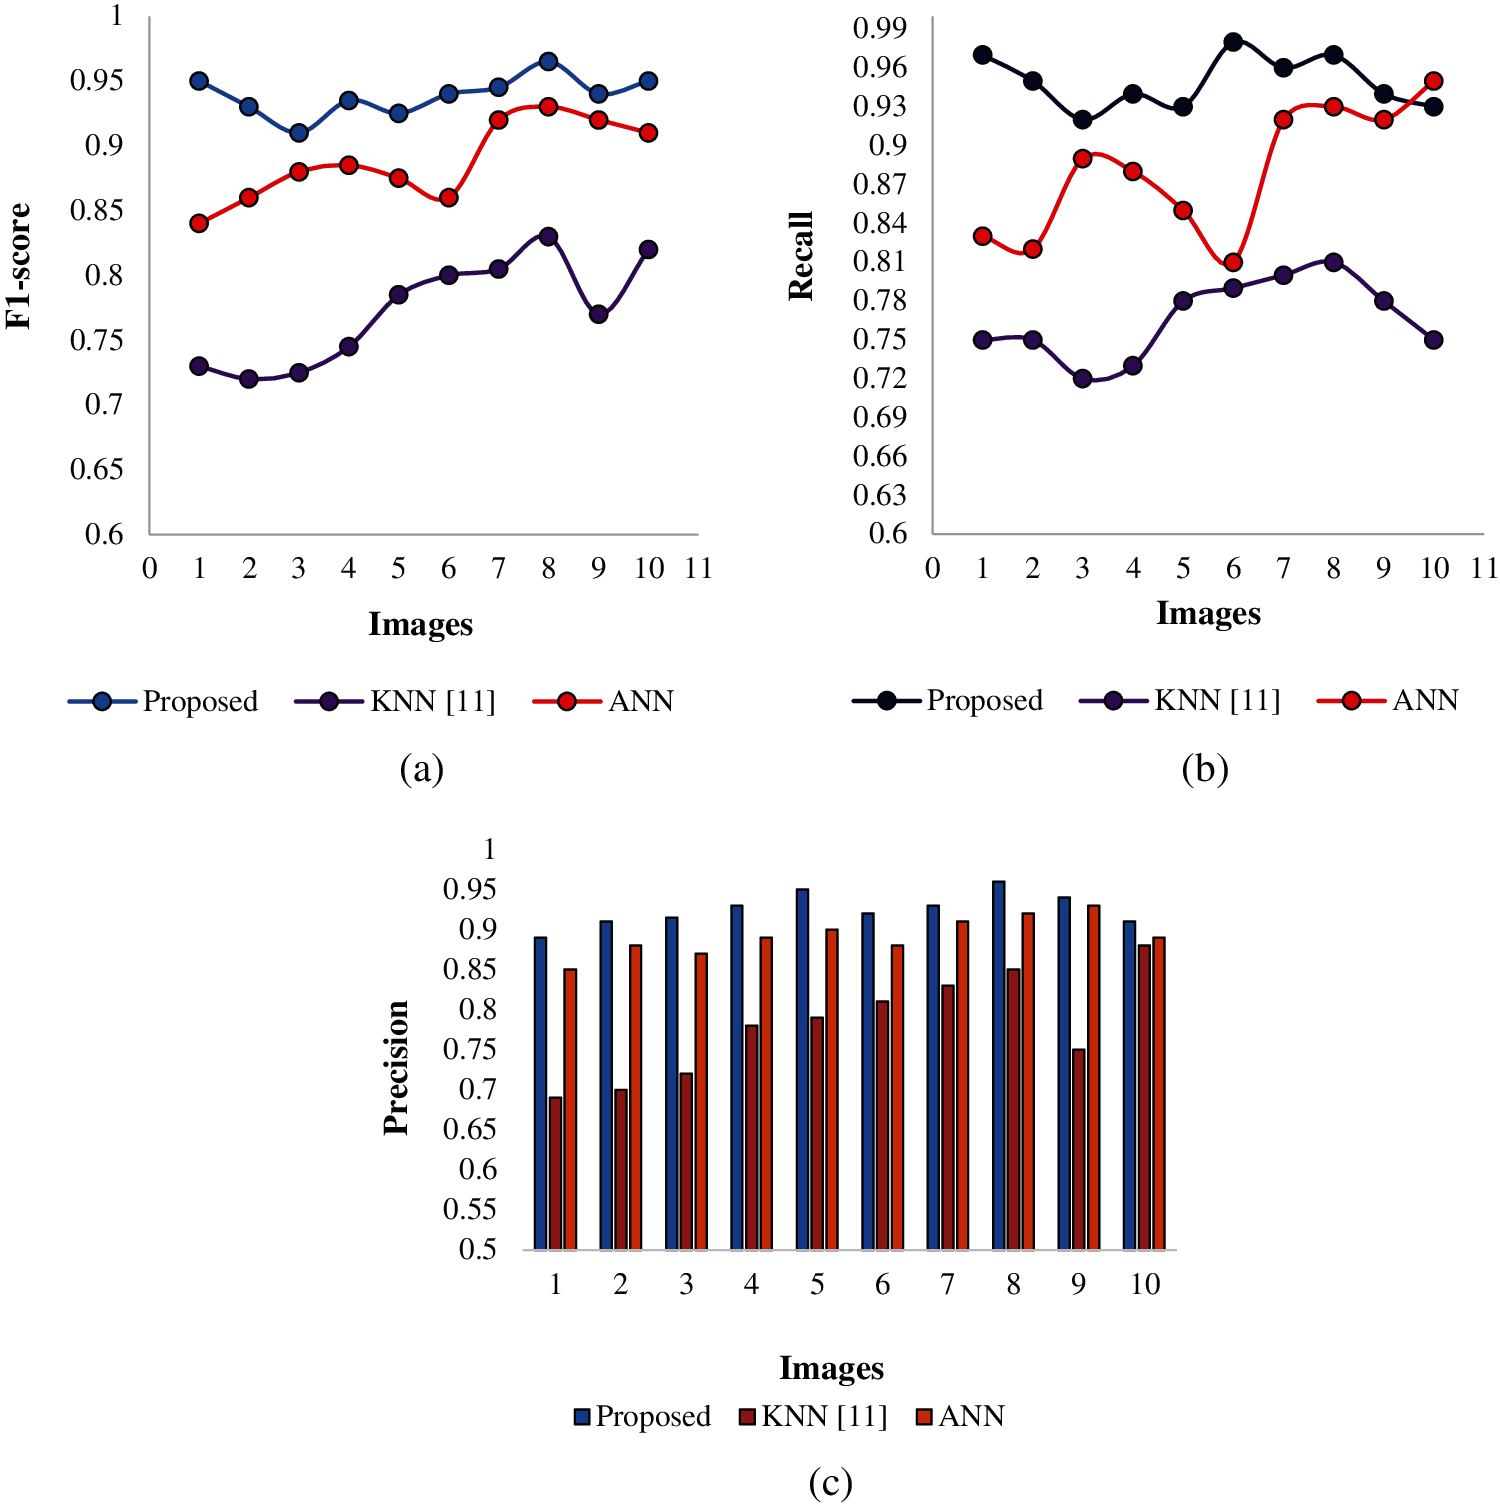
Figure 6: Comparative analysis (a) F1-score, (b) recall and (c) precision
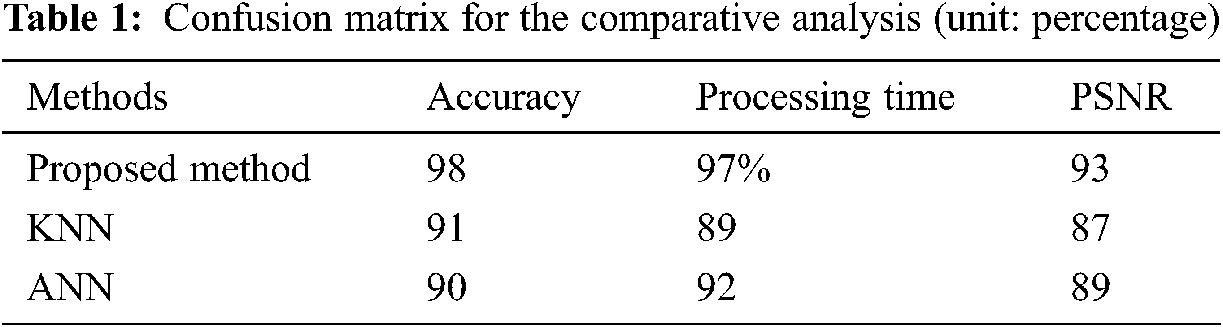
Fig. 7 represents accuracy and processing time. The overall accuracy can be calculated by accuracy. Here, the overall accuracy increased by 98% on average medium filtering, while that of the other existing algorithm, KNN, increased by 8% and that of ANN increased by 9%. In Fig. 7b, the processing time decreased for our proposed work. Finally, our proposed method increased the accuracy up to 98%; therefore, it has better accuracy. The CNN was found to be the most promising image processing technique for monitoring the water level features from digital images, with analysis evaluation results higher than 98%. Accuracy metric is often used to interpretably evaluate the system's efficiency. In other words, the test accuracy is commonly confused with the validation accuracy, which is the accuracy calculated on a given dataset that isn't used for training but is used to validate the model's generalization capacity. The loss can be calculated using training and validation data, and its meaning is determined by how well the model performs in these two different sets. It's the total number of errors committed in each learning or validation set for each sample. The loss value indicates how well or poorly a model performs after each iteration. The limitations in the existing model that includes lack of reliability because of not considering hostile environment as well as not taking more parameters which have been overcome as limitations in the proposed model. A confusion matrix is a table that shows how well a recognition system (or “regular expression”) performs on a set of test data for which the true values are known. The percent of suggested and existent processes for probable correlations with known statistical analysis are shown in the Tab. 1 of the confusion matrix.
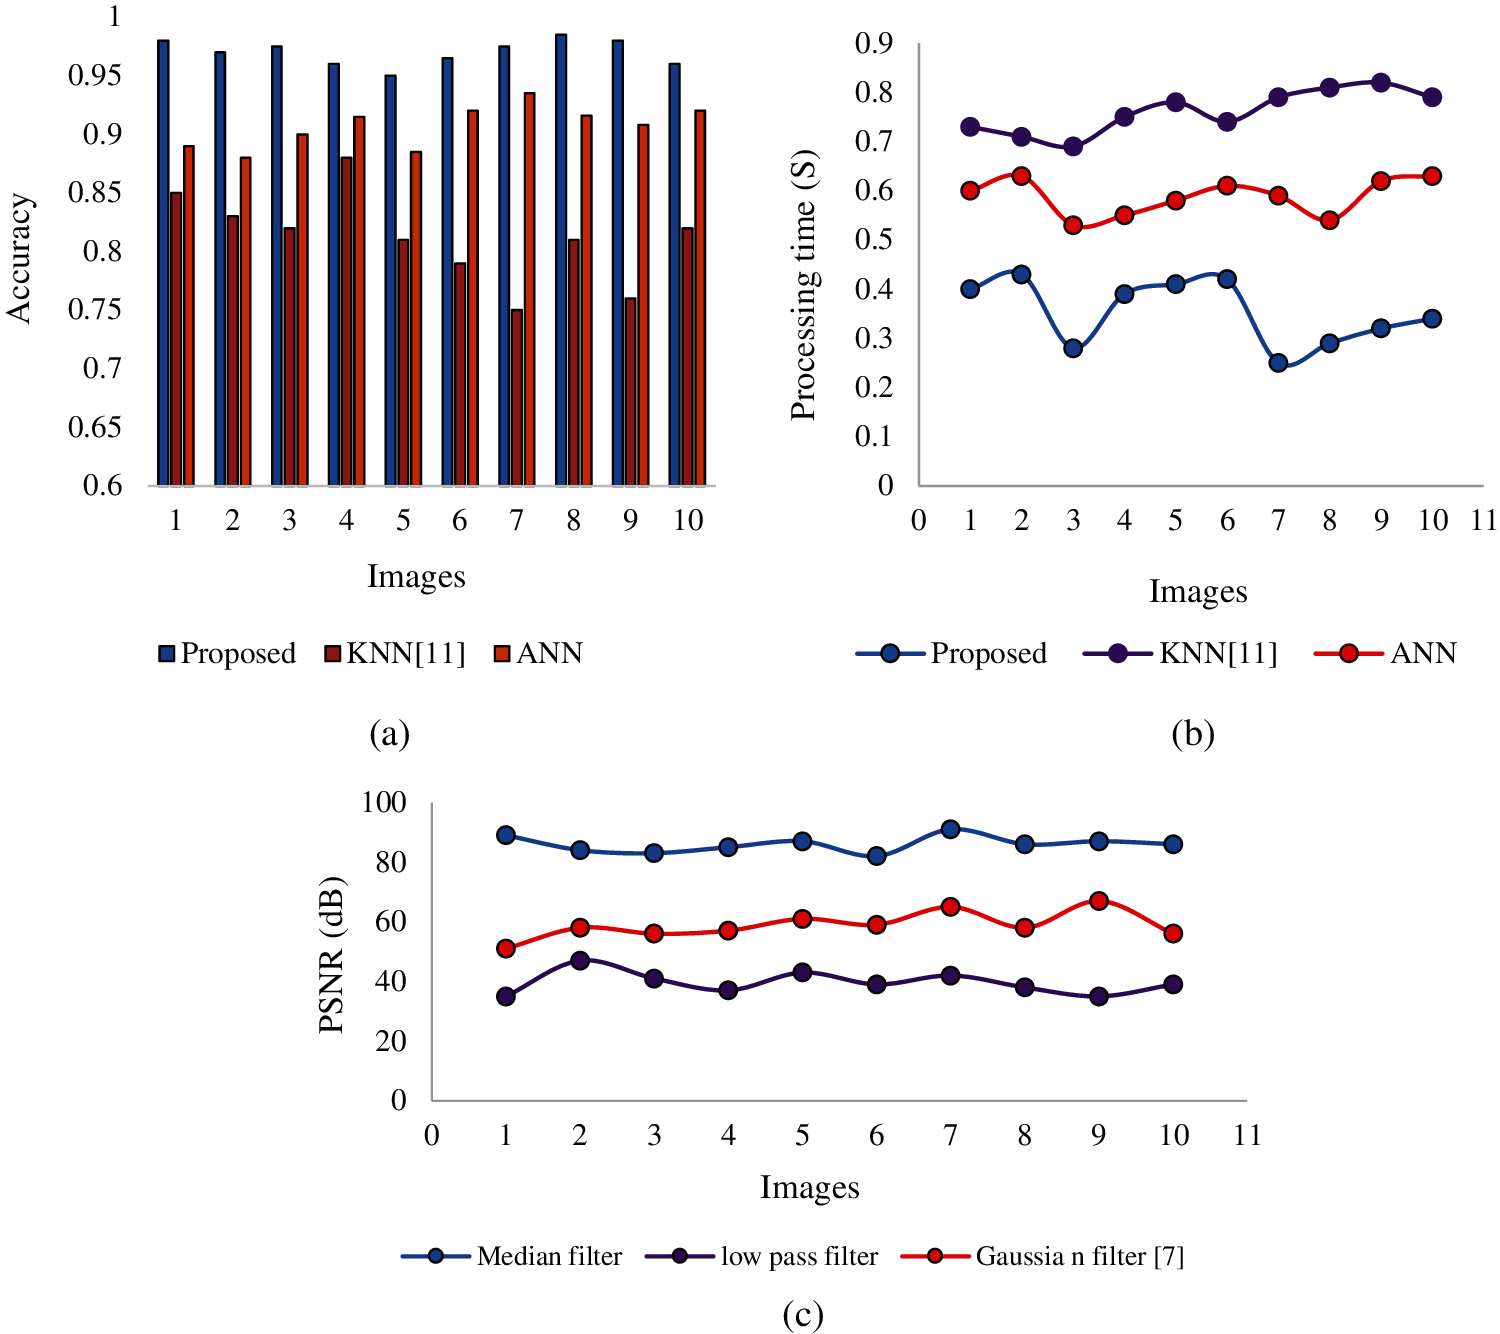
Figure 7: Comparative analysis (a) accuracy (b) processing time and (c) PSNR
A novel technique for automatic flood detection monitoring in video surveillance systems was presented in this paper. The Google dataset was used for flood monitor images. From the database, the water level can be identified using a classification algorithm. The features extracted by using the HoG method and the unwanted noise were reduced using the median filtering technique. After that, the CNN classification algorithm was used to analyze the water level in the video frames. The output value was compared with a different existing method, such as ANN and K-NN classifiers. The key advantage of this automatic detection process is that it provided the highest accuracy of 98% with negligible validity loss using the CNN. To establish more sophisticated water level recognition during rainy days, future research may be designed to explore deep learning techniques. Moreover, the future work will focus on the development of a model for a flood monitoring system that uses IoT technology and considers energy efficiency as a critical tool in deep learning architecture.
Funding Statement: This research work was fully supported King Khalid University, Abha, Kingdom of Saudi Arabia for funding this work through General Research Project under Grant Number GRP/98/42.
Conflicts of Interest: The authors declare that they have no conflicts of interest to report regarding the present study.
1. A. Schmitt and B. Brisco, “Wetland monitoring using the curvelet-based change detection method on polarimetric sar imager,” Water, vol. 5, pp. 1036–1051, 2013. [Google Scholar]
2. S. Schlaffer, P. Matgen, M. Hollaus and W. Wagner, “Flood detection from multi-temporal sar data using harmonic analysis and change detection,” International Journal of Applied Earth Observation and Geoinformation, vol. 38, pp. 15–24, 2015. [Google Scholar]
3. R. K. Biswas and A. W. Jayawardena, “Water level prediction by artificial neural network in a flashy transboundary river of Bangladesh,” Global Nest Journal, vol. 16, pp. 432–444, 2014. [Google Scholar]
4. C. Vittucci, L. Guerriero, P. Ferrazzoli, R. Rahmoune, V. Barraza et al., “River water level prediction using passive microwave signatures—A case study: The Bermejo basin,” IEEE Journal of Selected Topics in Applied Earth Observations and Remote Sensing, vol. 7, no. 9, pp. 3903–3914, 2014. [Google Scholar]
5. Y. N. Ji, M. J. Zhang, Y. C. Wang, P. Wang, A. B. Wang et al., “Microwave-photonic sensor for remote water-level monitoring based on chaotic laser,” International Journal of Bifurcation and Chaos, vol. 24, no. 03, 1450032, pp. 1–14, 2014. [Google Scholar]
6. R. Narayanan, V. M. Lekshmy, S. Rao and K. Sasidhar, “A novel approach to urban flood monitoring using computer vision,” in Proc. of the 2014 IEEE Int. Conf. on Computing, Communication and Networking Technologies (ICCCNTHefei, China, pp. 1–7, 2014. [Google Scholar]
7. M. Moy de Vitry, S. Kramer, J. D. Wegner and J. P. Leitão, “Scalable flood level trend monitoring with surveillance cameras using a deep convolutional neural network,” Hydrology and Earth System Sciences, vol. 23, no. 11, pp. 4621–4634, 2019. [Google Scholar]
8. Z. J. Zhu, A. Z. Jiang, J. Lai, Y. Xiang, B. Baird et al., “Towards efficient use of an unmanned aerial vehicle for urban flood monitoring,” Journal of Water Management Model, vol. 26, pp. 1–7, 2017. [Google Scholar]
9. J. Langhammer and T. Vacková, “Detection and mapping of the geomorphic effects of flooding using uav photogrammetry,” Pure Appl. Geophysics, vol. 175, pp. 83–105, 2018. [Google Scholar]
10. C. Balkaya, F. Casciati, S. Casciati, L. Faravelli and M. Vece, “Real-time identification of disaster areas by an open-access vision-based tool,” Adv. Eng. Software, vol. 88, pp. 83–90, 2015. [Google Scholar]
11. S. Zakaria, M. R. Mahadi, A. F. Abdullah and K. Abdan, “Aerial platform reliability for flood monitoring under various weather conditions: a review,” in Proc. of the Geo Information for Disaster Management Conf., Istanbul, Turkey, pp. 295–314, 2018. [Google Scholar]
12. A. Kamilaris and F. X. Prenafeta-Boldú, “Disaster monitoring using unmanned aerial vehicles and deep learning,” arXiv 2018, arXiv: 1807.11805, pp. 1–14, 2018. [Google Scholar]
13. J. Senthilnath, R. Rajendra, S. Suresh, S. Kulkarni and J. A. Benediktsson, “Hierarchical clustering approaches for flood assessment using multi-sensor satellite images,” Int. Journal of Image Data Fusion, vol. 10, pp. 28–44, 2019. [Google Scholar]
14. N. A. Muhadi, A. F. Abdullah, S. K. Bejo, M. R. Mahadi and A. Mijic, “image segmentation methods for flood monitoring system,” Water, vol. 12, no. 1825, pp. 1–10, 2020. [Google Scholar]
15. K. P. Menon and L. Kala, “Video surveillance system for real-time flood detection and mobile app for flood alert,” in 2017 Int. Conf. on Computing Methodologies and Communication (ICCMCIndia, pp. 515–519, 2017. [Google Scholar]
16. N. Akhtar, A. Rehman, M. Hussnain, S. Rohail, M. S. Missen et al., “Hierarchical coloured petri-net based multi-agent system for flood monitoring, prediction, and rescue (fmpr),” IEEE Access, vol. 7, pp. 180544–180557, 2019. [Google Scholar]
17. S. Azid, B. Sharma, K. Raghuwaiya, A. Chand, S. Prasad et al., “SMS based flood monitoring and early warning system,” ARPN Journal of Engg. Applied Science, vol. 10, no. 15, pp. 6387–6391, 2015. [Google Scholar]
18. Z. Wei, “Algorithm of flood monitoring and analysis based on smap data,” in IEEE 8th Joint Int. Information Technology and Artificial Intelligence Conf. (ITAICChongqing, China (2019.5.24-2019.5.26pp. 911–914, 2019. [Google Scholar]
19. A. N. Yuman, C. C. Paglinawa, A. C. Paglinawan, G. O. Avendaño, J. A. C. Esteves et al., “Real-time flood water level monitoring system with SMS notification,” in 2017 IEEE 9th Int. Conf. on Humanoid, Nanotechnology, Information Technology, Communication and Control, Environment and Management (HNICEMManila, Philippines, pp. 1–3, 2017. [Google Scholar]
20. K. Rokni, A. Ahmad, K. Solaimani and S. Hazini, “A new approach for surface water change detection: Integration of pixel level image fusion and image classification techniques,” International Journal of Applied Earth Observation and Geoinformation, vol. 34, pp. 226–234, 2015. [Google Scholar]
21. F. Xu and W. Wang, “Design of flood control and video surveillance system of water resources,” in 2010 6th International Conference on Advanced Information Management and Service, Seoul, Korea, pp. 432–435, 2010. [Google Scholar]
22. C. L. Lai, J. C. Yang and Y. H. Chen, “A real time video processing based surveillance system for early fire and flood detection,” in IEEE Instrumentation & Measurement Technology Conf. IMTC 2007, Warsaw, Poland, pp. 1–6, 2007. [Google Scholar]
23. A. S. Souza, “André márcio de Lima curvello, flavio luiz dos santos de souza and henrique josé da silva,” A flood warning system to critical region,” Procedia Computer Science, vol. 109, pp. 1104–1109, 2017. [Google Scholar]
 | This work is licensed under a Creative Commons Attribution 4.0 International License, which permits unrestricted use, distribution, and reproduction in any medium, provided the original work is properly cited. |