DOI:10.32604/iasc.2022.021559
| Intelligent Automation & Soft Computing DOI:10.32604/iasc.2022.021559 | |
| Article |
Development of IoT Based Fish Monitoring System for Aquaculture
1Department of Electrical and Computer Engineering, North South University, Dhaka, 1229, Bangladesh
2Department of Computer Engineering, Kwame Nkrumah University of Science and Technology, Kumasi, Ghana
3Department of Computer Science, College of Computers and Information Technology, Taif University, Taif, 21944, Saudi Arabia
4Department of Information Technology, College of Computers and Information Technology, Taif University, Taif, 21944, Saudi Arabia
*Corresponding Author: Mohammad Monirujjaman Khan. Email: monirujjaman.khan@northsouth.edu
Received: 06 July 2021; Accepted: 12 August 2021
Abstract: Aquaculture mainly refers to cultivating aquatic organisms providing suitable environments for various purposes, including commercial, recreational, public purposes. This paper aims to enhance the production of fish and maintain the aquatic environment of aquaculture in Bangladesh. This paper presents the way of using Internet of Things (IoT) based devices to monitor aquaculture’s basic needs and help provide things needed for the fisheries. Using these devices, various parameters of water will be monitored for a better living environment for fish. These devices consist of some sensors that will detect the Potential of Hydrogen (pH) level, the water temperature, and there will be two extra sections where the measurement of dissolved oxygen level and ammonia level using the testing kits can be determined which are needed for proper fish farming in the right water. An android-based mobile application has also been developed. In this system, farmers, fishermen, and people related to aquaculture will be the users of an android application. Via that application and with the help of a device, users will be notified about the amount of dissolved oxygen, ammonia level, pH level, and water body temperature. This monitoring system will help fish farmers to take the necessary steps to prevent any disturbance in an aquatic environment. Though Bangladesh is a riverine country and fish farming has a huge impact on this country’s economy, it is necessary to keep in good health to produce more and more fish. But the fisheries of this country are not expert enough to understand how to provide necessary elements to fish and what to do. They might get help from this system and measure the parameters they can give necessary things to grow more fish.
Keywords: Aquaculture; android application; IoT; sensors; dissolved oxygen; pH level; temperature; water pollution; fish health; fish farmers; Bangladesh
The importance of aquaculture is beyond description. In the aquaculture system, fish are cultured in confined artificial water bodies such as a tank where they live, eat, grow, and extract waste. There is no natural water source, so the quality of water declines quickly, which affects the growth and health of fish. So water quality is a significant factor in the aquaculture system that guarantees the perfect growth and health of fish [1,2]. Yet the proposed system is to meet the demand for fish by maintaining the water quality necessary for producing more and more fish and helping to increase the economic value. The fisheries will become more sufficient, and human health will become wealthier by having fish.
About 3.69% of the country’s total Gross Domestic Product (GDP) comes from it and 22.60% of the agricultural GDP is based on aquaculture [3]. For the last 10 years (2004–2005 to 2013–2014 Fiscal Year), the fishing growth was fairly constant, with an average growth of 5.38% per year [4]. From 2009–2010 to 2013–2014, this sector experienced a consistent growth rate of 7.32% to 4.04% [5]. In recent years, the production of wild capture fisheries has reached 16.78% (oceanic) and 83.22% (freshwater), placing Bangladesh as the world’s fifth-largest aquaculture producing country in 2015–2016.Those numbers are considered to be more than half of the country’s total fish production (55.15%) [6]. Pond culture is considered the centerpiece of Bangladesh’s aquatic production, which contains 85.8% of total production and covers 57.7% of the area of aquatic land [6].
From the statistics of Bangladesh fish cultivation, we found two types of fish growing systems in the inland water, open inland water and close inland water. The nearby inland water contains a large number of ponds, seasonal culture water bodies, pen culture, cage culture, farm, and so on. Ponds cover 384700 hectares of the area, seasonal water bodies cover 136273 hectares, and so on. According to 2016–2017 statistics, there are 833752 hector areas for culturing fish to grow the economy [7]. Department of Fisheries (DOFs) figures indicate that the vast production of pond culture is the production of carps. About 59% of the fish production in ponds is domestic Indian major carps and silver carp. Non-vernacular species account for the remaining 19%. Including all other non-native carp and Indian minor carps measure 88% of the pond fish production in Bangladesh; See Fig. 1.

Figure 1: Contribution of each species to total pond production in 2007/2008. (Source: modified from DOF 2009a, 2010) [8]
Every year, a large amount of money is earned from this sector by exporting a huge number of fish and prawns. For example, about 2,720,000 BDT (Bangladesh Taka) was earned by exporting fish and prawns in July 2020 [9]. About 1.4 million women work in various fish products such as fishing, farming, fish handling & processing, and earn their livelihoods [10]. Fisheries and aquaculture play a massive role in earning foreign money, and this sector is considered the second-largest export industry. Bangladesh produces diversified fishes, and those are exported to about 60 countries worldwide. The major countries to import Bangladeshi fish and fishing products are the European Union (EU), the USA, and Japan [11].
Bangladesh has earned a lot of money by exporting fish to other countries. This sector earned approximately BDT 4,776.92 core in 2013–2014 by exporting 77.33 thousand Metric Ton (MT) fish and fishing products, which was the highest export earnings in the previous ten years. The high rate of export continued in 2016–2017, and about BDT 4,287.64 crore was earned by exporting 68.31 thousand MT of fish and fishing products [12]. In Bangladesh, many types of fish are cultivated. Tilapia is the best and most profitable fish for firming in every part of the country. Shrimp, crab, and other seafood are also widely cultivated. Shrimp and crab are in high demand in both the local and global markets, so their prices are high. Shrimp and crab are exported in huge quantities. Besides those, bhetki, tangra, horina, chingri, etc. are some common fish species that grow naturally in the saltwater body. Some common freshwater fishes that are cultivated largely are Katla, rui, mrigal, common carp, boal, pabda, chital, koi, shol, gozar, and various types of catfish [13].
With the expeditious growth of the economy, our environment is facing new problems every day. One of the main problems we are facing is water pollution. The most common water quality factors are Dissolved Oxygen (DO), Total Ammonia-Nitrogen (ionized and non-ionized), Nitrite, pH, Alkalinity, Hardness, Carbon Dioxide, Salinity, Iron, Chlorine, Hydrogen Sulphide, and Clarity. Normally, we need to collect samples manually to find these factors and then take them to a laboratory for checking. Thus, this process is a hustle, and we need a long-time to analyze the samples. That’s why we need something new to tackle this phenomenon.
A system of aquaculture was developed by Belen [14] in which three parameters were monitored, which were the pH level, the temperature, and the flow rate. There was no correlation between flow rate and pH or temperature in that experiment. But the temperature was computed by proportioning the pH level inversely. Another system was made by Tolentino et al. [15]. In the system, they computed the aquarium heater, Sodium Hydrogen carbonate, and water pump by measuring some parameters of water and showed them on a web application. The parameters were temperature, pH, Oxidation-reduction Potential (ORP), salinity, and dissolved oxygen. But this system cannot be used for large water bodies for aquatic production. Raj et al. [16] developed a monitoring system that used three sensors named pH, temperature, and ultrasonic. The function of the system was to monitor the feeding of the aquatic organisms in an aquarium. Harun et al. [17] built a system with three sensors named pH, temperature, and Do (Dissolved Oxygen) to measure the levels of the quality of water. Rosalin et al. [18] made a system of these similar works with five sensors named distance, ammonia, salinity, oxygen, and temperature. But the system will cost more while some costs can be reduced. The other system built by Saha et al. [19] is an IoT based automated fish farm aquaculture monitoring system where they used four sensors, which are temperature, pH, conductivity, and watercolor. But for a vast production, these measurements are not enough. The authors of [20] suggested an IoT-based smart agrotech system that takes humidity, temperature, and soil moisture into account as important farming parameters. Authors in [21] presented a VANET for health monitoring application which is not for aquaculture. In this research work an IoT based fish monitoring system for aquaculture has been developed. The purpose of this system is to overcome the lack of other systems in this field. Using this system, fishermen and related people can measure the water quality factors and monitor the health of fish and other aquaculture. The Android mobile application may help to measure these water parameters in real time. By reducing the cost, the system will help to increase the production level by measuring the most important parameters of water.
In aquaculture, there are a few problems to consider. Oxygen depletion means a low level of Dissolved Oxygen (DO). A low level of DO may result in fish mortality. When the DO falls to 2–4 mg/L, almost all species of fish are distressed. This is very harmful to them. Another thing is the pH level of the water, which should not be too high or too low. The other criteria are the water body temperature, which mostly depends on the type of fish. As different fish survive in different temperatures, the temperature of the water body should be checked. Ammonia is known as the silent killer in the aquaculture field. If the ammonia is not lowered in time, then fish will die overnight. The standard level of DO for fish should be 6.5–8 mg/L and between 80–120% [22]. If the level decreases, fish may feel suffocated and die. pH is another important parameter that should be in the range of 6.5–9.0 [23]. More than or less than the range will harm the fish and they can die. Temperature is a key factor for coldwater species. They cannot tolerate temperatures above 20–25 degrees Celsius. Warm water species can survive and grow between 10–15 degrees C, even below 10 degrees C but will not reproduce below 20 degrees C. Tropical species need comparatively high temperatures. They will die at 10–20 degrees C, and they cannot grow and reproduce anything below 25 degrees C [24]. Another important element is the ammonia level. It should be in the range of 0.3 to 0.9 mg/L for coldwater fish; 0.7 to 3.0 mg/L for warm-water fish; 0.6 to 1.7 mg/L for marine fish; and 0.7 to 3.0 mg/L for marine shrimp. If the ammonia level of water increases, fish will die at a high level [25]. So the level of the parameters is very important for culturing more and more fish.
With that vision, Internet of Things (IoT) based devices and mobile applications have been proposed in this paper, which will monitor the aquaculture sector of Bangladesh and help us maintain the eco-friendly environment for the fish at a satisfactory level. This paper describes an Internet of Things-based system that monitors the water body of a pond, bill, or baor where fishermen cultivate fish. A device is built up in this paper, which consists of some sensors. The sensor receives some data from the water and shows the value of the data to an android mobile application. The process will be done with the help of the Esp-12E module using the Application Programming Interface (API). After receiving the pH level and temperature data using sensors and mobile application and after testing dissolved oxygen and ammonia using kit, fish, farmers or users can take necessary steps accordingly to provide proper healthy water for the healthy living of fish.
Section 1 provides an introduction. Sections 2 and 3 discuss materials and methods and results, respectively. In Sections 4 and 5, discussion and conclusion are described, respectively.
2.1 Hardware Equipment for the Development of the System
The proposed system is made for fishermen to monitor the quality of water for a healthy environment for fish to live in. Healthy water is essential for aquatic animals. Water quality is decided by some factors like pH level, oxygen level, temperature etc. Some sensors have been integrated with the proposed system to collect the values of some parameters from the water. For this purpose, pH sensor, temperature sensor, oxygen kit, and ammonia kit have been used. This system was created by connecting a pH sensor, a temperature sensor, and some other equipment.
The temperature sensor and pH sensor collect value from water and send that value to the server through the Wi-Fi module. A mobile application was made to see values. pH level is important for fish. To grow a healthy fish, it’s essential to maintain the pH level. So, a pH sensor was used (Fig. 2) [26]. Freshwater ponds have a natural pH in the range of 6–8. When the pH level of water is low, it means the water is acidic, and high pH means it’s alkaline. If pond water becomes highly alkaline, it can damage the skin, eyes, and other outer surfaces of fish. Acidic water harms the reproduction of fish. Fish can die because of low pH levels [27,28].
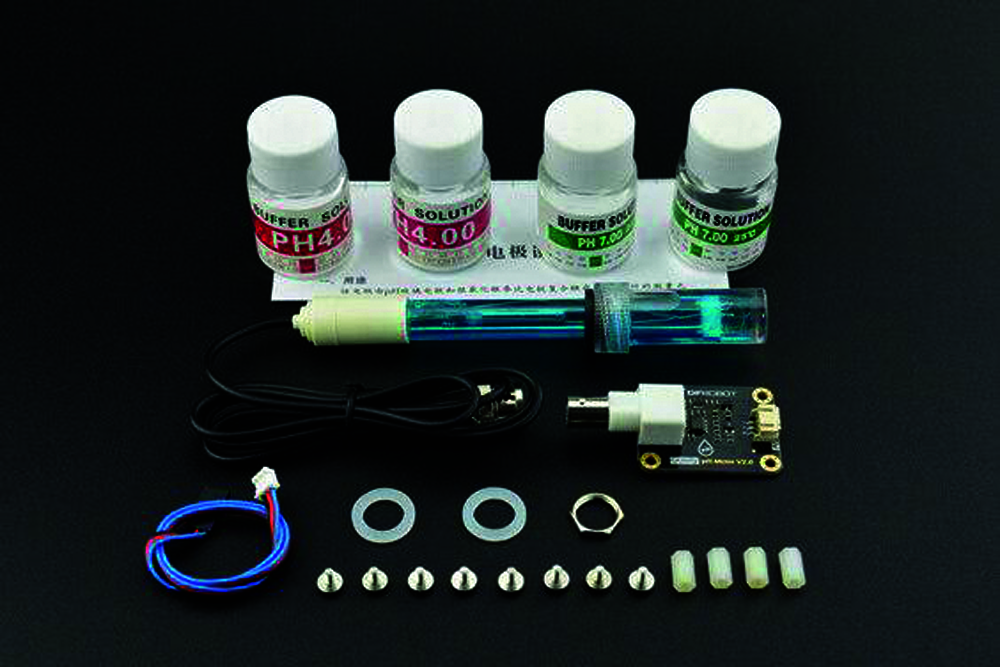
Figure 2: pH sensor
A temperature sensor (Fig. 3) [29] has been used to monitor the temperature of the water. As fish’s activity levels depend on temperature, so it’s important to maintain the right temperature. Hot water cannot hold enough oxygen for fish, so it is important for fish. Fishes are more active in warm water, so they need more food to survive. In cold water, they are comparatively less active, so they need less food. The temperature level for all types of fish is not the same. Here we used the DS18B20 temperature sensor. DS18B20 is a programmable digital temperature sensor. It works with the method of 1 wire communication. A wide range of temperatures can be measured by the pH sensor (from−55°C to +125°C) with a decent accuracy of ±5°C [30]. Oxygen is an essential element for fish. When the dissolved oxygen level is too low or high, it will affect the water quality. So, oxygen and ammonia kits have been used to measure the water’s dissolved oxygen level and ammonia level. Fig. 4 shows an oxygen kit. Here, an oxygen kit is used in the system to reduce the cost of the whole proposed system.
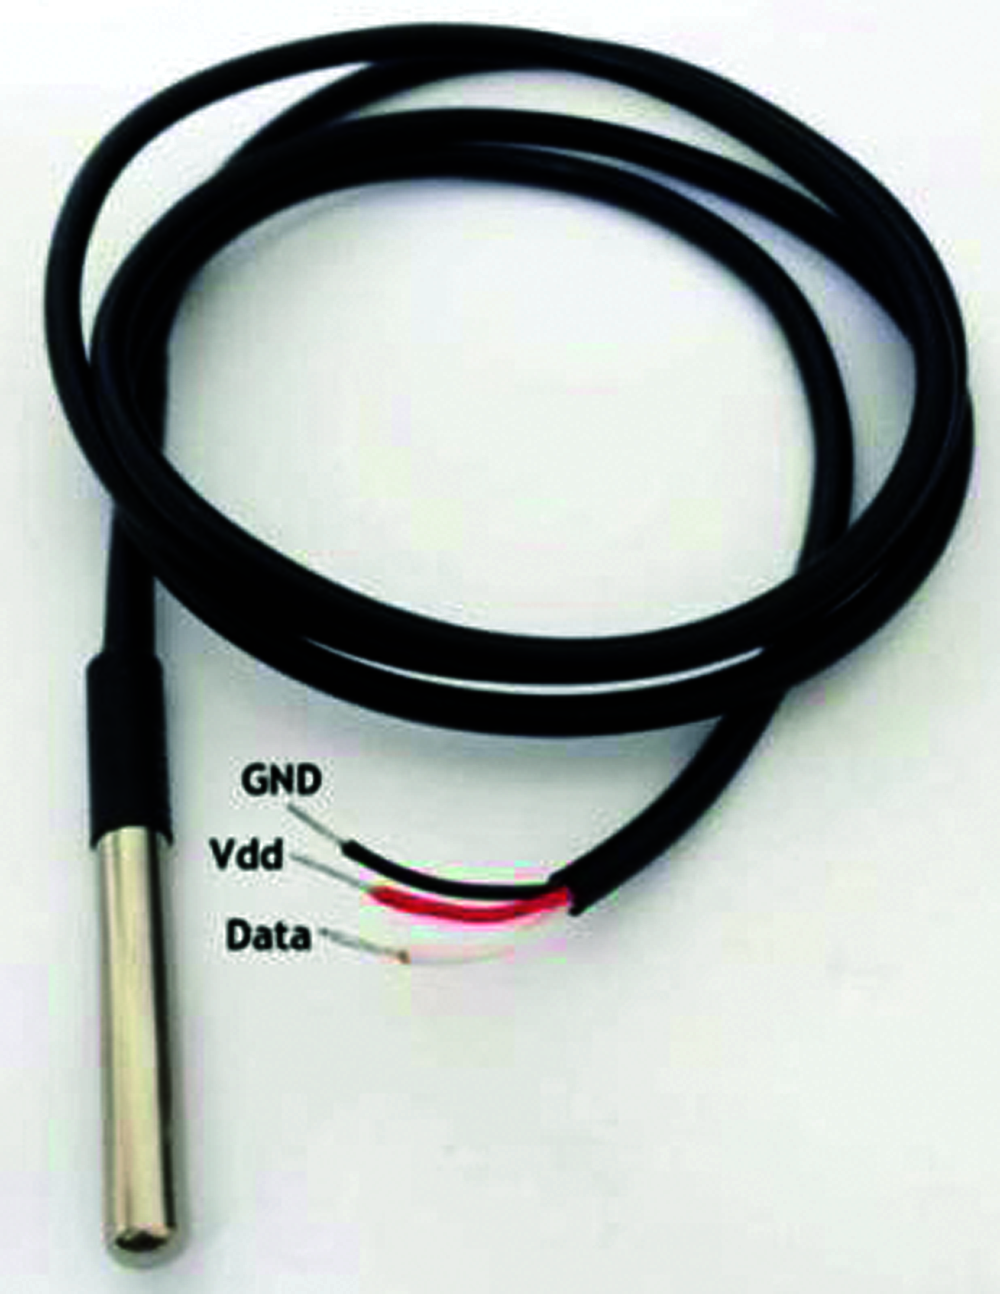
Figure 3: DS18B20 temperature sensor
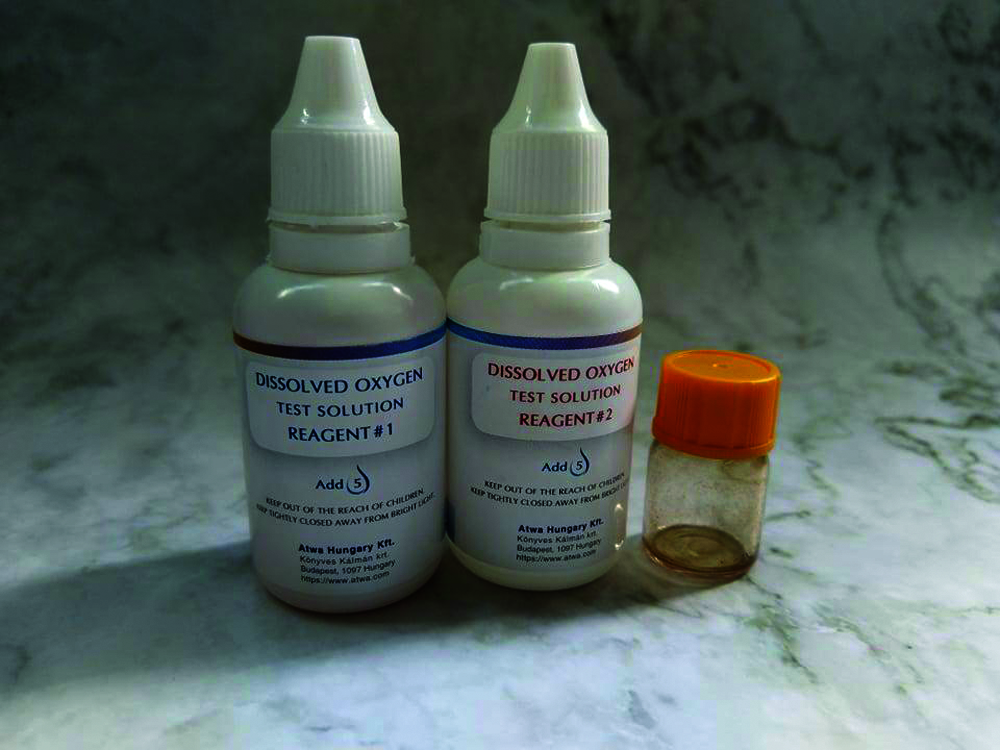
Figure 4: Dissolved oxygen test kit
This is a way to measure the dissolved oxygen level of water. To measure dissolved oxygen, place 5 mL of water in a jar, add 5 drops of test solution chemical 1 and test solution chemical 2, wait 4–5 min for the water to change color. We will achieve the desired color of water by combining water and oxygen kit solutions. After that, we need to open the dissolved oxygen section in our mobile application. We will match the color of the water in the jar with the color chart in the app. The ammonia kit, shown in Fig. 5, is an efficient way to find the ammonia level of water. To measure the ammonia of the water, we need to add 4 drops of reagents 1, 2 and 3 in the jar with 2 ml (milliliter) of tank/pond water and wait for 4–5 min to change the color of the water. We will achieve the desired color of water by combining water and ammonia kit solutions. ESP-12E (Fig. 6) [31] is used to establish a wireless network connection for the microcontroller to build this device.
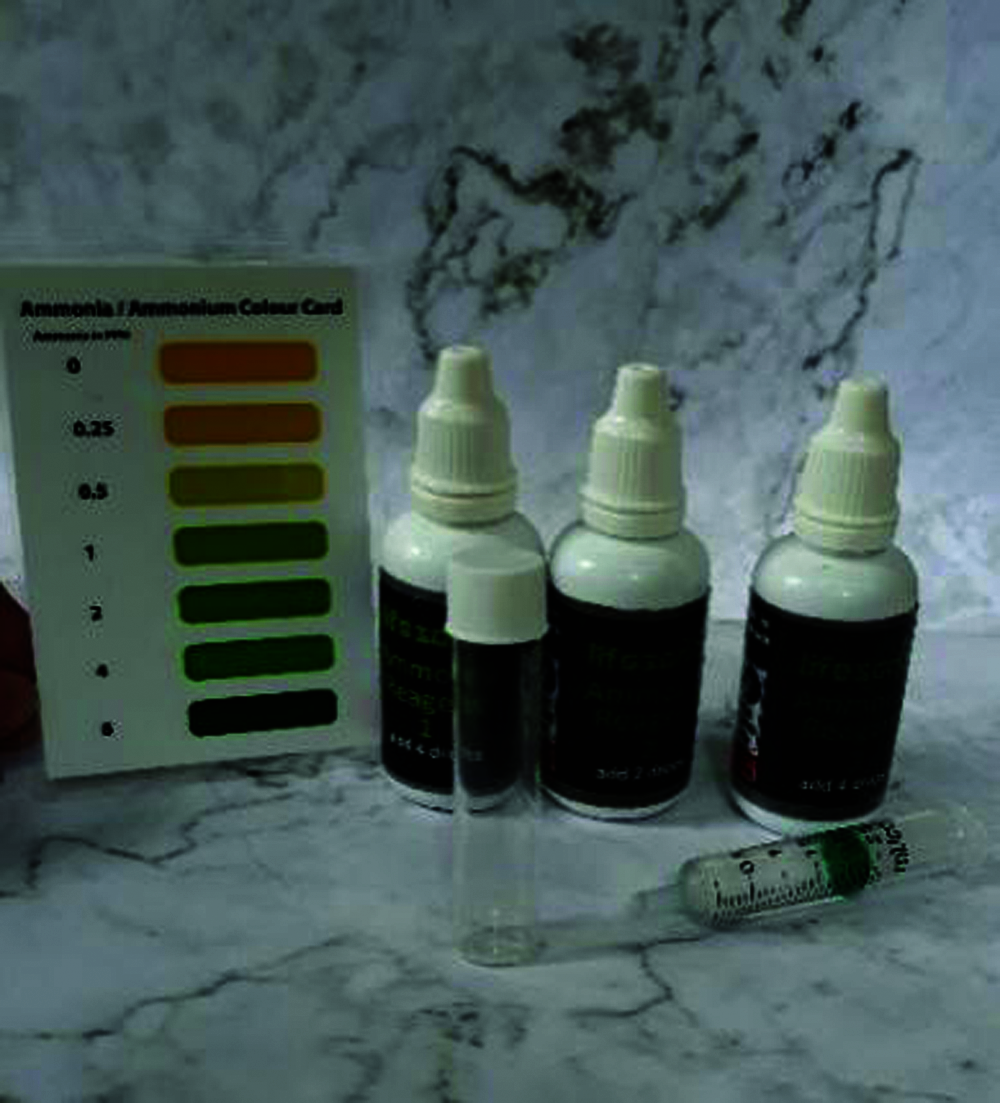
Figure 5: Ammonia testing kits
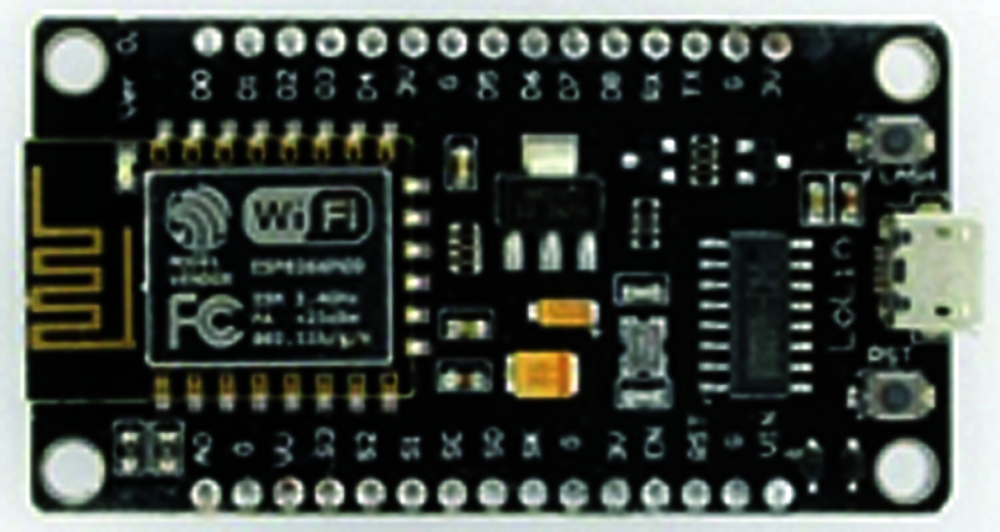
Figure 6: ESP-12E module
It has an internal 32-bit microcontroller that can perform multiple communications and output signals. We also used a 12 V battery, LM2596 buck converter, 10 k resistor, switch, and some wires. LM2596 was used to adjust input voltage. The Node mcu controller has built-in Wi-Fi. The PH sensor is connected with node mcu analog pin A0. It has a 10-bit DC converter and a ds18b20 temperature sensor that connects with node mcu digital pin D1. It supports 8-bit input and output. The circuit diagram for the device’s connection is shown in Fig. 7. For the development of the system, many types of equipment have been used in this paper. The below Tab. 1 shows the name and price of the equipments.
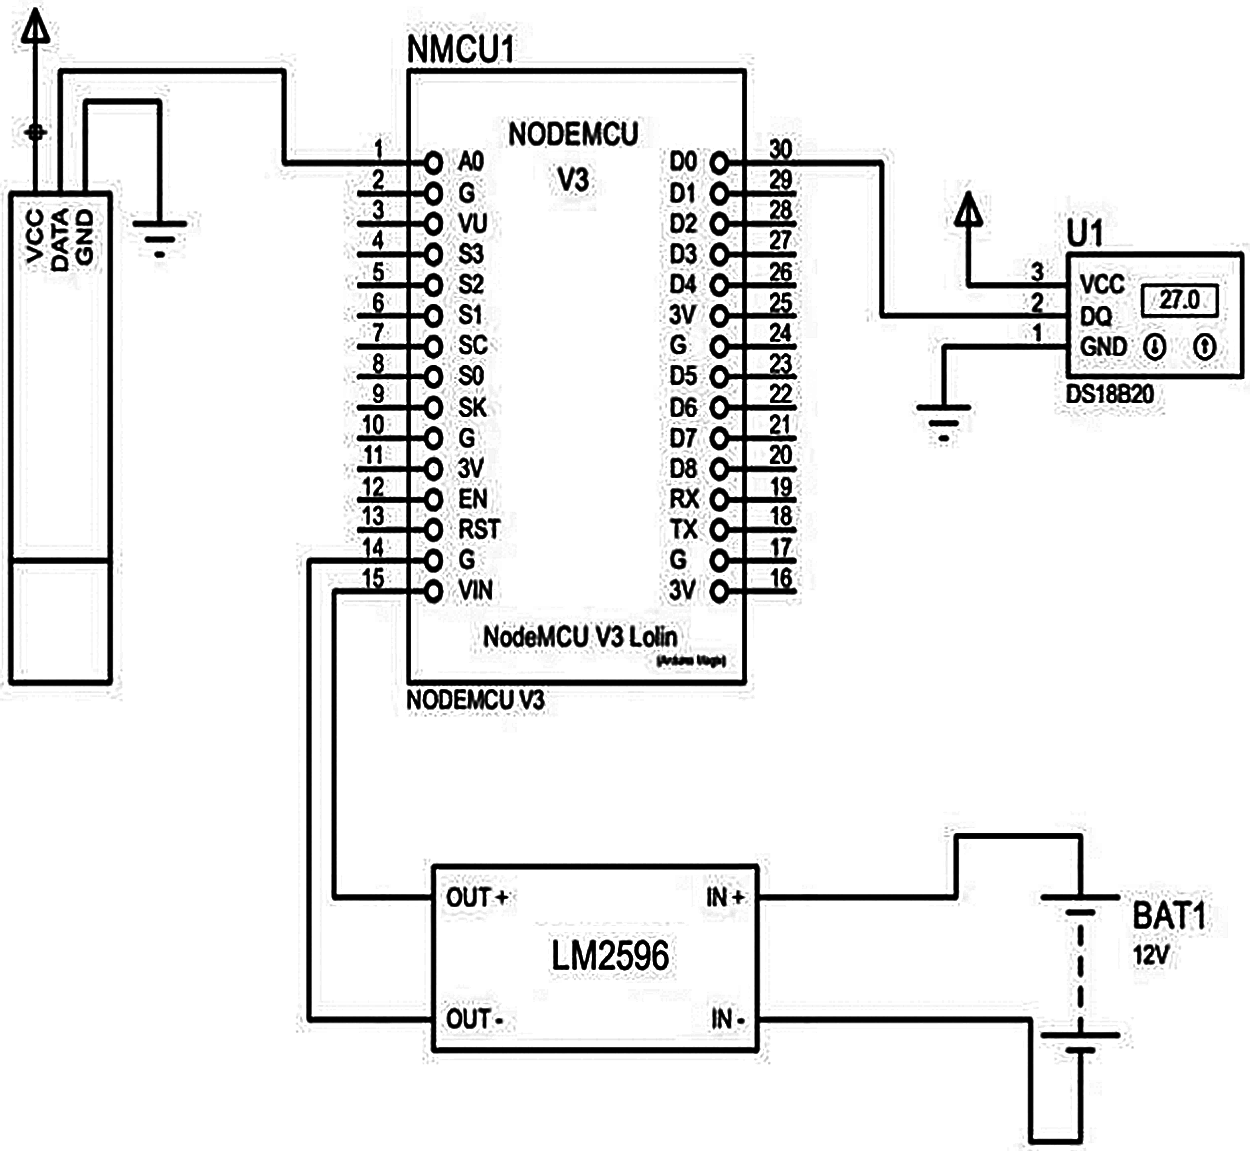
Figure 7: Circuit diagram of connecting the device

An MIT (Massachusetts Institute of Technology) app inventor built the application. This system is very user-friendly, with a simple interface and a simple back-end connection. This software has some drag and drop functions that help the designer build the user interface [32]. The MIT app inventor has some bars which have options for buttons and designs. There are two main editors on the user interface of MIT app inventor: the design editor and the other block editor. The design editor is the drag and drop interface, which is used to layout the elements of the application’s UI (User Interface) (Fig. 8). The blocks editor is an environment in which app inventors can visually lay out the logic of their apps using color-coded blocks that snap together like puzzle pieces to describe the program [33]. This is how the user interface is created. There is also an option to connect the application with the server. The backend is built with this app inventor and the connecting API (Application Programming Interface) key is given to the software to connect with the device through a server. After searching on Google, we can find an MIT app inventor, and there we will create or sign into a Google account. And then, we shall find a screen to create the interface. There are various options, such as text, bar, label, image, and many others, that we can drop on the interface and colorize. That’s how every page is created and then connected to the home page with other pages.
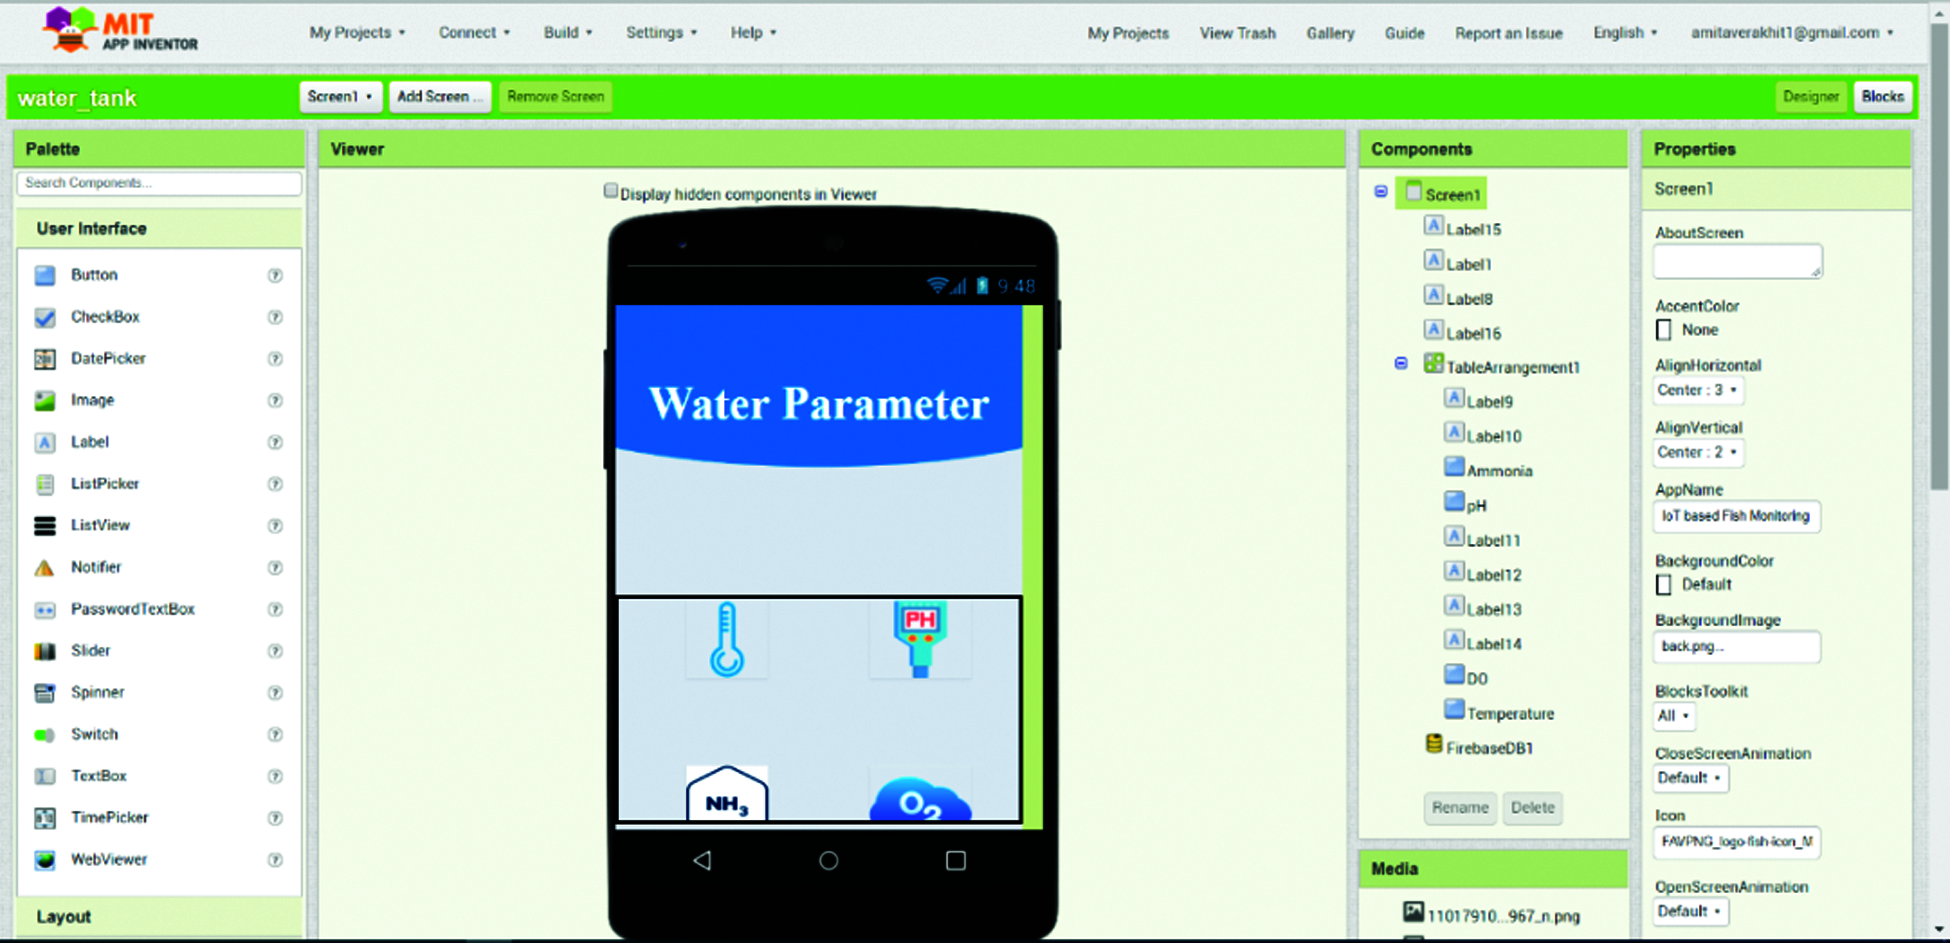
Figure 8: MIT software showing the making of UI application
Hosting the storage from Google firebase got an API code, and the storage was provided to the application server. The Firebase Real-time Database is a cloud-hosted database. Data is stored as JSON and synchronized in real-time to every connected client [34]. The firebase gives a memory space to store the data got from the device and to show to the application. For space, the firebase provides an API key. The API key needs to be included with the application’s back-end to show the data on the application. In Fig. 9, we purchased storage to store the date from the firebase and named the storage as our system name, then sent the API to the application to store the value.
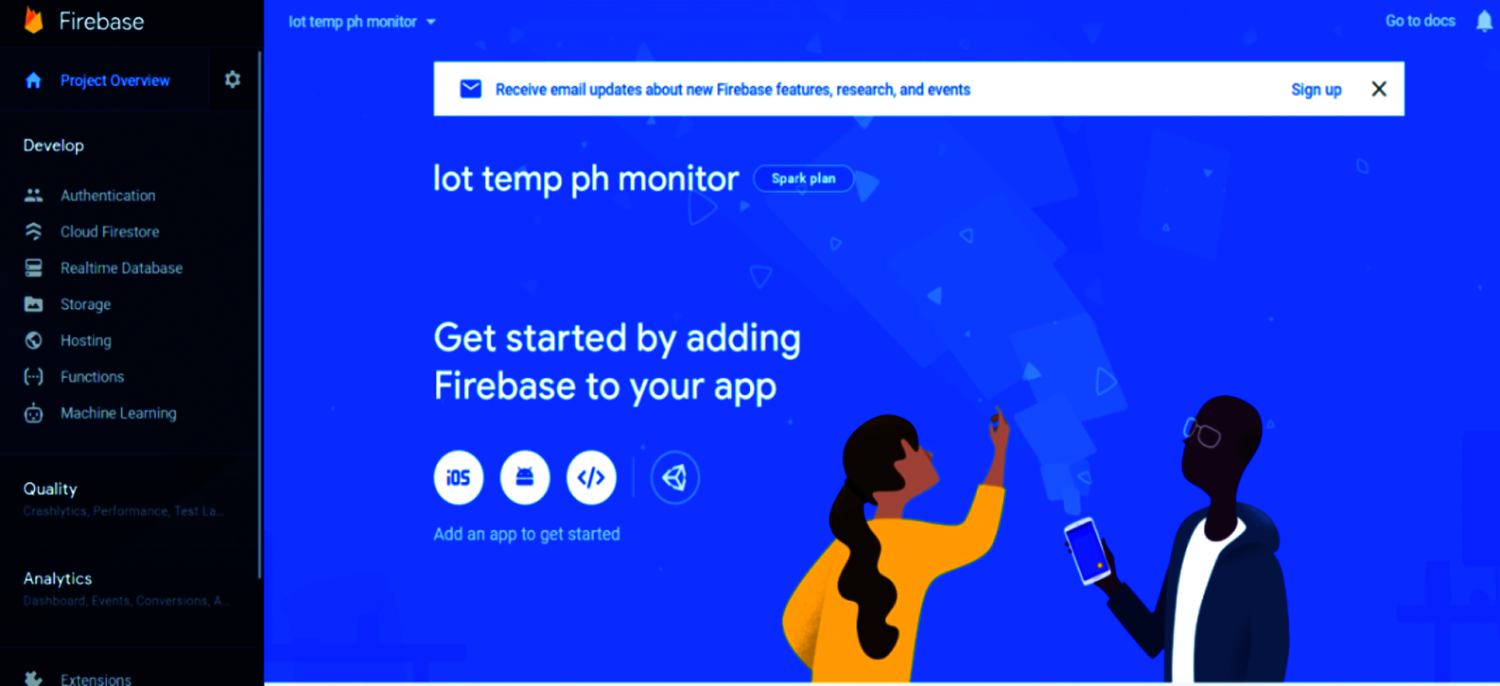
Figure 9: Google firebase
Figs. 10a and 10b shows the final prototype of the proposed system. All of the equipment is connected together and attached to a board: see Fig. 10a. Here a switch is used to control the power supply. It is connected with the 12 V battery. Because a 12 V input voltage is not required, the LM2596 buck converter is used to reduce the input voltage to 5 V. The ESP-12E module receives this 5 V and starts to collect data from the pH sensor and temperature sensor. Fig. 10b shows the real-life experiment from where all the values were collected. The device was put in a floatable bowl in a pond. When sensors collect values from the water, the mobile application shows the value. We connected this system with our Android app and went to a pond to measure the value of pH and temperature level of the water.
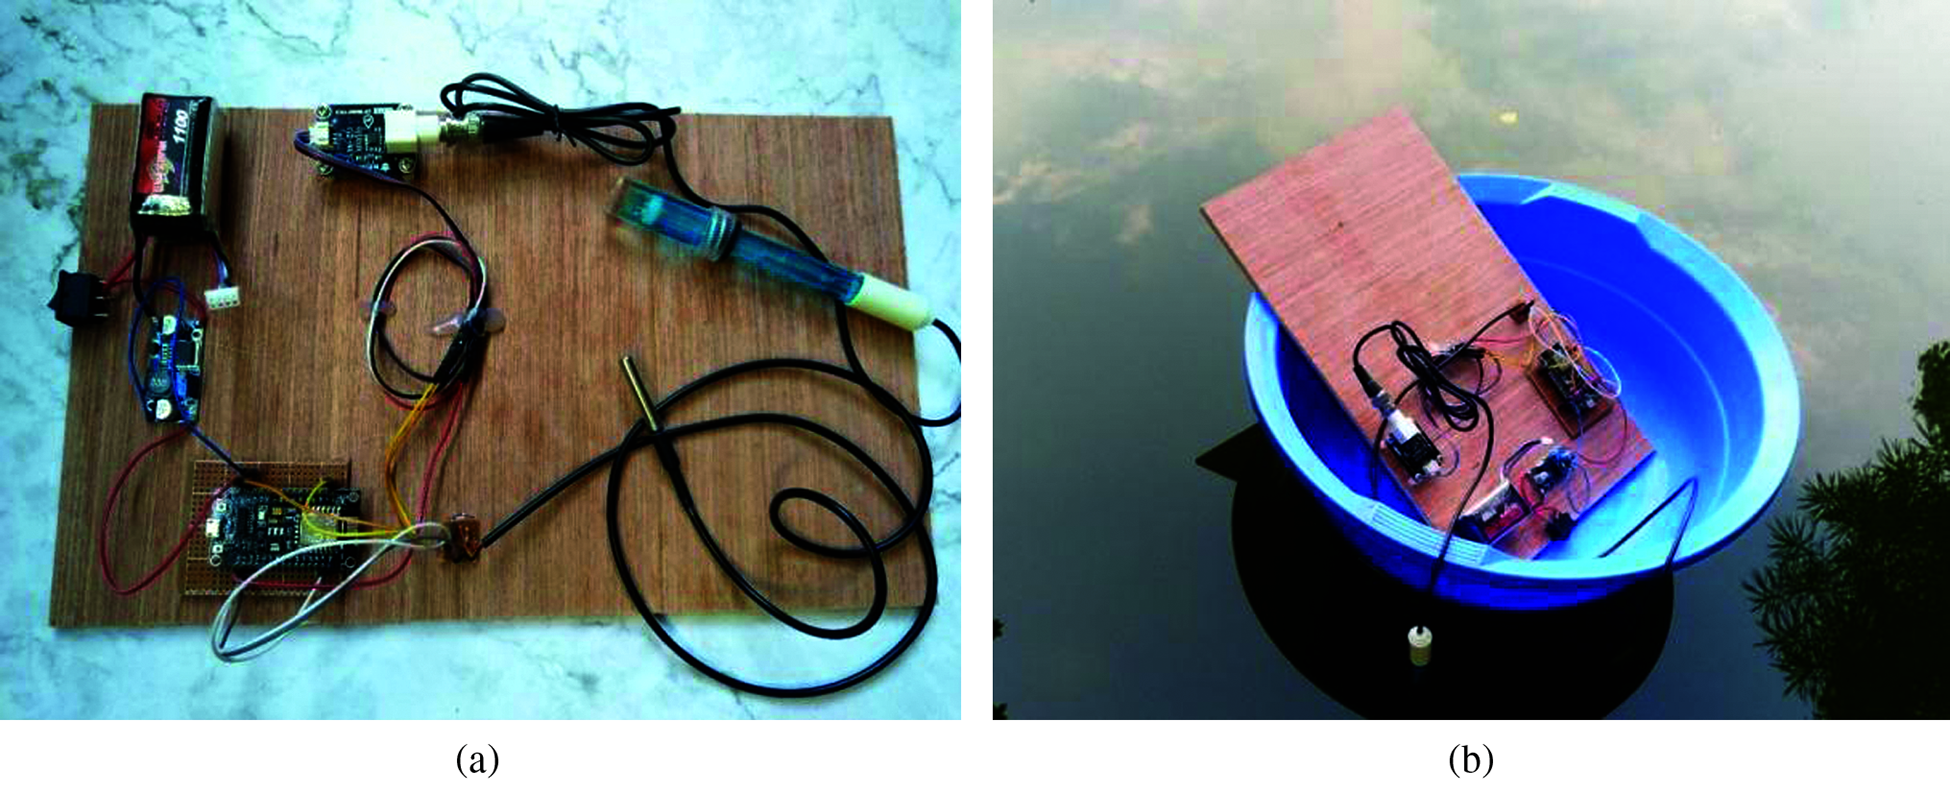
Figure 10: IoT based monitoring system: (a) Shows the device, which shows the connecting equipment and (b) is the real-life experiment of the device in which the device is measuring the water of a pond
Figs. 11a and 11b shows the measured result of pH level of the water and the mobile application interface that shows the measured value. To measure the pH value of water, a pH sensor is needed to put it into the water. This sensor will collect the value from water and transfer it to the application through a Wi-Fi module. This value will be shown in the pH section of the application. Normally, the pH scale ranges from 6.5 to 8.5 and is suitable for fish production. Here, the pH value of that pond’s water was 7.03, which is suitable for fish production. In this water, fish will be safe and healthy as the pH of this water is perfect. Because this is the standard pH level, fishermen can cultivate fish in that pond.

Figure 11: (a) The result of pH level in water and (b) The interface of the application showing the value
3.1.2 Results of Temperature Sensor
A temperature sensor is needed to put it into the water to get the temperature value. It will collect the value from water and transfer it to the application through a Wi-Fi module. This value will be shown in the temperature section of the application. In this experiment, the temperature of that water was 27.8125°C which is suitable for fish production. In this water, fish will be safe and healthy as the pH of this water is perfect. Different types of fish need different temperatures. The temperature of that water is shown in Fig. 12.

Figure 12: (a) The result of water temperature and (b) The interface of the application showing the value Note: We got the value temperature was 27.8125°C. It is the standard temperature for cultivating the fish in the water body
3.2 Application Development and Kit Solutions
Fig. 13 shows the homepage interface of the mobile application which has been developed for the system. This is the home page of the application. There are four parameters displayed here. After clicking on each parameter, the value or color code will be shown by the user. For pH and temperature, the user can see the value of level and dissolved oxygen and dissolved ammonia; the user will find a color code that has to match the solution from the kit.
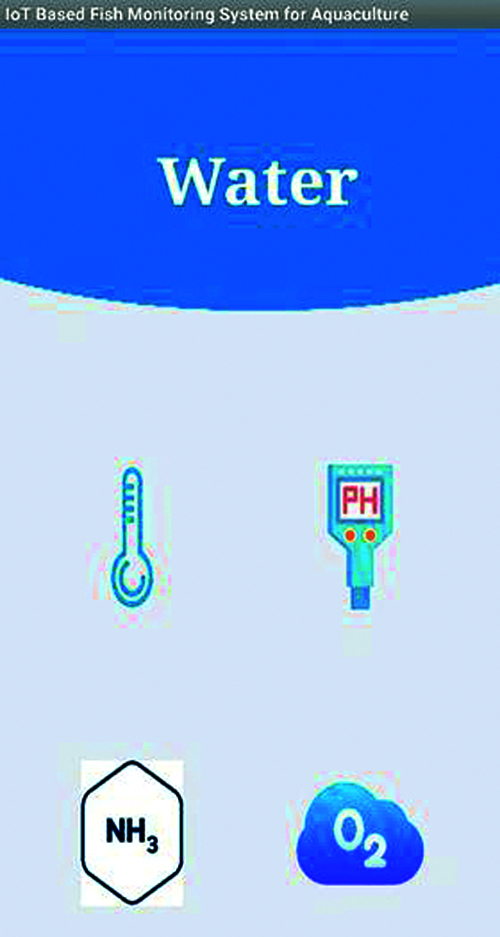
Figure 13: Homepage interface of the application which we are using for the device
3.2.2 Results of Dissolved Oxygen Tests
5 ml of water was placed in a jar to measure the dissolved oxygen, and 5 drops of test solution chemical 1 and test solution chemical 2 were added to the jar. After mixing the solutions with water, it was left for 4–5 min to change the color of the water. When the color of the water changed, the dissolved oxygen section in our mobile application was needed to open and match the color of the water in the jar with the color chart in the application (Fig. 14). After matching, it was found that the dissolved oxygen level of the water was between 6–7. If the level is low, then the color will be light, and the level will be less.
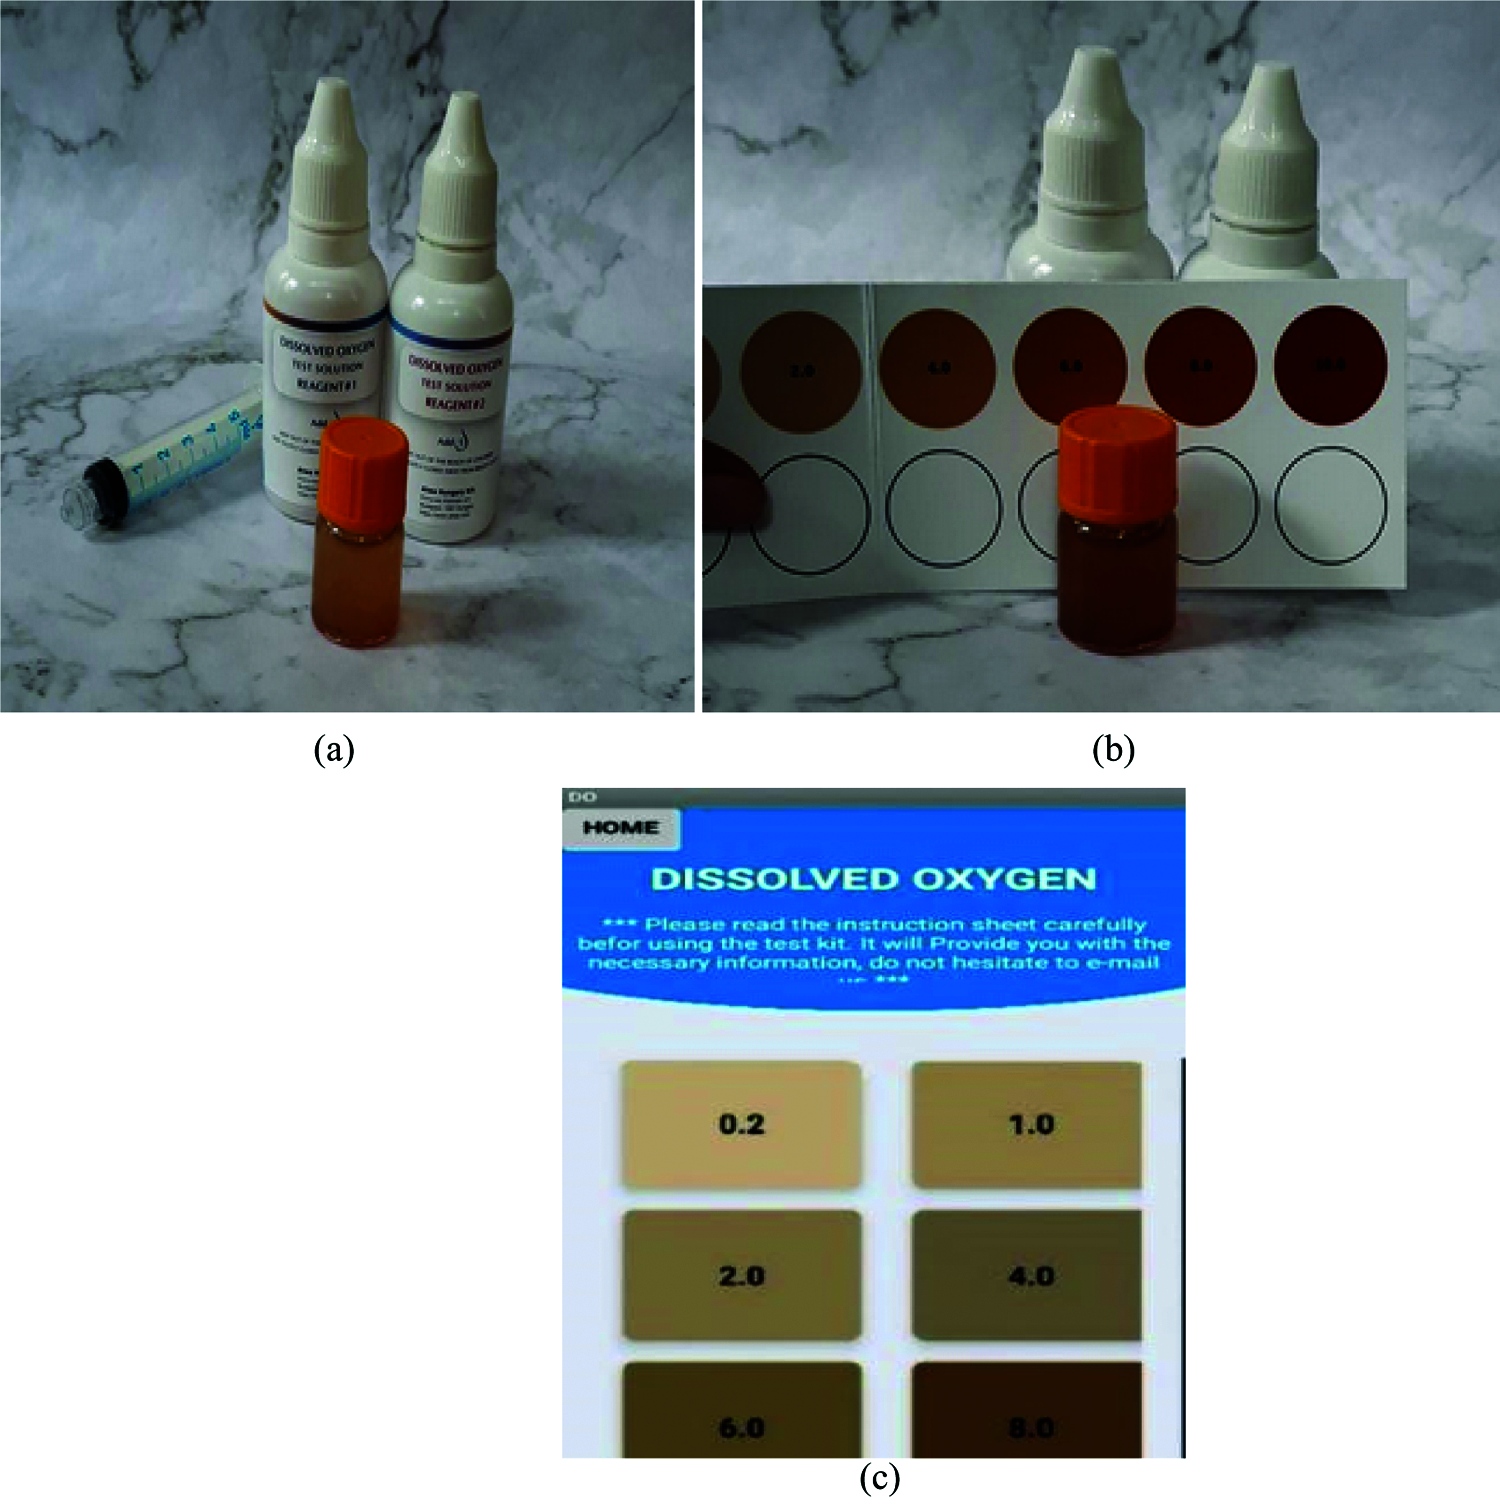
Figure 14: Result of dissolved oxygen (a) is the solution made by the Kit, (b) is the solution with the matching with the provided color code and (c) Shows the interface of the application of the color code
3.2.3 Results of Ammonia Tests
To measure the ammonia level of the water, 2 ml of water was taken in a jar, and 4 drops of test solution chemical 1, test solution chemical 2 and test solution chemical 3 were added to the jar (see Fig. 15). After mixing the solutions with water, it was left for 4–5 min to change the color of the water. When the color of the water changed, the ammonia section in our mobile application needed to open and match the color of the water in the jar with the color chart in the application. After matching, it was found that the ammonia level of the water was around 0.25 ppm. Water is healthy as long as the level is below 1 ppm. When the ammonia level is above 1 ppm, the water will not be safe for fish.
As this device is made for monitoring fish production, fishermen can get help from this device and application. It will give information about the quality of water. If the water of a pond is not healthy enough for fish production, fishermen will know it before starting fish farming. Healthy water is important for fish to grow, so it’s necessary to check the water quality. This device is cheap, and it is not complicated, so anyone can use it.

Figure 15: Result of dissolved ammonia, (a) is the solution made by the kit, (b) is the solution with the matching with the provided color code, (c) Shows the interface of the application of the color code
The result obtained from the device by using the application is information about the pH and temperature of the water body where the fisherman will cultivate fish. The device can put the sensors in the water, and the application will show the value of pH and temperature. The other two components, dissolved oxygen and ammonia level, will be observed by using the test kit solutions. The solutions will create color, and the color will be matched with the color chart given in the application. By that, the users will know about the amount of dissolved oxygen and ammonia in the water body. Tab. 2 shows the comparison between our system and other solutions given on the existing part.

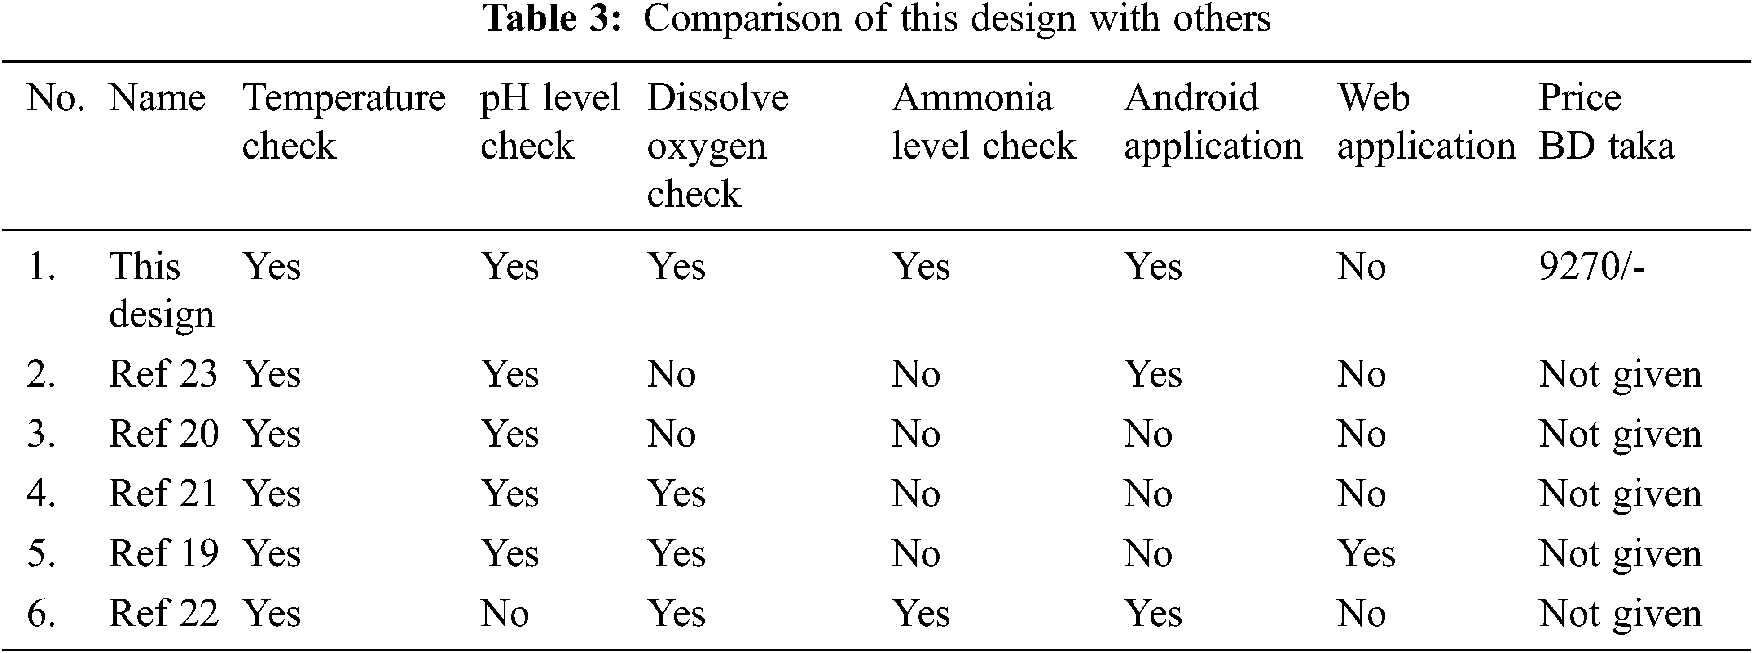
The fish monitoring system for aquaculture is such a helping hand for people because it is easy to access and an automated monitoring system at a reasonable cost. The use of low-cost and available sensors makes the application reasonable and easy to access. We have looked at some existing papers worked by others on this related topic. There are similarities and dissimilarities between them. But we worked for the best way to provide fish a healthy life. Tab. 3 shows a comparison of the system of this paper and others. From Tab. 3, it is observed that the proposed system in this research has temperature, pH level, dissolve oxygen, and ammonia level measuring sensors. In addition, this system has an android mobile application where other available systems in the literature do not have all the features. This proposed system is very cost-efficient as well: see Tab. 3.
This proposed system will be sustainable because it will help users understand the water parameters and take the necessary steps to keep the water at a standard level so that fish can be healthy and easily give birth to more fish. This system may help a lot to produce a large number of fish. Fisheries and people in their field will greatly benefit if users keep these devices and the app on their Android phones. If they do so, they will get a huge increase in the production of fish in their pond or cage. Fig. 16 provides global fishing production from 1980–2022 [35].
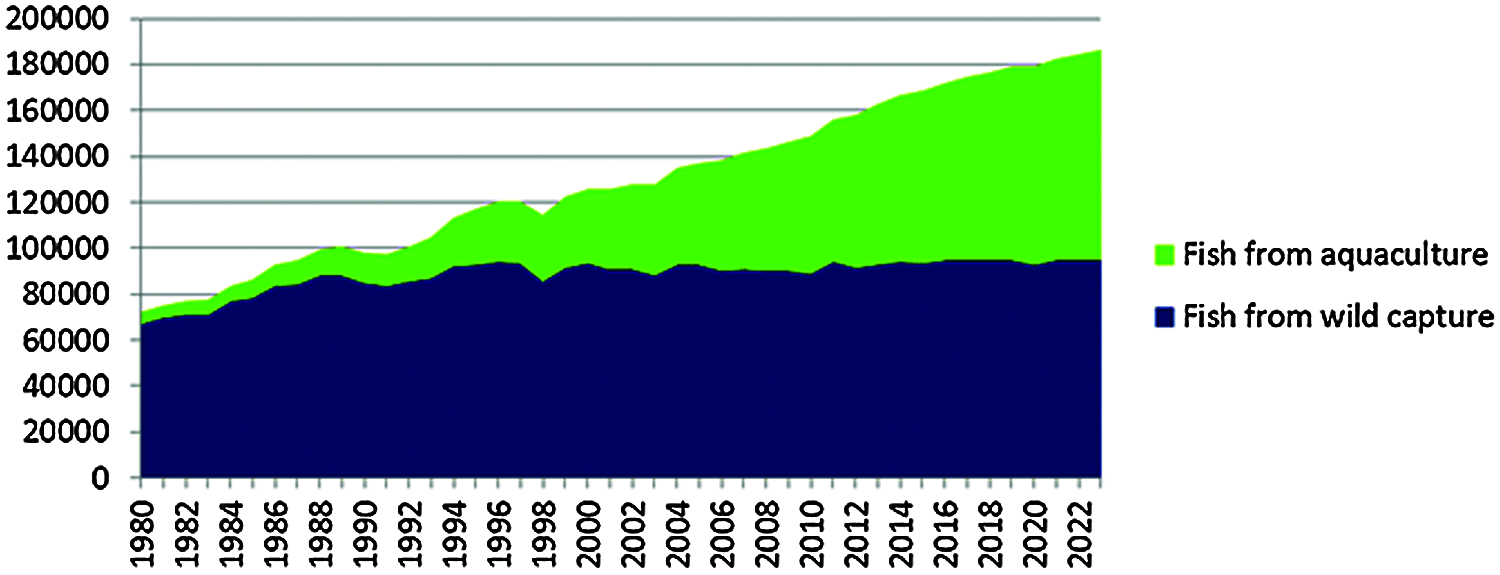
Figure 16: Global fisheries production 1980–2022 [33]
The above graph shows the daily impact of aquaculture on our society and country. The proposed system has a great potential to improve the aquaculture environment for fishing. Furthermore, the economic potentials are enormous as the proposed system will augment the efforts of fish farmers to produce higher yields. This system is saving the lives of fish by assuring the perfect water for their healthy life and so the user gets more and more fish. They can sell the fish in the market and earn more money. Also, they can contribute to the national economy by exporting fish to other countries. This device will be helpful to all people who are closely or remotely involved in aquaculture. The limitation of this system is that it does not currently have android mobile application features. In the future, integration of iOS-based mobile applications may be considered.
This paper proposes an IOT-based aqua culture system to improve and monitor the quality of water for the fishing industry. In this research, the following important parameters have been considered, such as: the suitable temperature, pH level, quality supply of oxygen, and dissolved ammonia level. It is believed that the proposed system will make the aquatic environment more profitable, productive, and sustainable. This will make an enormous contribution to the health and the economy in Bangladesh. The government should take good care of this sector by investing, making strict environmental policies, and creating reliable communication between the farmers, fishermen, and other people related to this sector. To tackle the huge fish demand for the booming population in Bangladesh. Also, we need to focus on the things that are harming the aquatic environment for the proper development of the fish. For the whole research, the main concern was to secure fish health for more production of fish. For this purpose, an IoT based fish monitoring system was built to check the necessary elements’ measurements and ensure whether the fish are healthy or getting all the necessary things for a happy life. By this system, fisheries will know the level of oxygen or ammonia or pH and temperature and provide the equipment to maintain equilibrium level. Thus, the fish will grow healthy.
In the future, we intend to make the device check more parameters and also to provide the necessary equipment to maintain proper health for fish. We are also thinking of providing knowledge to the fish farmers to maintain fish health properly. With this system, iOS based mobile applications can be integrated in the future.
Acknowledgement: Authors would like to thank for the support from Taif University Researchers Supporting Project number (TURSP-2020/211), Taif University, Taif, Saudi Arabia.
Funding Statement: Taif University Researchers Project number (TURSP-2020/211), Taif University, Taif, Saudi Arabia.
Conflicts of Interest: The authors declare that they have no conflicts of interest to report regarding the present study.
1. National Oceanic and Atmospheric Administration, “What is aquaculture,” 2011. [Online]. Available: https://www.noaa.gov/stories/what-is-aquaculture. [Google Scholar]
2. B. Jana and D. Sarkar, “Water quality in aquaculture impact and management: A review,” The Indian Journal of Animal Sciences, vol. 75, no. 11, pp. 1354–1361, 2005. [Google Scholar]
3. Fisheries Resources Survey System, “Fisheries statistical report of Bangladesh, department of fisheries,” 2018. [Online]. Available: https://fisheries.portal.gov.bd/sites/default/files/files/fisheries.portal.gov.bd/page/4cfbb3cc_c0c4_4f25_be21_b91f84bdc45c/Fisheries%20Statistical%20Yearboook%202017-18.pdf. [Google Scholar]
4. Fisheries Resources Survey System, “Fisheries statistical report of Bangladesh, department of fisheries, Bangladesh,” 2015. [Online]. Available: https://drive.google.com/file/d/0B6XjGVIRbmt0ME5lcXhQMzdHZlk/view. [Google Scholar]
5. Finance Division, Ministry of Finance Bangladesh, “Bangladesh economic review 2014,” 2014. [Online]. Available: https://mof.gov.bd/site/page/44e399b3-d378-41aa-86ff-8c4277eb0990/BangladeshEconomicReview. [Google Scholar]
6. Fisheries Resources Survey System, Department of Fisheries, Bangladesh, “Yearbook of fisheries statistics of Bangladesh,” 2017. [Online]. Available: http://ganges.bengaldelta.net/resources/year_book/17.pdf. [Google Scholar]
7. Department of Fisheries, Ministry of Fisheries and Livestock, “Annual report 2015,” 2015. [Online]. Available: http://www.fisheries.gov.bd/sites/default/files/files/fisheries.portal.gov.bd/annual_reports/f315fb1a_7262_4f0a_80fe_3baa8a62a73b/Annual_Report_2015.PDF. [Google Scholar]
8. Ceicdatacom, “Bangladesh exports: Fish and prawns economic indicators,” 2020. [Online]. Available: https://www.ceicdata.com/en/bangladesh/trade-statistics-exports-by-commodity-bangladesh-bank/exports-fish-and-prawns. [Google Scholar]
9. Bangladesh Foreign Trade Institute, “Study on sector-based need assessment of business promotion council-fisheries products,” 2016. [Online]. Available: http://www.bfti.org.bd/pdf/Fishery.pdf. [Google Scholar]
10. M. M. Shamsuzzaman, M. M. Islam, N. J. Tania, M. A. A. Mamun, P. P. Barman et al., “Fisheries resources of Bangladesh: Present status and future direction,” Aquaculture and Fisheries, vol. 2, no. 4, pp. 145–156, 2017. [Google Scholar]
11. M. Shamsuzzaman, M. H. Mozumder, S. Mitu, A. Ahamad and M. Bhyuian, “The economic contribution of fish and fish trade in Bangladesh,” Aquaculture and Fisheries, vol. 5, no. 4, pp. 174–181, 2020. [Google Scholar]
12. R. Farm, “Fish farming in Bangladesh: Full business guide for beginners,” 2021. [Online]. Available: https://www.roysfarm.com/fish-farming-in-bangladesh/. [Google Scholar]
13. A. J. Horne and C. R. Goldman, Limnology, 2nded., New York, USA: McGraw-Hill, Inc., 1994. [Online]. Available at: https://www.worldcat.org/title/limnology/oclc/647368081. [Google Scholar]
14. M. C. D. Belen and F. R. G. Cruz, “Water quality parameter correlation in a controlled aquaculture environment,” in Proc. IEEE 9th Int. Conf. on Humanoid, Nanotechnology, Information Technology, Communication and Control, Environment and Management, Manila, Philippines, pp. 1–4, 2017. [Google Scholar]
15. L. K. S. Tolentino, C. P. D. Pedro, J. D. Icamina, J. B. E. Navarro, D. J. L. Salvacion et al., “Development of an IoT-based intensive aquaculture monitoring system with automatic water correction,” International Journal of Computing and Digital Systems, vol. 20, no. 2210, pp. 1–11, 2020. [Google Scholar]
16. A. A. D. Raj, V. K. Swasthik, A. Rakesh and D. M. Sanavanaraj, “Arduino based fish monitoring system,” International Journal of Scientific & Engineering Research, vol. 11, no. 7, pp. 1622–1627, 2020. [Google Scholar]
17. Z. Harun, E. Reda and H. Hashim, “Real time fish pond monitoring and automation using Arduino,” IOP Conf. Series: Materials Science and Engineering, vol. 340, no. 218, pp. 1, 2017. [Google Scholar]
18. N. Rosaline and S. Sathyalakshimi, “IoT based aquaculture monitoring and control system,” Journal of Physics: Conf. Series, vol. 1362, no. 2019, pp. 1–7, 2019. [Google Scholar]
19. S. Saha, R. H. Rajib and S. Kabir, “IoT based automated fish farm aquaculture monitoring system,” in Proc. Int. Conf. on Innovations in Science, Engineering and Technology, Chittagong, Bangladesh, pp. 201–206, 2018. [Google Scholar]
20. A. K. Poddar, A. A. Bukhari, S. Islam, S. Mia, M. A. Mohammed et al., “IoT based smart agrotech system for verification of urban farming parameters. Microprocessors and microsystems,” Microprocessors and Microsystems, vol. 82, no. 104025, pp. 1–10, 2021. [Google Scholar]
21. P. Singh, R. S. Raw, S. A. Khan, M. A. Mohammed, A. A. Aly et al., “W-GeoR: Weighted geographical routing for VANET’s health monitoring applications in urban traffic networks,” IEEE Access, vol. 2021, no. 3092426, pp. 1–19, 2021. [Google Scholar]
22. Yokogawa Electric Corporation, “pH in fish farming,” 2016. [Online]. Available: https://www.yokogawa.com/library/resources/application-notes/ph-in-fish-farming/. [Google Scholar]
23. C. E. Boyd, “Water temperature in aquaculture,” 2018. [Online]. Available: https://www.aquaculturealliance.org/advocate/water-temperature-in-aquaculture/. [Google Scholar]
24. C. E. Boyd, “Ammonia nitrogen dynamics in aquaculture,” 2018. [Online]. Available: https://www.aquaculturealliance.org/advocate/ammonia-nitrogen-dynamics-in-aquaculture/. [Google Scholar]
25. USGS Water Science School, “pH and water,” 2002. [Online]. Available: https://www.usgs.gov/special-topic/water-science-school/science/ph-and-water?qt-science_center_objects=2#qt-science_center_objects. [Google Scholar]
26. Lenntech, “Effects of acids and alkalis on aquatic life,” 2020. [Online]. Available: https://www.lenntech.com/aquatic/acids-alkalis.htm?fbclid=IwAR1Tz3BCBKusn9Y82Bn2O7luf5Aku1elmp2B6WBOcd5RDR5Brkp6eIhXotY. [Google Scholar]
27. Dfrobot, “Analog pH sensor/meter kit V2,” 2021. [Online]. Available: https://www.dfrobot.com/product-1782.html. [Google Scholar]
28. ePal, “DS18B20 waterproof temperature sensor,” 2020. [Online]. Available: https://www.epal.pk/product/ds18b20-stainless-steel-probe-waterproof-temperature-sensor/. [Google Scholar]
29. VSEC Professional Sensor Manufacturer, “Waterproof Ds18b20 temperature sensor,” 2020. [Online]. Available: https://www.vsec.top/product/waterproof-ds18b20-temperature-sensor/. [Google Scholar]
30. ITEAD, “ESP8266 module ESP12E nodemcu LUA wifi development board,” 2020. [Online]. Available: https://www.itead.cc/esp-12e-nodemcu-lua-wifi-development-board.html. [Google Scholar]
31. Microcontrollers Lab, “ESP12E pinout, interfacing with Arduino, applications, features, examples,” 2020. [Online]. Available: https://microcontrollerslab.com/esp12e-wifimodule-pinout-arduino-interfacingexamples/. [Google Scholar]
32. Information Systems and Technology, “Software distribution,” 2020. [Online]. Available: https://ist.mit.edu/software. [Google Scholar]
33. E. W. Patton, M. Tissenbaum and F. Harunani, MIT app inventor: Objectives, design, and development. In: Computational Thinking Education. Singapore: Springer, 2019. [Online]. Available at: https://link.springer.com/chapter/10.1007/978-981-13-6528-7_3#citeas. [Google Scholar]
34. Firebase, “Firebase real-time database-store and sync data in real time,” 2020. [Online]. Available: https://firebase.google.com/products/realtime-database?gclid=Cj0KCQjwpdqDBhCSARIsAEUJ0hOYvX2R0cE4bBZqw25qzpo1M9DAEmu5RBwQpo1Arben-rBl84TV9MoaAoy3EALw_wcB&gclsrc=aw.ds. [Google Scholar]
35. OECD-FAO Agricultural Outlook, “Fisheries-OECD-FAO agricultural outlook 2014–2023,” 2021. [Online]. Available: https://stats.oecd.org/index.aspx?queryid=58653. [Google Scholar]
 | This work is licensed under a Creative Commons Attribution 4.0 International License, which permits unrestricted use, distribution, and reproduction in any medium, provided the original work is properly cited. |