DOI:10.32604/iasc.2022.021696
| Intelligent Automation & Soft Computing DOI:10.32604/iasc.2022.021696 | |
| Article |
Machine Learning for Modeling and Control of Industrial Clarifier Process
1Department of Mechatronics, Jyothi Engineering College, Thrissur, 679531, India
2Department of Computer Science, Dambi Dollo University, Dambi Dollo, 260, Ethiopia
3Department of Mechanical Engineering, Theni Kammavar Sangam College of Technology, Theni, 625534, India
4COMBA I+D Research Group of Universidad Santiago de Cali, 760036, Colombia
5Al-Nahrain Nano renewable Energy Research Center, Al-Nahrain University, Baghdad, 10001, Iraq
*Corresponding Author: C. Karthik. Email: karthikmtech86@gmail.com
Received: 11 July 2021; Accepted: 17 August 2021
Abstract: In sugar production, model parameter estimation and controller tuning of the nonlinear clarification process are major concerns. Because the sugar industry’s clarification process is difficult and nonlinear, obtaining the exact model using identification methods is critical. For regulating the clarification process and identifying the model parameters, this work presents a state transition algorithm (STA). First, the model parameters for the clarifier are estimated using the normal system identification process. The STA is then utilized to improve the accuracy of the system parameters that have been identified. Metaheuristic algorithms such as Genetic Algorithm (GA), Particle Swarm Optimization (PSO), and State Transition Algorithm are used to evaluate the most accurate model generated by the algorithms. By capturing the principal dynamic features of the process, the clarifier model produced from State Transition Algorithm (STA) acts more like the actual clarifier process. According to the findings, the controllers provided in this paper may be used to achieve greater performance than the standard controller design during the control of any nonlinear procedure, and STA is extremely helpful in modeling a nonlinear process.
Keywords: Sugar industry; clarifier process; pH neutralization; system identification; genetic algorithm; particle swarm optimization; state transition algorithm
The main and basic requirement of sugar processing is a quality product with an acceptable economic benefit. The various stages are involved in modern technology to prepare sugar, whereas; clarification is the key part to ensure the quality of the product. Additionally, the clarification process of sugar industry influences the fundamental properties like pH, crystallization, drying, etc. It is necessary to control the pH to attain the quality outcome which can be succeeded with proper modeling of the process. The cane stalk processing in sugar industry makes affects the quality of raw sugar and clarification process efficiency and performances [1–3]. Due to the lower quality of clarified juice, the evaporation process is affected, and the probability of sucrose loss to molasses is increased by pan. Many of the researchers have published a considerable work on the impact of trash on sugar cane stalk processing [4–8], Coagulation and flocculation behaviour of the juice particles are focused by few researchers [9–11]. The extracted juice is often dark green in colour with the pH of 5–5.5 [12]. The addition of lime milk to the juice brings the pH value to about 12, further heating the juice to obtain the clarified juice. The pH should be neutralized in order to avoid the inversion of sucrose during settling. In the last stage, the pH value of the treated juice is kept at 6.9–7.5, resulting in dark-coloured juice and increased viscosity. The low pH of the treated sucrose juice is determined by the quantity of precipitated calcium phosphate and the calcium content of the clarified sucrose juice.
The importance of effective juice clarification to improve the efficiency, performances and production of quality raw sugar by developing the effective modeling and controller design is discussed [13]. Therefore, it is necessary to study effective modeling and control using optimization methods in sugar cane juice to obtain an understanding of the clarification processes of cane juice.
The primary aim of this paper is to understand the clarification process and to design the model with the information obtained from the clarification process. An investigation to understand the mechanisms of clarification with the effective black-box modeling and to design the optimum clarification control design will provide quality output with the optimized control strategies. Optimized clarification with the effective control design helps to filter all possible non-sugars, organic and inorganic, and the preservation of the maximum sucrose and reducing sugars possible in clarified juice.
A complex process like the clarification process needs the controller to react immediately by finding the optimal solution. The PSO and GA have the optimal solution faster, in PSO, it may get premature convergence and has a poor local optimization ability [14–16]. The GA has high robustness and good global search ability [17]. In the solution space, it can search quickly for all the solutions and will not get stuck in local traps. The implementation of its coding, however, is relatively complex, and the selection and setting of some parameters depend mostly on experience.
Recently, an emerging stochastic optimization method is proposed called STA [18]. State and its solution transformation are considered for an optimization of the problem. The candidate solution can be produced in an integrated framework and the parameters involved in the process is expressed as state transition matrices. Four operators of STA are rotation, translation, expansion, and Axesion. These operators have a feature that helps to increase the searching ability in both global and local searches.
The solutions are searched in a given radius of hypersphere by the rotation operator whereas the expansion operator searches the solution in the whole space which may represent local and global search of operators. The major merits of this STA based optimization are the operators can be manipulated based on the demands since it has adaptability and high searching ability have been observed while reviewing the other global stochastic optimization algorithms [19]. The State Transition Algorithm (STA) has been proposed in this research paper. STA is a technique that can easily escape the optimal local challenges.
2 The Clarification Process at a Sugar Plant
The various stages are available in sugar production where clarification is one of the key parts which will decide the quality of the final product. The clarification process removes many of the impurities mixed with the draft juice, and it is extracted from the sugar cane. The major objective of this process is the removal of maximum non-sugar content, such that sucrose recovery will increase. The process flow chart is shown in Fig. 1.
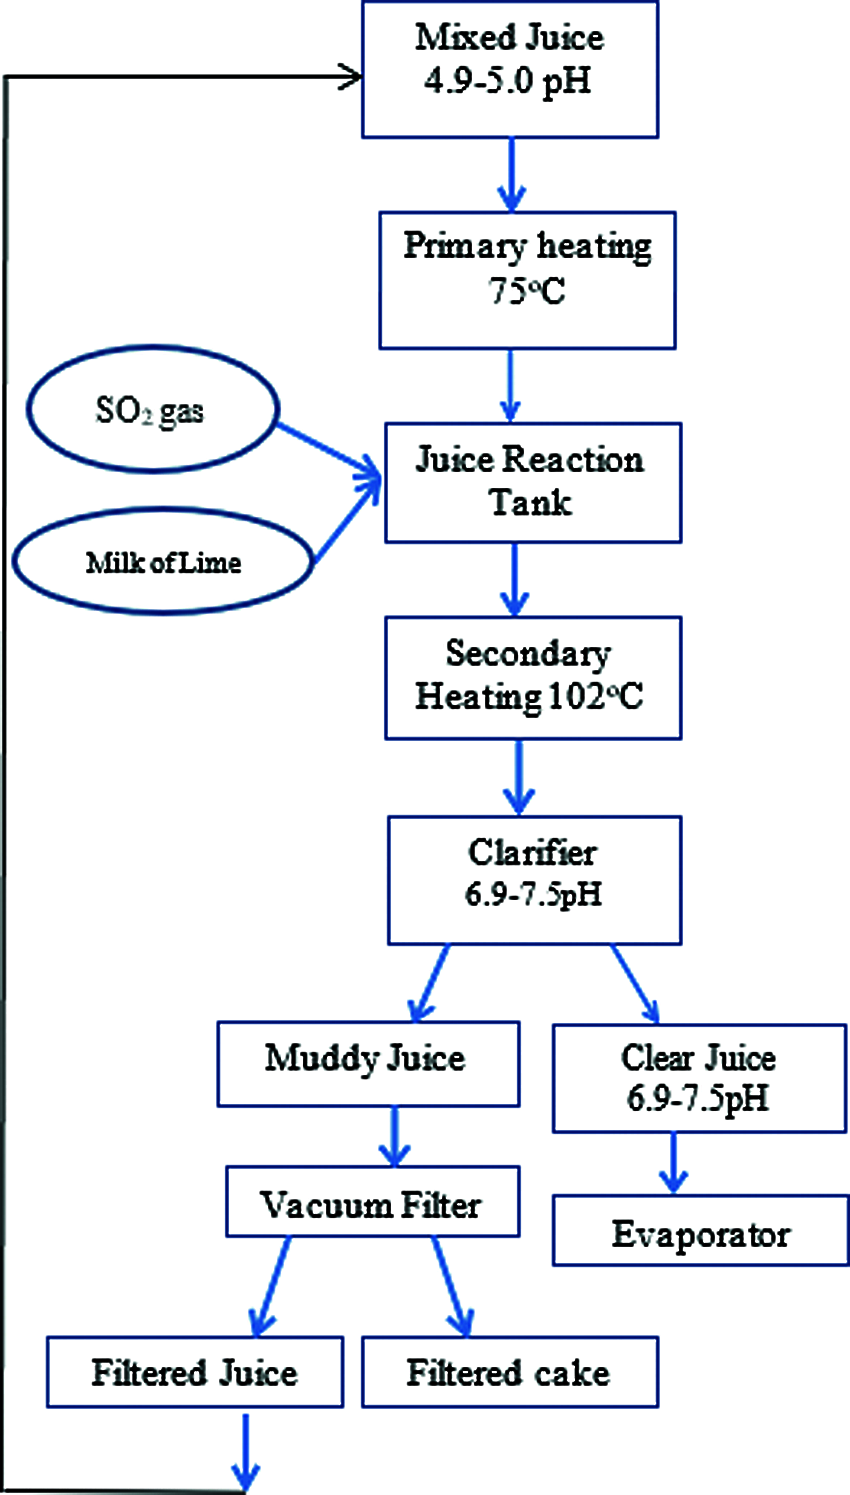
Figure 1: Clarifying process flow diagram
After this juice is ready for clarification, the juice extract is strained from the cane to remove dirt particles, fibre, or pulp. The goal of clarification is to free the juice from all constituents, except sugar, as far as possible without altering the sugar itself. The universal basis for this clarification is that lime is one of the first chemicals to be used since it is both efficient and economical. The primary objective of lime is to neutralize juice acidity and turn several organic acids into insoluble calcium salt [20]. Clarification remains, therefore, a necessary and integral part of the production of sugar. The juice is blended in the clarifier tank with the help of a mechanical stirrer. The juice flows at a very low superficial velocity through the clarifier so that the muds settle out and transparent juice exits. There is the sugar content in the mud from the clarifier so it is filtered on rotary vacuum filters where the residual juice is removed and the mud can be washed before discharge. The juice and the water are returned to the process with sugar. The juice from the mills is typically acidic and turbid, with a dark green colour. The clarification (or defecation) process is designed to extract both soluble and insoluble impurities not extracted by preliminary screening (such as sand, soil, and ground rock). Clarification of mixed juice is commonly referred to as the ‘simple defecation process’ in which lime heat and milk are used to produce a clear juice suitable for further processing.
A very significant and popular technique used in the defecation process is the addition of calcium hydroxide with clear juice to maintain the pH value. By incorporating the lime milk into the lime saccharate, the pH value is changed to the desired value. The addition of lime raises the juice’s pH value from 5–5.5 to 6.9–7.5, which is the optimal value. The chemical reaction between the lime and the lime occurs and the inorganic phosphates. Then, with some impurities, the resulting calcium phosphate is recovered and the final clarified juice with the desired pH value is separated. Depending on the form of juice, this addition of lime reacts with the juice. Lime is introduced to the juice when the temperature is around 35°C to 40°C if it is a cold juice, whereas the temperature is 72°C–76°C if the type of juice is intermediate. If the juice is in hot type, then the lime might be added at the temperature of 100°C [20].
The addition of the correct amount of lime is the basis of good clarification in sugar production. If too little lime will give poor settling and cloudy juice with possible losses by inversion and too much lime causes darkening of the juices, increase in gummy substances in low-grade products, increased ash because of dissolved lime salts, and high molasses output. Lime will dissolve in sucrose solution forming calcium saccharate, a true solution, which can be handled with none of the problems of handling slurry [20]. High liming is to be avoided; and if clear juice cannot be obtained by simple defecation except by liming to high alkalinities, the addition of phosphate or some other modification of the process should be employed.
The clarification process is a complex process where the input of base flow rate and the output of pH value is collected from the real plant, and it is further given to linear models such as AutoRegressive with eXternal input (ARX) and AutoRegressive–Moving-Average model with eXogenous inputs model (ARMAX), Box Jenkin (BJ) and Output Error (OE) like a nonlinear model and STA like optimization methods. The performance of the proposed models is simulated using MATLAB. It is run on a Desktop PC. The configuration of the PC is i5–7500T with 4GB RAM.
3.1 Standard System Identification Method to the Clarification Process
Basic linear models ARX and ARMAX are initially selected with the minimum parameters and tested with the collected data. Regarding the maximum fitness obtained from the individual method, the clarification process has been selected, and it is represented mathematically as in, Eq. (1).
From the M/S Sakthi sugars, 6000 sets of input and output data have been collected. In the sugar clarification house at M/s. Sakthi Sugars, the extracted juice from the mill is collected with a pH of around 5 is weighed on a juice weighing scale. Further, the juice is passed through primary juice heaters and heated up to 65o C. The heated juice is treated with the SO2 to a pH of 3–4.5 and again treated with the milk of lime about 40 to 60 L/min to bring the pH of 6.9–7.5 for removal of non-sugar material. The primary disturbances in the clarification process are the sugar juice flow, the juice’s pre-ash pH value, the sulphur strength, and the lime milk capacity. In this thesis, in the case of regulatory performance review, the ability of lime milk is considered to be a disruption to check the efficacy of the proposed controller. The open-loop data on pH and base flow rate is considered for modeling the clarification process and it is shown in Fig. 2. The same data set is further used for identification. For validation and estimation purposes, the total amount of data has been divided into 50% each. The model identified
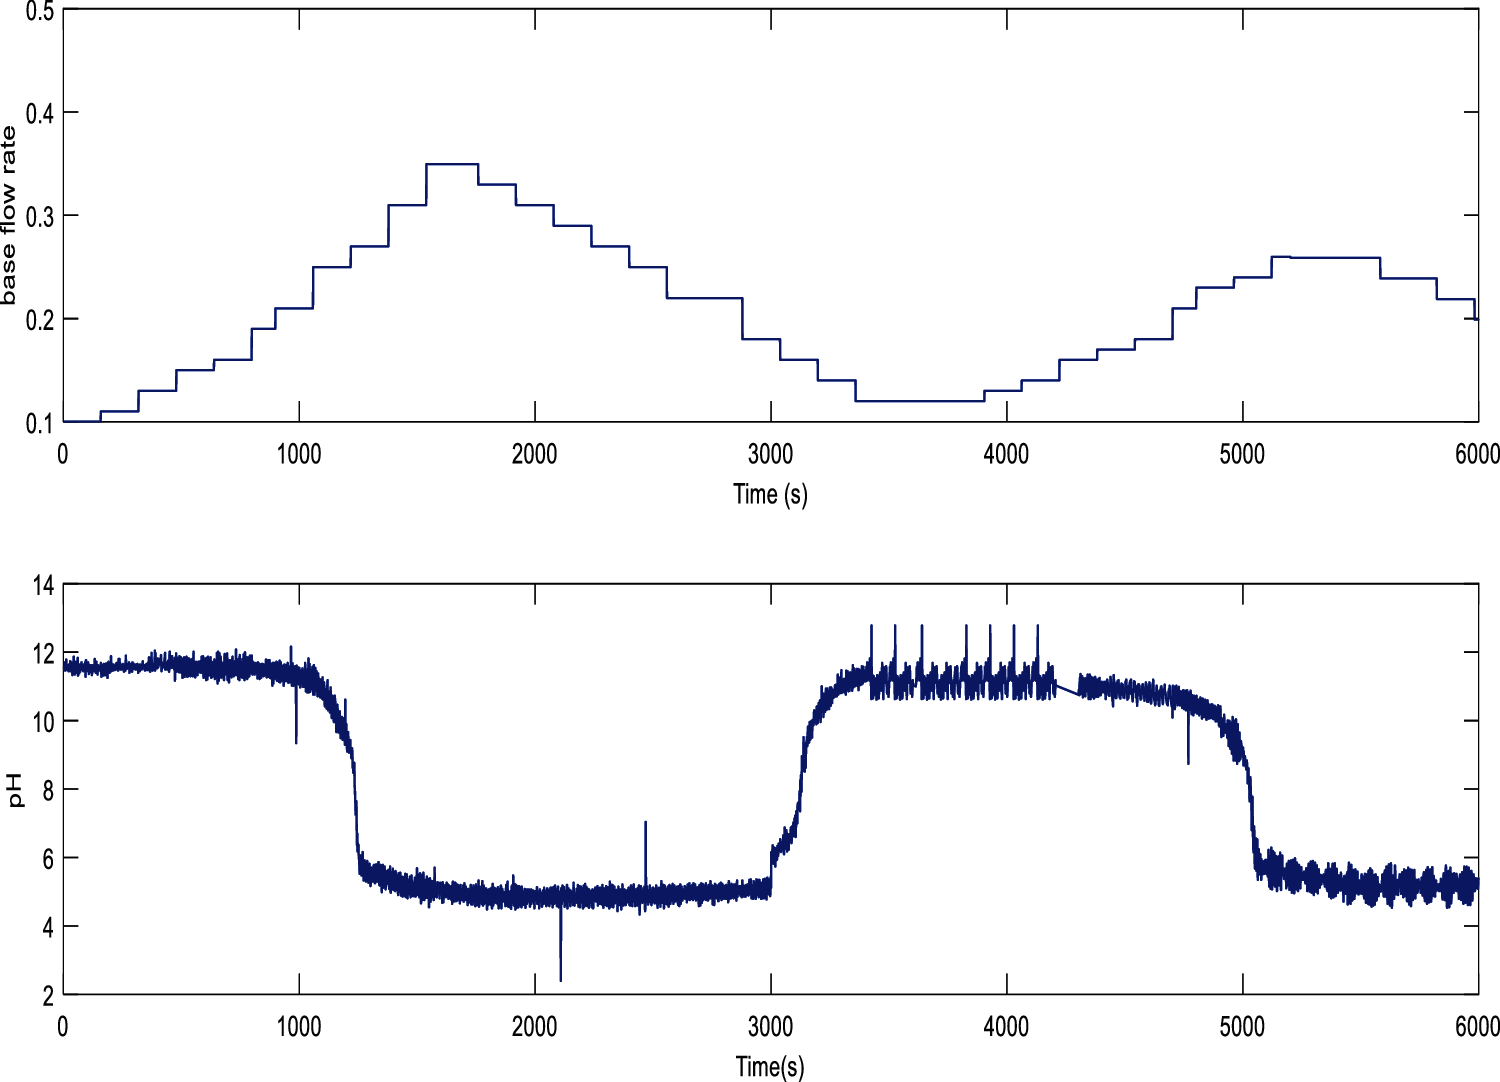
Figure 2: Input and output collection of clarifier process
The validation response is obtained from the standard methods as mentioned earlier, and it is shown from Figs. 3–6.
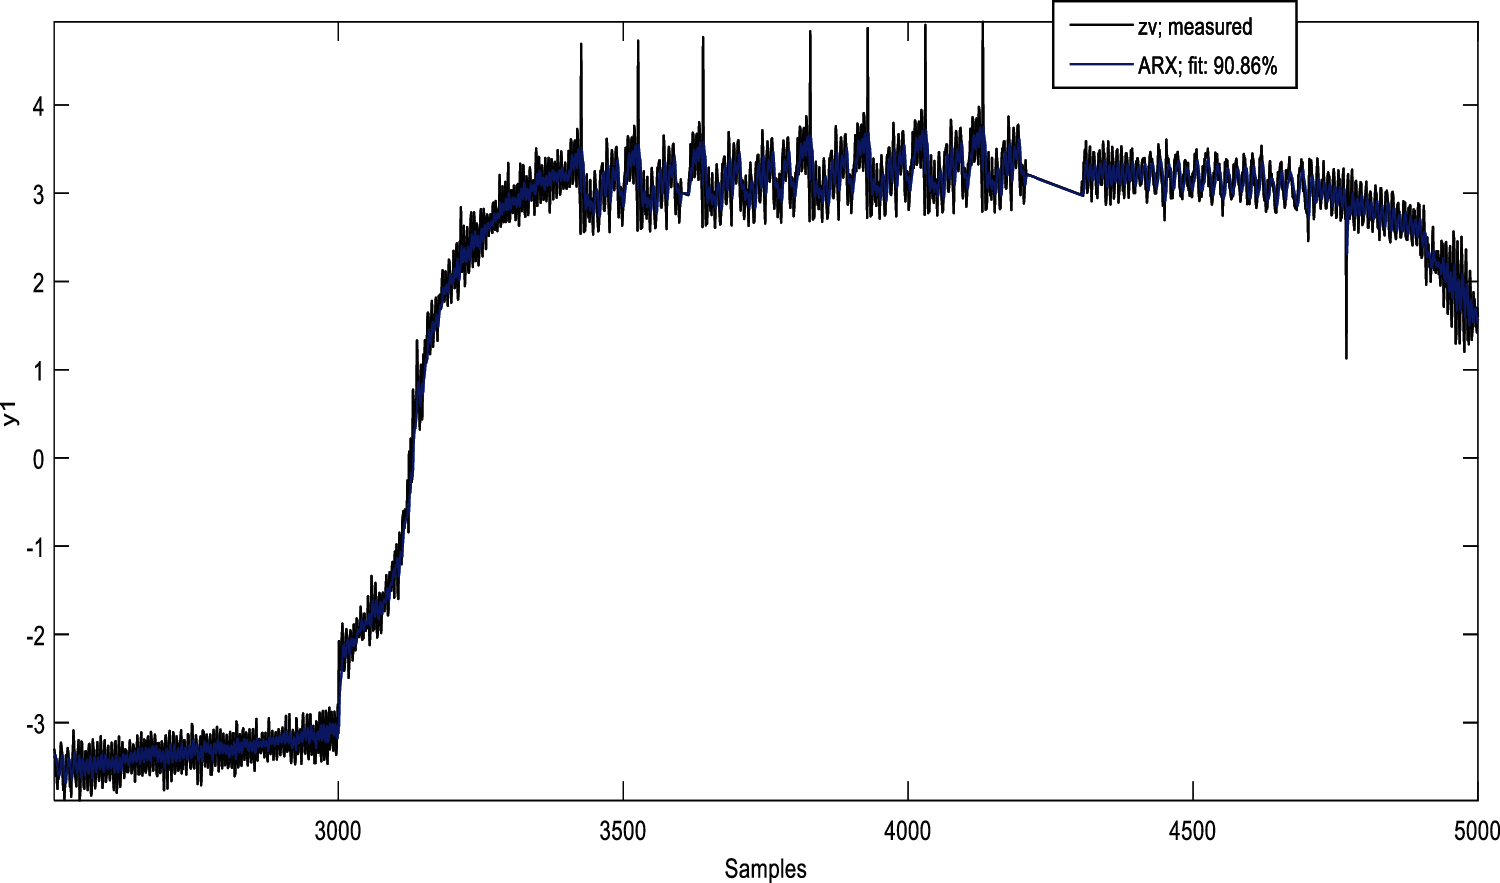
Figure 3: Validation response of ARX model
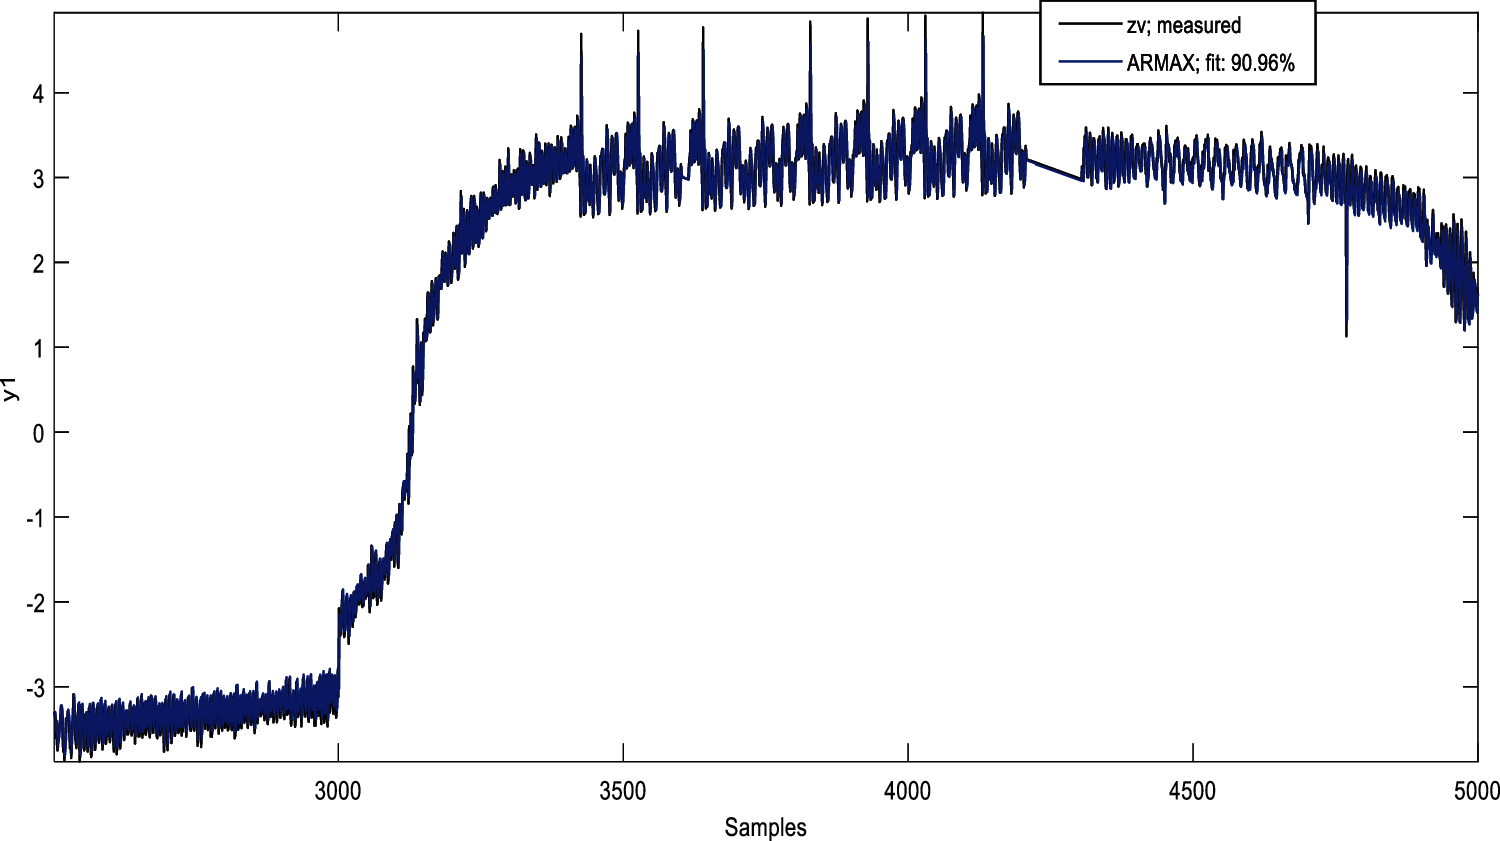
Figure 4: Validation response of ARMAX model
The fitness of the measured and validated model has achieved 90.86 in the ARX model. 90.96 of the ARMAX model is better than the other methods in the linear model. The least fitness of 57.65 is obtained from the OE model. The overall comparison of the linear methods has given a clear picture of the efficiency of ARMAX in the case of model identification of the clarification process.
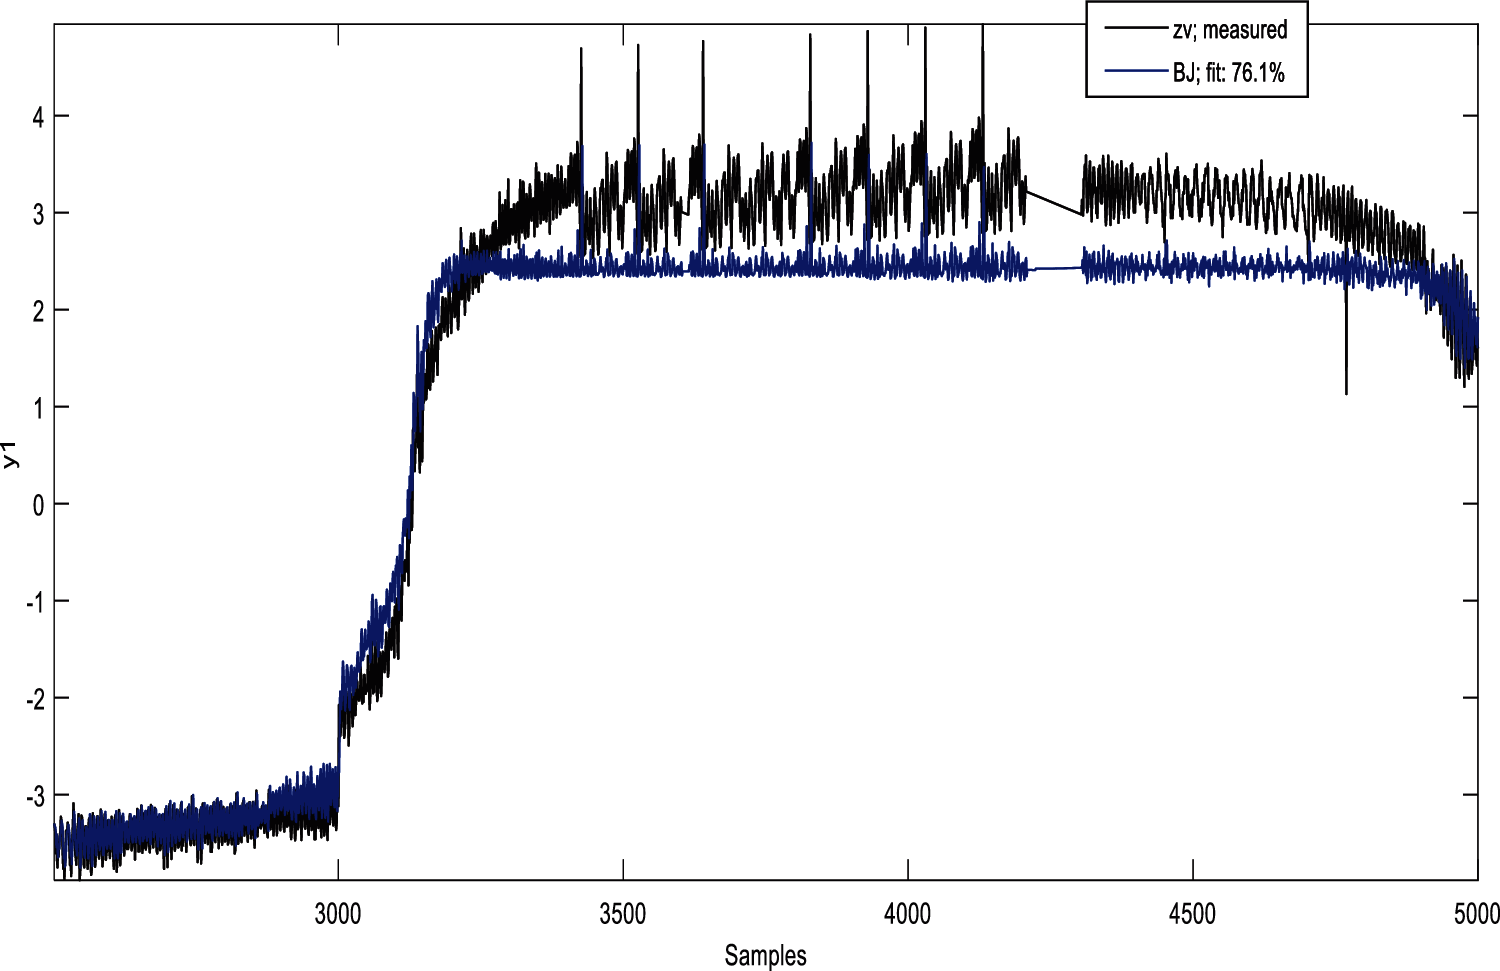
Figure 5: Validation response of box Jenkin model
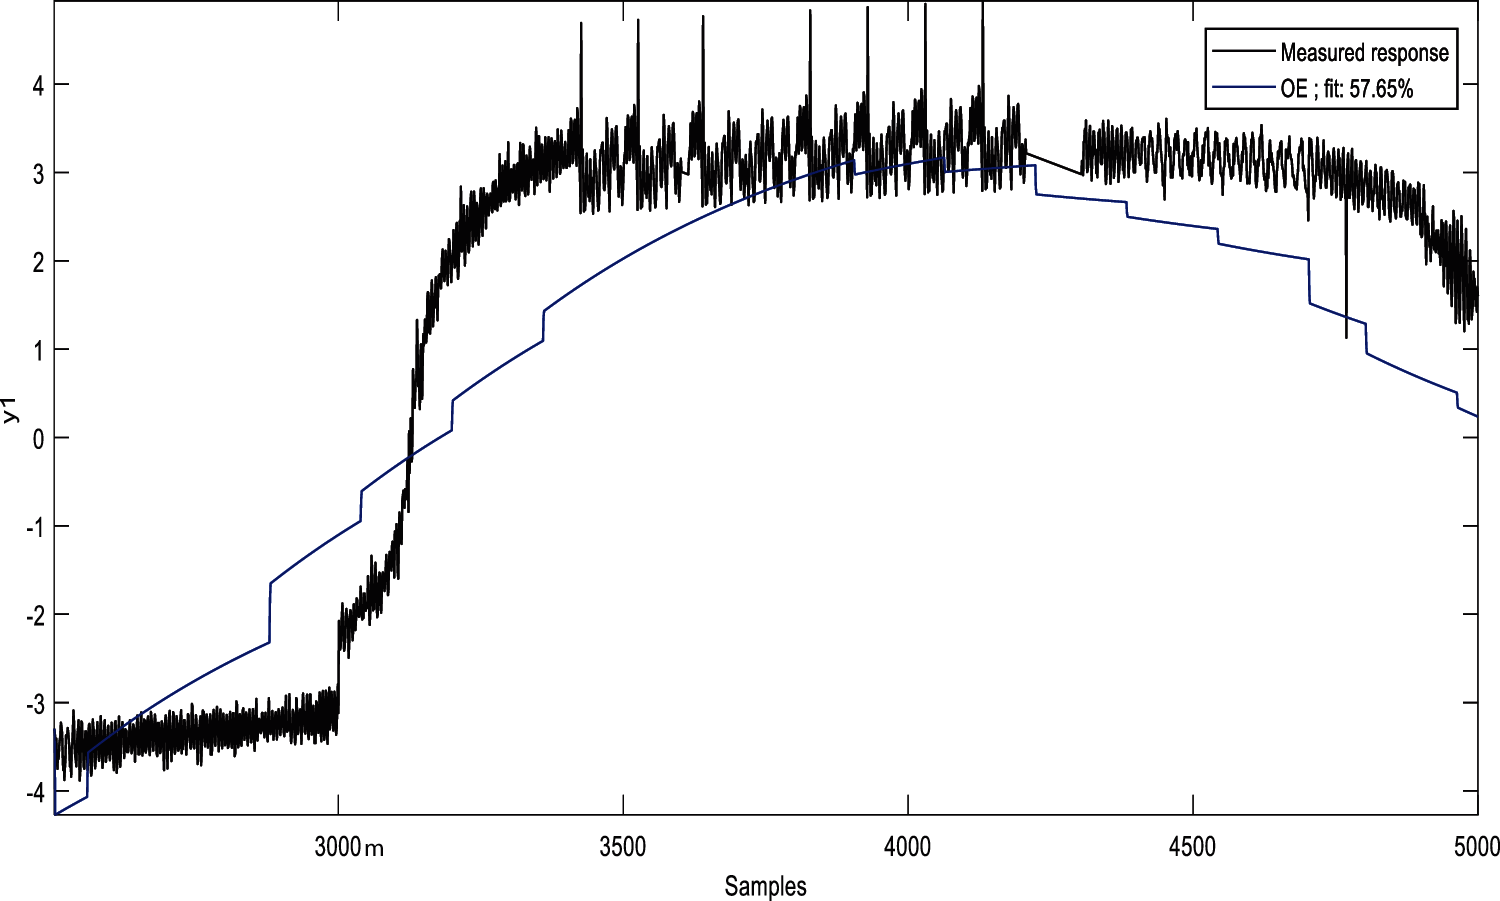
Figure 6: Validation response of OE model
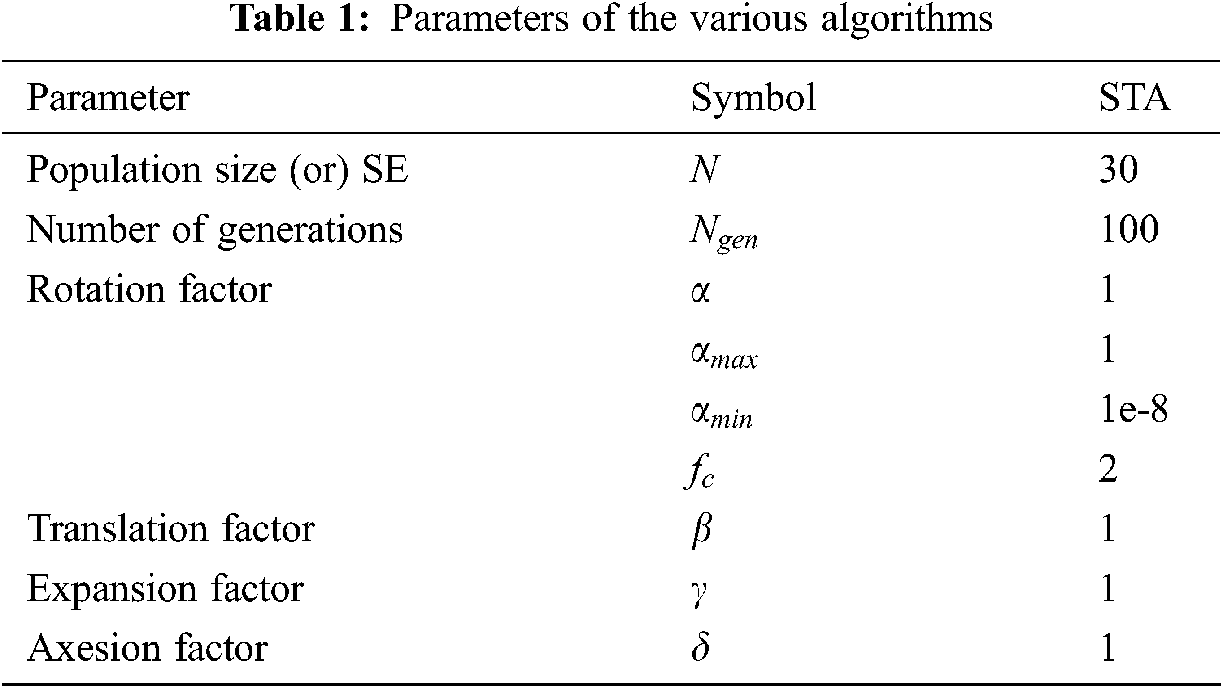
The values obtained from the linear model and the nonlinear models of validation response are tabulated in Tab. 1. The overall observation has been made to select the ARMAX model for further procedures.
3.2 State Transition Algorithm
Like GA and PSO, STA is a heuristic random search algorithm with the concept of state transition. The necessary steps explain the STA optimizations.
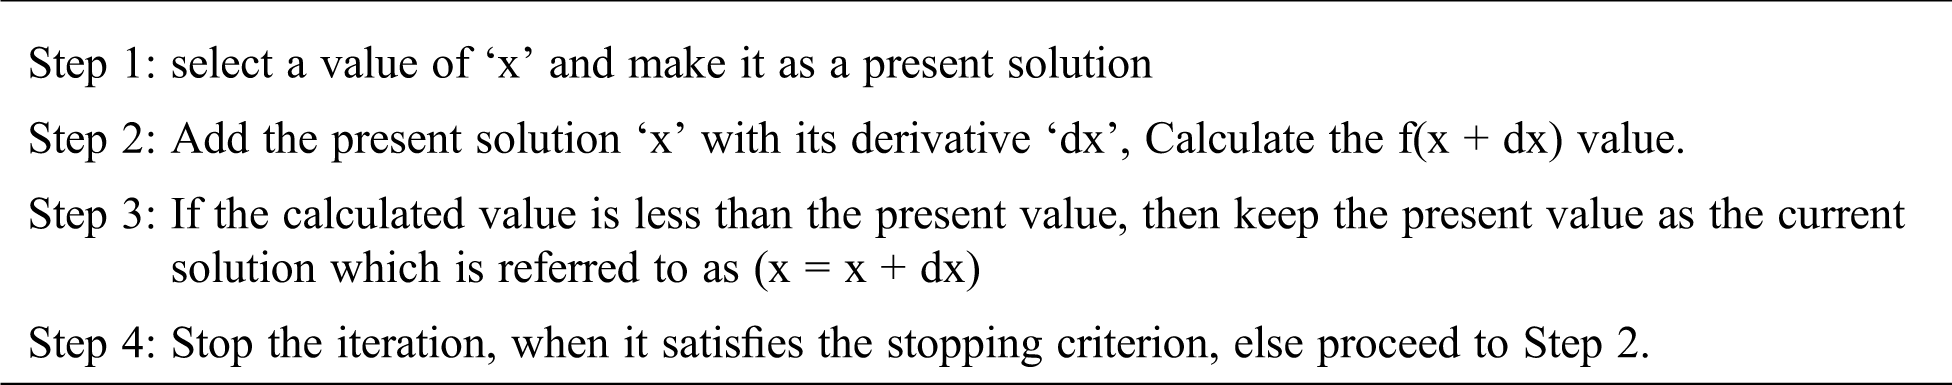
The basic random search for the STA method is formulated as follows. Consider the basic linear time-invariant system,
where A, B, C, and D are linear maps. The state variable of the controller is x.
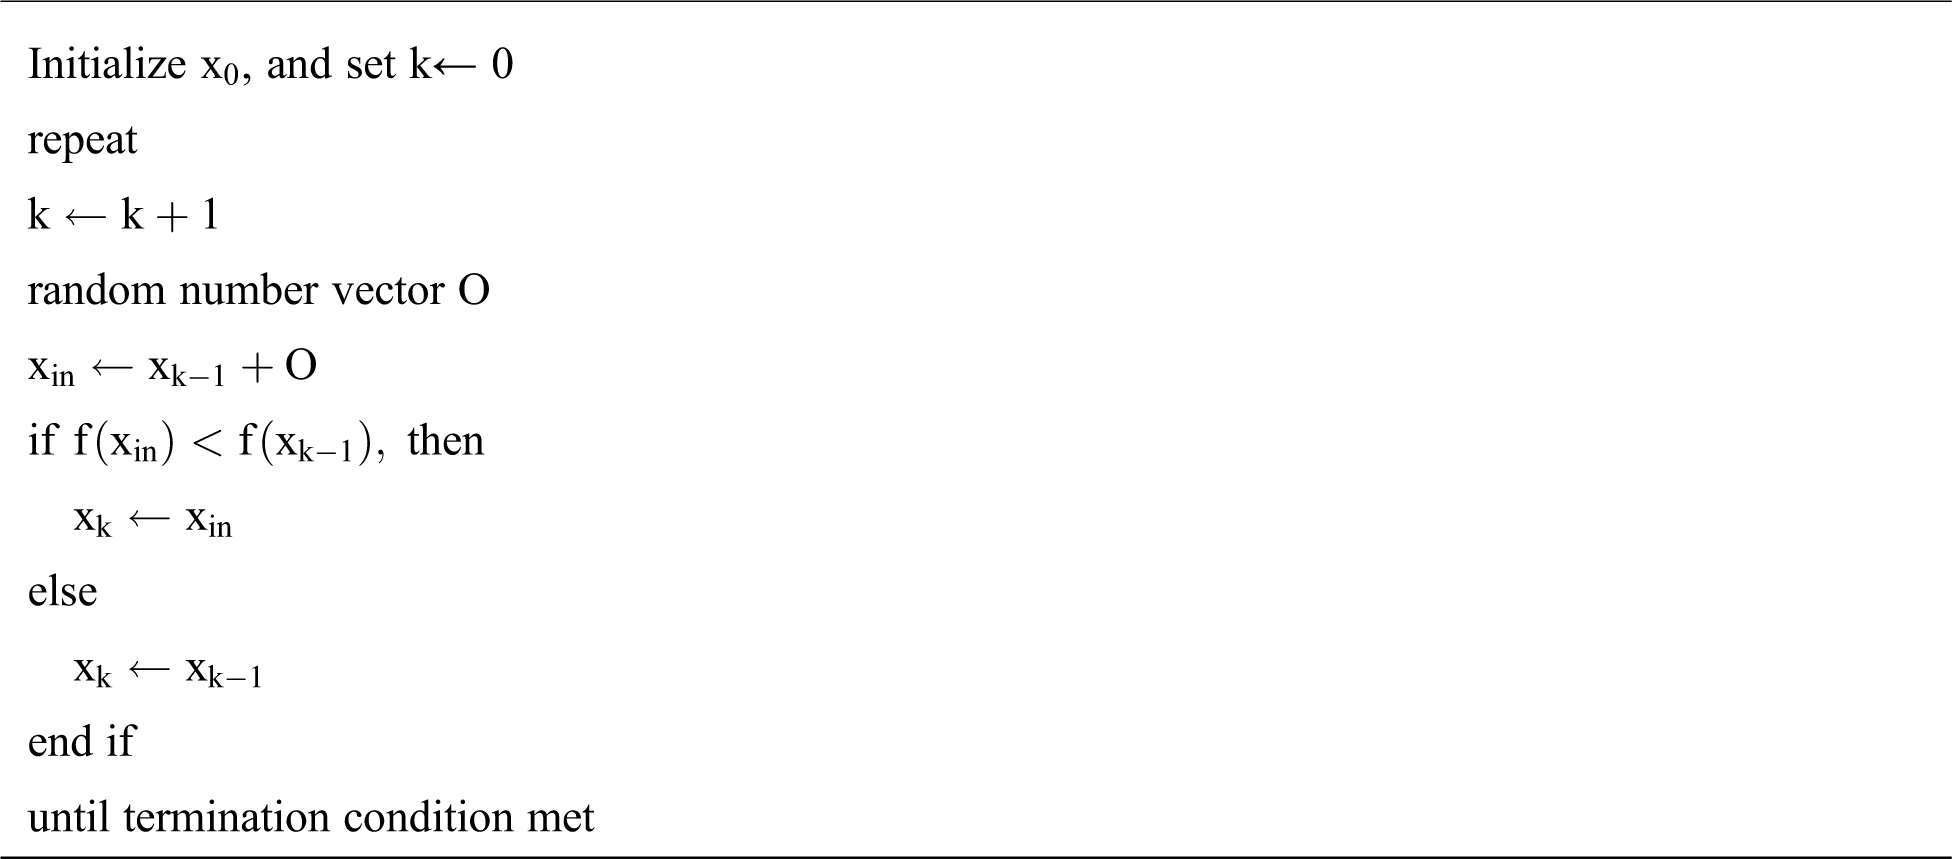
Various procedures are available in metaheuristic methods. Among the varieties of methods, iterative search method is always employed and it is suitable for local searching, but often, the iterative methods are computationally complicated, since it has implicit gradient information. For global optimization, searching, the gradient is a method that provides an optimum search. It is suggested by most experts because it is possible to achieve an optimal global solution. The direction of the gradient is just a way of standing for direction in this case, and it has no major influence on the quest for a global optimum. The iterative method is used in Eq. (2) for efficient local search, where the search progress of the iterative method is inferred as state transit. If state and state transition are retrieved from the searching method, then the new state can be created at the end. The searching process of the evolutionary algorithm also imitates the same state and state transition, when the case is stochastic. Like PSO and GA, in STA, the state is referred to as population and updating solution at each iteration is referred to as state transition. Now in the case of the proposed STA design, the performance operators involved in solution update are state transition and the process of optimization is a state.
3.3 STA in Parameter Estimation
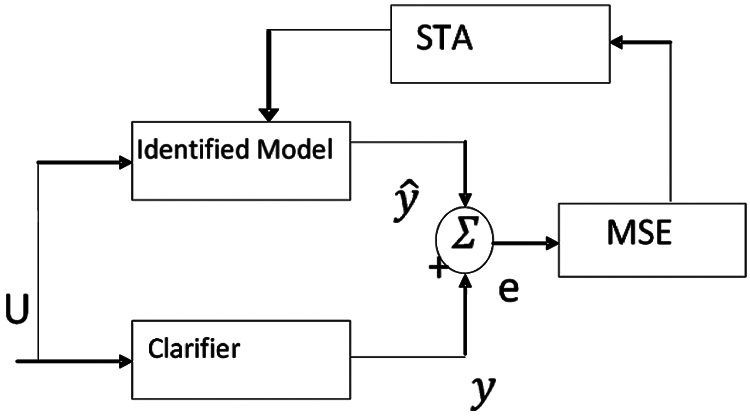
Figure 7: STA in parameter identification
Fig. 7 describes the identification of a linear model using STA. The parameters of the model are identified by STA using its state and state transition operators. The error in Eq. (3) can be found from the difference between the actual and the identified model and it can be used as a constraint in STA to obtain the optimum parameter.
The state transition method of searching is similar to the evolutionary algorithm, and the only difference is the number of operators for searching the solution. The design is given as,
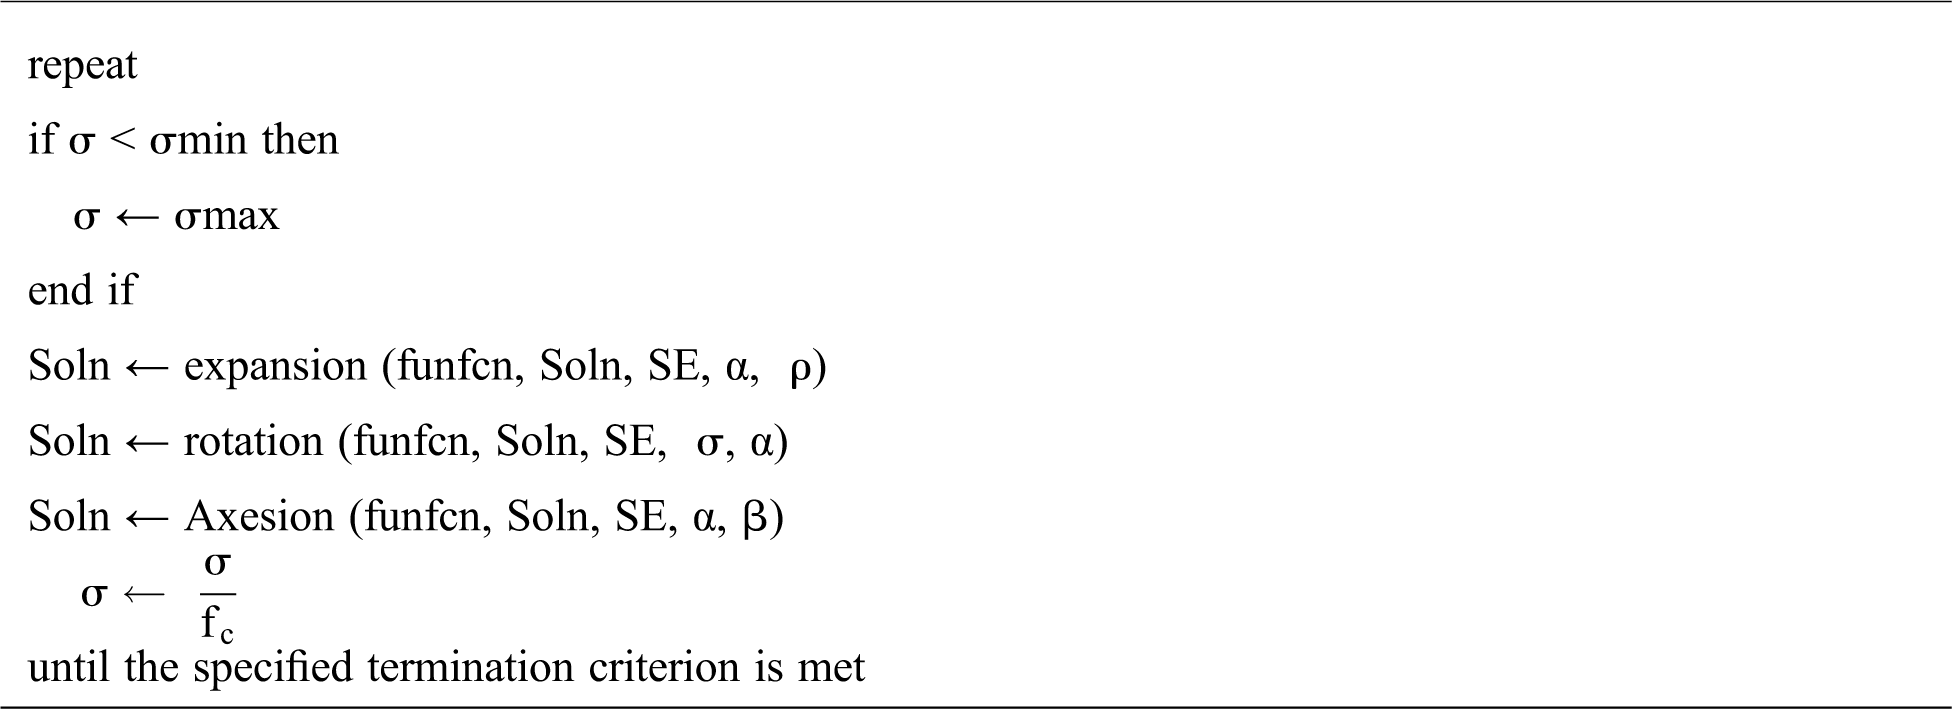
In the case of STA, there are four operators used to search the solution, and it will become a new state of the problem. The new state is obtained and then, the operator further proceeds to find another new optimum state. A set of state transformations is known as Search Enforcement (SE).
The design of the STA is given as,
5 STA Parameters and Its Analysis
STA is an optimization algorithm that consists of four operational parameters and one Search Enforcement (SE) parameter. In some researches, the SE is fixed to the dimensional search, since the larger value of SE brings the complexity in the design. The fixed SE has reduced the complexity of parametric analysis. A rotation operator should be a minimum and hence, an accurate solution can be derived. The minimum rotation operator can be achieved in two ways by adjusting the inner factor loop or outer loop. Minimizing the value of the rotation operator is known as the Lessing coefficient. In the case of the remaining operator, the value should be large to search in the straight line for a longer time. Over the large and less amount of the factors of translation, expansion and Axesion will affect the search space. In metaheuristic optimization methods, convergence is an important factor. In this proposed STA design, the probability random search method has been adopted in the case of convergence.
The procedure to identify the best-validated model is the cross-validation procedure (Ljung 1999). Eq. (1). is the ARMAX model with 90.86% is identified as a suitable model. Residual analysis and correlation analysis is observed from the experiment to confirm the effectiveness of the model which is captured by validation procedure. Autocorrelation (output residuals) and cross-correlation (input to the process) and the output residuals from the residual analysis are collected. The analysis shows that the process dynamics that can be understood when both of the correlation functions lie between the confidence intervals have been captured by the efficiency model. Fig. 8 displays the ARMAX model’s residual analysis. The upper part of the figure suggests the residual autocorrelation of the output and the lower part displays the residual autocorrelation of the output between the input of the process and the residual output. In between the 99 per cent confidence intervals, all the signals lie. It is, therefore, possible to consider the model as accurate.
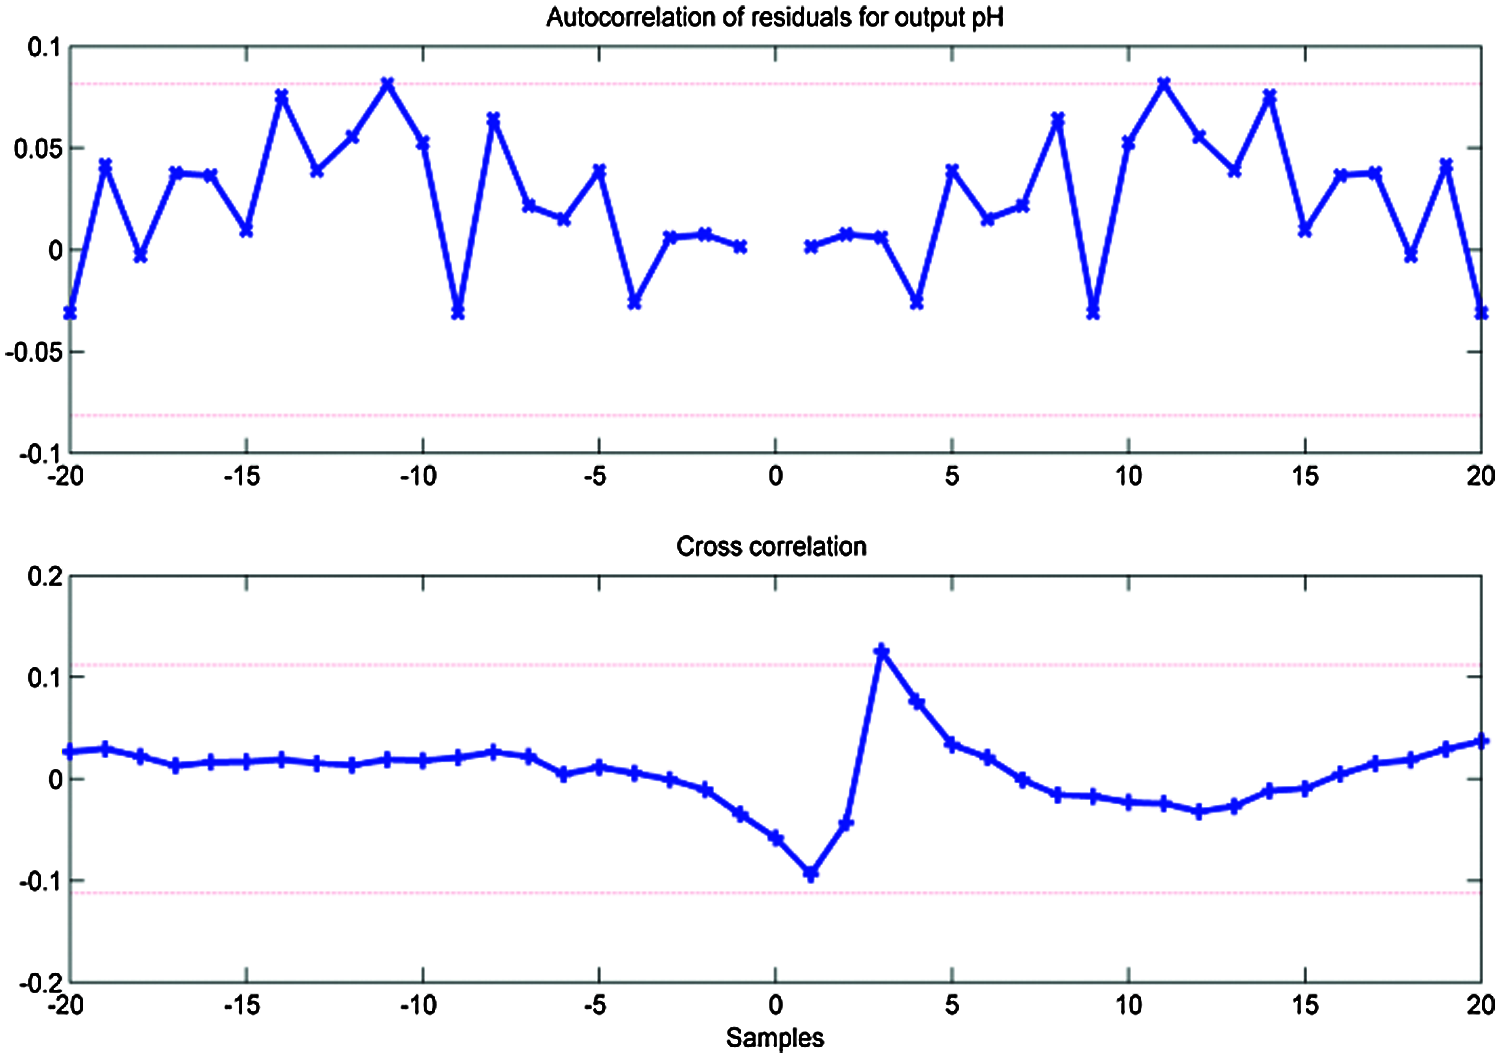
Figure 8: The residual analysis of the identified ARMAX model
In Fig. 9, the convergence of the best fitness and average fitness is shown. Within the fifth generation itself, both principles have come similar to one another. Since then, the average fitness has stayed very similar to the finest fitness. With the more generations after 13th generations, the best fitness does not change; thus, suggesting the optimal or almost optimal solution for the parameter values. STA-ARMAX is called the model arising from this. The simulated performance of the STA-ARMAX model is obtained and compared to the simulated results. Its fit percentage is measured by estimation data and validation data. Tab. 1. demonstrates the contrast between the simulated ARMAX and STA-ARMAX outputs.
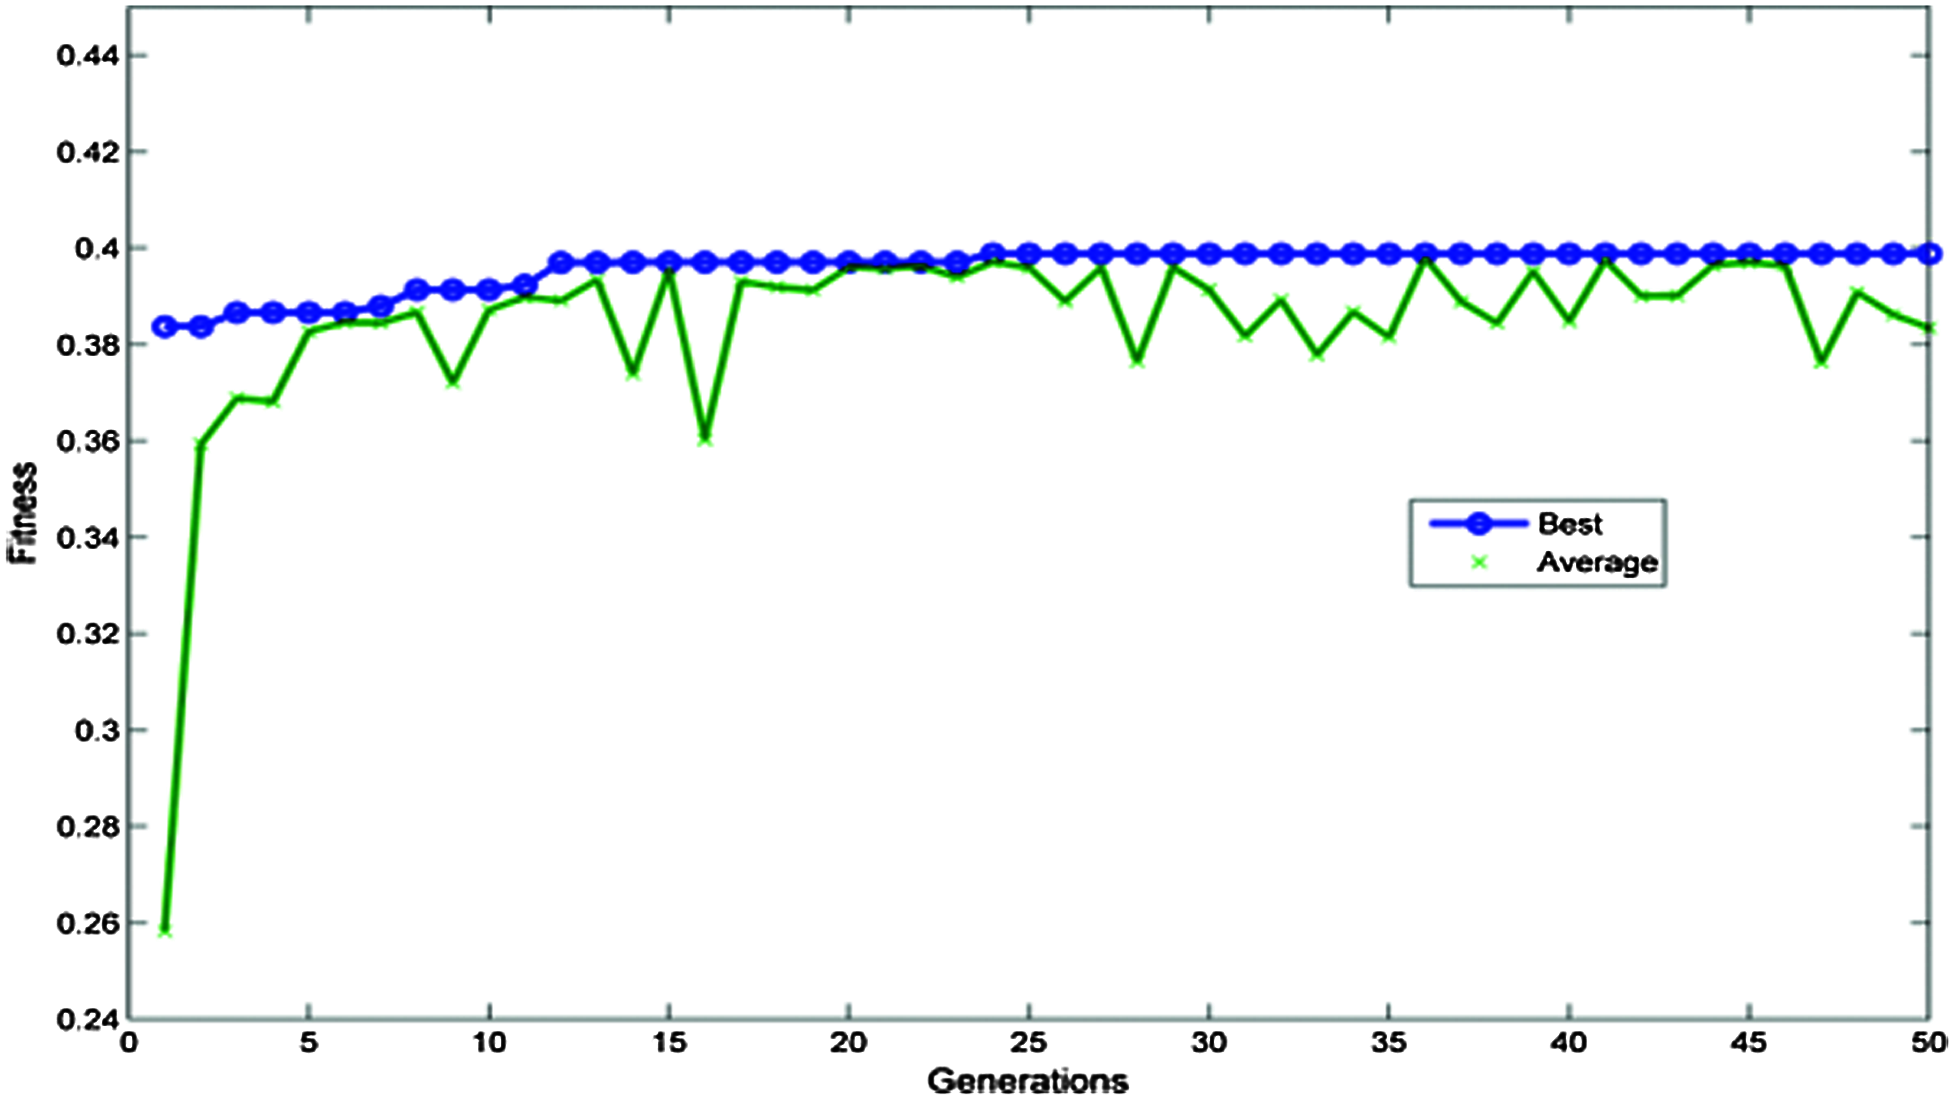
Figure 9: Convergence of fitness
Fig. 9 shows the effectiveness of the proposed design. The convergence of model error is achieved quickly in the STA-ARMAX model than in the remaining methods. It also insists as the % of model fitness and it is considerably increased in STA-ARMAX than the ARMAX. The comparison of the optimum models, which have gained the least MSE value showed in Fig. 10 and it is tabulated in Tab. 2. Fig. 11 shows the validation performance of the STA-ARMAX model has the best performance over the ARMAX validation model. The comparison explains the optimum performances of the proposed design. Tab. 3. evaluates the parameters and fit the percentages of the models ARMAX and STA-ARMAX. There is an increase of 1.72% in the fit percentage of the model with the validation data in the case of STA-ARMAX.
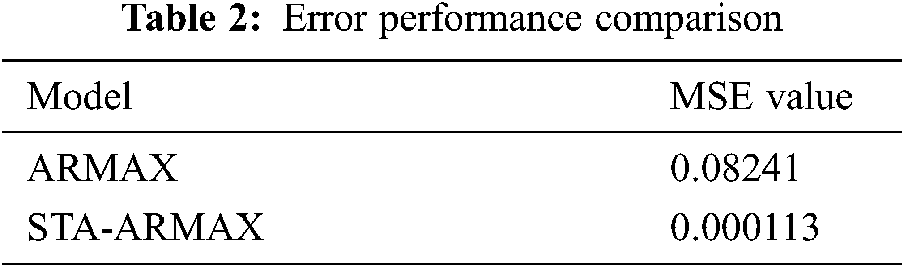
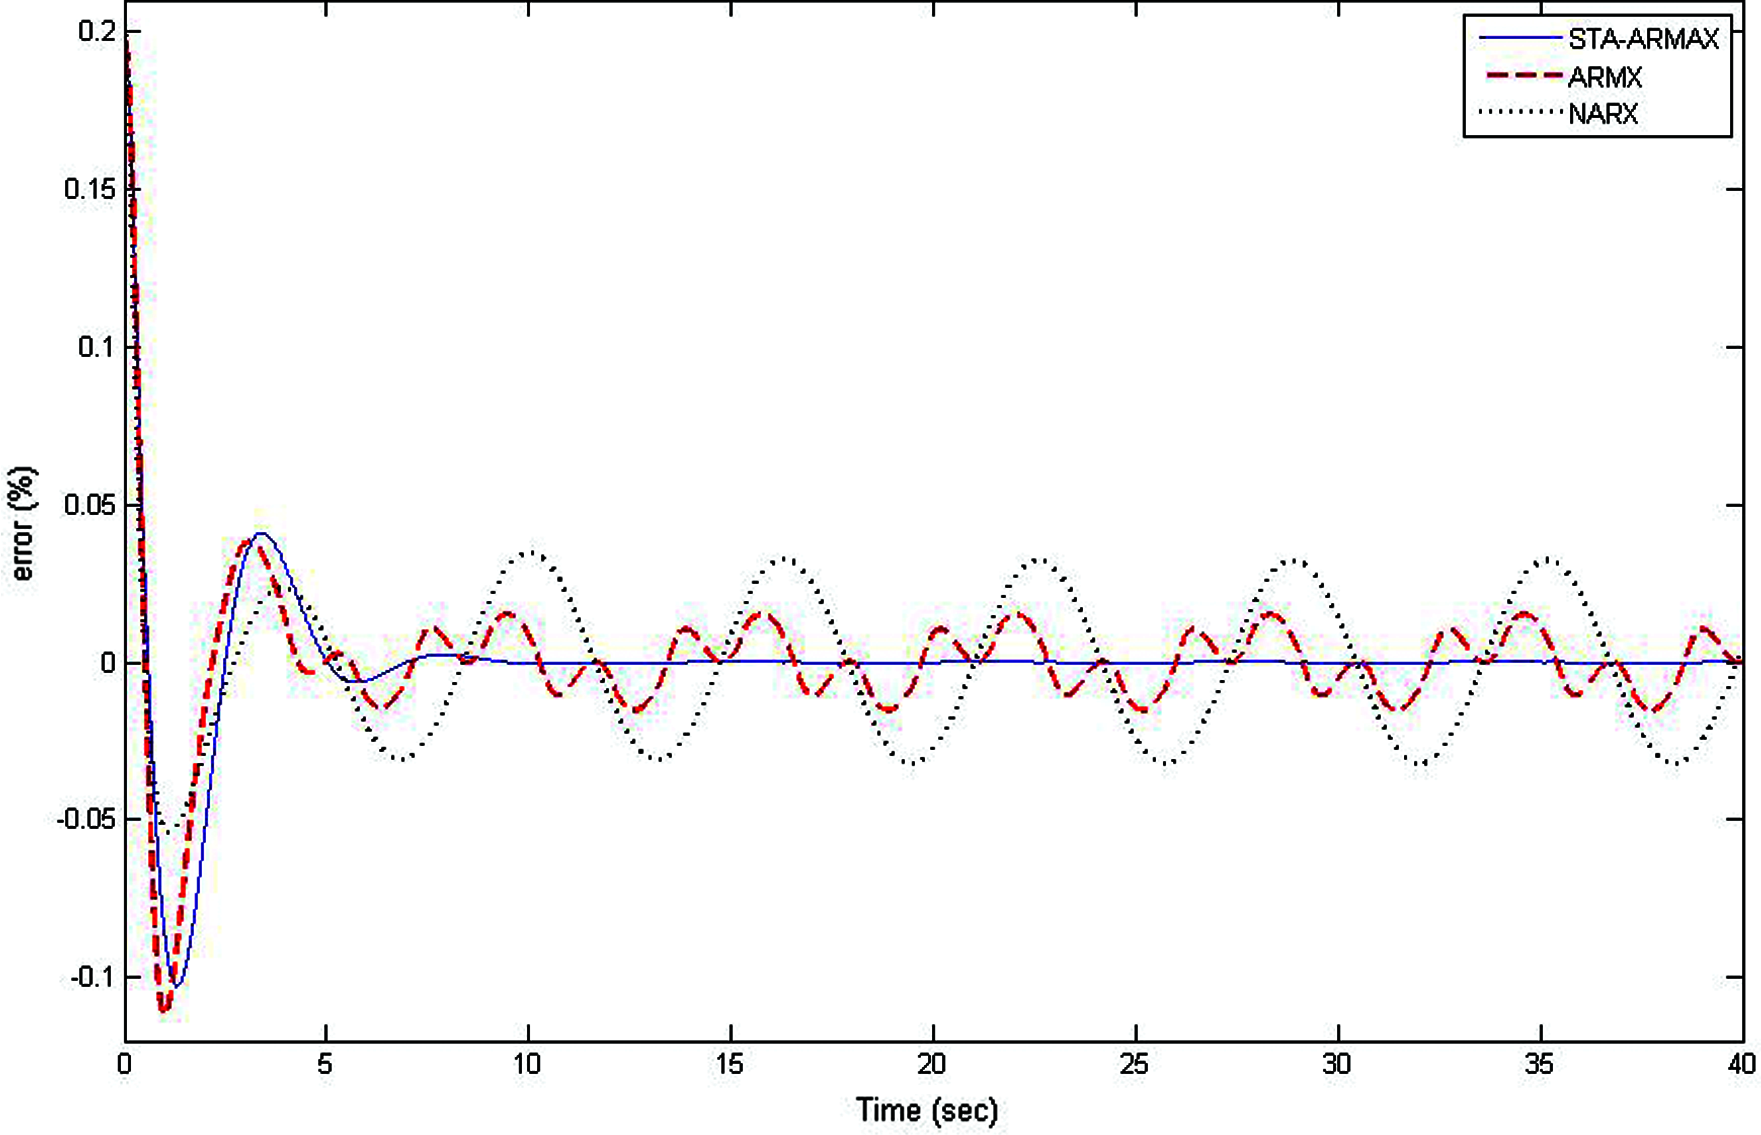
Figure 10: Model error of various identification methods
The optimum fitness obtained has been considered, and the corresponding model parameters for the STA-ARMAX model have been observed and shown in Fig. 11.
Further, the fine-tuned model of the ARMAX identified model is compared with an ARMAX model for the clarification process using STA is represented in Fig. 12 and mathematically represented by Eq. (4).
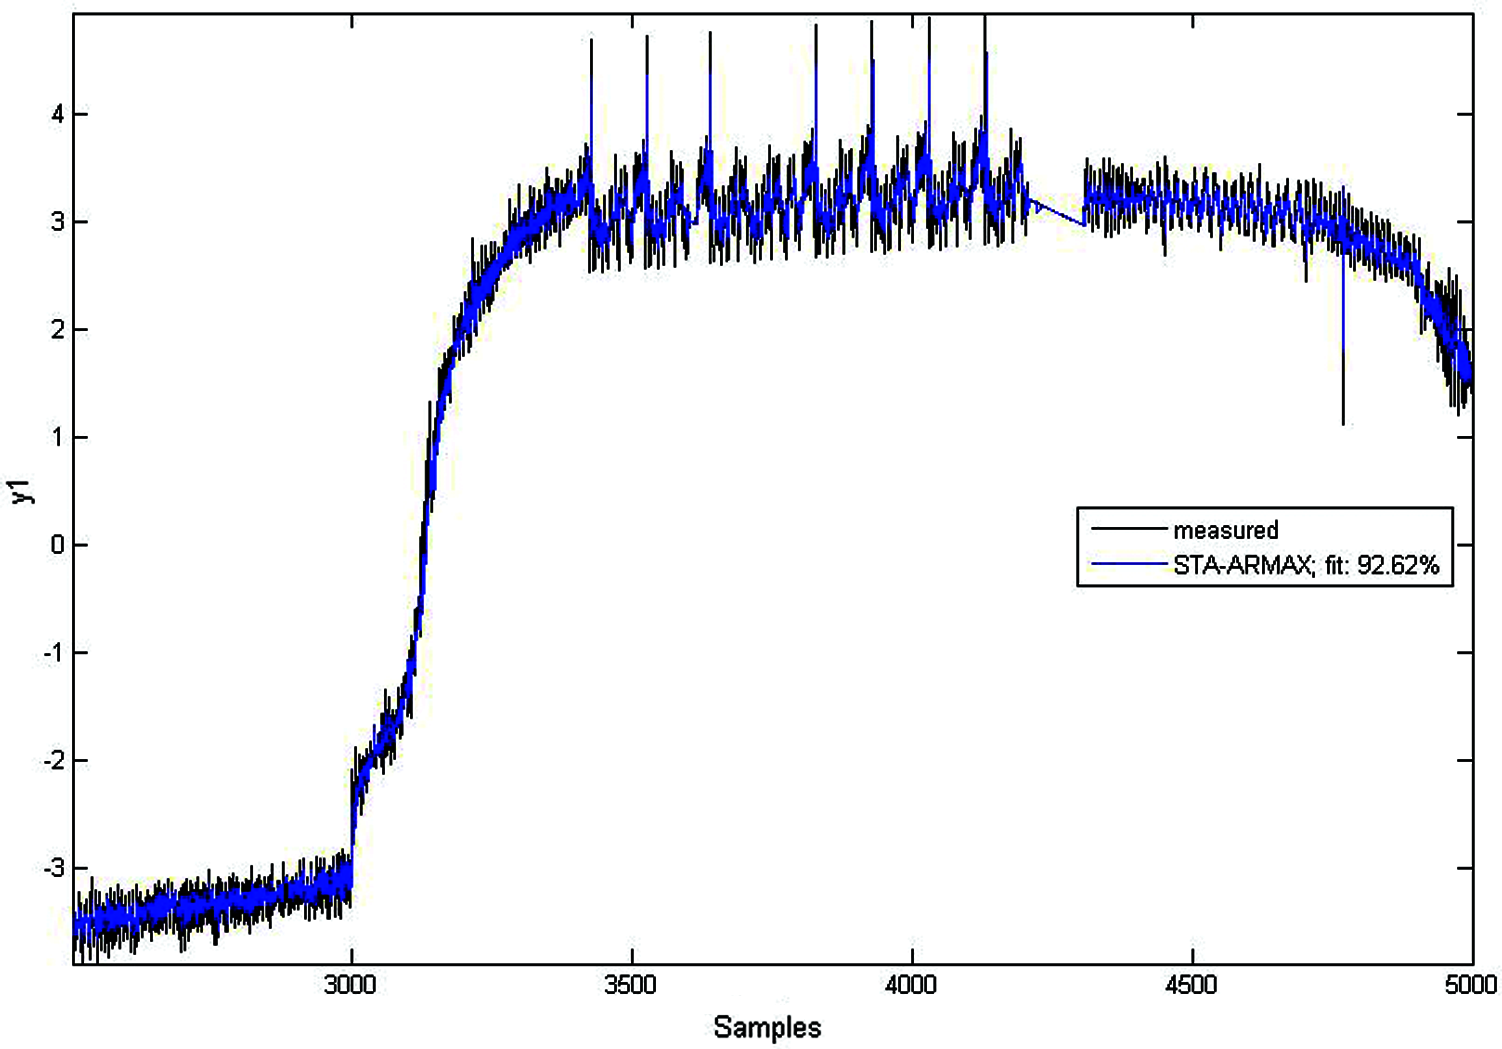
Figure 11: Identified model using the STA-ARMAX method
The STA tuned ARMAX model has been considered in the following for the controller design since the proposed design has given the very optimum model performances for the clarification process in terms of MSE and Fitness. The STA tuned ARMAX model has been considered in the following for the controller design since the proposed design has given the very optimum model performances for the clarification process in terms of MSE and Fitness. The identified ARMAX model is an overdamped system and it has a steady-state gain of 8.1259 and the damping factor 2.148 by the time constant 4.967 s in Eq. (1).
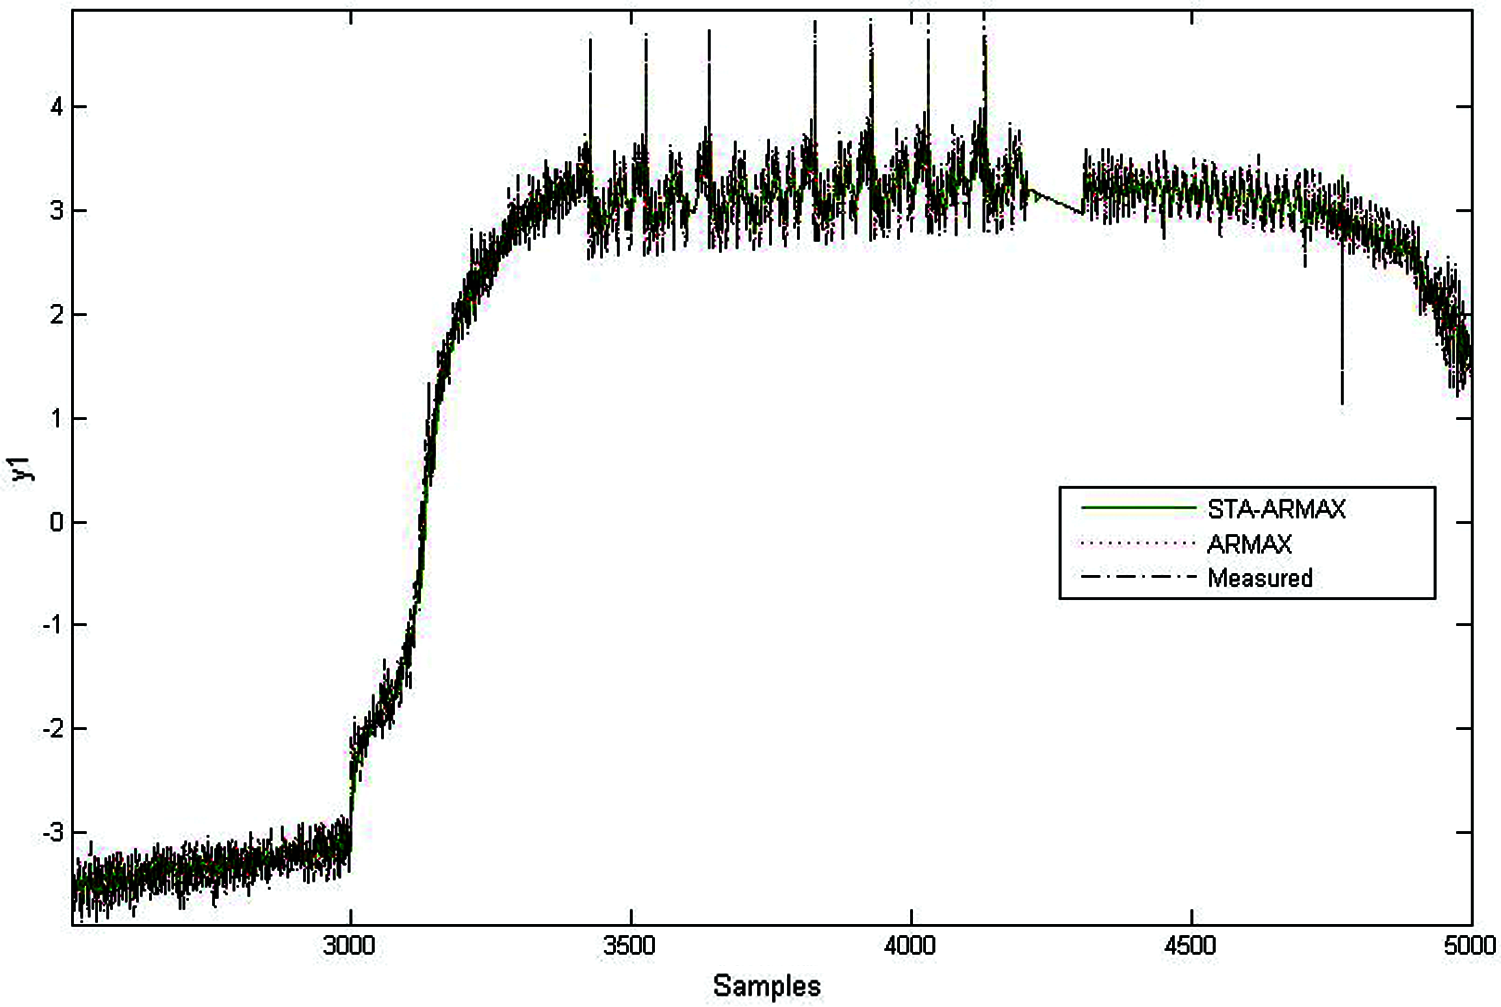
Figure 12: Comparative model analysis of various methods
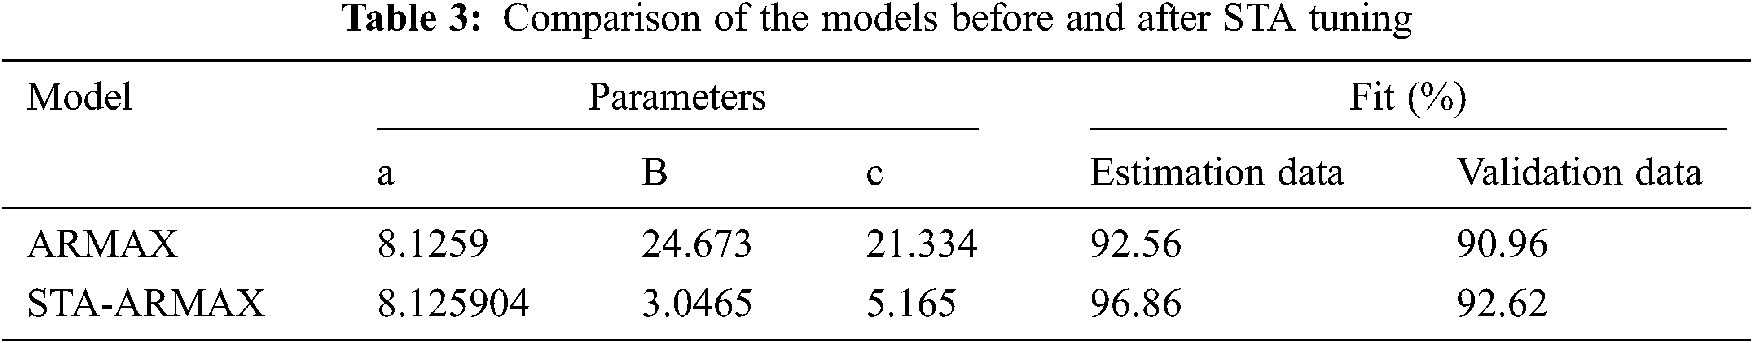
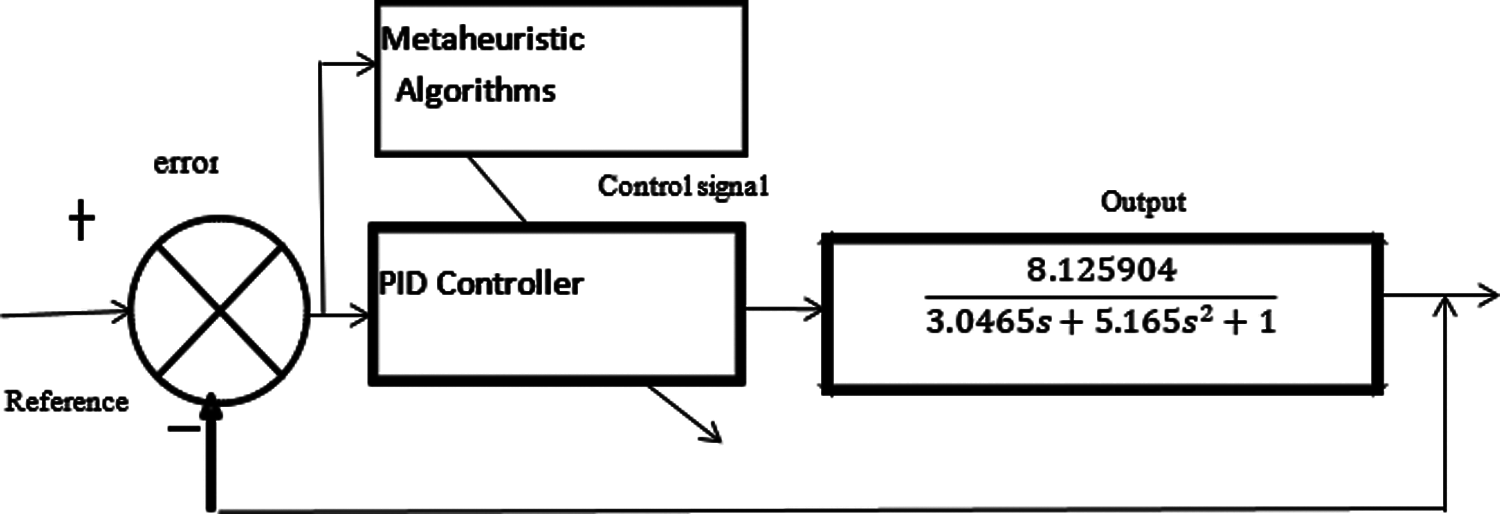
Figure 13: Design of closed-loop control
The STA-ARMAX is also an overdamped system and it has a steady-state gain is 8.125904 and the damping factor of is 1.47 with a time constant of 1.745 s.
7 Metaheuristic Algorithms for Controller Design of Clarification Process
The basic model of the clarification process has been obtained with various identification methods, and the optimum model is identified using the STA-ARMAX model. The controller has been designed in this section using different algorithms where the STA-ARMAX model has been considered as a clarifier model. The basic closed-loop feedback control is designed initially to the obtained model as given in Fig. 13 and the parameters of the PID controller are further enhanced by metaheuristic algorithms to obtain the effective controller design in the clarification process. And the methods for obtaining the optimum gain values of the PID controller.
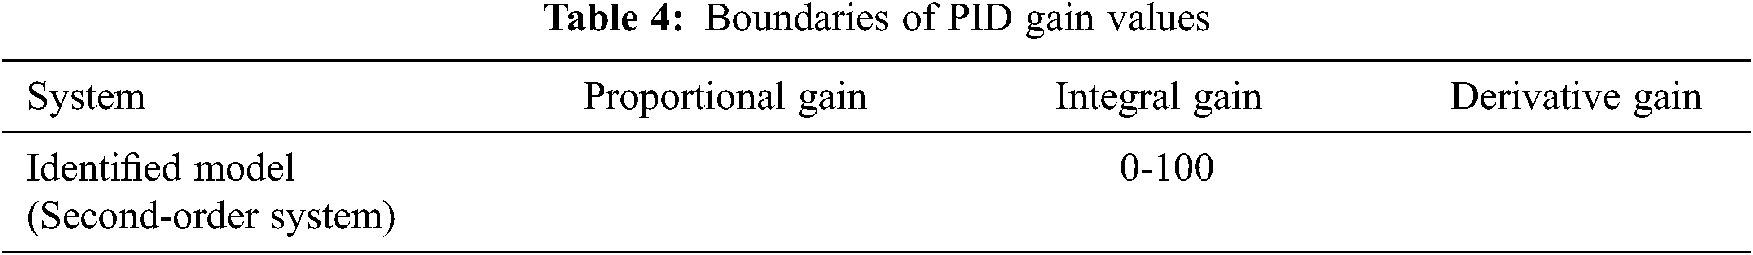
The basic controller gains of the closed-loop system can be obtained from the standard tuning methods. For obtaining the optimum performance, the gain values of the controller are further enhanced by a metaheuristic algorithm where it converts the normal problem into an optimization problem using the objective function of the error values. The control simulation of the clarification process is simulated using MATLAB-Simulink. The error to the controller has been obtained from the difference of reference value and output value and it is processed by a control system to enable the controller to react to make the process follow the desired output. The metaheuristic algorithm is employed to instruct the controller by considering the model error as an objective function. In such a way, the controller parameters are adjusted related to the objective function of the algorithms. The range of the gain parameters is fixed and it's presented in Tab. 4.
The simulation responses of the metaheuristic algorithms are analysed. For making a better comparative analysis, the population size or iteration of the algorithm is initialized to 100. The comparative performances of GA-PID, BFO-PID, PSO-PID, and PID are analysed, and it is represented in Fig. 14. As well as their performances are tabulated in Tab. 5.
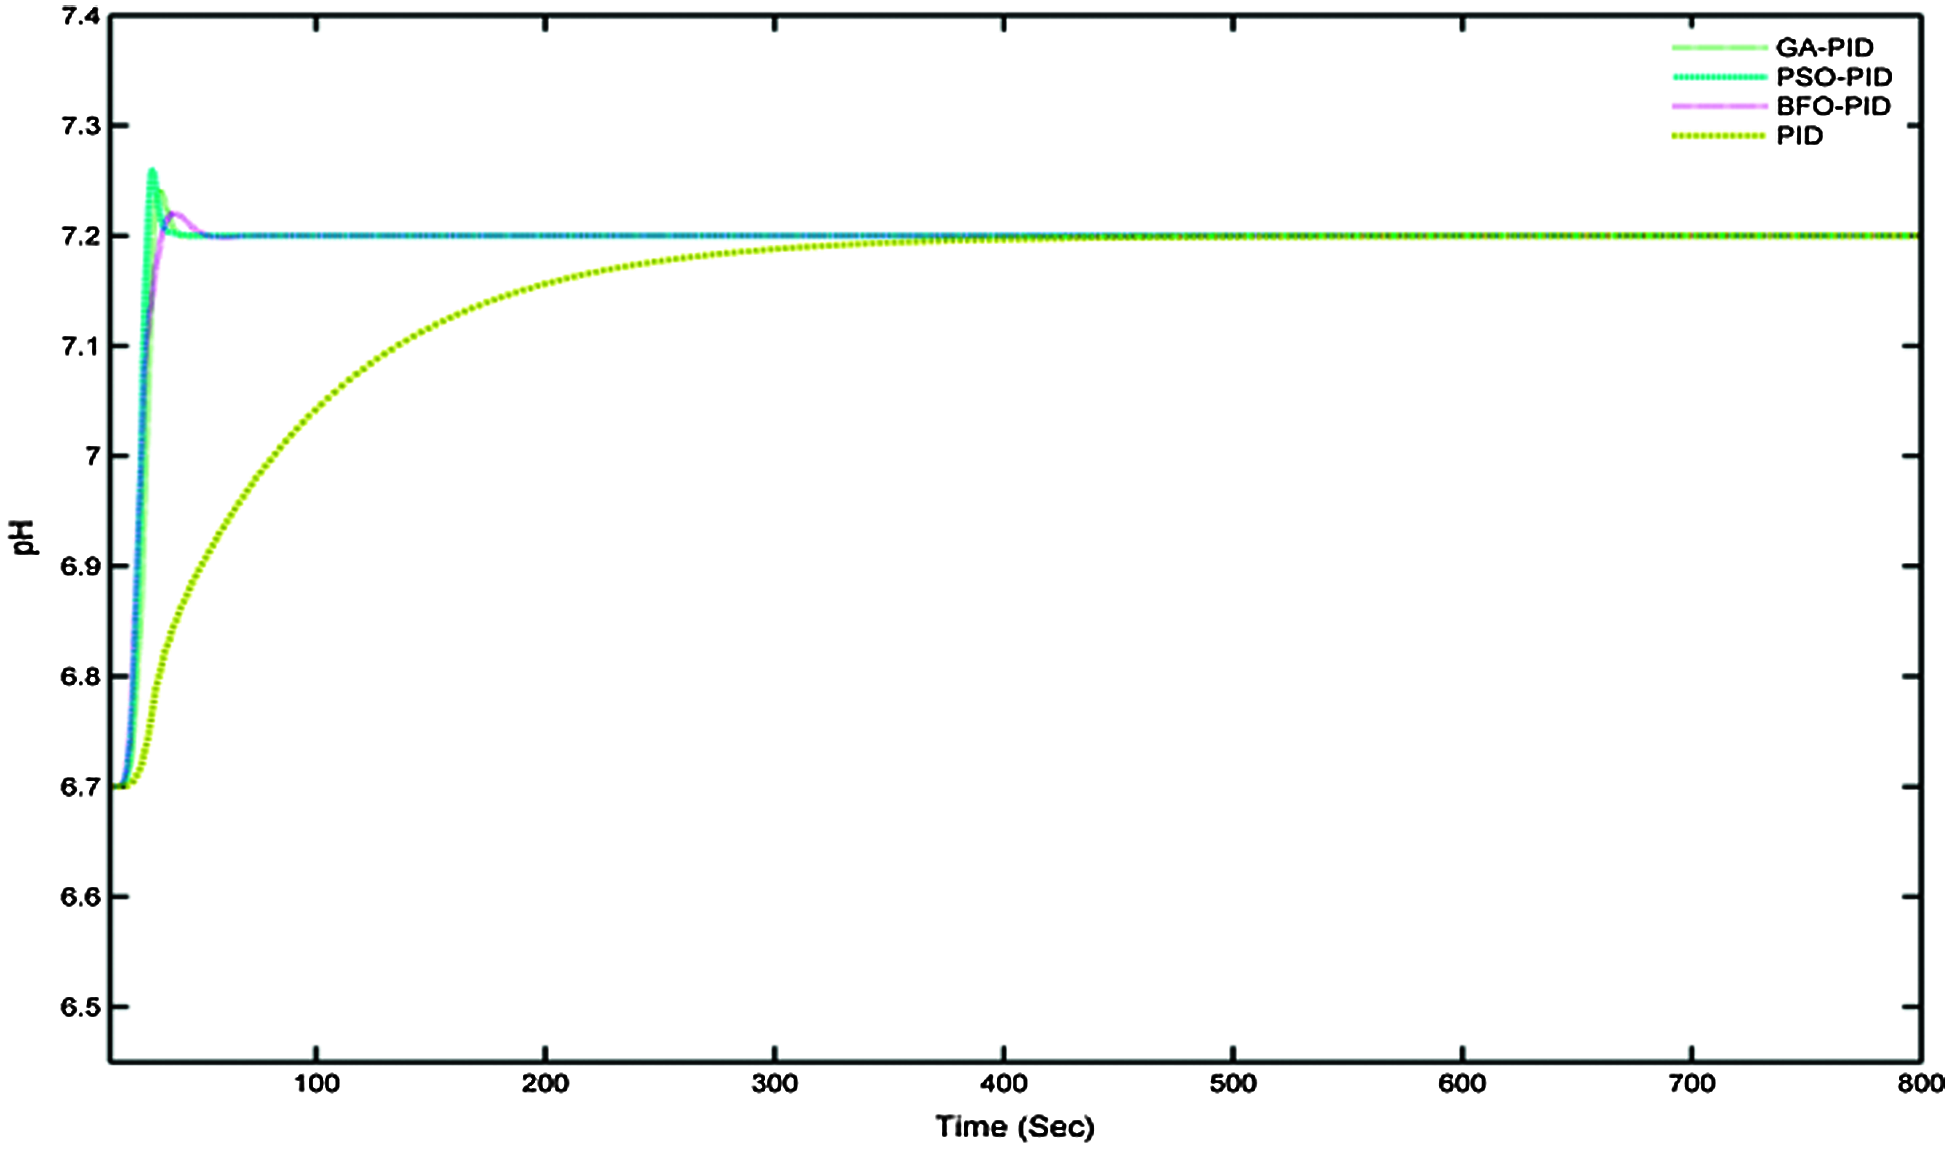
Figure 14: Conventional controller performances
The observation shows that GA-PID is the more optimum solution than the other controllers listed in the comparison. The step input of unity is given to the controllers and plotted in Fig. 16, where the GA-PID has reached the settling time faster than the other metaheuristic Algorithm and PID controllers. The basic performances such as settling time, rise time, and MSE are compared. The least value is obtained from GA-PID, whereas, BFO and PID controller provides poor performances. For the comparisons, BFO-PID, and PID controller are not considered because of their poor performances.
8 Performance of STA in PID Tuning
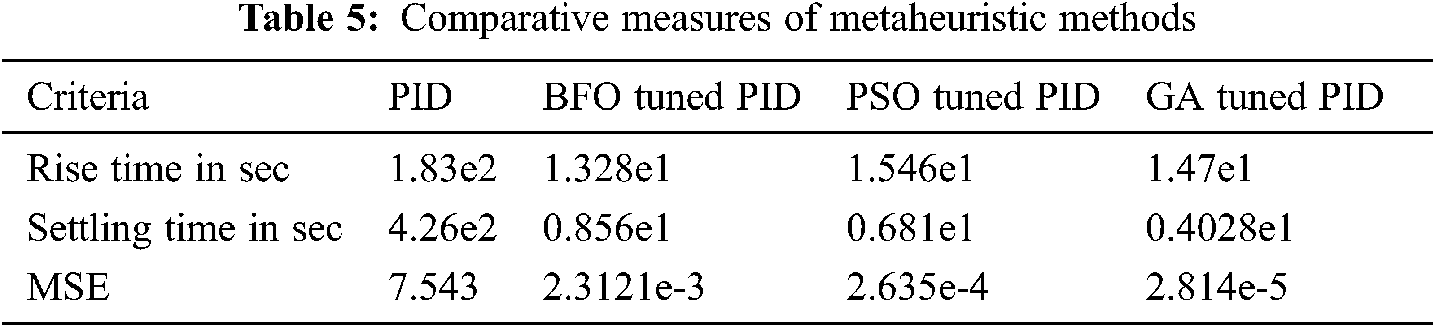
STA is another metaheuristic algorithm used in optimization problems. The performance of STA is efficient in many types of researches in the field of identification as well as in controller tuning by selecting the proper STA parameters. The necessary performances are selected and listed in the previous chapter. The optimality performances of STA are simulated by the STA-ARMAX model, and the simulated responses are given in Fig. 15. The performances of the STA are much better than the PID controller, and the performance measures are compared with other metaheuristic methods. The results show that the optimality of the solution can achieve better in STA than the other algorithms such as GA, PSO, and BFO.
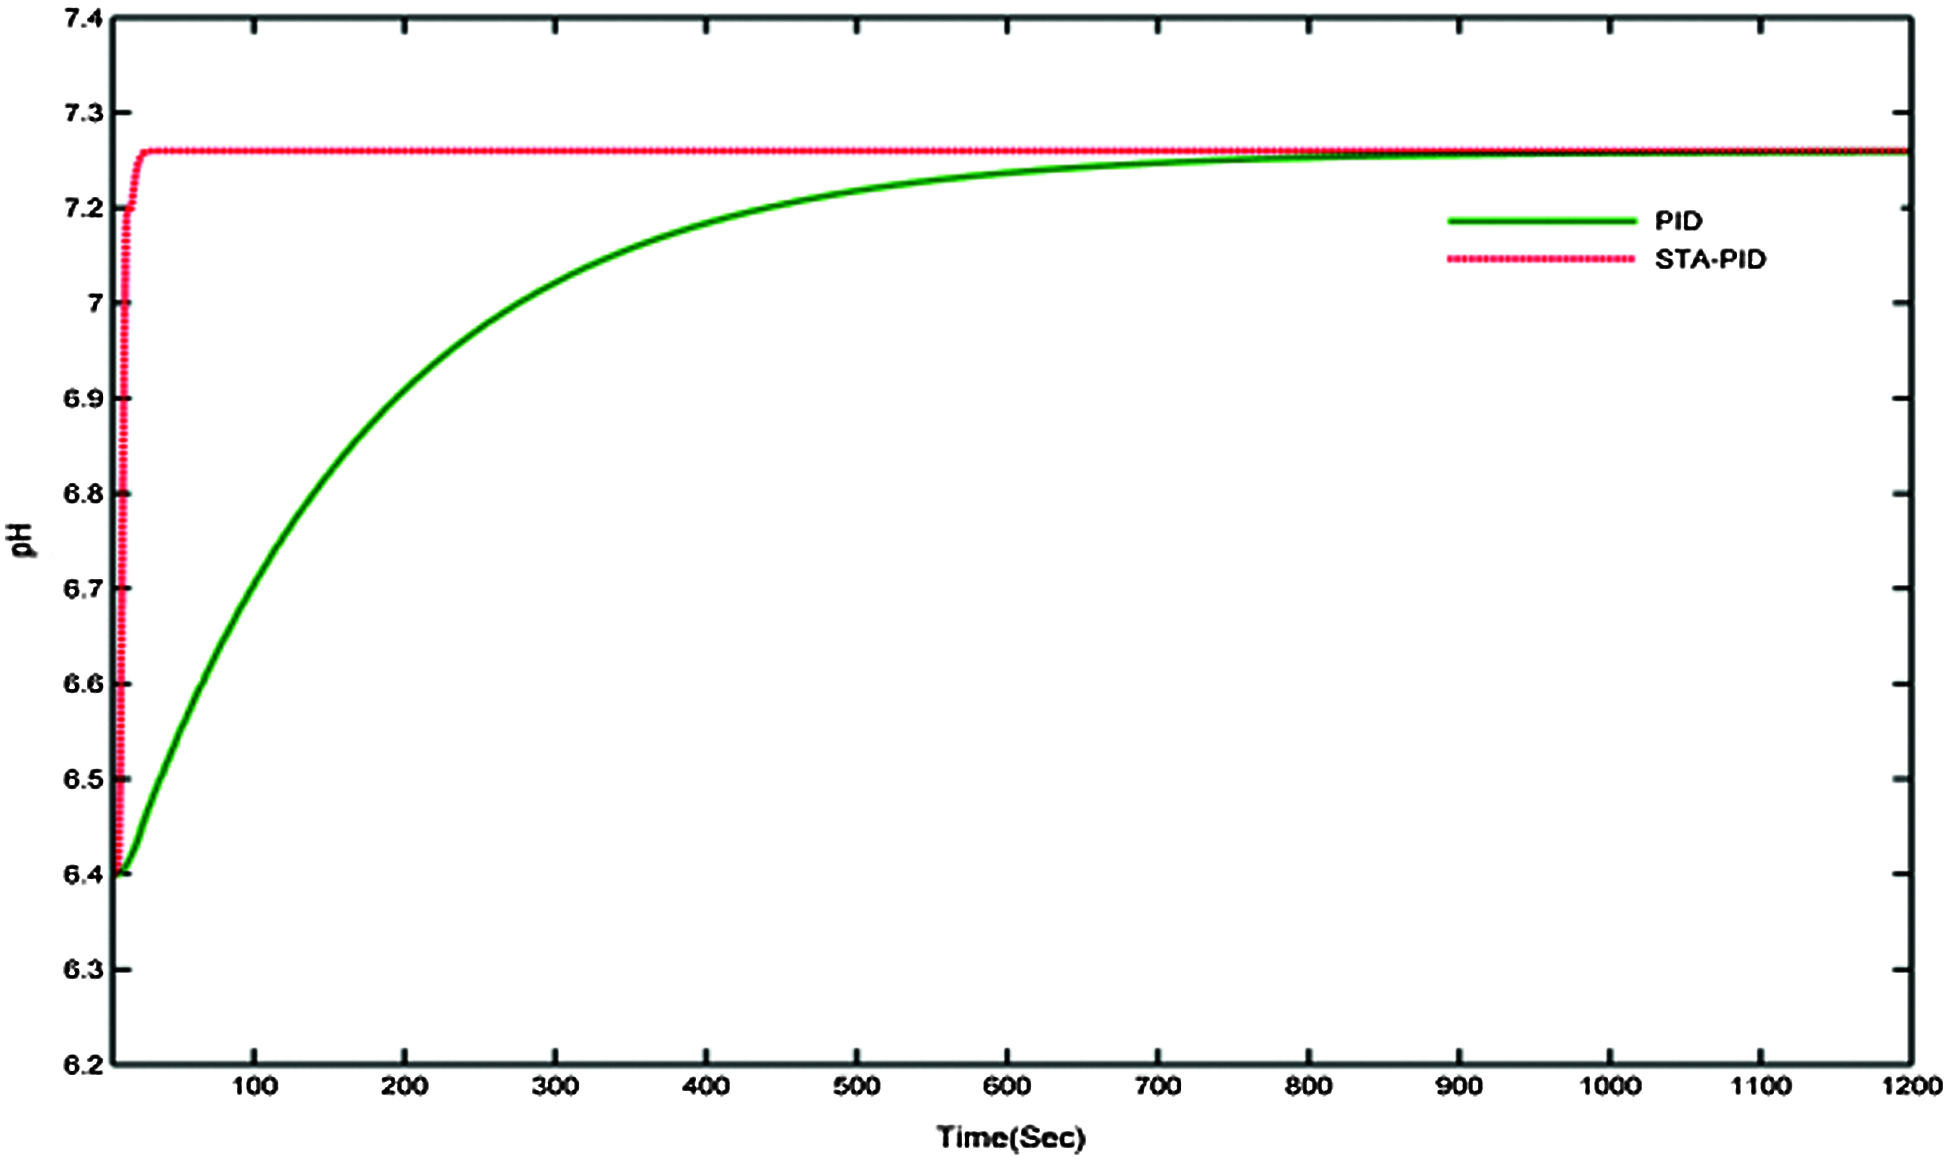
Figure 15: Comparative analysis of STA-PID and PID
The comparative response of different proposed metaheuristic algorithms is presented in this section. For effective comparison, the step size is given as 7.2 to all the controllers as shown in Fig. 17. The simulated response shows that the STA is a more efficient algorithm than others in the case of quick settling time, less overshoot, and also provides optimum error convergence. The PID controller gains are obtained from STA and they have effective controller characteristics.
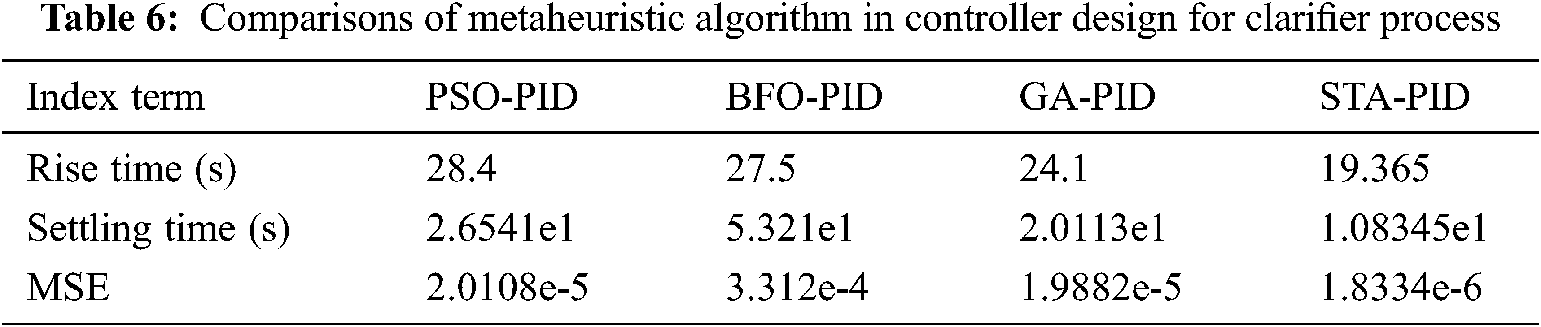
The basic criteria of the controller like settling time, rise time, and MSE are compared to the performances of different controllers, and they are tabulated in Tab. 6. The transient and servo performances of different proposed metaheuristic algorithms are analysed. The simulated response is shown in Fig. 17. The input changes are suddenly from 6.7 to 7.2 and the corresponding simulated responses of the optimization controllers are shown. Among the other algorithms, STA has given its optimum performances in the case of fast reaction towards the changes. Further changes are given to the controllers where the STA again proves the effective tracking and transient responses than another algorithm which are proposed. The BFO has provided a poorer response than all other responses when it experiences the changes in the reference input. The transient performances are tested by adding the nonlinearity in the controllers, and the responses are noted as shown in Fig. 18. The desired pH is fixed with unity, and the controller is simulated with nonlinearity. The three designs have given their best performances and among them, STA has pointed out its excellent performances.
The best and fast convergence of the error rate has been achieved by STA than SA whereas GA has given good convergence, but less than STA and better than the PSO algorithm. The overall comparison in terms of the performance measure, tracking, and transient performances, and error convergence, STA has provided the optimum performances. Figs. 19 and 20 show the effectiveness of the controllers in the case of servo analysis and transient analysis. Fig. 19 shows the different set-point of the pH values to the controllers and the corresponding responses are observed. The STA has an effective response over other methods.

Figure 16: Controller performances to a unit step function
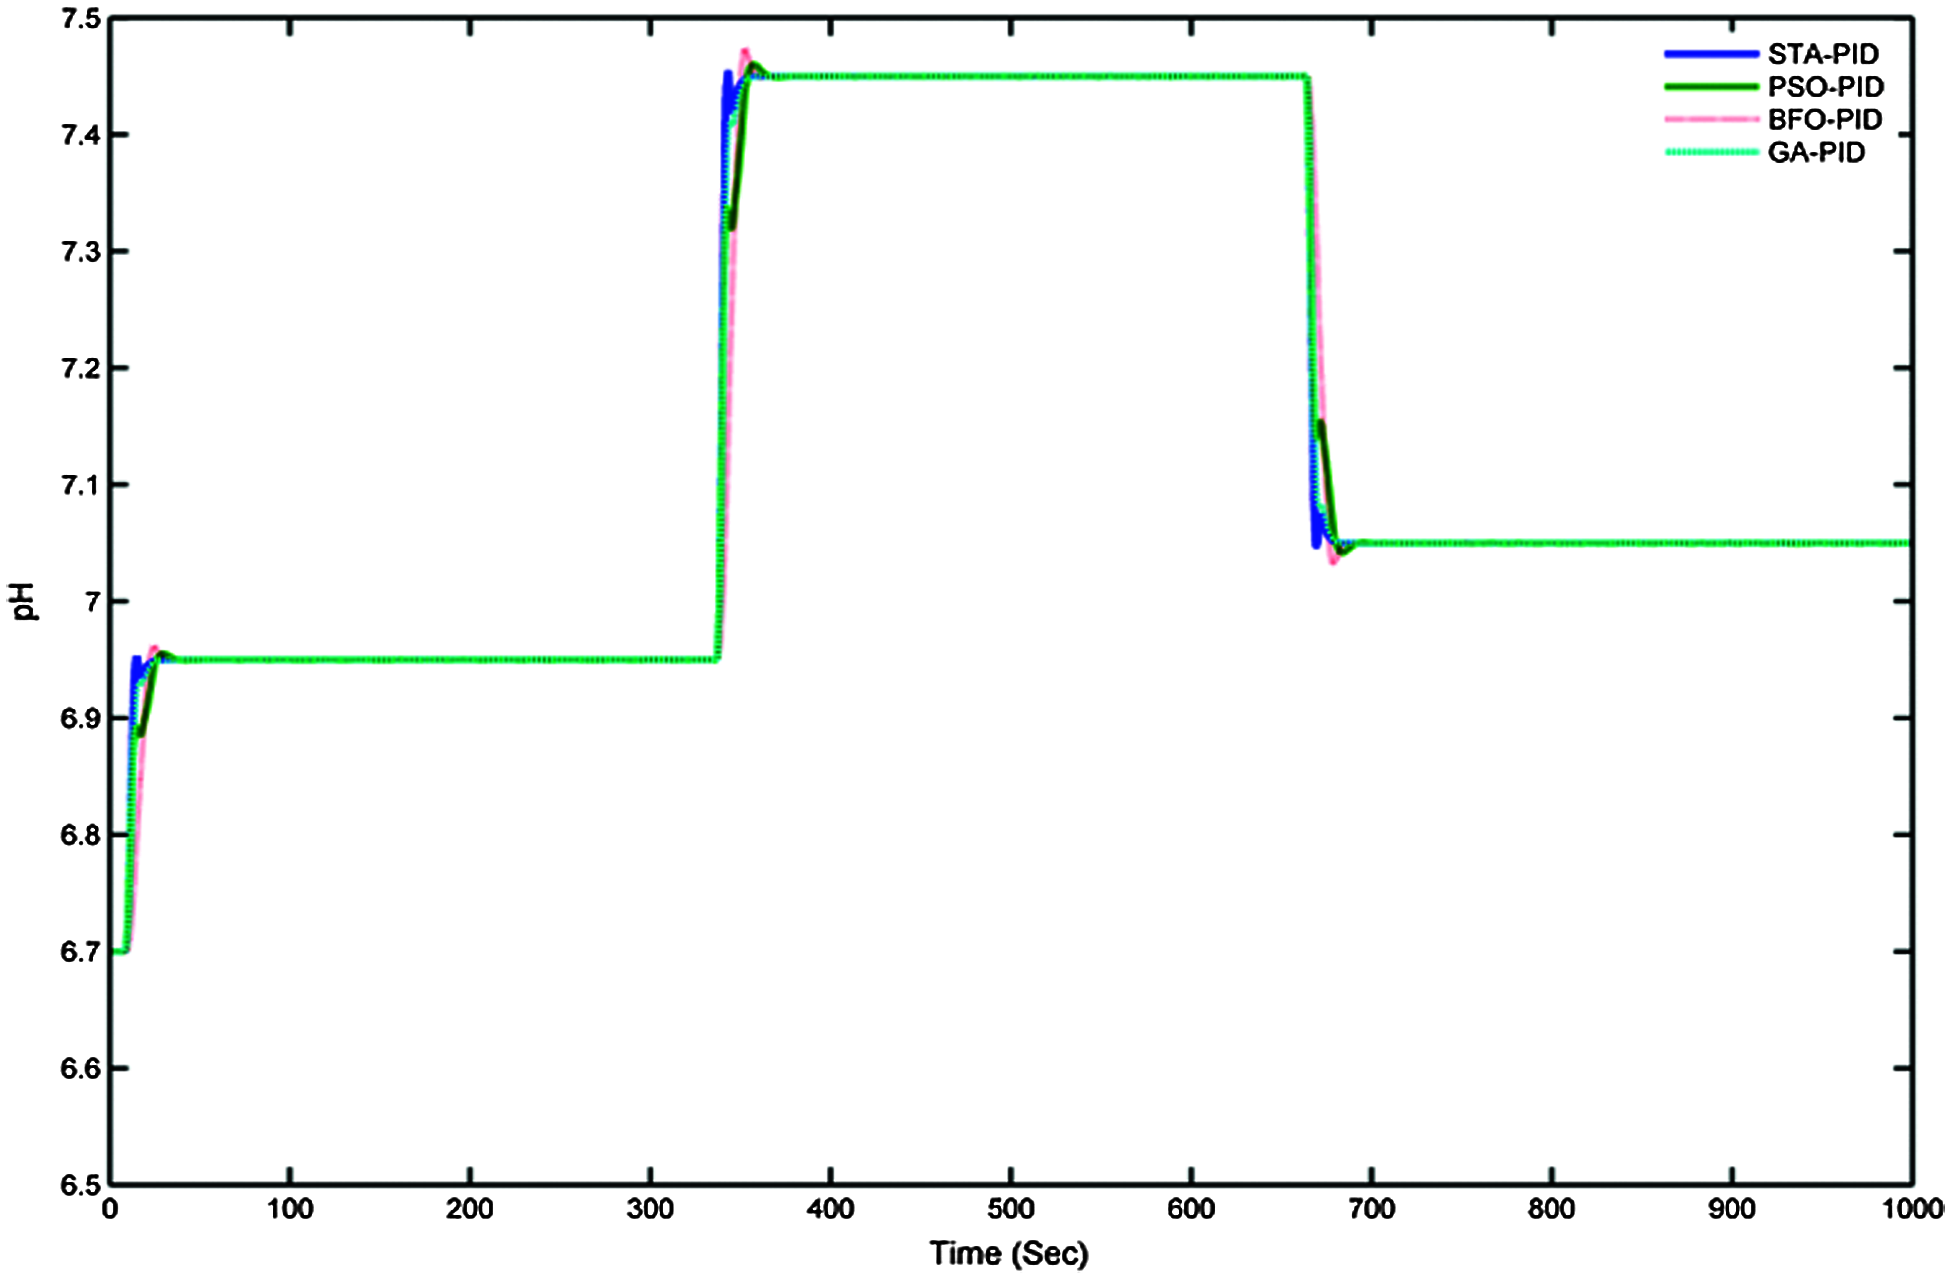
Figure 17: Servo performance measures of various controllers
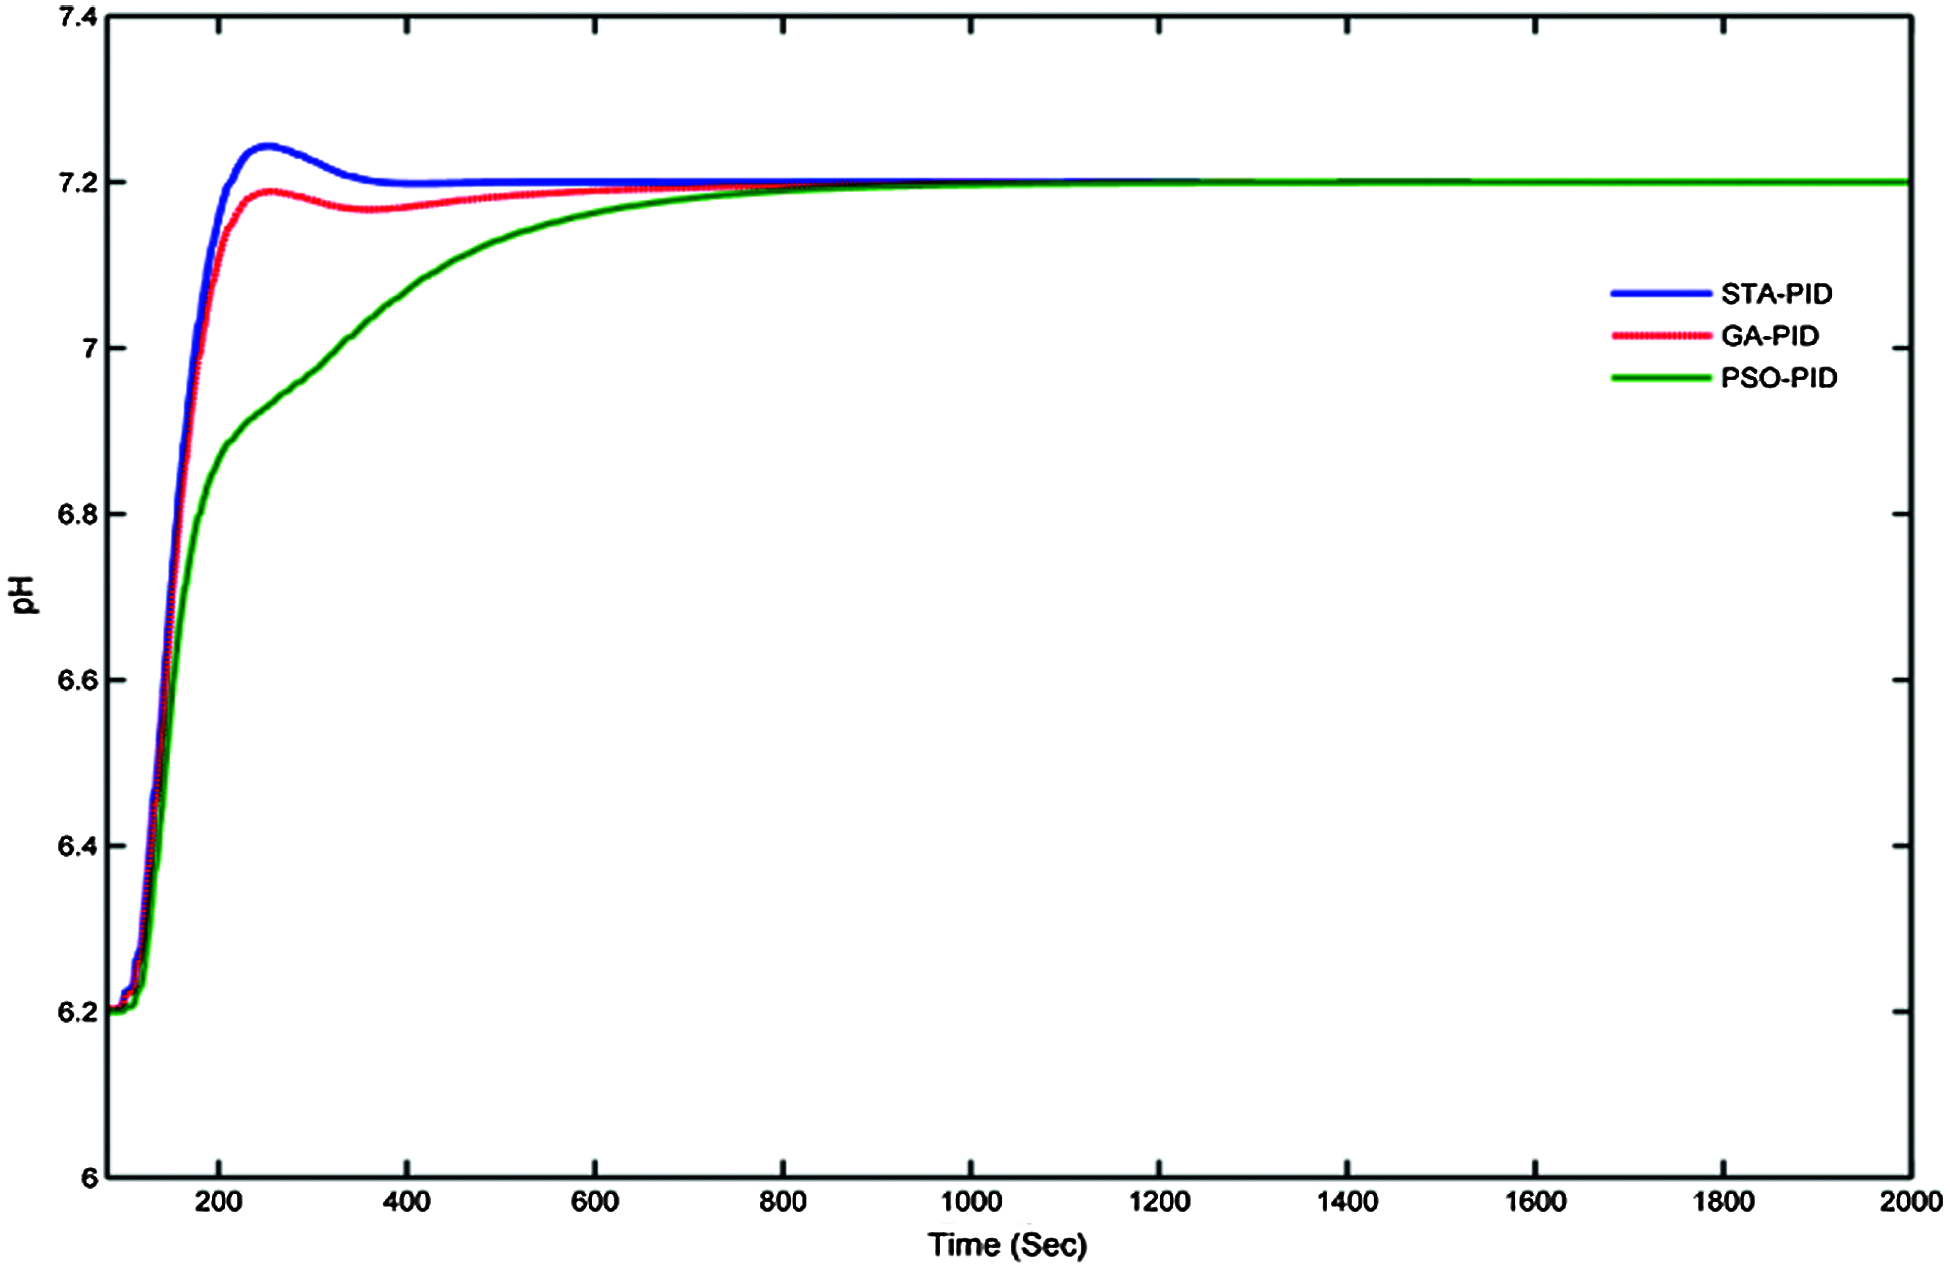
Figure 18: Response of STA-PID controller to the system
The disturbance is given to the flow rate around 50 to 100 s and the corresponding performances are plotted in Fig. 20.
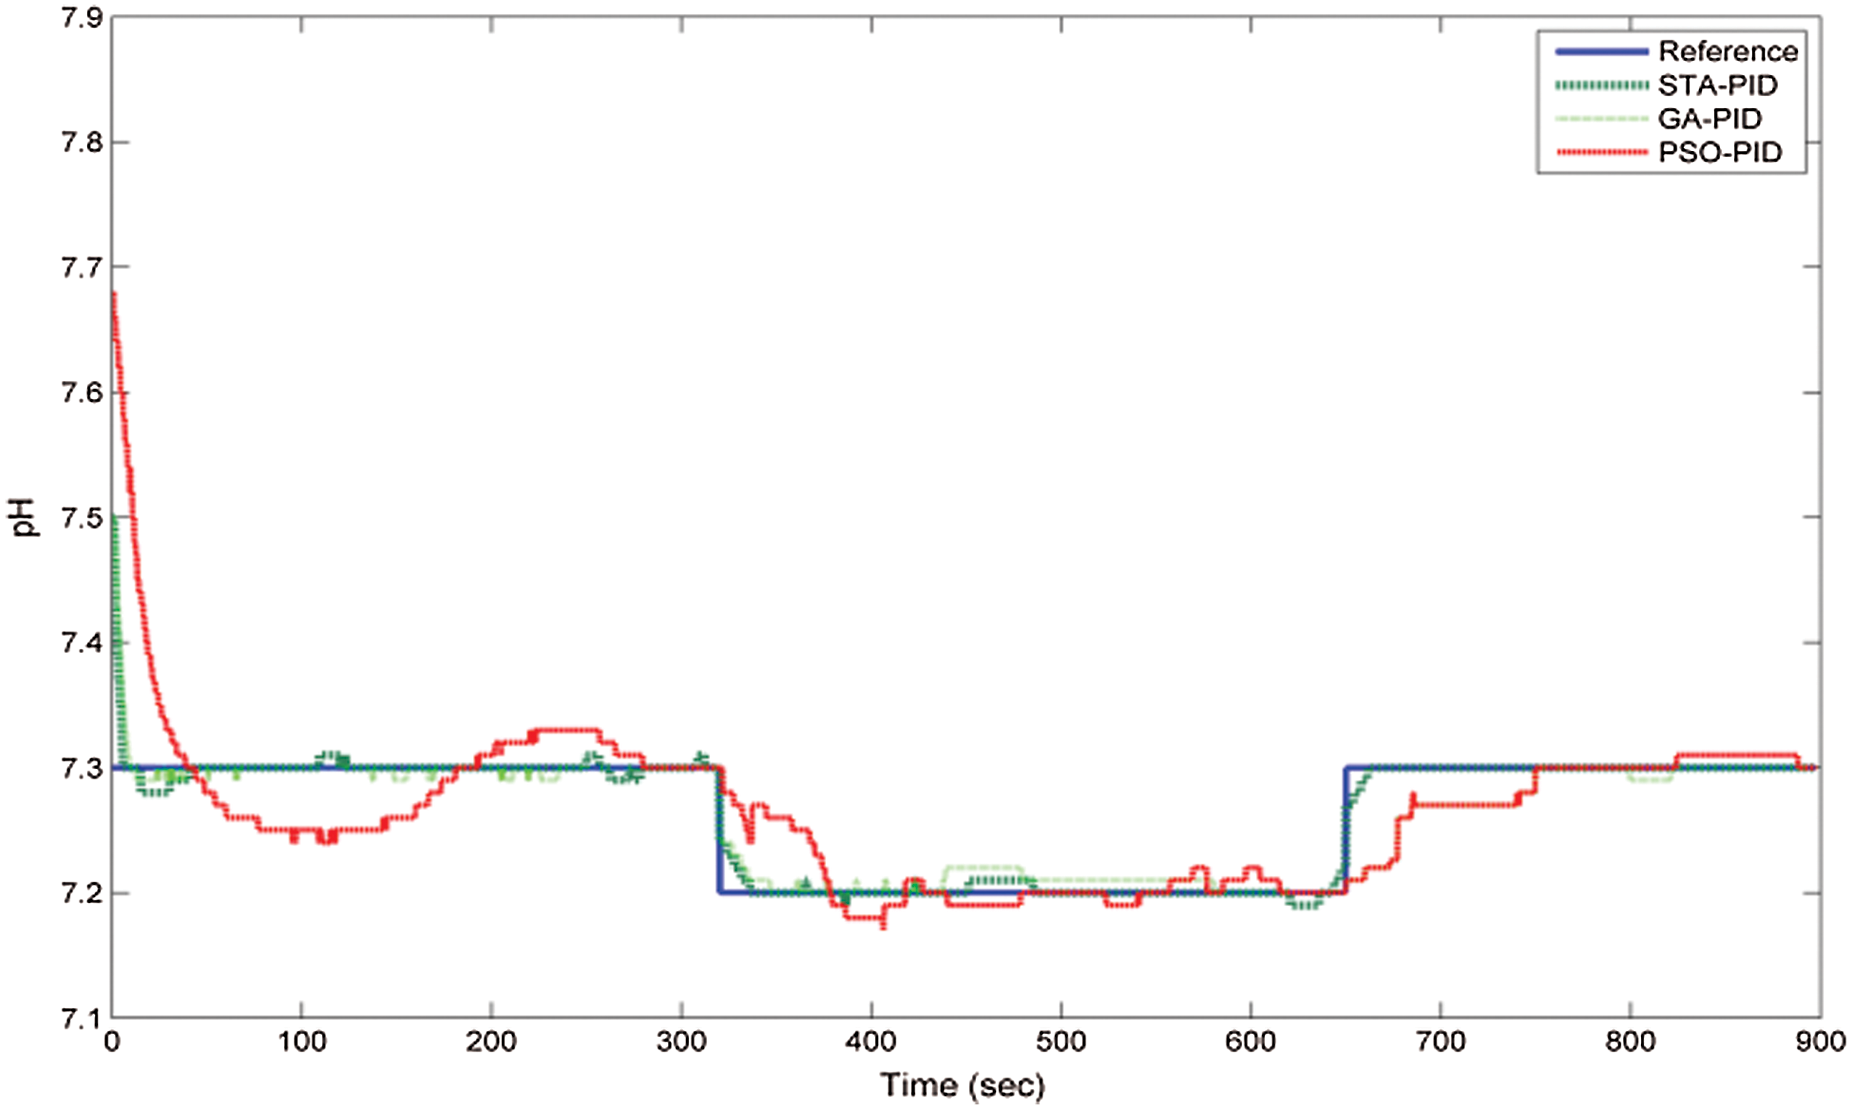
Figure 19: Servo performances of various proposed controllers
GA-PID and PSO-PID reject the disturbance slowly than the STA-PID controller design. STA-PID controller suddenly reacts to the disturbances and maintains the pH value at the desired value. Milk of lime is added at the rate of 48 L/min initially to the juice and after 50 s the lime addition reduces to 44 L/min to observe the effectiveness of disturbance rejection. The controller effectively handles the load variations and maintains the pH value as desired pH value. The comparative analysis instructs the researchers about the outperformance of the STA-PID controller.
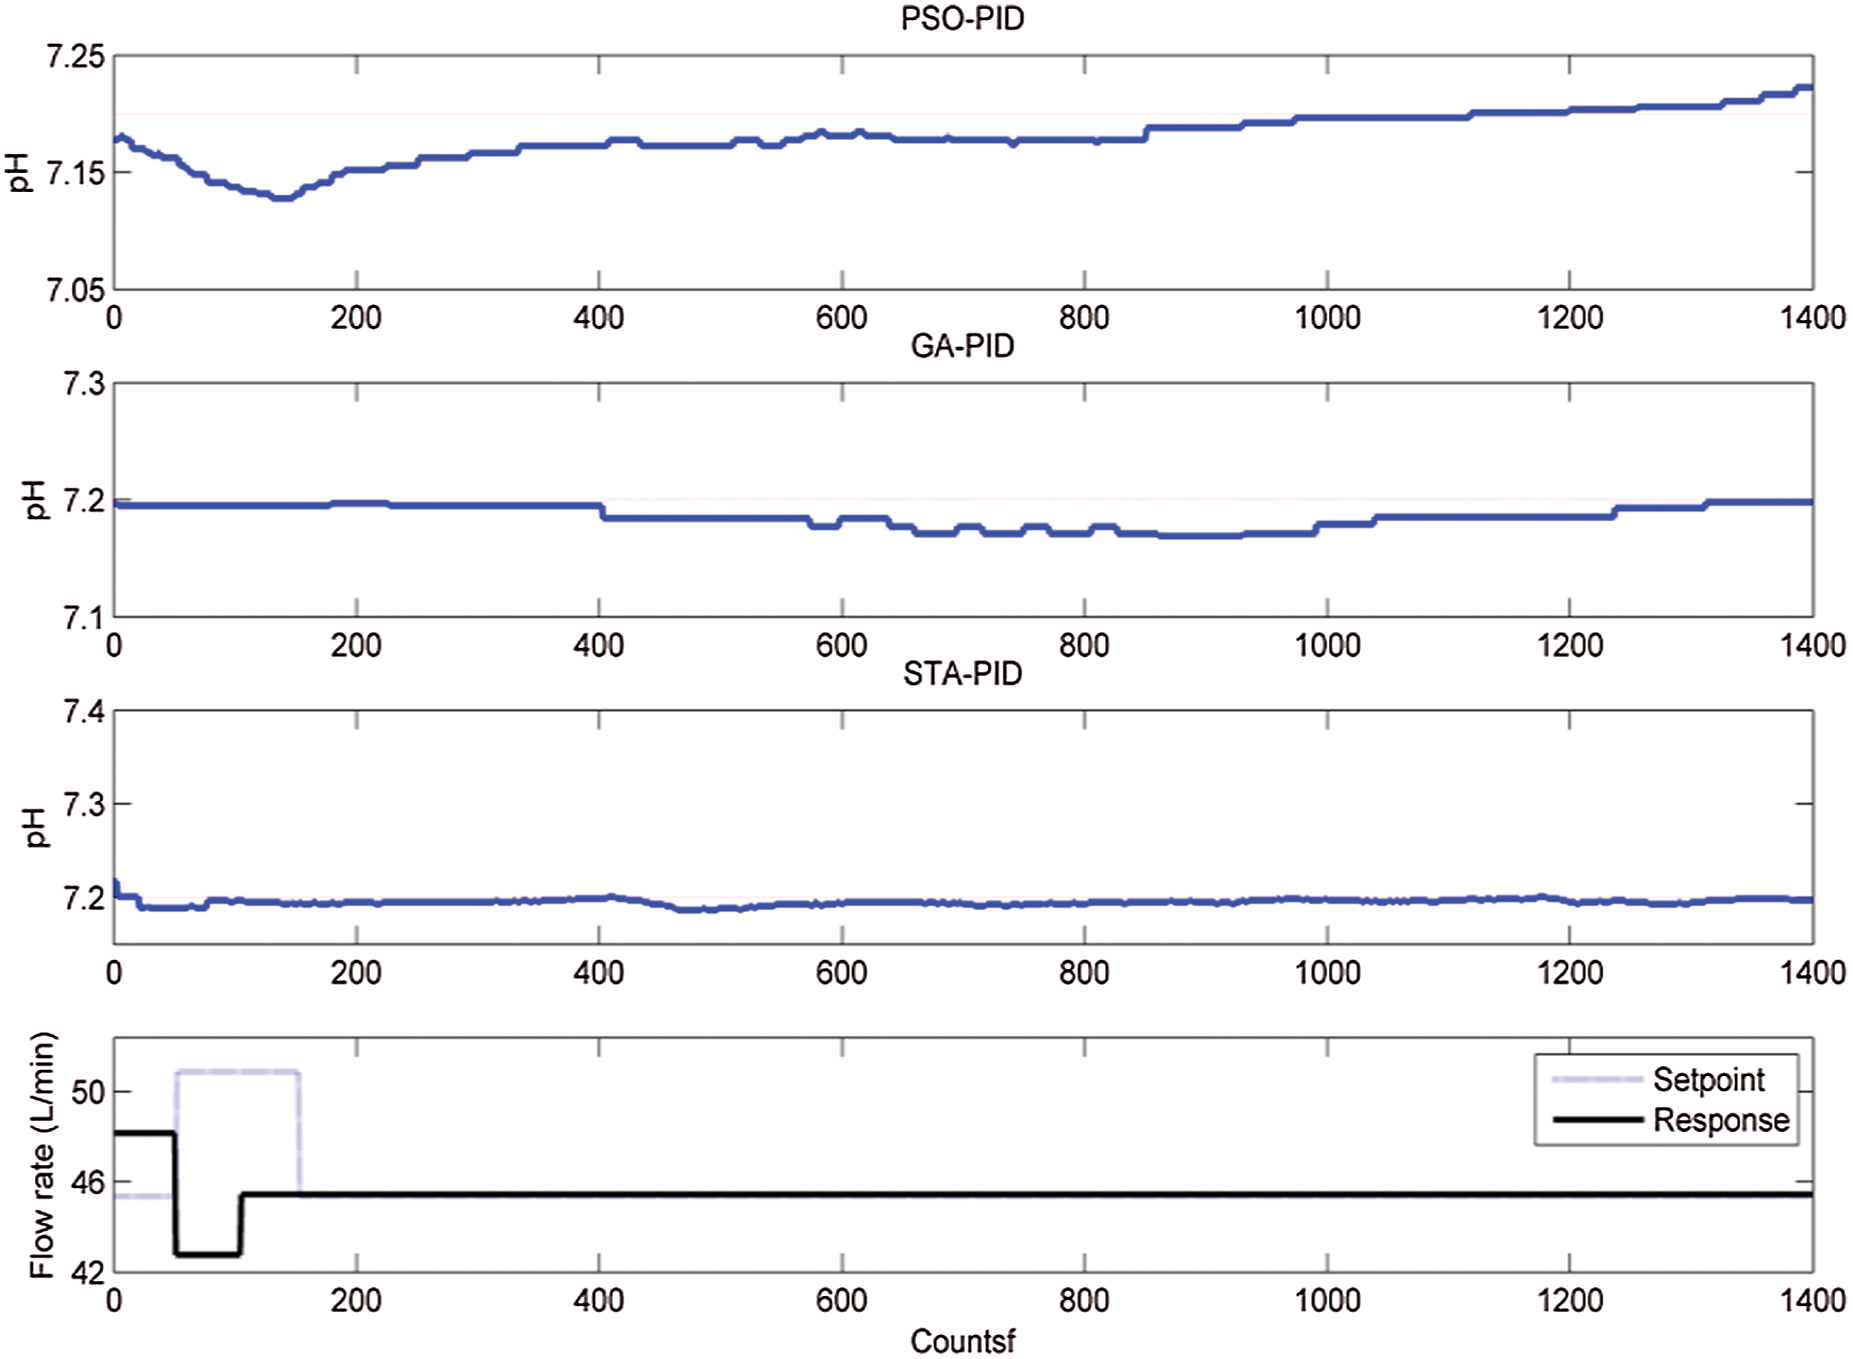
Figure 20: Disturbance rejection response of various controllers
The performance of the PID controller on the STA-ARMAX model is initially tested, and the performances are further improved by applying the metaheuristic algorithm. Different methods of metaheuristic algorithm are applied to the PID controller gain value adjustment, and it is simulated with different criteria. The results are tabulated for the comparative analysis of the algorithms on controller parameter tuning. The performances of the controller which has been tuned by the algorithms are analysed, and it is observed that the algorithm tuned PID is more effective and more robust than the standard PID controller. Further, the comparative results are explained that among all the algorithms discussed in this research for controller parameter tuning of PID, STA is more optimized and provides the response which is closer to the desired response. The controller values are tuned effectively when the STA is used to obtain the gain values since the error convergence of the STA is more optimal than other algorithms. Finally, it is concluded that the performance of STA is more optimal than other algorithms and it could be modified with some internal parameters consequently the performance of PID controller tuning is becoming more optimum.
Funding Statement: This research has been funded by Dirección General de Investigaciones of Universidad Santiago de Cali under call No. 01-2021.
Conflicts of Interest: The authors declare that they have no conflicts of interest to report regarding the present study.
1. G. A. Kent, W. J. Allen, C. P. Hoare and T. F. Dixon, “The effect of extraneous matter on factory throughput and performance,” in Proc- Australian Society of Sugar Cane Technologists, Watson Ferguson And Company, pp. 38–43, 1999. [Google Scholar]
2. P. J. McGuire, I. Martin, B. Rich and G. A. Kent, “The effect of whole crop harvesting on crop yield,” in Proc- Australian Society of Sugar Cane Technologists, Mackay, Queensland, Australia, pp. 52–57, 2011. [Google Scholar]
3. Y. Zhu, Y. Jiang, Z. Zhu, H. Deng, H. Ding et al., “Preparation of a porous hydroxyapatite-carbon composite with the bio-template of sugarcane top stems and its use for the Pb (II) removal,” Journal of Cleaner Production, vol. 187, pp. 650–661, 2018. [Google Scholar]
4. C. Ramalingam, “An efficient applications cloud interoperability framework using i-anfis,” Symmetry, vol. 13, no. 2, pp. 1–14, 2021. [Google Scholar]
5. D. Moller, B. Ross, B. Steve and B. Hakan, “Whole crop processing at broadwater mill: Impacts on process operations,” in Proc- Australian Society of Sugar Cane Technologists, Bundaberg, Queensland, Australia, pp. 573–587, 2010. [Google Scholar]
6. B. M. Muir, G. Eggleston and B. Barker, “The effect of green cane on downstream factory processing,” in Proc- Annual Congress-South African Sugar Technologists’ Association, Mount Edgecombe, South Africa, pp. 164–199, 2009. [Google Scholar]
7. P. Mohan, “Addressing semantics standards for cloud portability and interoperability in multi cloud environment,” Symmetry, vol. 13, no. 2, pp. 1–18, 2021. [Google Scholar]
8. S. Shaojian, W. Jinchuan, L. Xiaofeng and Liu Huixia, “Modeling of key production indices and operating parameters optimized set for sugar clarification process,” in Proc- 31st Chinese Control Conf. IEEE, Hefei, China, pp. 7113–7118, 2012. [Google Scholar]
9. B. Kuppuraj and S. Chellai, “An enhanced security measure for multimedia images using hadoop cluster,” International Journal of Operations Research and Information Systems (IJORIS), vol. 12, no. 3, pp. 1–10, 2021. [Google Scholar]
10. A. Vinothini and S. B. Priya, “Survey of machine learning methods for big data applications,” in IEEE, 2017 Int. Conf. on Computational Intelligence in Data Science (ICCIDSChennai, India, pp. 1–5, 2017. [Google Scholar]
11. N. Mullapudi and V. Pillay, “Elimination of the juice clarifier and the drum vacuum filter at a cane sugar plant,” Sugar Industry-Zuckerindustrie, vol. 145, no. 11, pp. 670–673, 2020. [Google Scholar]
12. A. W. Hermansson and S. Syafiie, “Model predictive control of pH neutralization processes: A review,” Control Engineering Practice, vol. 45, no. 1, pp. 98–109, 2015. [Google Scholar]
13. M. Ławryńczuk, “Modelling and predictive control of a neutralization reactor using sparse support vector machine Wiener models,” Neurocomputing, vol. 205, pp. 311–328, 2016. [Google Scholar]
14. M. Rajalakshmi, S. Jeyadevi and C. Karthik, “Computer-aided controller design for a nonlinear process using a Lagrangian-based state transition algorithm,” Circuits, Systems, and Signal Processing, vol. 39, no. 2, pp. 977–996, 2020. [Google Scholar]
15. X. Zhou, S. Peng, L. Cheng-Chew, Y. Chunhua and G. Weihua, “A dynamic state transition algorithm with application to sensor network localization,” Neurocomputing, vol. 273, no. 2, pp. 237–250, 2018. [Google Scholar]
16. C. Karthik, K. Valarmathi and R. Prasanna, “Modelling and control of chemical process in sugar industry,” in Proc- International Conference on VLSI, Communication & Instrumentation, Kottayam, Kerala, India, pp. 20–26, 2011. [Google Scholar]
17. C. Karthik, M. Rajalakshmi, G. Saravanakumar, K. Asan Mohideen, P. Sanjeevi et al., “Modified cascade controller design for unstable processes with large dead time,” IEEE Access, vol. 8, pp. 157022–157036, 2020. [Google Scholar]
18. O. I. Khalaf, “Preface: Smart solutions in mathematical engineering and sciences theory,” Mathematics in Engineering, Science and Aerospace, vol. 12, pp. 1–4, 2021. [Google Scholar]
19. S. Sengan, G. R. K. Rao, O. I. Khalaf and M. R. Babu, “Markov mathematical analysis for comprehensive real-time data-driven in healthcare,” Mathematics in Engineering, Science and Aerospace, vol. 12, pp. 77–94, 2021. [Google Scholar]
20. X. Lin and L. Yun-peng, “Modeling for the clarifying process of sugar mills with esn,” in Chinese Intelligent Automation Conference, CIAC 2013. Proceedings: Lecture Notes in Electrical Engineering, pp. 625–632, 2013. [Google Scholar]
 | This work is licensed under a Creative Commons Attribution 4.0 International License, which permits unrestricted use, distribution, and reproduction in any medium, provided the original work is properly cited. |