DOI:10.32604/iasc.2022.021929
| Intelligent Automation & Soft Computing DOI:10.32604/iasc.2022.021929 | |
| Article |
A Morphological Image Segmentation Algorithm for Circular Overlapping Cells
1Department of Information Engineering, Shaoyang University, Shaoyang, 422000, China
2Department of Information Science and Engineering, Hunan First Normal University, Changsha, 410205, China
3School of Resource Environment and Safety Engineering, South China University, Hengyang, 421001, China
4Department of Applied Mathematics and Statistics, College of Engineering and Applied Sciences, Stony Brook University, NY, 11794, USA
*Corresponding Author: Yanpeng Wu. Email: xjzxwyp@hnfnu.edu.cn
Received: 20 July 2021; Accepted: 21 August 2021
Abstract: Cell segmentation is an important topic in medicine. A cell image segmentation algorithm based on morphology is proposed. First, some morphological operations, including top-hat transformation, bot-hat transformation, erosion operation, dilation operation, opening operation, closing operation, majority operation, skeleton operation, etc., are applied to remove noise or enhance cell images. Then the small blocks in the cell image are deleted as noise, the medium blocks are removed and saved as normal cells, and the large blocks are segmented as overlapping cells. Each point on the edge of the overlapping cell area to be divided is careful checked. If the shape of the surrounding area is a corner and its angle is smaller than the specified value, the overlapping cell will be divided along the midline of the corner. The length of each division is about a quarter of the diameter of a normal cell. Then small blocks are deleted, and medium blocks are removed and saved, after the edges of all blocks are smoothed. This step is repeated until no dividing point is found. The last remaining image, plus the saved blocks, is the final segmentation result of the cell image. The experimental results show that this algorithm has high segmentation accuracy for lightly or moderately overlapping cells.
Keywords: Cell image; circular overlapping cells; segmentation; morphology
Cells are the basic unit of biological tissues. State analysis of cells is an important subject in medicine. Researchers study the shape, life cycle, position, speed, trajectory and other information of cells by observing the morphology of cells. For the research of cells’ behavior, it is necessary perform quantitative analysis of cells, such as cell size measurement, cell counting, and cell tracking, etc. The accuracy of cell segmentation operation will affect the results cell counting and cell tracking.
With the advancement of microscopic imaging technology, researchers can easily obtain a large number of high-quality cell images, which also provides a basis for cell analysis. However, data analysis of medical cell images usually encounters the following difficulties:
(1) Cell images have low resolution and are difficult to segment. Therefore, cell images usually require preprocessing.
(2) Overlapping cells often appear in cell images, which look like a large cell and lead to under-segmentation.
(3) For cell images with uneven background distribution, high noise, and dense cell populations, it is difficult for traditional image segmentation algorithms to obtain accurate segmentation results.
The acquisition cost of cell images is higher than that of ordinary images, so training samples may be insufficient.
Due to the richness, heterogeneity and complexity of cell images, it is difficult to manage, process and analyze them. With the development of image processing technology based on computer vision, automatic analysis of biomedical images has become possible and has gradually become the key to the development of cell biology. In this article, morphological methods will be used for quality enhancement and edge segmentation of overlapping cell images.
The purpose of cell image segmentation is to simplify cell images and extract interesting information from them, and to provide a basis for subsequent image analysis and understanding. Image segmentation is the process of dividing an image into several meaningful areas. The cell image segmentation algorithm can realize cell segmentation and detection, and prepare for cell tracking and cell counting.
Current imaging tools and medical image processing and analysis platforms are developing rapidly, such as Cell Profiler [1] and Image J [2], which integrate a large number of modular image processing algorithms, which can process images in batches and provide extended interfaces.
At present, thousands of image segmentation algorithms have been proposed, but the development of cell segmentation algorithms is relatively lagging. Most cell segmentation algorithms are designed for specific types of cells. Therefore, there is currently no universal cell segmentation algorithm.
In order to find the most suitable segmentation method for the target cell image and improve the accuracy of cell segmentation and classification, it is necessary to fully understand the characteristics of various algorithms and the characteristics of cell images, and comprehensively consider the factors of cell structure. The hardware platform, the running speed of the algorithm, the segmentation accuracy of the algorithm, the generalization ability of the algorithm, the training speed of the sample, the difficulty of making the sample, etc.
Common segmentation algorithms include threshold segmentation methods [3–6], region-based segmentation methods [7–9], active contour-based segmentation methods [10,11], graph theory-based segmentation methods [12–14] and images segmentation method based on deep learning [15–17] etc.
Based on the Otsu algorithm, Cseke [18] maximized the intra-class variance between the black, gray, and white regions in the cell image through a recursive method, and automatically selected the segmentation threshold to achieve cell segmentation. However, this method cannot divide the cytoplasm.
Rezatofighi et al. [19] used Gram-Schmidt orthogonalization to enhance the color vector of the cell area, and then determined the segmentation threshold according to the gray histogram, and segmented the nucleus, and finally used the Snake algorithm to segment the cytoplasm.
Hou et al. [20] used an improved Snake model to segment and repair overlapping cells.
Arteta et al. [21] proposed a cell segmentation method based on MSER detection, which has achieved good results in many types of cell detection tasks, but cannot obtain accurate cell edges.
Dimopoulos et al. [22] proposed a cell segmentation algorithm based on MPCS, which uses a circle detection algorithm based on Hough transform to detect seed regions. Although the algorithm can obtain more accurate cell edges, the detection results are very unstable.
In 2012, Mohapatra et al. [23] proposed cell segmentation based on linked networks. The algorithm classifies the color of the pixels in the cell image and divides the cells into nucleus and cytoplasm.
Huang et al. [24] used co-occurrence matrix and morphological information to extract 85 texture and morphological features, then used PCA for feature dimension reduction, and K-Means for five-category classification. The classification accuracy of this method for neutrophils is relatively low.
Wang et al. [25] used color information conversion, distance conversion and GVF Snake method to extract cells, and used SVM to classify the cells.
Gu et al. [26] used cell edge phase angle information and linear interpolation to subdivide the cytoplasm, but this method is not suitable for cell images with severe cell overlap.
Ding et al. [27] used a sub-level algorithm for image segmentation of overlapping cells.
Hou et al. [28] used mathematical morphology to segment bone marrow cells.
Wang et al. [29] used the regional growth method to achieve the segmentation of breast cells.
Ruberto et al. [30] proposed a limit corrosion algorithm, which repeatedly corrodes the overlapping cells through morphological corrosion until the seed point disappears. After the seed point image is obtained, the segmentation operation is performed through the watershed segmentation algorithm [31] to obtain the cell segmentation image.
Hou et al. [32] used distance transformation to convert the pixel information of adhering cells into position information, and then segmented the cells through watershed transformation to obtain segmented images. The distance transformation algorithm is likely to cause over-segmentation problems.
Qu et al. [33] used the chain code theory to convert the boundary information of the image into chain code information, and then looked for possible pits as separation points, and finally separated the overlapping cells. The contour tracking algorithm will cause under-segmentation.
In summary, there are some algorithms for overlapping cell segmentation, but their segmentation effect needs to be further improved.
3 Basic Morphology Operations of Binary Image
Mathematical morphology was proposed in 1964 by Tan et al. [34]. Mathematical morphology is based on set-based algebra, and its main research content is to quantitatively analyze the morphological and structural characteristics of objects. Mathematical morphology is a new method used in the fields of image processing and pattern recognition. At present, mathematical morphology has become a very important and most valuable research field in digital image processing, and has been successfully applied to fingerprint recognition, medical microscopic image analysis, traffic detection, robot vision and other fields.
Mathematical morphology has a complete foundation of mathematical theory. The most notable feature is that it can be directly used to process the geometric structure of the image surface. Compared with spatial domain or frequency domain algorithms, mathematical morphology algorithms have obvious advantages in image processing and analysis. For example, in the process of image restoration, a morphological filter based on mathematical morphology can effectively reduce the noise in the image, while using prior recognition of features and morphological operators to retain important information in the image.
Mathematical morphology can be used to process binary images. The gray value in a binary image has only two values, 0 and 1, which are used as background pixels and target pixels, respectively. Binary morphological processing is the process of transforming structural elements in an image and completing operations such as intersection and union. In binary morphology, the two basic operations of erosion and dilation can be combined to produce many other actual morphological operations.
Before using mathematical morphology to process binary images, it is necessary to design a structural element to collect the information in the image. Structural elements can usually be represented by some small and relatively simple sets, such as of spherical, linear, rectangular, etc. Different image processing results can be obtained by selecting structural elements of different scales or shapes.
The erosion operation of the binary image is the most basic operation in mathematical morphology. Most mathematical operations are based on the erosion operation. The erosion of the set A is represented by the set B as the structural element.
In Eq. (1), A is the input image, and B is the structural element. A ⊙ B is composed of all the points x that are still included in the set A after the structural element B is translated by x.
The role of the erosion operation of the binary image in image processing is to eliminate the target points in the image that are smaller than the structural elements, and to disconnect the narrow connection between the two targets.
Set A is dilated by set B, which can be expressed as
In Eq. (2), −B is the reflection of set B on origin as a structural element of erosion operation, and AC is the supplementary set of binary image A.
The erosion operation is based on the “subtraction” operation, and all morphological calculations given later are based on the erosion calculation.
The dilation operation will smooth and filter the outer boundary of the target image.
The dilation operation with appropriate structural elements can fill holes in the image that are smaller than the selected structural element and connect two objects closer together.
The process of performing dilation operation and then erosion operation on the target image is called open operation. The opening operation can remove the tiny connections between the image target areas, such as some small burrs and protrusions, to make the image smoother.
Opening operation processing can be expressed as
In Eq. (3), A is the input image, and B is the structural element.
The opening operation can remove isolated small areas in the target area of the image and smooth the burrs on the target boundary while hardly change the size of the target area. Since expansion and erosion are not mutually operated, they can be cascaded together as a new operation.
It is also possible to perform the erosion operation and then the expansion processing, which means the closing operation. The closing operation can remove the small holes in the image target or the concave part at the boundary to smooth the outer boundary of the target area.
Closing operation processing can be expressed as
In Eq. (4), A is the input image, and B is the structural element.
The closing operation can fill the small holes in the target area, connect adjacent areas, and smooth the boundary of the area while hardly change the size of the target area.
Both the binary open operation and the binary close operation can effectively remove the details of the image that are smaller than the structural elements.
The result obtained by subtracting the morphological gray-scale opening operation from the original gray-scale image is called Top-hat transformation, and its mathematical expression is:
The Top-hat transformation process can extract the sharp peaks in the original gray-scale image, and the result of the Bot-hat transformation is the low value in the original gray-scale image. Generally, the contrast of the original gray image can be enhanced by adding the high-hat transform result and subtracting the Bot-hat transform result.
The Bot-hat transformation is the difference between the gray-scale image and the original image after the morphological gray-scale closing operation. Its mathematical expression is:
Top-hat transformation and the Bot-hat transformation are also used to correct the unevenly illuminated image. The Top-hat transform is mainly used to extract bright objects in the dark background area, while the Bot-hat transform is usually used to extract dark objects in the bright background area.
Filling holes can complete the hole filling effect in the area. The process of area filling starts from a point on the boundary. The 8-connected boundary points in the neighborhood of the point that meet the filling conditions are filled with 1.
In Eq. (7), X0 = p, using a 3*3 “cross” structure element. The iterative process ends when until Xk = Xk + 1.
Boundary extraction can be expressed as
In Eq. (8), A is the input image, and B is the structural element.
The edge of image A can be obtained by subtracting the result of erosion operation on A by structural element B from A.
Keep a pixel set to 1 if 5 or more pixel(the majority) in its 3-by-3, 8-connected neighborhood are set to 1; otherwise, set the pixel to 0.
Skeleton is an important topological description of image geometry, which can maintain the topological characteristics of the original target. It has the same number of connections and holes as the original target.
The morphological skeleton of the binary image A can be obtained by selecting a suitable structural element B and performing continuous etching and opening operations on A. Let S(A) denote the skeleton of A, then the expression of the skeleton of image A is
In Eqs. (9) and (10), Sn(A) is the n-th skeleton subset of A, and N is the maximum number of iterations, that is, N = max{n|(A⊙nB) ≠ ∅)∘(A⊙nB) means to use B to corrode A continuously n times, namely
Since the sets (A ⊙ nB) and ((A ⊙ nB)∘B) differ only at the protruding points of the boundary, the difference of the sets (A ⊙ nB)-((A ⊙ nB)∘B) only includes the boundary points of the skeleton.
Knowing the skeleton of the image, the original image can be reconstructed by the method of morphological transformation. This is actually the inverse process of finding the skeleton. The image A reconstructed by skeleton Sn(A) can be expressed as
In Eq. (12), B is the structural element: (Sn(X) ⊕ nB) means that Sn(X) is expanded with B for n consecutive times, that is
4 The Segmentation Algorithm for Overlapping Cells Based on Morphology
Observing the cell image shown in Fig. 1, it is easy to find that this cell image has the following characteristics:
(1) The cell spacing is very small, and it is easy to overlap.
(2) The cell shape is close to circle.
(3) The color of the edge of the unit is darker, which is completely different from the background and is easy to distinguish.
(4) The nucleus is a bright area. The brightness of the cell nucleus has a small difference from the background, so it can easily be mistaken for the background.
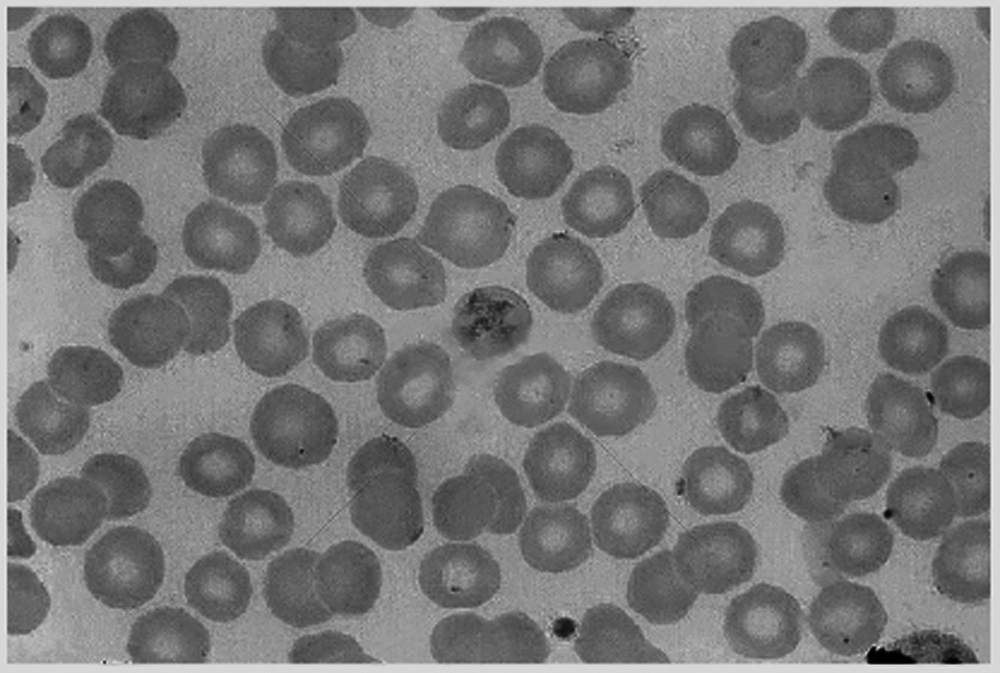
Figure 1: Original cell image
Based on the above characteristics of cells, threshold-based image segmentation algorithms and region-based image segmentation algorithms can be used for cell image segmentation, which will also cause a lot of over-segmentation and under-segmentation.
4.2 The Method of Searching the Dividing Points
When two round cells overlap each other, the junction should be an acute or obtuse angle. Figs. 2a–2c shows the state diagram of 2 cells overlapping, including slightly overlapping, moderately overlapping and severely overlapping.
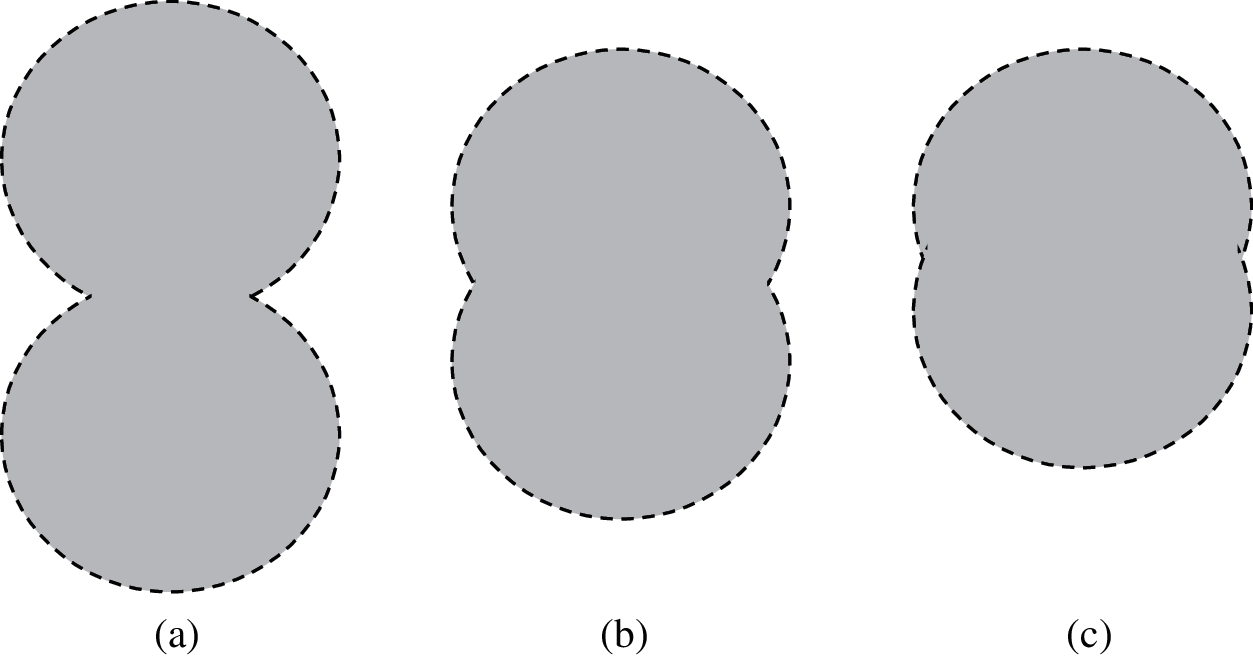
Figure 2: Three kinds of overlapping cell diagram (a) slightly overlapping (b) moderately overlapping (c) severely overlapping
Each edge pit in the cell image is a potential cell dividing point. However, edge pits may also be caused by cell deformation, noise and other factors. Severely overlapping cells are difficult to identify because the connecting part is very similar to the deformed part of the single cell edge. Obviously, the lower the overlap, the easier it is to find the dividing point. Therefore, this article is limited to the study of the recognition and segmentation of lightly overlapping cell images and moderately overlapping cell images.
Let Cidenote the set of i from the point q.
Let nidenote the number of non-zero elements in Ci.
Let zidenote the number of zero elements in Ci.
Let ui denote the proportion of zero-valued elements in Ci.
Let a denote the recessed angle of q. Let b denote the maximum value of a. Fig. 3 is a schematic diagram of the dividing point q. It can be seen from Fig. 3 that
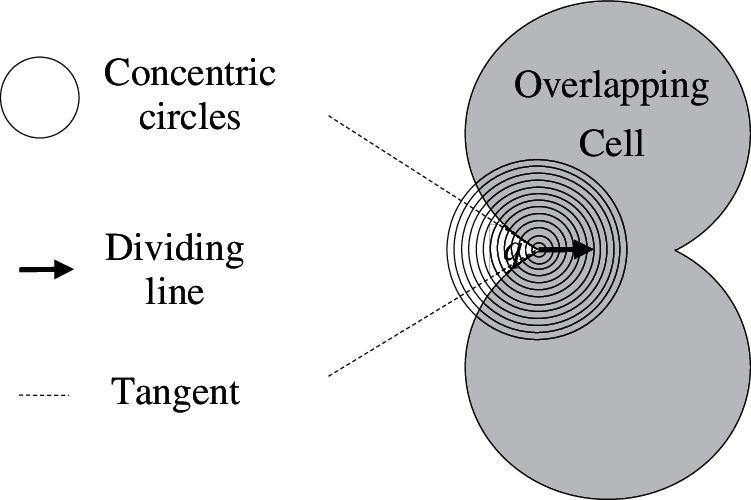
Figure 3: Determination of the dividing point and its dividing direction
Eq. (18) is the necessary condition for q to be the dividing point.
Once the position of q is determined, it can be divided along the midline of the angle a.
4.3 The Basic Process of Segmentation Algorithm for Overlapping Cells Based on Morphology
For the convenience of expression, the following symbols are defined as shown in Tab. 1.

Comments: s is the statistical value. The calculation equations for defining e, t, d are as follows:e = 0.5 ⋅ s, t = 1.5 ⋅ s,
The basic steps of segmentation algorithm for overlapping cells based on morphology are as follows:
Step 1: Read the cell image and convert it to gray-scale image format.
Step 2: Enhance the cell image with Top-hat and Bot-hat transformation.
Step 3: Convert the cell image from a gray-scale image into a binarized image.
Step 4: Remove small blocks with area less than 0.5*e in the foreground.
Step 5: Remove small blocks with area less than 0.25*e in the background.
Step 6: Erode the blocks first and then dilate the blocks to smooth the edge of blocks. An opening operation can also achieve the same effect.
Step 7: A majority operation is applied to every pixel to reduce false dividing points, and thus increase the accuracy of searching the dividing points of overlapping cells in the cell image.
Step 8: Remove small blocks. Small blocks with area less than e are deleted as noise parts.
Step 9: Search the dividing points from edge of blocks.
Step 10: Segment blocks. After calculating the dividing direction, set all pixels with the distance from the dividing point less than d and the coordinate position in the dividing direction to 0.
Step 11: According to the area size of each block, blocks are treated in three categories. Medium blocks with area between e and t are moved to a final target cell image as independent cells. If the final target cell image doesn't exist, create a blank image as target cell image. Large blocks with area more than t are reserved in the cell image as potential overlapping cells.
Repeat step 9–11 until no dividing points are found.
Step 12: The last remaining image, plus the saved blocks, is the final segmentation result of the cell image Output the final segmentation result.
The flow chart of proposed algorithm is shown in Fig. 4.
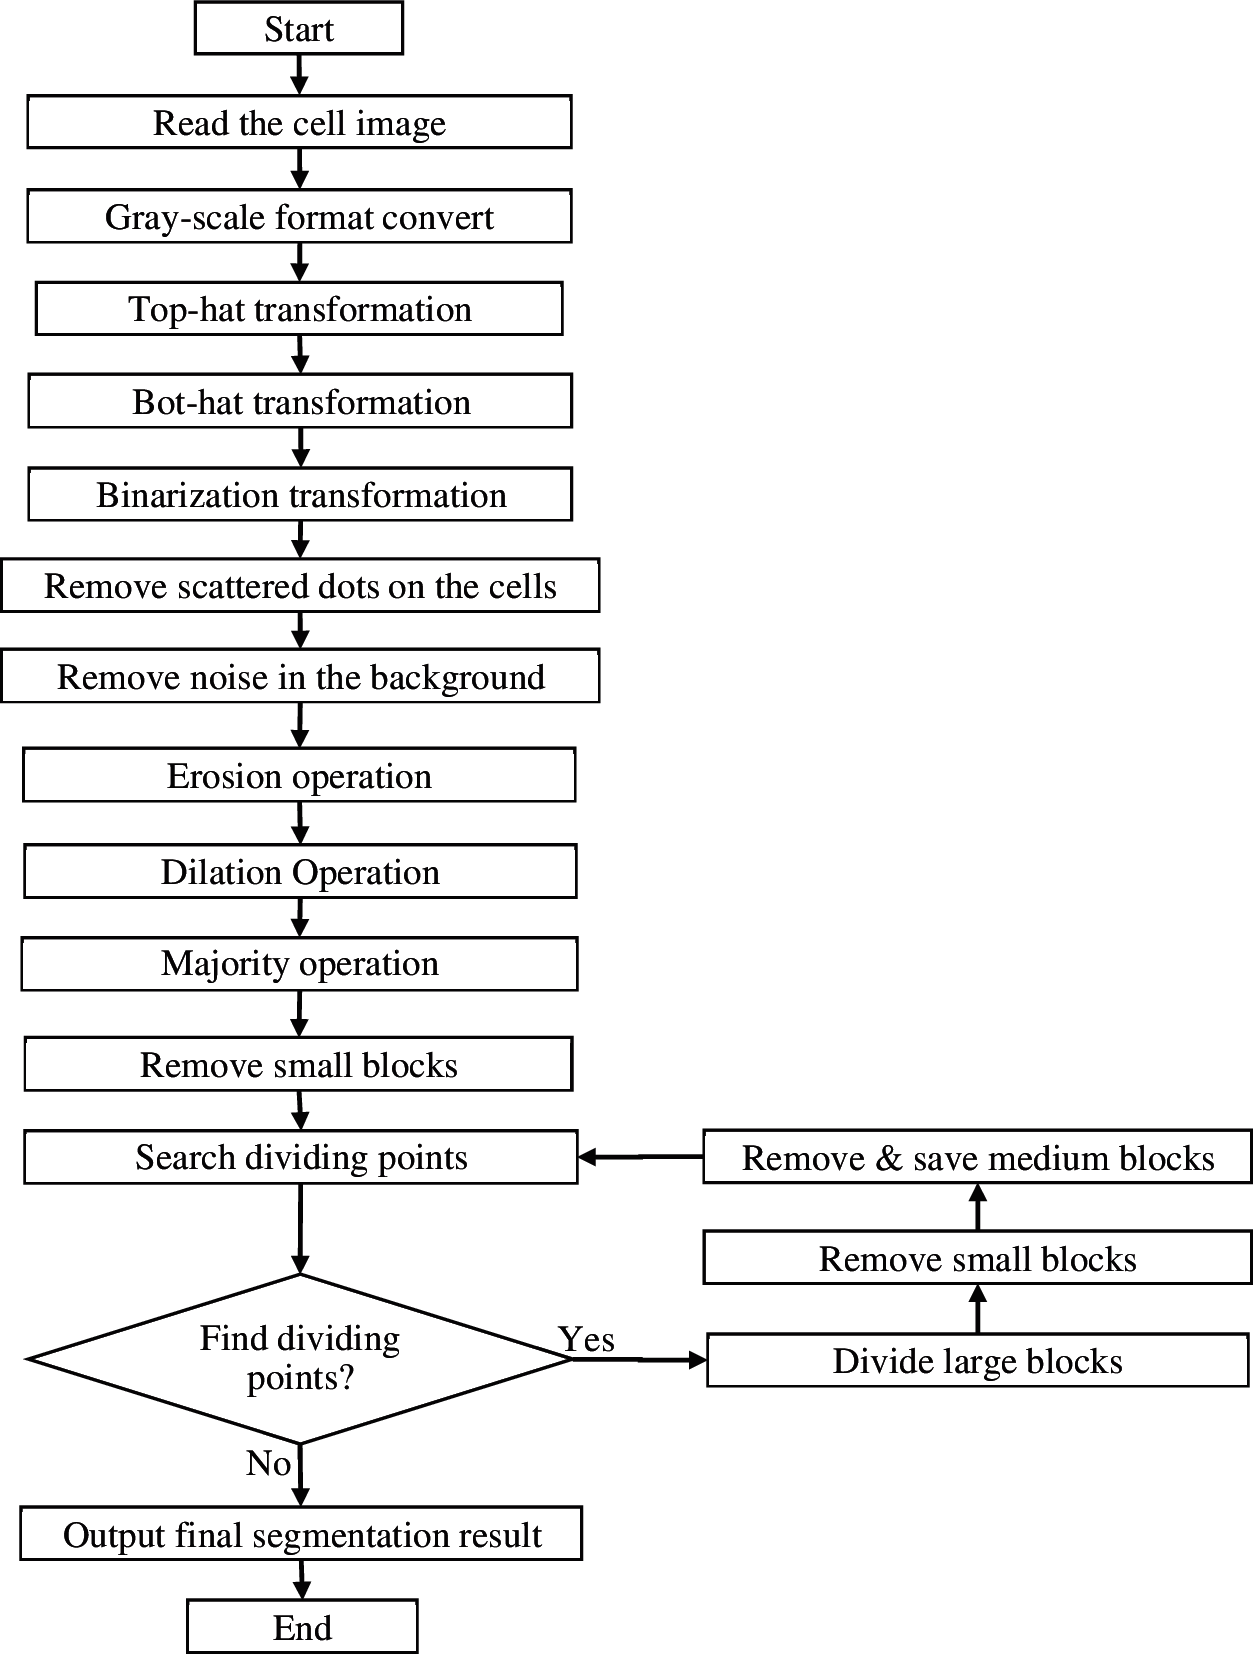
Figure 4: Flow chart of segmentation algorithm for overlapping cells based on morphology
5 Experimental Results and Analysis
A program is compiled to perform overlapping cell separation operations on the cell image shown in Fig. 1.
First, the cell image is transformed by Top-hat and Bot-hat transformation, and the result is shown in Fig. 5.
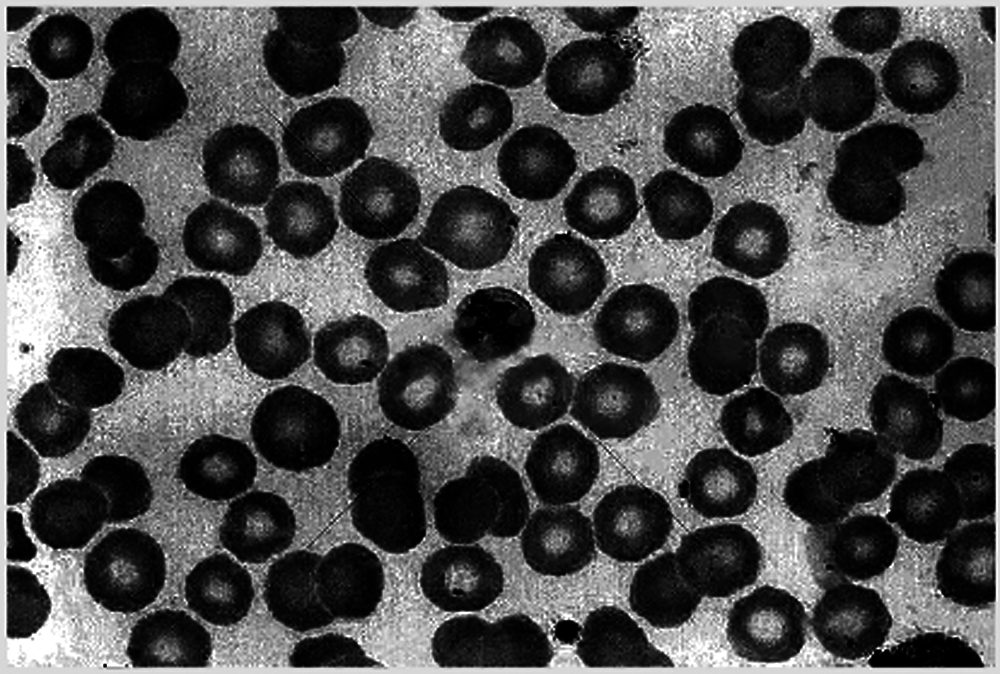
Figure 5: Top-hat & bot-hat transformation
Then the cell image is converted into a binary image, and the result is shown in Fig. 6.
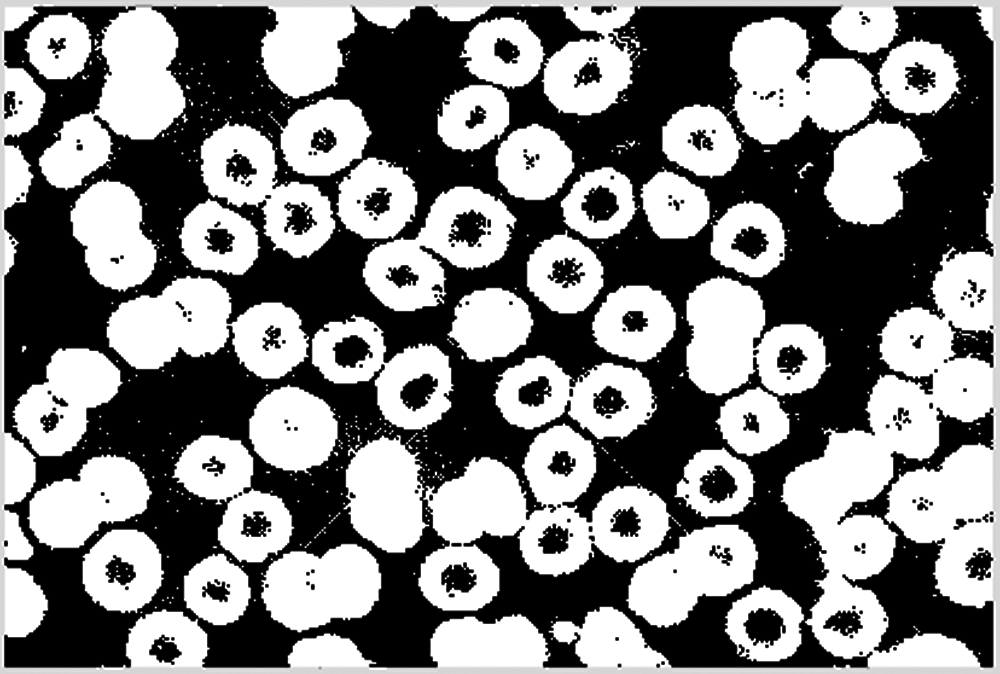
Figure 6: The binarized cell image
Small isolated blocks are eliminated in the cell image, including scatter dots on the cells and noise in the background. The result is shown in Figs. 7 and 8.
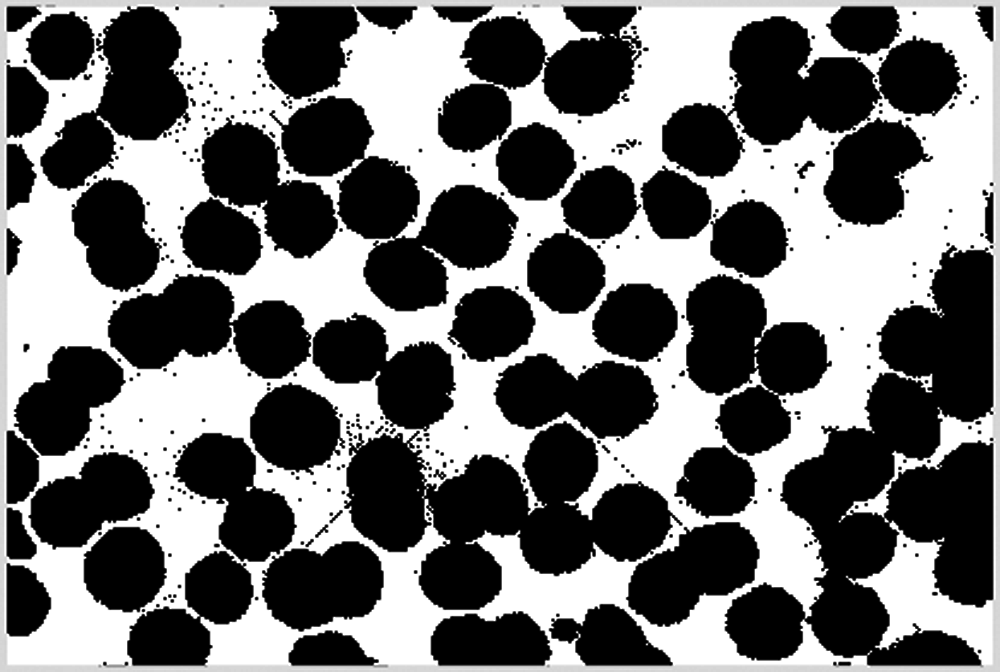
Figure 7: Remove scattered dots on the cells
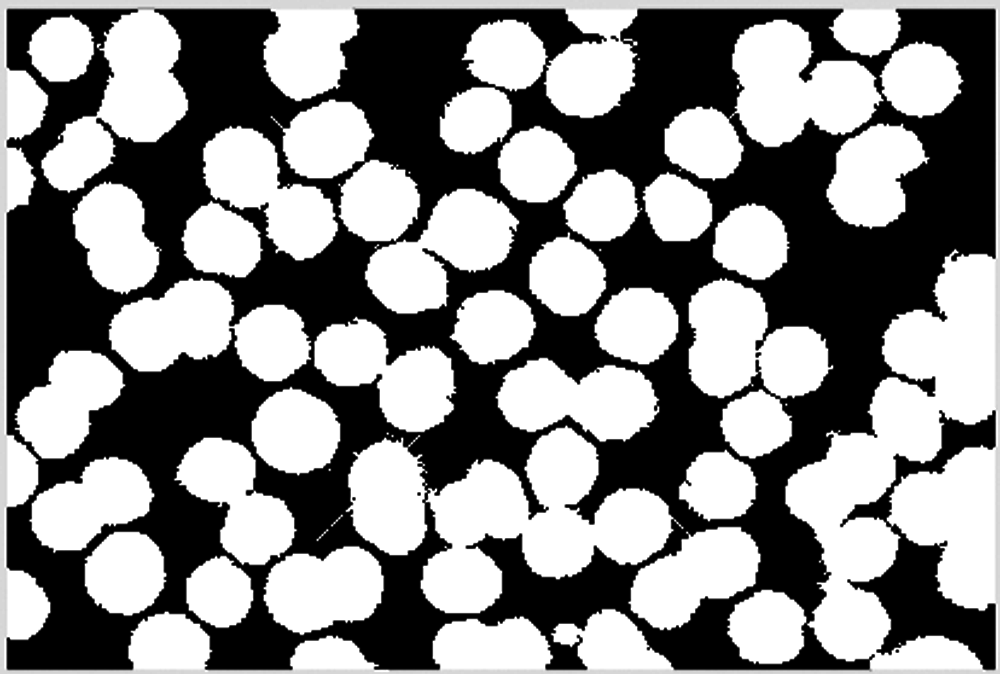
Figure 8: Remove noise in the background
Tiny noises in the cell image such as lines are eliminated with an erosion operation, as shown in Fig. 9.
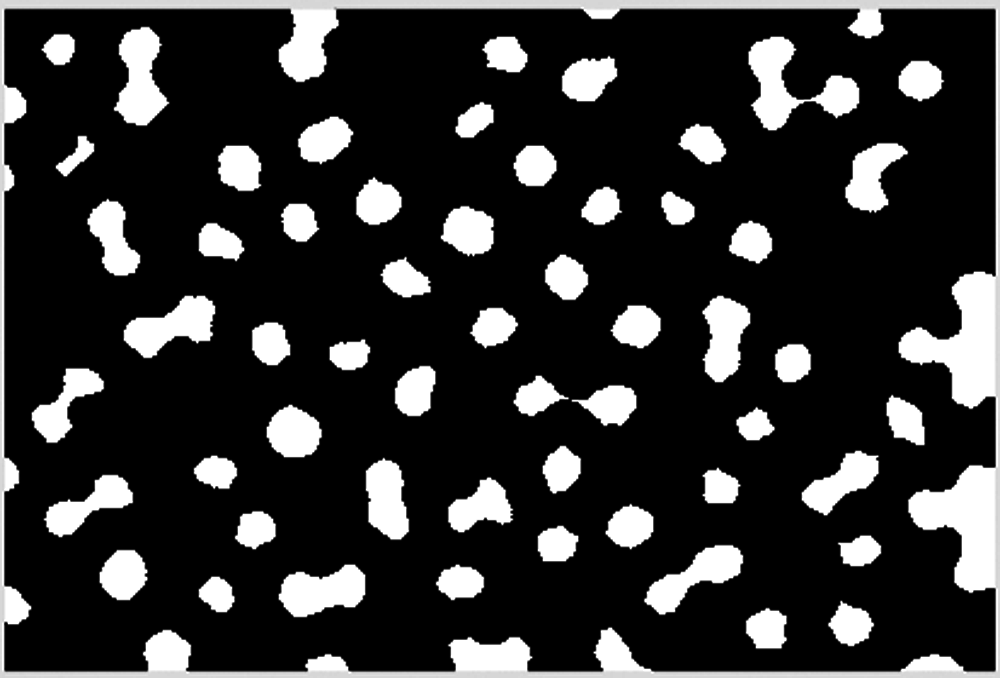
Figure 9: Erosion operation
A dilation operation is performed on the cell image to smooth the cell edge, as shown in Fig. 10.
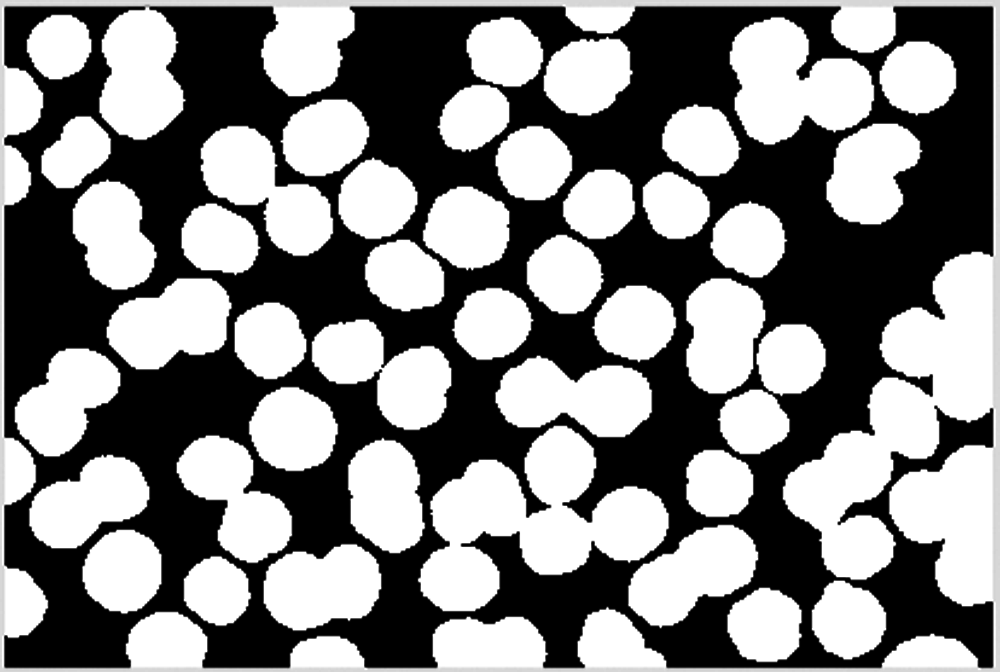
Figure 10: Dilation operation
The cell image is ready to start cell edge segmentation after a majority operation is executed and small blocks are deleted, as shown in Fig. 11.

Figure 11: Delete blocks less than 2000
The cell image is separated into two images according to the area size. The area of normal cells is moderate, as shown in Fig. 12, while the area of overlapping cells is larger, as shown in Fig. 13.
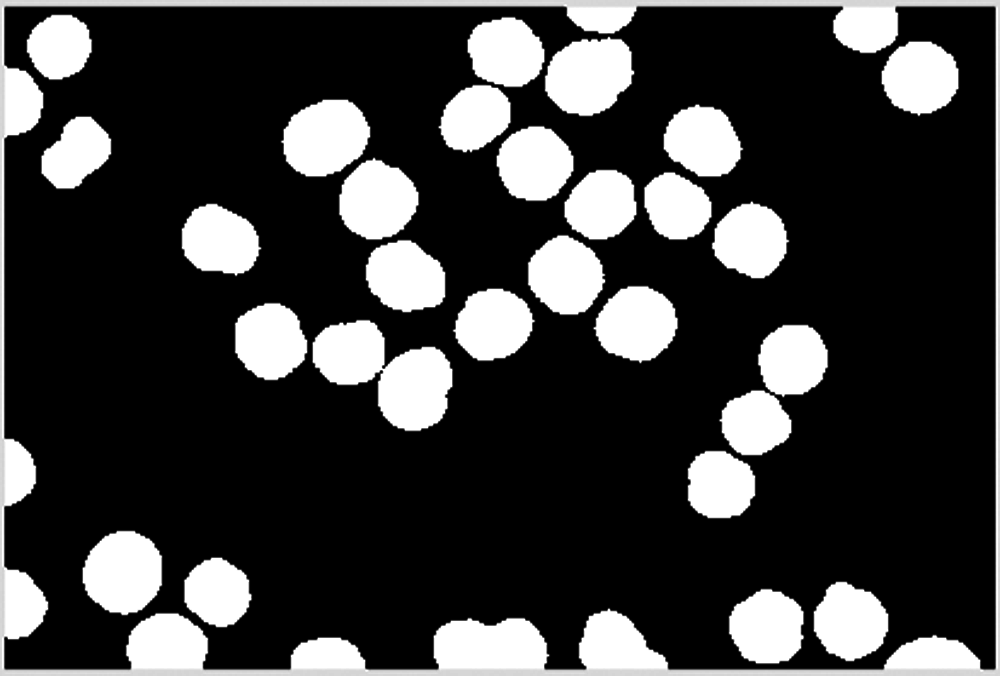
Figure 12: Blocks between 2000 and 8000
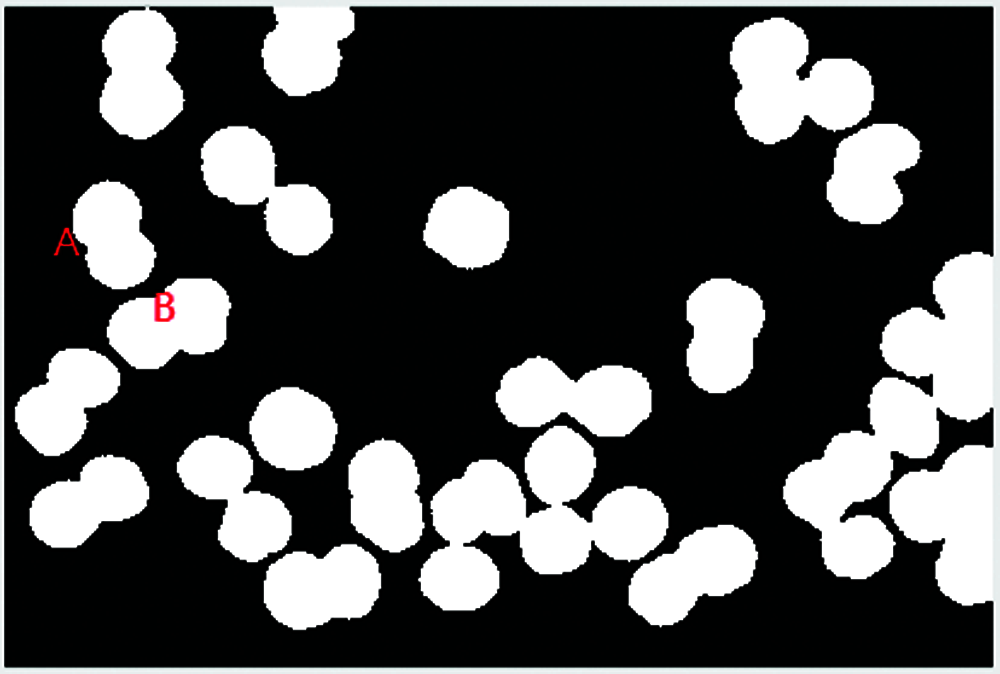
Figure 13: Blocks larger than 8000
Next the potential dividing points of overlapping cells are found. Since the cells are round, all the connecting parts of the overlapping cells must be concave, as point A in Fig. 13. Fig. 14 shows an enlarged view of point A. However, not all recessed areas are the connecting parts of the overlapping cells, as point B in Fig. 13. Fig. 15 shows an enlarged view of point B. Therefore, it is necessary to select a suitable depression angle threshold to determine whether a pixel in the cell image is the connection point of the overlapping cells.
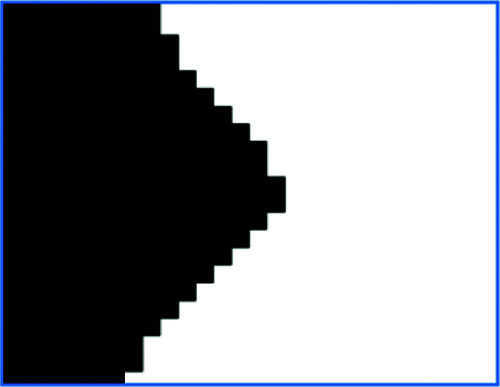
Figure 14: Enlarged point A
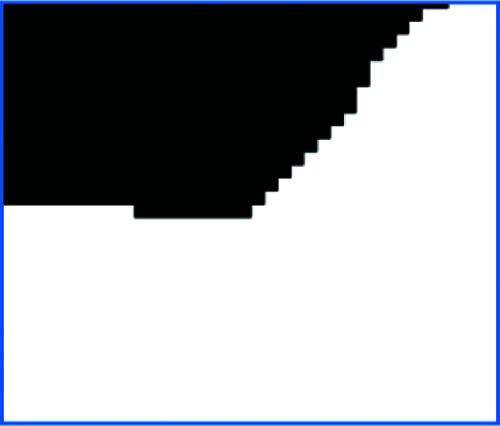
Figure 15: Enlarged point B
For the dividing point of overlapping cells, perform cell segmentation along the midline, as shown in Fig. 16. Note that there may be a dividing line with a large deviation in direction. For the overlapping cells after segmentation, it is also necessary to perform erosion and dilation operations to smooth their boundaries. The result is shown in Fig. 17.
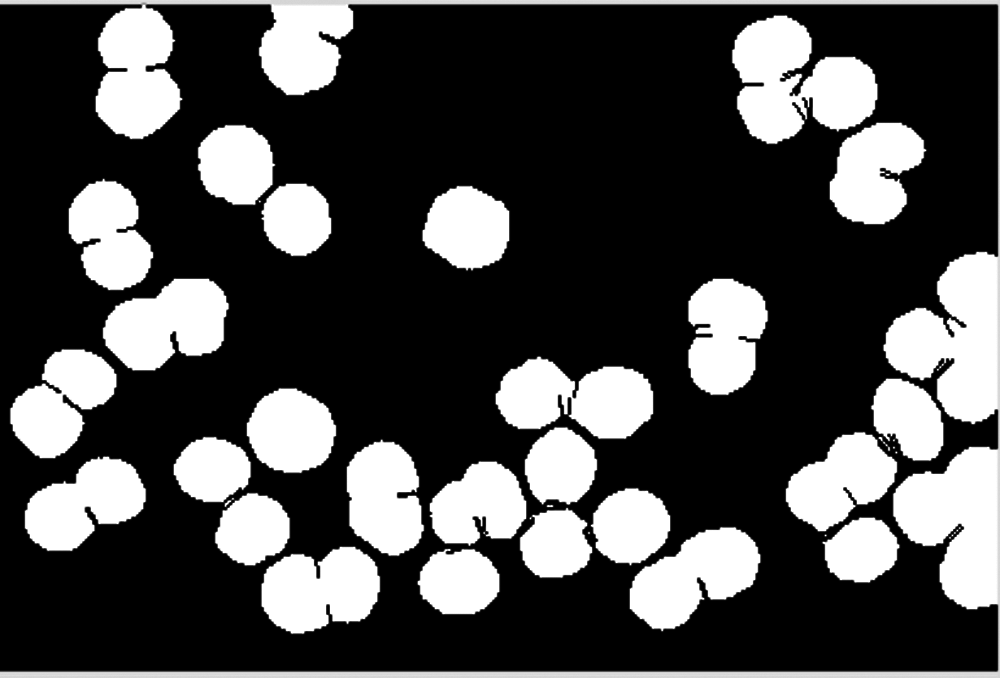
Figure 16: Dividing lines of overlapping cells

Figure 17: Smoothed edges of overlapping cells
Overlapping cells may be divided into multiple pieces. Note that too small an area may be noise and should be deleted. Divide the segmentation target into two parts according to the size of the area, and the area with a larger area needs to be segmented continuously, as shown in Fig. 18. The smaller area belongs to normal cells and should not be divided, as shown in Fig. 19.
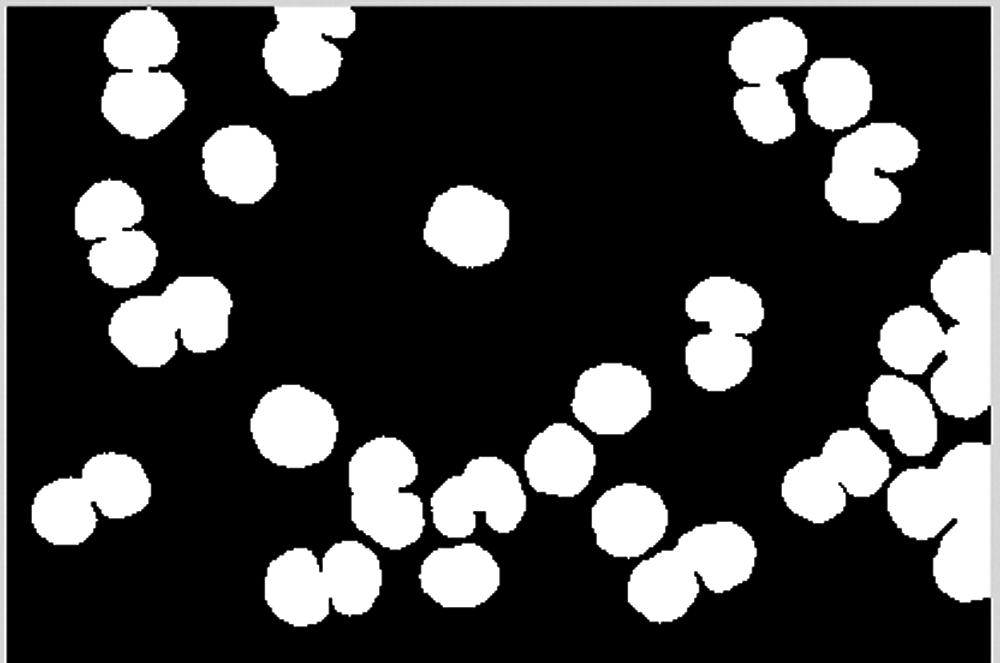
Figure 18: Blocks larger than 6000
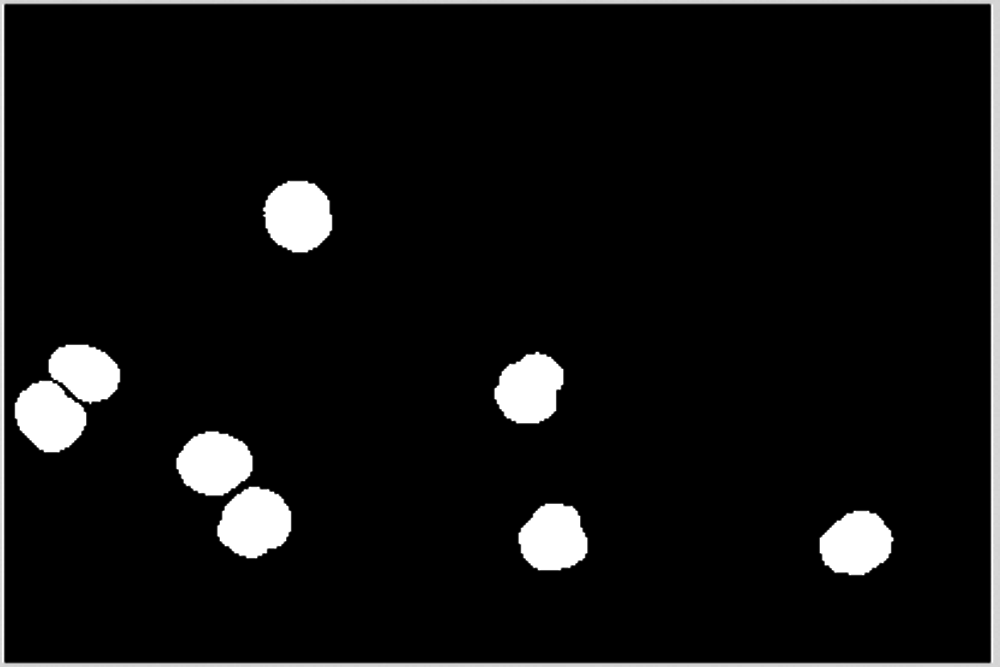
Figure 19: Blocks less than 6000
The dividing process proceeds until no cells can be divided, as shown in Figs. 20–23.
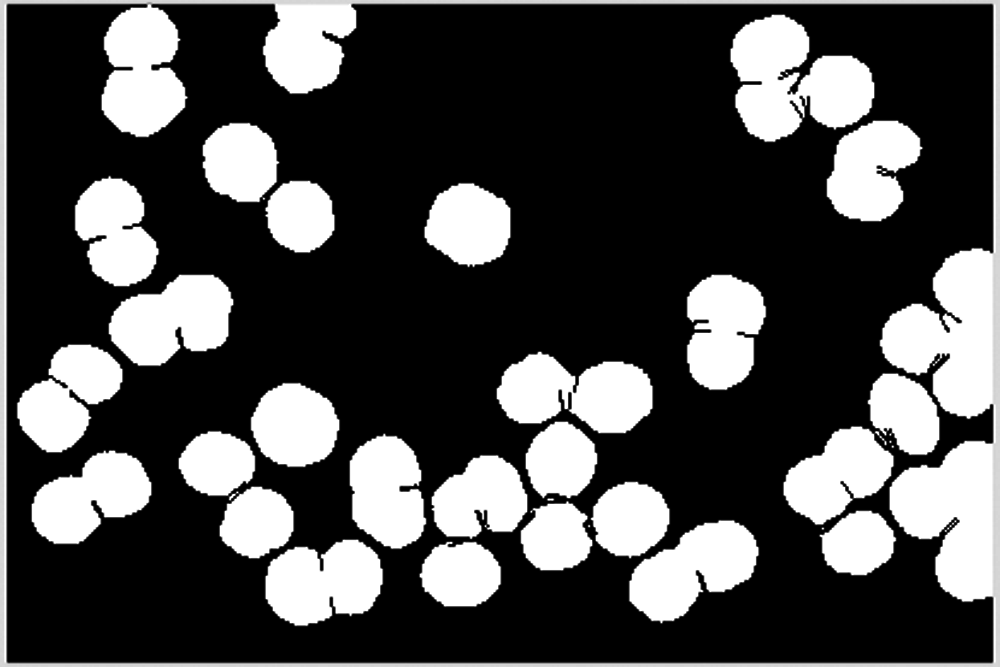
Figure 20: The 2nd dividing process
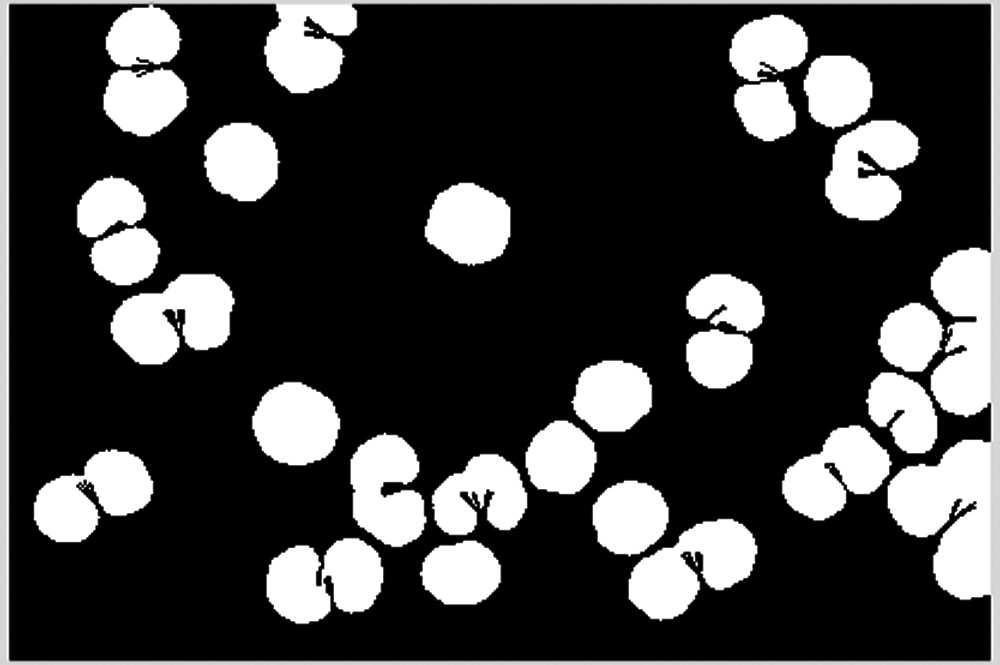
Figure 21: The 3rd dividing process
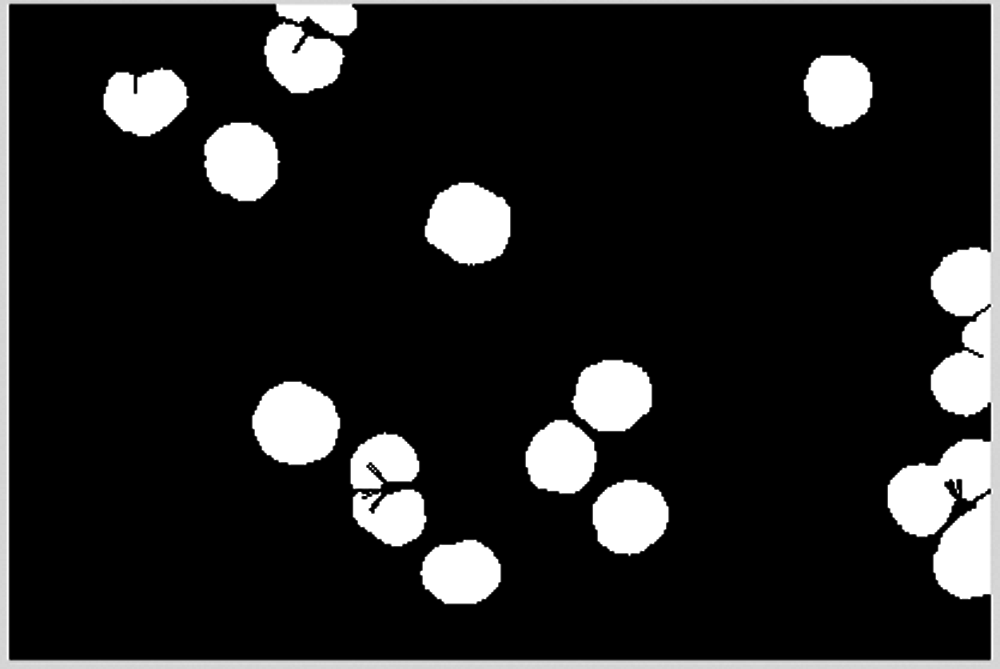
Figure 22: The 4th dividing process
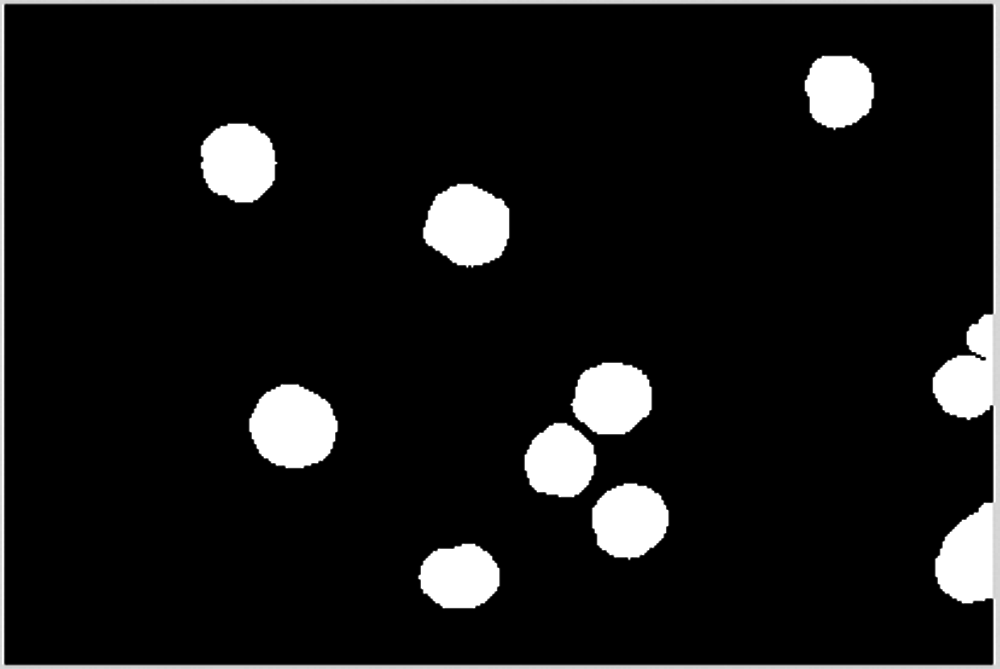
Figure 23: The 5th dividing process
Fig. 23 shows that no cells were divided in the 5th dividing process.
Perform the erosion operation on the final cell image and remove blocks less than 2000, as shown in Figs. 24 and 25.
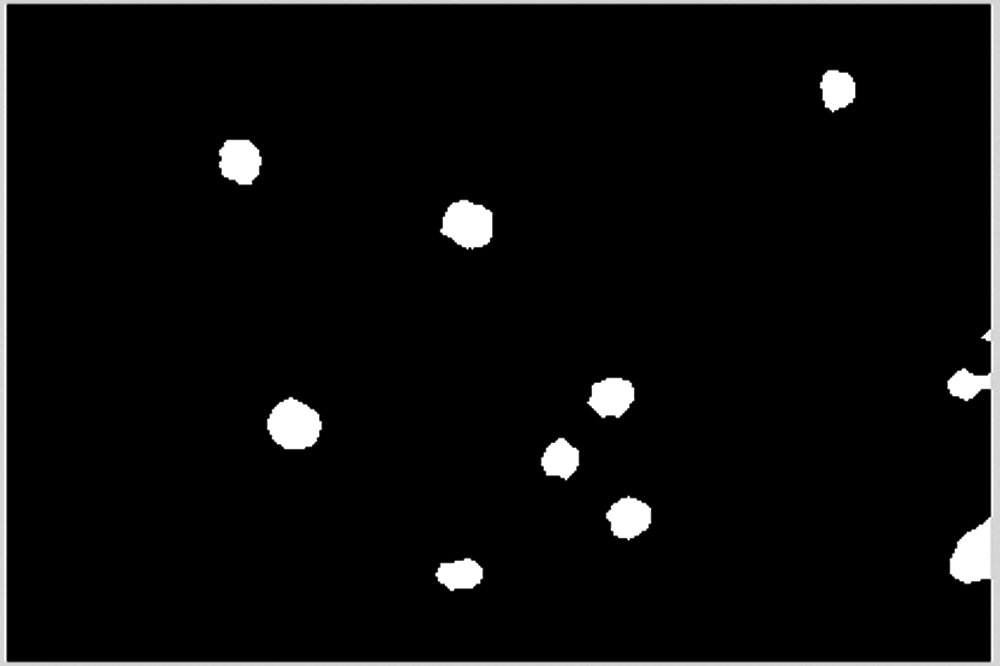
Figure 24: Erosion of remaining cells
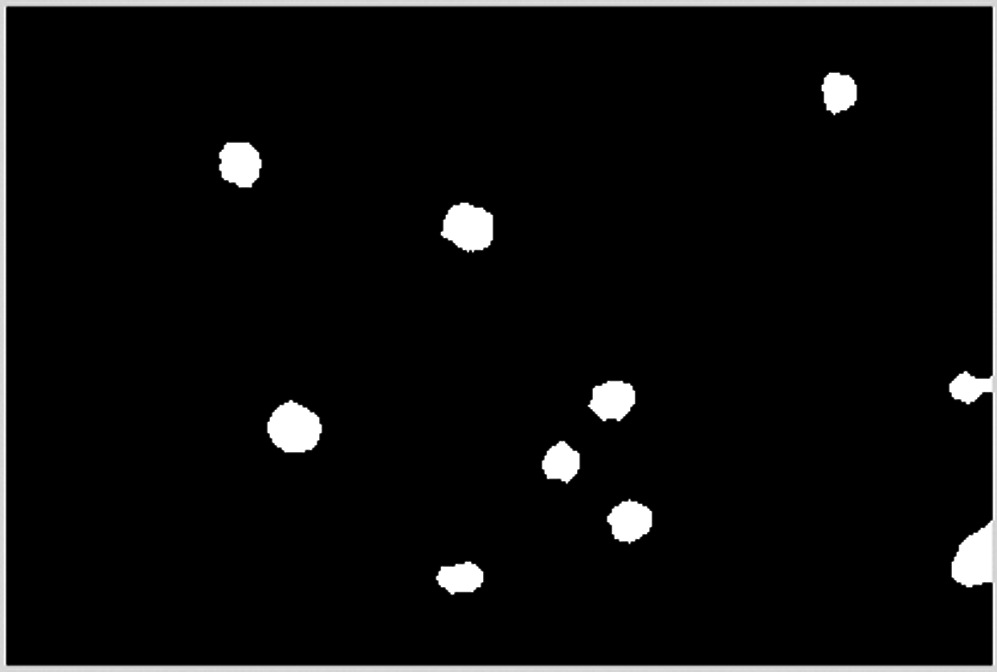
Figure 25: Remove blocks less than 2000
A dilation operation is excuted to smooth remaining cells, as shown in Fig. 26.
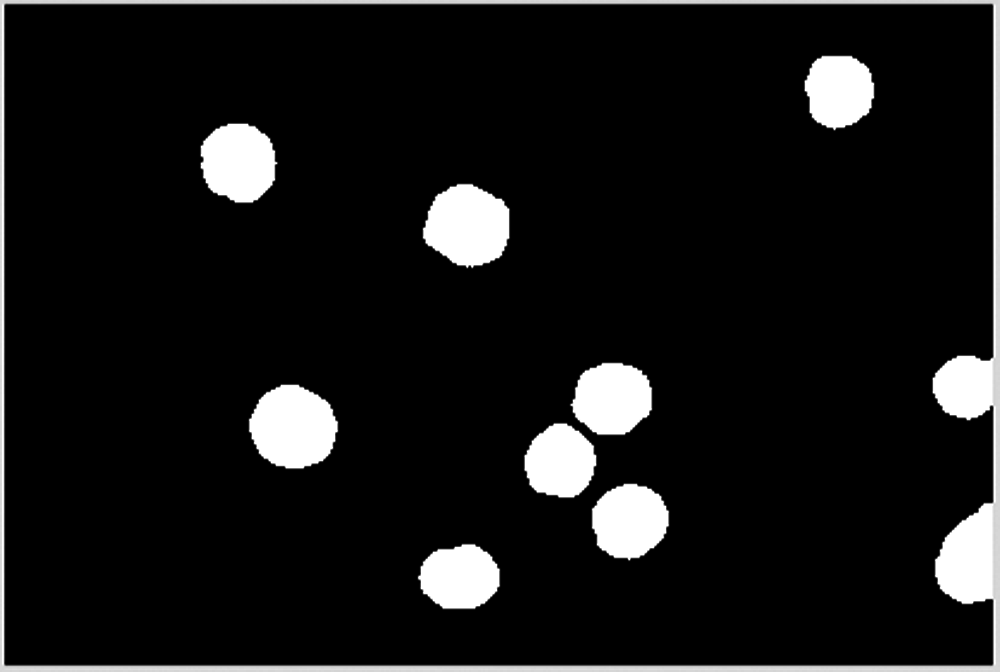
Figure 26: Smoothed remaining blocks
Combine the result of dilation operation with the cell area confirmed and saved to obtain the final cell image, as shown in Figs. 27–29.
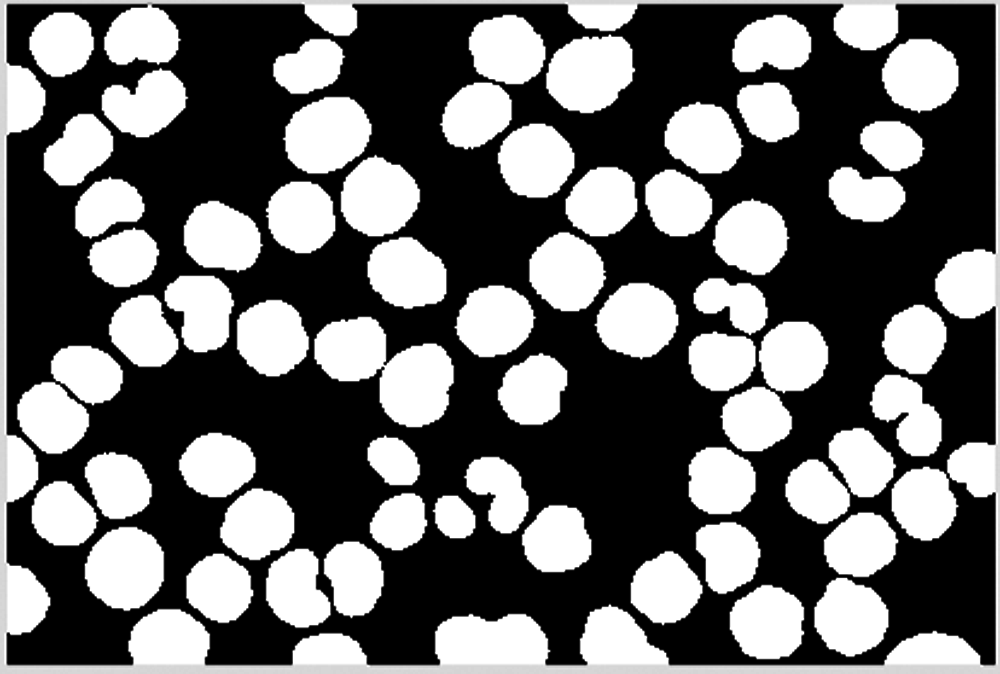
Figure 27: Saved blocks
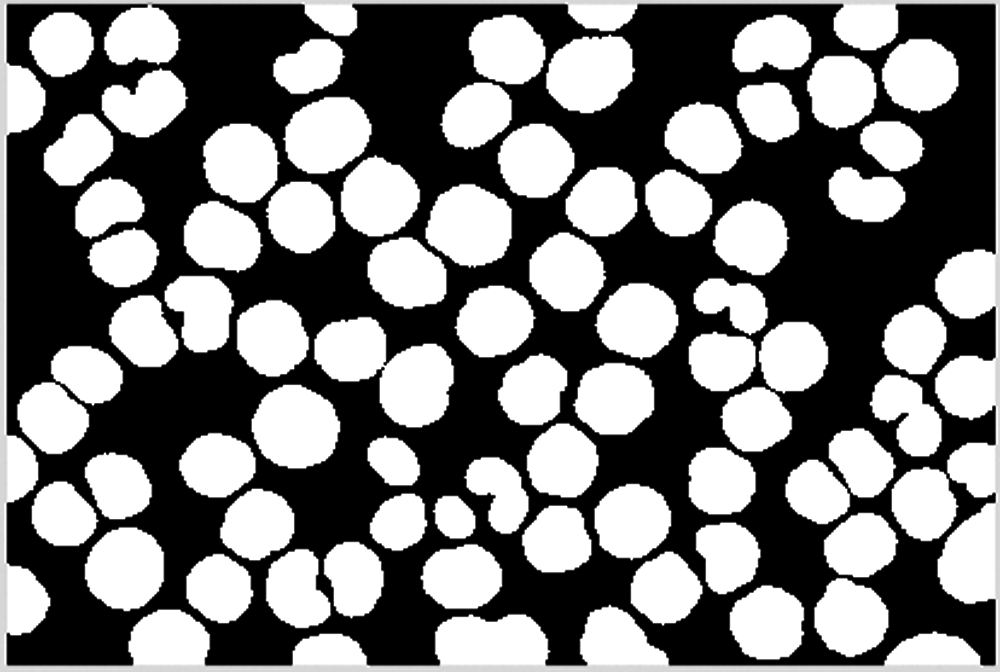
Figure 28: Overview of blocks
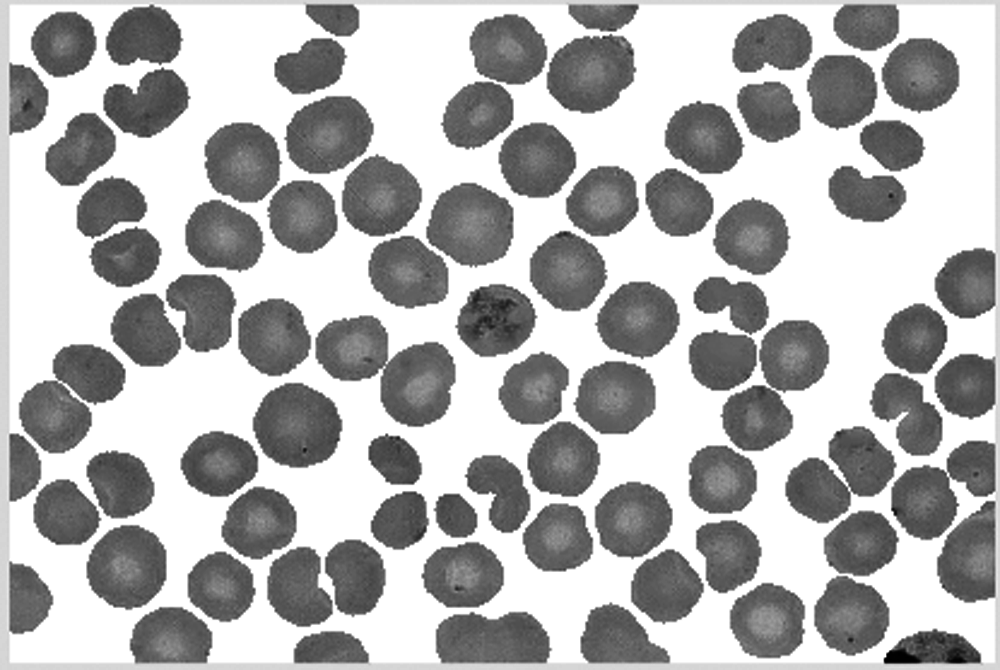
Figure 29: Final segmentation results
In order to verify the effectiveness of the algorithm proposed in this paper, it is compared with the segmentation results of the distance transformation algorithm and the limit corrosion algorithm. Since the proposed algorithm does not obtain accurate cell edges, the accuracy of cell counting is used as an evaluation measure for cell segmentation. The proposed algorithm is applied to the segmentation and counting of 300 cell images. The segmentation accuracy rates of cells with overlapping degrees of 0%, 15%, 30%, 45%, and 60% were respectively counted, as shown in Tab. 2.

It can be seen from Tab. 2 that the accuracy of the three overlapping cell image segmentation and counting methods decreases as the degree of overlap increases. When the degree of cell overlap is low, the segmentation accuracy of the algorithm proposed in this paper is higher than the counting accuracy of the distance transformation algorithm and the limit corrosion algorithm. When the degree of cell overlap is high, the segmentation accuracy of the proposed algorithm is similar to the other two algorithms.
This paper proposes a cell image segmentation algorithm based on morphology, which uses morphological operations such as erosion and dilation to accurately segment and count cell images. The experimental results show that when the proposed algorithm is applied to segment lightly or moderately overlapping cells, the accuracy is very high. And when it is used to segment heavily overlapping cells, the effect is normal. However, it must be pointed out that since the algorithm in this paper eliminates part of the edge information in the process of cell segmentation, further processing is needed to obtain accurate cell edge information.
Funding Statement: This work was supported in part by the National Natural Science Foundation of China under Grant 61621062, Grant 61773407, and Grant 61872408; in part by the Natural Science Foundation of Hunan Province of China under Grant 2019JJ40050; and in part by the Key Scientific Research Project of Education Department of Hunan Province of China under Grant 19A099.
Conflicts of Interest: The authors declare that they have no conflicts of interest to report regarding the present study.
1. J. W. Wills, J. Robertson, H. D. Summers, M. Miniter, C. Barnes et al., “Image-based cell profiling enables quantitative tissue microscopy in gastroenterology,” Cytometry Part A, vol. 97, no. 12, pp. 1222–1237, 2020. [Google Scholar]
2. Y. Huang, J. An, S. Zhang, H. Shen and D. Pathology, “Image-pro plus and imageJ: Comparison and application in image analysis of biological tissues,” Chinese Journal of Stereology and Image Analysis, vol. 20, no. 2, pp. 185–196, 2015. [Google Scholar]
3. H. Cai, Z. Yang, X. Cao, W. Xia and X. Xu, “A new iterative triclass thresholding technique in image segmentation,” IEEE Transactions on Image Processing, vol. 23, no. 3, pp. 1038–1046, 2014. [Google Scholar]
4. P. Ghamisi, M. S. Couceiro, F. M. L. Martins and J. A. Benediktsson, “Multilevel image segmentation based on fractional-order Darwinian particle swarm optimization,” IEEE Transactions on Geoscience & Remote Sensing, vol. 52, no. 5, pp. 2382–2394, 2014. [Google Scholar]
5. A. Renugambal and K. S. Bhuvaneswari, “Image segmentation of brain MR images using OTSU's based hybrid WCMFO algorithm,” Computers, Materials & Continua, vol. 64, no. 2, pp. 681–700, 2020. [Google Scholar]
6. R. Harrabi and E. B. Braiek, “Color image segmentation using multi-level thresholding approach and data fusion techniques: Application in the breast cancer cells images,” Eurasip Journal on Image and Video Processing, vol. 2012, no. 1, pp. 1–11, 2012. [Google Scholar]
7. H. Liu and X. Zhou, “Multi-focus image region fusion and registration algorithm with multi-scale wavelet,” Intelligent Automation & Soft Computing, vol. 26, no. 4, pp. 1493–1501, 2020. [Google Scholar]
8. Q. Sun, W. Yang and L. Yu, “Research and implementation of watershed segmentation algorithm based on CCD infrared images,” Computers, Materials & Continua, vol. 62, no. 3, pp. 509–519, 2010. [Google Scholar]
9. D. Larlus, J. Verbeek and F. Jurie, “Category level object segmentation by combining bag-of-words models with Dirichlet processes and random fields,” International Journal of Computer Vision, vol. 88, pp. 238–253, 2010. [Google Scholar]
10. C. Li, C. Xu, C. Gui and M. D. Fox, “Distance regularized level set evolution and its application to image segmentation,” IEEE Transactions on Image Processing, vol. 19, no. 12, pp. 3243–3254, 2010. [Google Scholar]
11. Y. Liu, W. Hu and L. Han, “A fast filling algorithm for image restoration based on contour parity,” Computers, Materials & Continua, vol. 62, no. 3, pp. 509–519, 2020. [Google Scholar]
12. P. Salembier and M. Pardas, “Hierarchical morphological segmentation for image sequence coding,” IEEE Transactions on Image Processing, vol. 3, no. 5, pp. 639–651, 1994. [Google Scholar]
13. D. E. Llea and P. F. Whelan, “Image segmentation based on the integration of colour–texture descriptors—A review,” Pattern Recognition, vol. 44, no. 10–11, pp. 2479–2501, 2011. [Google Scholar]
14. X. Jiao, Y. Chen and R. Dong, “An unsupervised image segmentation method combining graph clustering and high-level feature representation,” Neurocomputing, vol. 409, pp. 83–92, 2020. [Google Scholar]
15. P. P. Banik, R. Saha and K. Kim, “An automatic nucleus segmentation and CNN model based classification method of white blood cell,” Expert Systems with Applications, vol. 149, pp. 113211, 2020. [Google Scholar]
16. Q. Hu, J. Duan and D. Zhai, “Research on the cancer cell's recognition algorithm based on the combination of competitive FHNN and FBPNN,” International Journal of Computing, vol. 7, no. 3, pp. 229–238, 2016. [Google Scholar]
17. F. Erdem, B. Bayram, T. Bakirman, O. C. Bayrak and B. Akpinar, “An ensemble deep learning based shoreline segmentation approach(WaterNet) from Landsat 8 OLI images,” Advances in Space Research, vol. 67, no. 3, pp. 964–974, 2021. [Google Scholar]
18. I. Cseke, “A fast segmentation scheme for white blood cell images,” 11th IAPR Int. Conf. on Pattern Recognition, vol. 3, pp. 530–533, 1992. [Google Scholar]
19. S. H. Rezatofighi, K. Khaksari and H. Soltanian-Zadeh, “Automatic recognition of five types of white blood cells in peripheral blood,” Int. Conf. Image Analysis and Recognition, ICIAR 2010, Lecture Notes in Computer Science, vol. 6112, pp. 161–172, 2010. [Google Scholar]
20. Y. Hou and Y. Xiao, “Improved snake model and its application in image edge detection,” Journal of Data Acquisition & Processing, vol. 23, no. 2, pp. 153–157, 2008. [Google Scholar]
21. C. Arteta, V. Lempitsky, J. A. Noble and A. Zisserman, “Learning to detect cells using non-overlapping extremal regions,” Medical Image Computing and Computer-Assisted Intervention-MICCAI 2012, vol. 15, no. 1, pp. 348–356, 2012. [Google Scholar]
22. S. Dimopoulos, C. E. Mayer, F. Rudolf and J. Stelling, “Accurate cell segmentation in microscopy images using membrane patterns,” Bioinformatics, vol. 30, no. 18, pp. 2644–2651, 2014. [Google Scholar]
23. S. Mohapatra, D. Patra, S. Kumar and S. Satpathy, “Lymphocyte image segmentation using functional link neural architecture for acute leukemia detection,” Biomedical Engineering Letters, vol. 2, no. 2, pp. 100–110, 2012. [Google Scholar]
24. D. Huang, K. Hung and Y. Chan, “A computer assisted method for leukocyte nucleus segmentation and recognition in blood smear images,” The Journal of Systems and Software, vol. 85, no. 9, pp. 2104–2118, 2012. [Google Scholar]
25. W. Wang and P. Su, “Blood cell image segmentation on color and GVF snake for leukocyte classification on SVM,” Optics and Precision Engineering, vol. 20, no. 12, pp. 2781–2790, 2012. [Google Scholar]
26. G. Gu and D. Cui, “Flexible combination segmentation algorithm for leukocyte images,” Chinese Journal of Scientific Instrument, vol. 29, no. 9, pp. 1977–1981, 2008. [Google Scholar]
27. H. Ding, Z. wang and Y. Shi, “Research and implementation of segmentation algorithm for overlapping cells,” Computer Applications and Software, vol. 25, no. 4, pp. 202–203, 2008. [Google Scholar]
28. Z. Hou, S. Ma, X. Pei and P. Xin, “Research on segmentation and recognition of marrow cells image,” Intelligent Systems Design and Applications, ISDA ‘06. Sixth Int. Conf., vol. 2, pp. 329–332, 2006. [Google Scholar]
29. P. Wang, X. Hu, W. Xie, Y. Li and S. Liu, “Image segmentation of breast cells based on multi-scale region-growing and splitting model,” Computer Applications and Software, vol. 36, no. 7, pp. 1653–1659, 2015. [Google Scholar]
30. C. D. Ruberto, A. Dempster, S. Khan and B. Jarra, “Analysis of infected blood cell images using morphological operators,” Image and Vision Computing, vol. 20, no. 2, pp. 133–146, 2002. [Google Scholar]
31. N. Mohanapriya and D. B. Kalaavathi, “Adaptive image enhancement using hybrid particle swarm optimization and watershed segmentation,” Intelligent Automation & Soft Computing, vol. 25, no. 4, pp. 663–672, 2019. [Google Scholar]
32. H. Hou and Y. Shi. “Application of the improved watershed algorithm based on distance transform in white blood cell segmentation,” Computing Technology and Automation, vol. 35, no. 3, pp. 81–84, 2016. [Google Scholar]
33. Z. Qu, Y. Guo, F. Ju., L. Liu and L. Lin, “The algorithm of accelerated cracks detection and extracting skeleton by direction chain code in concrete surface image,” The Imaging Science Journal, vol. 64, no. 3, pp. 119–130, 2016. [Google Scholar]
34. Y. Tan, L. Tan, X. Xiang, H. Tang and W. Pan, “Automatic detection of aortic dissection based on morphology and deep learning,” Computers, Materials & Continua, vol. 62, no. 3, pp. 1201–1215, 2020. [Google Scholar]
 | This work is licensed under a Creative Commons Attribution 4.0 International License, which permits unrestricted use, distribution, and reproduction in any medium, provided the original work is properly cited. |