DOI:10.32604/iasc.2022.018952
| Intelligent Automation & Soft Computing DOI:10.32604/iasc.2022.018952 | |
| Article |
Main Path Analysis to Filter Unbiased Literature
1Department of Information Technology, University of Gujrat, Gujrat, 50700, Pakistan
2Department of Computer Science, University of Engineering and Technology, Lahore, Pakistan
3College of Computer Science and Information Technology, Al Baha University, Al Baha, Saudi Arabia
4College of Computer Science and Engineering, Taibah University, Al-Madinah, Al-Munawarah, Saudi Arabia
5Faculty of Computing, The Islamia University of Bahawalpur, Bahawalpur, 63100, Pakistan
6Department of Information and Communication Engineering, Yeungnam University, Gyeongsan, 38541, Korea
*Corresponding Author: Muhammad Shafiq. Email: shafiq@ynu.ac.kr
Received: 26 March 2021; Accepted: 27 April 2021
Abstract: Citations are references used by researchers to recognize the contributions of researchers in their articles. Citations can be used to discover hidden patterns in the research domain, and can also be used to perform various analyses in data mining. Citation analysis is a quantitative method to identify knowledge dissemination and influence papers in any research area. Citation analysis involves multiple techniques. One of the most commonly used techniques is Main Path Analysis (MPA). According to the specific use of MPA, it has evolved into various variants. Currently, MPA is carried out in different domains, but deep learning in the field of remote sensing has not yet been considered. In this paper, we have used three centrality attributes which are Degree, Betweenness and Closeness centrality to automatically identify important papers by applying clustering method based on machine learning (i.e., K-means). In addition, the main path is drawn from important papers and compared with existing manual methods. In order to conduct experiments, a data set from Web of Science (WOS) has been established, which contains 538 papers in the field of deep learning. Compared with existing works, our method provides the most relevant papers on the main path.
Keywords: Citation network; main path analysis; deep learning; remote sensing
Citations are references used by authors to refer to the work and contributions of others in their research articles. A citation network is a graphical representation of citation data. In a citation network, papers act as nodes, and arcs represent citation links. The direction of the arrow represents the flow of knowledge. The arrow always points from the cited link to the citing one, which means going from old knowledge to new knowledge. In addition, the frequency of citations in the citation network is called citation count or citation weight. Citation count is used to illustrate the importance and impact of research articles. In this regard, citation networks play an important role in tracking and locating the flow of knowledge and the main field of research papers. In the citation network, the process of finding the main domain of any research paper is called Main Path Analysis (MPA) [1]. MPA is a method for citation network and similarity index analysis. Therein, depth-first search is used to check similar research articles by matching co-cited papers. The Search Path Count (SPC) algorithm is used in the citation network, and the graph is constructed based on the citation weight in the network [2].
Effective algorithms (for example, search path link count, node pair projection count, search path node pair, etc.) have been introduced to perform MPA. These MPA algorithms have been used in the analysis of larger data sets [2]. The variants of MPA include local main path, backward local main path, key route main path and global main path [3]. However, the more important and affected nodes in the network can also be identified by Degree centrality and Betweenness centrality [4]. The productive nodes in the network can also be identified by Closeness centrality [5]. A graphics program called Pajek is used to draw network diagrams and associations between networks from a given data set based on citation networks, permutation, clustering and other methods [6]. Vos-viewer is a rich bibliometric analysis tool, which provides huge graphics and technical support for the creation of graphs and links between networks based on co-citation and similarity index [7].
Literature review plays a major role in structuring and shaping any domain. However, reviews basically depend on the subjective analysis of qualified researchers in the research domain, and contemporary bibliometric techniques have not been able to recompense for human biases. A certain degree of humanoid subjectivity is necessary to construct a literature review. So far, reviews based mainly on subjective analysis may be controlled by the authors’ lack of time, energy, and mental abilities, and their understanding of literature certainly depends on their own views [8]. Important papers are likely to be ignored or misunderstood to suit the author’s personal learning interests. Objective analysis is essential to determine fair literature. Objective analysis is a calculated measurement, without direct human subjectivity, prejudice and interpretation. Unlike reviews, citations and MPA are essential to identify the internal components of research in any field. Objective analysis helps the research domain to find the most influential papers, which can lead to innovation. It also details the share of important artifacts in the domain and its effectiveness in the latest trends [9].
Deep Learning (DL) is based on the learning algorithm of neural network [10], in which neurons (or units) comprises of certain values. There exist many layers in the DL algorithm, which can transform input data into output. Such algorithms learn step by step through higher level features, and their associated layers are usually called the hidden or deep layers between input and output data [11]. It can be seen from the rapid increase in the research artifacts that DL plays an important role in the transformation of Remote Sensing. A large number of DL algorithms have made remarkable achievements in image analysis tasks, such as object detection, Land Use and Land Cover (LULC) classification, and scene classification [12–21]. However, quantitative analysis is still needed to find the most influential articles in order to get rid of human subjectivity, because it is necessary to use MPA to find important papers [22].
In this paper, we use K-Means clustering to automatically filter out valuable papers from the data set, and then use social network analysis attributes i.e., the Degree, Betweenness, and Closeness centrality of the citation network to identify contribution of papers. In addition, we drew the main path from the shortlisted papers and determined the knowledge dissemination in the domain. For the experiment, we collected data from Web of Science (WOS). We have used a tool called WOS2Pajek to eliminate discrepancies and duplicates in the data. K-Means analysis divides our data set into two clusters (based on Degree, Betweenness, and Closeness centrality): important papers and non-important papers.
In addition, the top ten papers based on each centrality measure have been selected as innovative papers. Finally, the main path comes from important papers, which provide the most relevant papers compared to existing general methods. This paper has the following contributions to knowledge:
• Automate the process of selecting important papers (based on Degree, Betweenness and Closeness centrality) from the data set to perform further citations and MPA.
• For the first time, the main path is generated from automatically shortlisted papers based on attributes, thereby improving the output of MPA.
• The main path to generate for DL in the Remote Sensing domain for the first time. A new data set of WOS from DL has been built.
The rest of this paper is organized as follows: Section 2 briefly introduces related work. Section 3 elaborates on the proposed method. Section 4 evaluates the proposed algorithm and discusses the results. Finally, Section 5 concludes the paper by identifying limitations and future work.
This section contains information about the main achievements and an overview of the citation network. In addition, it covers the different techniques used in citation analysis. Since the development of the domain, a lot of work has been done in various branches and fields of citation analysis. However, the key artifacts are described below.
Citations are references used by authors in their research articles to cite other articles and contributions from other authors in the domain. The citation was originally used for reference purposes only. In the decade of the 1960 s, many new uses of references were described. Two papers that cite the same article are called units, and when creating a network from these papers, they can be called bibliographic coupling. However, only when two articles are scientifically related and do not cite each other, the network can be considered the best [23].
For the first time in history, the author “Price” revealed that a research article has a specific field and life. You can create a citation network to find the life of any article. When creating a citation network, references can be regarded as milestones [24]. Citation network analysis can be used to analyze the importance and influence of any scientific journal. In this regard, the citations of the entire data set need to be aligned in the list, and an in-depth inspection of the provided list can guide the importance and impact analysis [25]. The patent bibliometric was derived in 1994 based on “Price” hypothesis. It is possible to evaluate patents by using citation network analysis to conduct in-depth research on the similarity and knowledge of research articles [26].
The co-citation term was invented by “Small”. If two papers are cited together, it is considered to be a co-citing. The frequency of co-citation can be calculated by iterating on the citation list [27]. The Intellectual structure of any author's entire publications can be calculated by considering the author as a unit, and co-citation analysis can narrow the field of two authors, and vice versa. A computer application was also created for the visual mapping of different authors and their locations [28]. In addition, the study of any author’s intellectual space includes his previous knowledge and provides newcomers with a guide to important readings and artifacts [29]. Citation analysis proved to be a legitimate solution for finding the contribution of any researcher. It also helps to understand the interests of any scientific community at a very low cost. In addition, because wrong information may mislead the results, a skilled and caring analysis mechanism is required [30]. Science Map was introduced by “Small” based on the citation network. It is designed based on mapping and clustering techniques to create maps of physics, economics, biology, medicine and sociology data. Co-citation, clustering and citation counting are used to create and link maps [31].
The number of times a paper is cited in the data set is called its number of citations. Papers with more citations are considered important papers. There is a difference between popular and prestigious journals. The most cited journals should not be ranked high. Instead, the citation weight and citation worth of any journal should be checked [1].
MPA is a technique used to identify the most important papers in a citation network. Consideration should be given to more prestigious citations to the most impacted journals. The author introduced a modified version of Google Page RankTM to use MPA to find the value of citations [32]. Another more in-depth study was conducted on the importance of citations and papers. The research shows that the citation correlation related to the main path calculation may lead people to know the importance of the paper, but it will not affect the overall result more in the end [33].
A recent comprehensive study on Technique for Order Preference by Similarity to an Ideal Solution (TOPSIS) revealed multiple scientific fields in TOPSIS using the combination of main path analysis and Louvain clustering. The study used multiple main paths to reveal the diffusion of knowledge in different fields [34]. “Kim” conducted a citation analysis on the extended version of the main path. This main path is called the main path analysis based on knowledge persistence. He has conducted research in the blockchain domain, discovered five sub-blockchain domains and proposed the latest research issues [35]. By highlighting important patents and their development in this field, a patent-based analysis of the blockchain field is also carried out to filter out the innovation research trends of technologies and researchers [36]. “Yu” has achieved an important milestone in the blockchain domain by prioritizing citations to eliminate subjectivity and identifying citation domains to make citations worthwhile. They introduced two types of bias, namely discipline bias and time bias, and eliminated these biases by introducing a new variant of MPA called preference MPA [37].
On the other hand, data visualization and drawing tools have also been developed to aid research. In 1998, Pajek, a software-based tool, was introduced to handle large networks. Pajek helps create sub-networks, abstract them, find paths and draw layouts [6]. Gephi is a larger network (graph) analysis and visualization tool. Gephi supports efficient algorithms and can perform various analyses on larger networks. It has rich graphics support, has multiple selection options, and can perform effective and accurate visualization. It enables users to highlight networks with different node sizes, colors, and text combinations for better visualization. Varieties of algorithms are implemented for network alignment and positioning [38].
In the rapid growth of scientific papers, it is difficult to determine the latest research areas in any domain. Nevertheless, using citation network analysis to gradually track each modification with the help of MPA, continuous improvement can be seen in any domain. The analysis concluded that the core of the latest domain of any scientific field can be determined through gradual improvement [39]. An objective review must be conducted to discover the latest research trends and determine the most influential papers in the field [40]. However, DL in Remote Sensing is still not studied with respect to the objective analysis.
This section contains information on the tools, methods, and materials used to conduct the research. In addition, it details the systematic process of performing analysis and manipulation of data, including data collection, data processing and extraction. Fig. 1 shows the architecture of the proposed method, which includes the different modules detailed below.
There are many databases that can be used to collect data, such as Scopus, ISI WOS and manual data collection. In this study, we collected data from WOS. Specifically, we chose the Science Citation Index Expanded (SCI-Expanded) WOS core collection database.
In order to get relevant and accurate information, advance search option was adopted. We applied this search on 13 November 2019. Initially, we searched “DL” and “Remote Sensing” in topic search which returned all results matching with these topics and then we applied AND operation between these two searches which retrieved results containing “DL” and “Remote Sensing” in common. Afterwards, we searched “Remote Sensing” in category section which returned all documents present in the category of “Remote Sensing” to finalize our search data with maximum and relevant records. We finally applied “AND” operation between these two searches which returned 538 records.
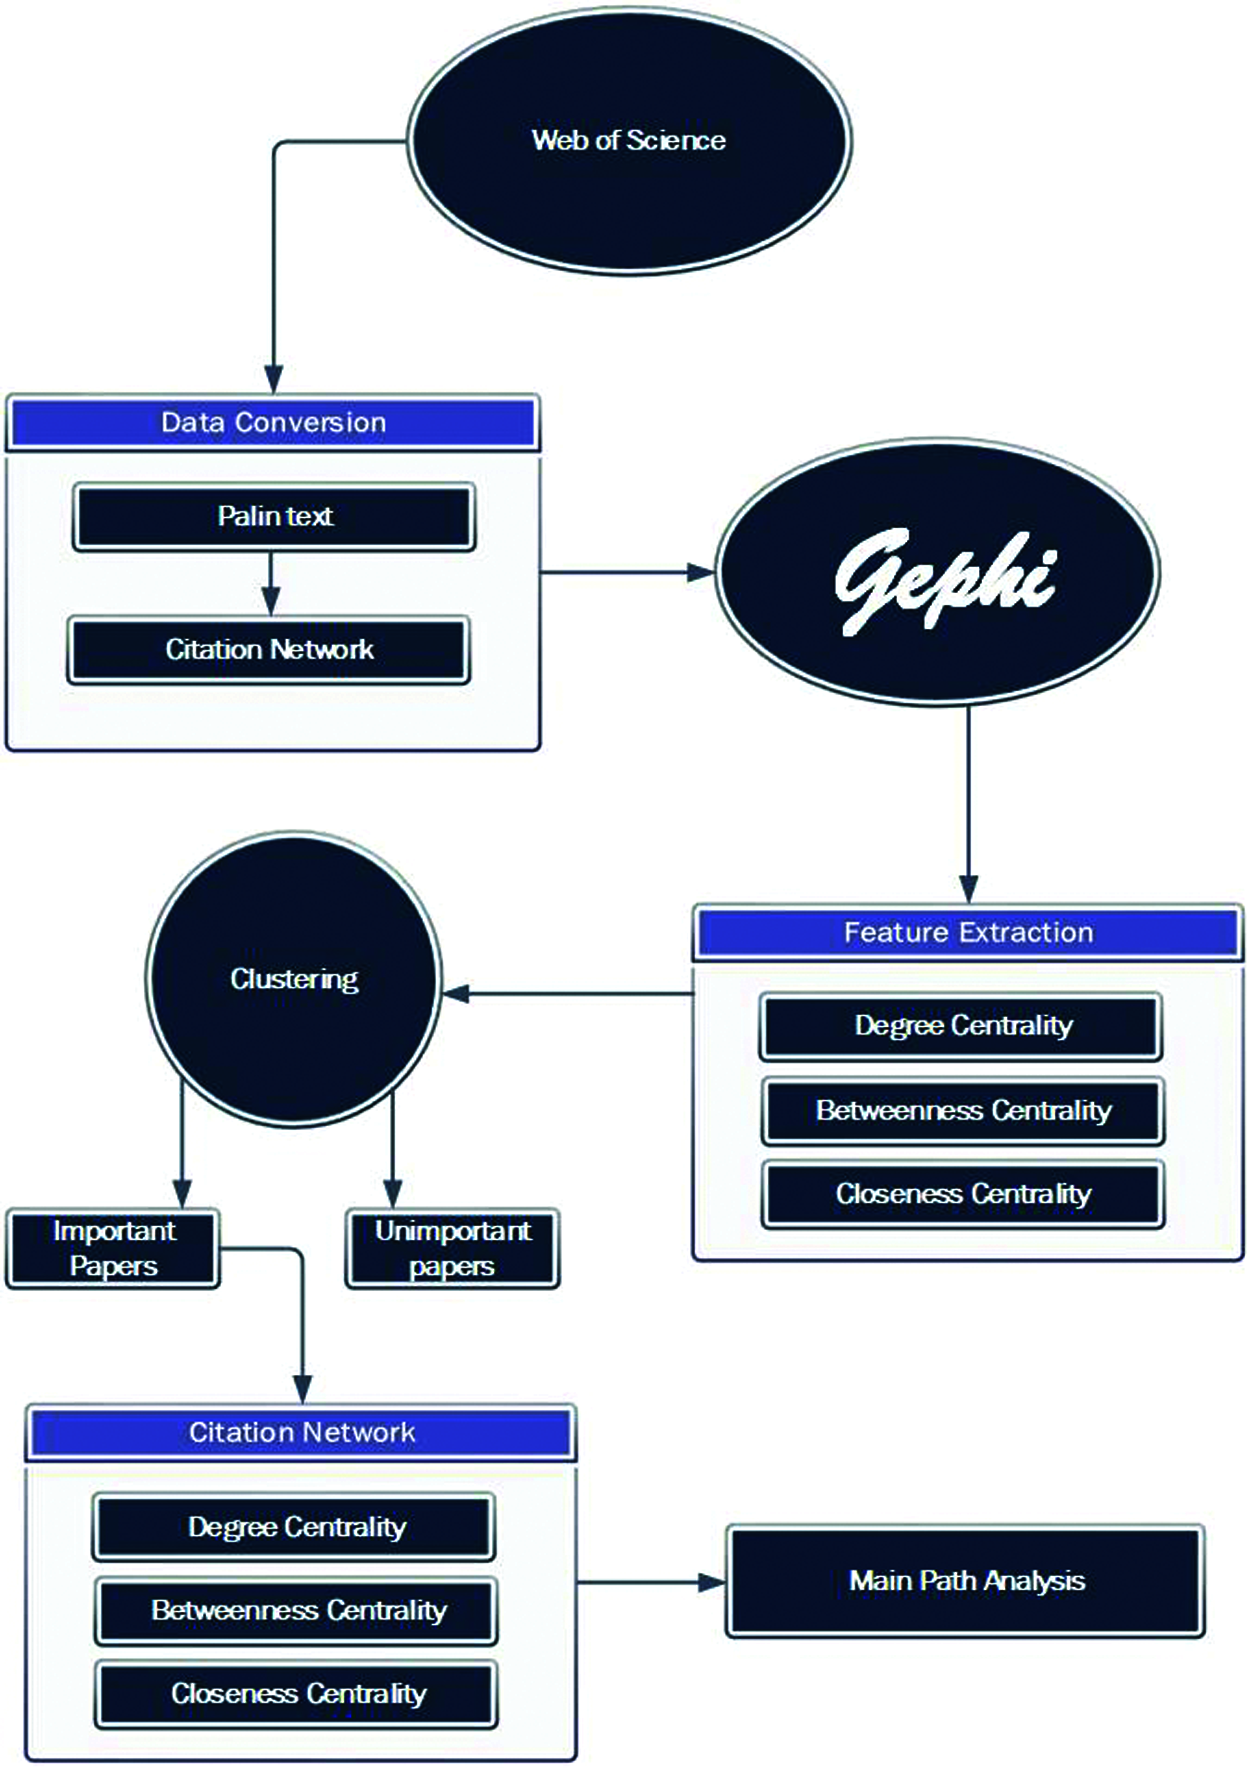
Figure 1: Architecture of proposed methodology
We downloaded these records with complete information in a plain text tab delimited file. Each record contains important columns including title, authors, abstract, publication date, cited references and DOI. Based on content not related to this article, we skipped many other columns.
As shown in Tab. 1, all 538 papers were collected from 21 journals. “Remote Sensing” is the top journal from where 161 papers are collected whose percentage is 29.926. Year-wise distribution of collected data represents that we have 2 papers in 2012, 1 in 2013, 2 in 2014, 12 in 2015, 28 in 2016, 78 in 2017, 176 in 2018, 225 in 2019 and 4 in 2019, please refer to Fig. 2. From 2012 to 2019, domain has been gradually developed. In 2019, the number of publications in this domain was the largest with 225.
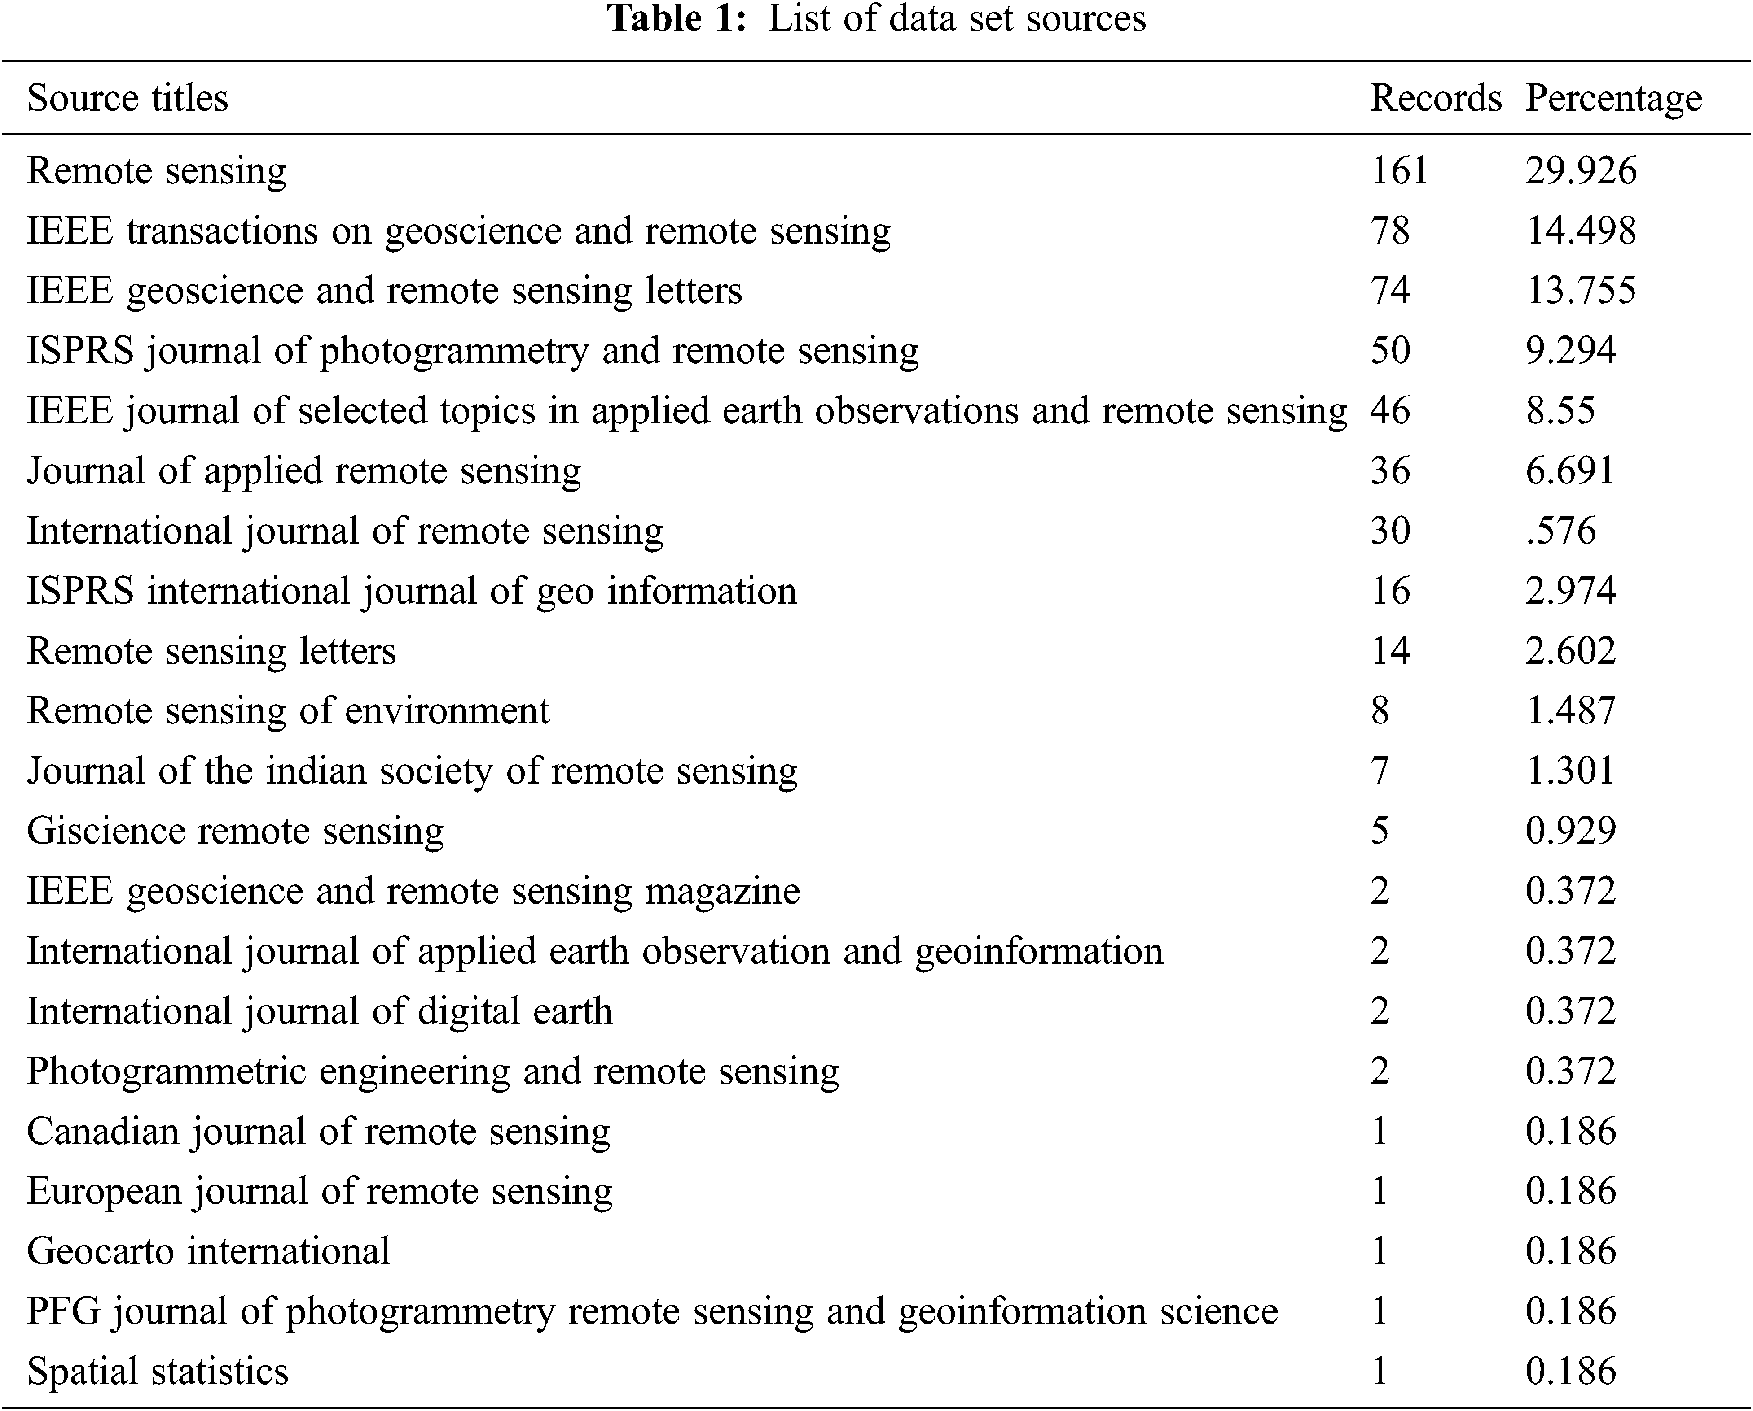
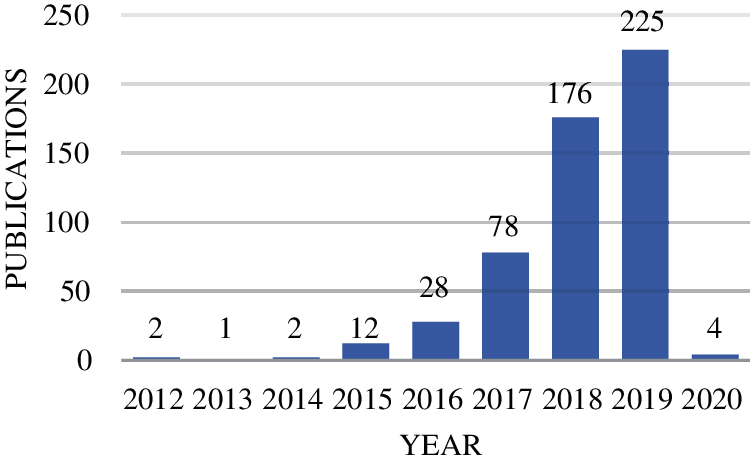
Figure 2: Annual distribution of papers
The only reason for preprocessing is to prepare data for input into the algorithm that will perform machine learning. Preprocessing includes data conversion and feature generation, which involves the calculation of Degree centrality, Betweenness centrality and Closeness centrality. Data preprocessing helps us to obtain results with higher accuracy. If the data is incorrectly preprocessed in some way, it will cause the problem of obtaining accurate results. The records downloaded from WOS are in two separate text files, because we can download 500 records from WOS at once. After merging and formatting the data, the WOS2Pajek tool was used to remove differences and duplicates from the data.
WOS2Pajek has been used to convert plain text data into citation network file. The citation network file (.net) contains information about the citation network. In the citation network, papers act as nodes and citations act as edges. The citation network file contains node ID, node title (first author name + publication year) and edge information. Fig. 3 illustrates a sample of the network file. A total of 12243 cited documents were recorded and stored in the citation network from 538 papers.
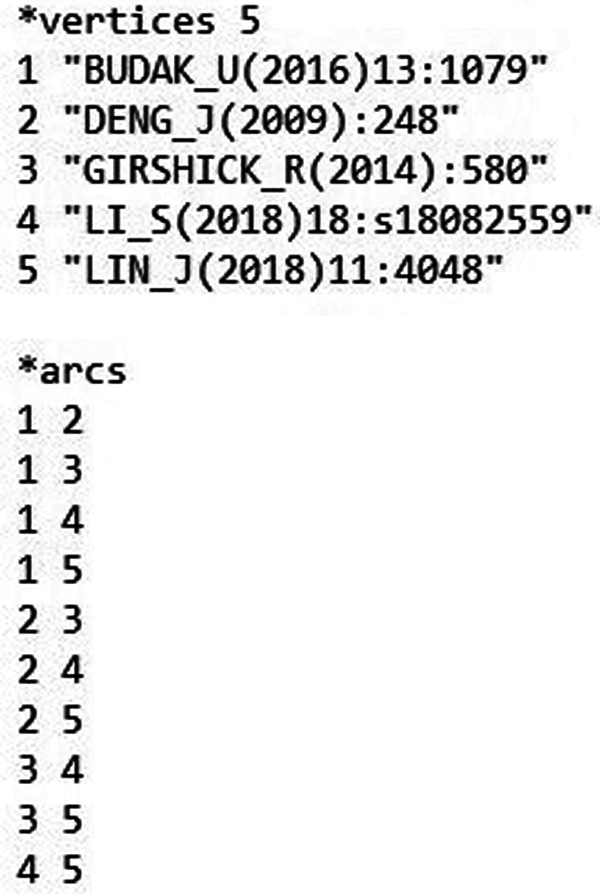
Figure 3: Pajek sample
Automatic data normalization requires the machine learning algorithms. Machine learning is based on features. It is important to determine the appropriate features, which play a major and vital role in the data set. In this study, we determined Degree centrality, Betweenness centrality and Closeness centrality as important measures to identify important papers.
Degree centrality is used to measure the number of direct connections a node has in the network. A node has more connections, it just means that the node is more central or more active. There are two different types of Degree centrality, in-degree centrality and out-degree centrality for directed networks (e.g., citation networks). The first type is a measure of the number of papers citing the focal paper. However, the second type explains the number of papers cited in this focal paper. We use in-degree centrality because it can better show the importance and identity of a paper [9].
Betweenness centrality accounts for the shortest path that a node can exist between other nodes. It is the number of times that a certain node needs other hope nodes to reach any other node with the shortest path. In the communication network, a node with a higher Betweenness centrality score can act as a gatekeeper, because such a node can better control the flow of information. The Betweenness centrality score also indicates the role of the node most often regarded as the leader [41].
Closeness centrality is the efficiency with which each individual vertex propagates information to all other vertices. It is the reciprocal of the average shortest path distance from the vertex to any other vertex in the graph. The greater the score of the Closeness centrality of a vertex, the shorter the average distance from the vertex to any other vertex. Therefore, a better-positioned vertex has the ability to spread information to other vertices [42].
Feature extraction is the key process after feature selection. In this work, we studied various articles and concluded that a tool called Gephi is useful for feature extraction. In order to calculate these metrics, we imported our net file into Gephi and calculated the Degree centrality, Betweenness centrality and Closeness of network [38].
After the feature extraction is completed, a list with node ID, node name, and Degree centrality, Betweenness centrality and Closeness centrality is obtained for classification analysis. We performed K-Means clustering on the data set in Visual Studio. K-Means analysis divides our data set into two clusters (based on Degree centrality, Betweenness centrality and Closeness): important papers and non-important papers. We named important papers as the clusters with the highest Degree centrality, Betweenness centrality and Closeness centrality values. In the important papers cluster, we have 449 papers, and 11,794 are in the second cluster (that is, not important). Important papers accounted for 3.66% of the total number of citations. Further analysis was carried out on important papers.
We developed a citation network containing 449 papers or nodes. The relationship between citation network papers is sparse. The number of connections between nodes in the network is called the density of the citation network. If there is no connection between any nodes in the network, the density will be zero. On the other hand, when the density is 1, the graph is fully connected, so that every node is connected to every other node in the network. Therefore, the value of density is between 0 and 1. In [43], the author’s evaluation score is greater than 0.5 indicating high density, otherwise the score is less than 0.5 indicating low density. We found that the network density of DL’s Remote Sensing citation network is 0.0085, which is an emerging research field.
This section presents detailed information about experiments and interpretation of results.
The citation network based on Degree centrality is shown in Fig. 4. For better visualization, the size of a node in the graph is related to its degree value. Nodes with lower degrees have smaller sizes. The size increases as the degree value increases. We see Zhang_L (2016) node is the node with the highest degree.
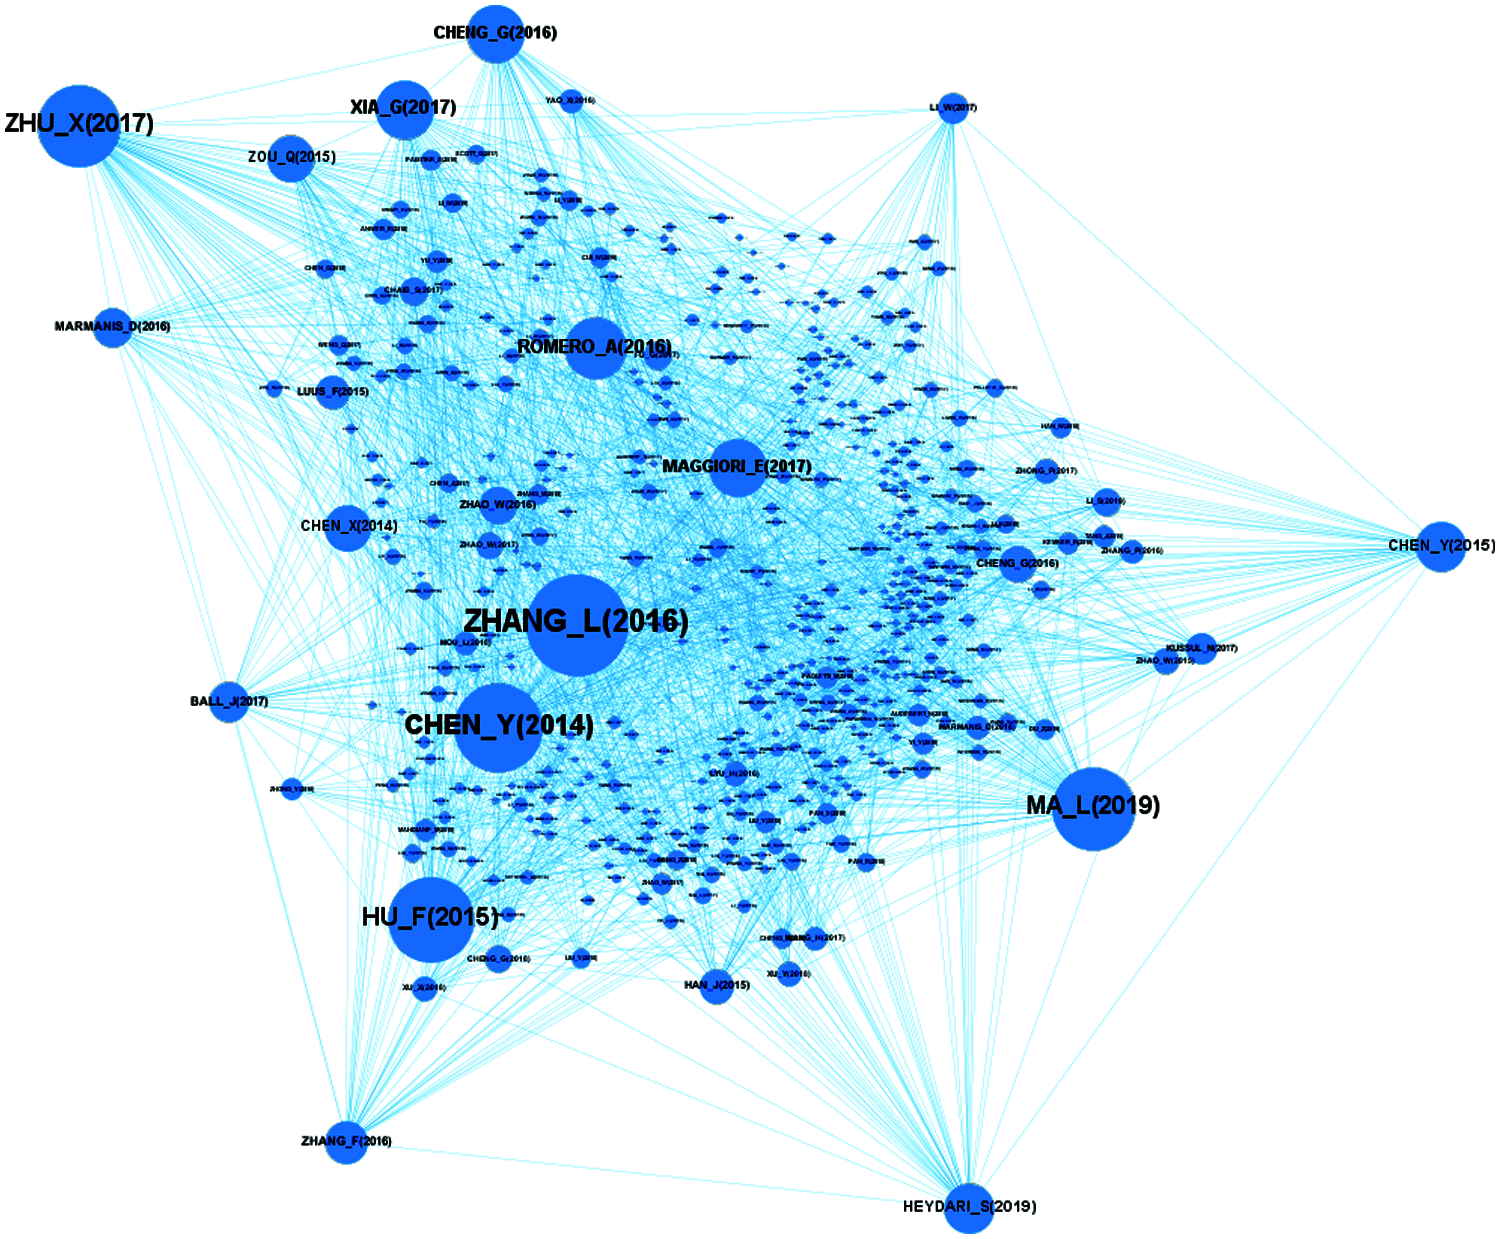
Figure 4: Distribution of Degree centrality
The citation network based on Betweenness centrality is shown in Fig. 5. For better visualization, the size of the nodes in the graph is related to their Betweenness centrality. Nodes with lower Betweenness centrality have smaller sizes, and size increases as the value of Betweenness centrality increase. We can understand that the node Zhang_L (2016) is the node with the highest Betweenness centrality.
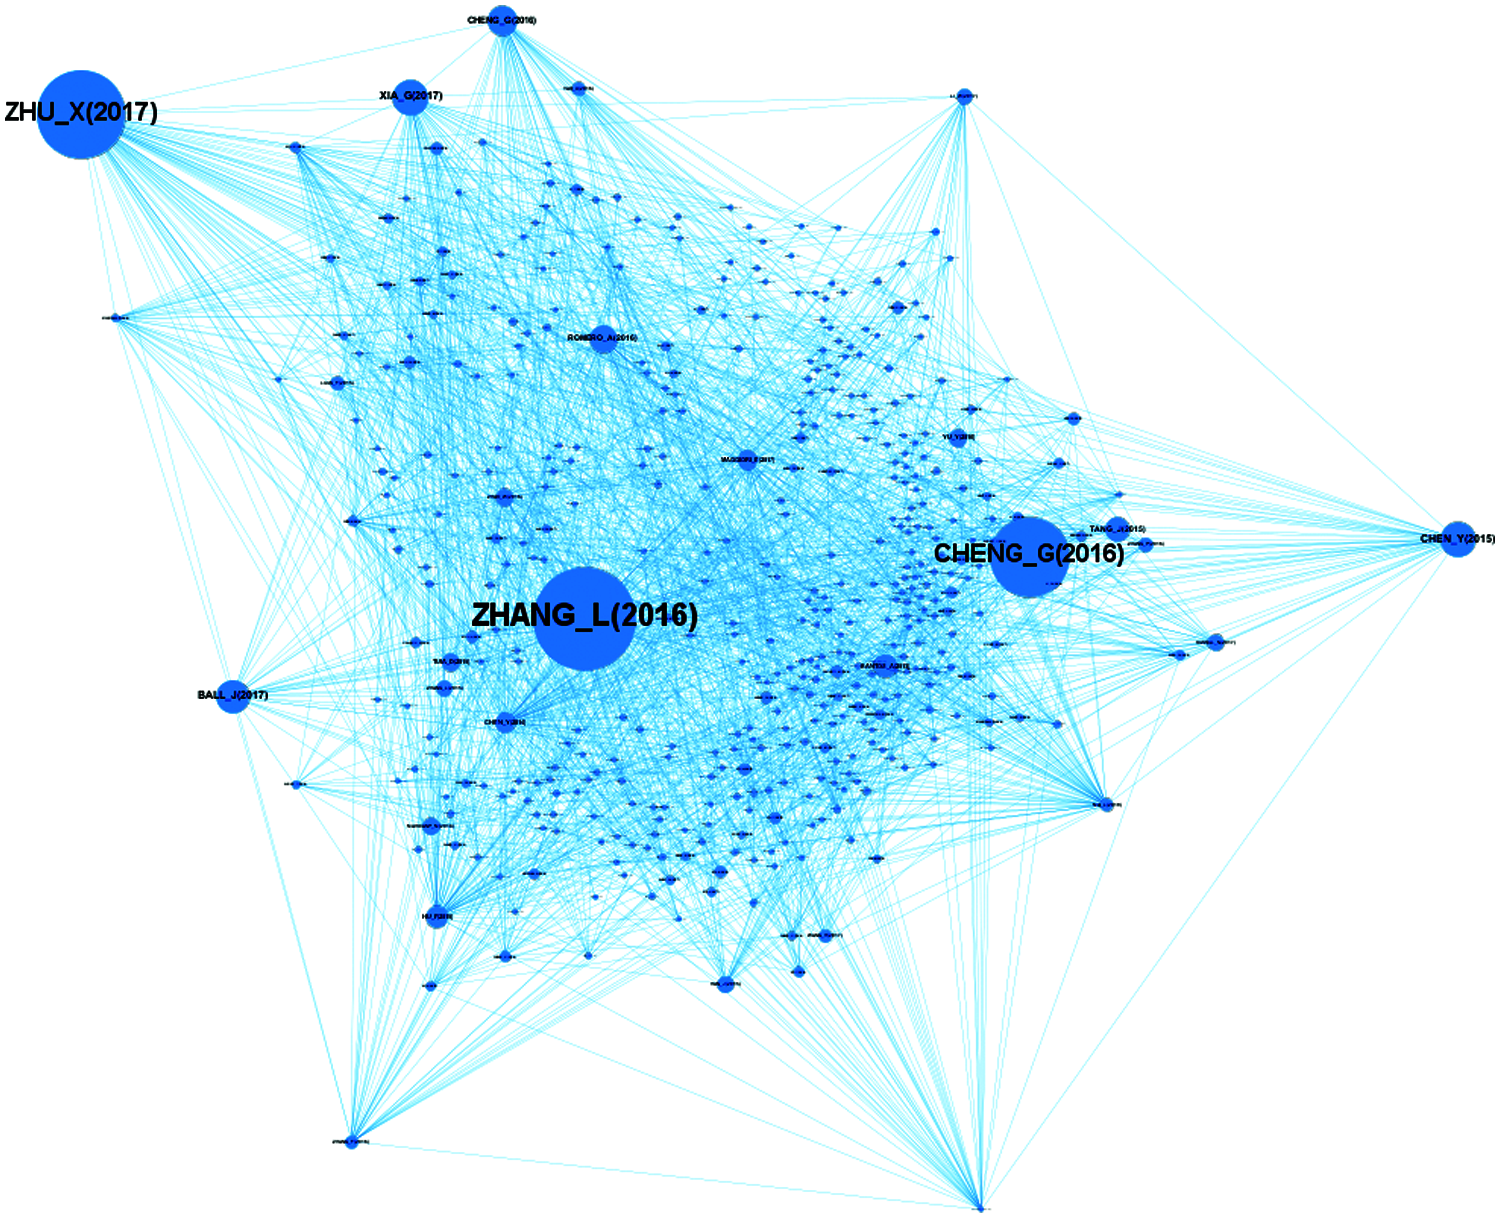
Figure 5: Distribution of betweenness centrality
Fig. 6 shows the citation network based on Closeness centrality. For better visualization, the size of the nodes in the graph is related to Closeness centrality value. The size of nodes with lower Closeness centrality is smaller, and as the value of Closeness centrality increases, its size also increases.
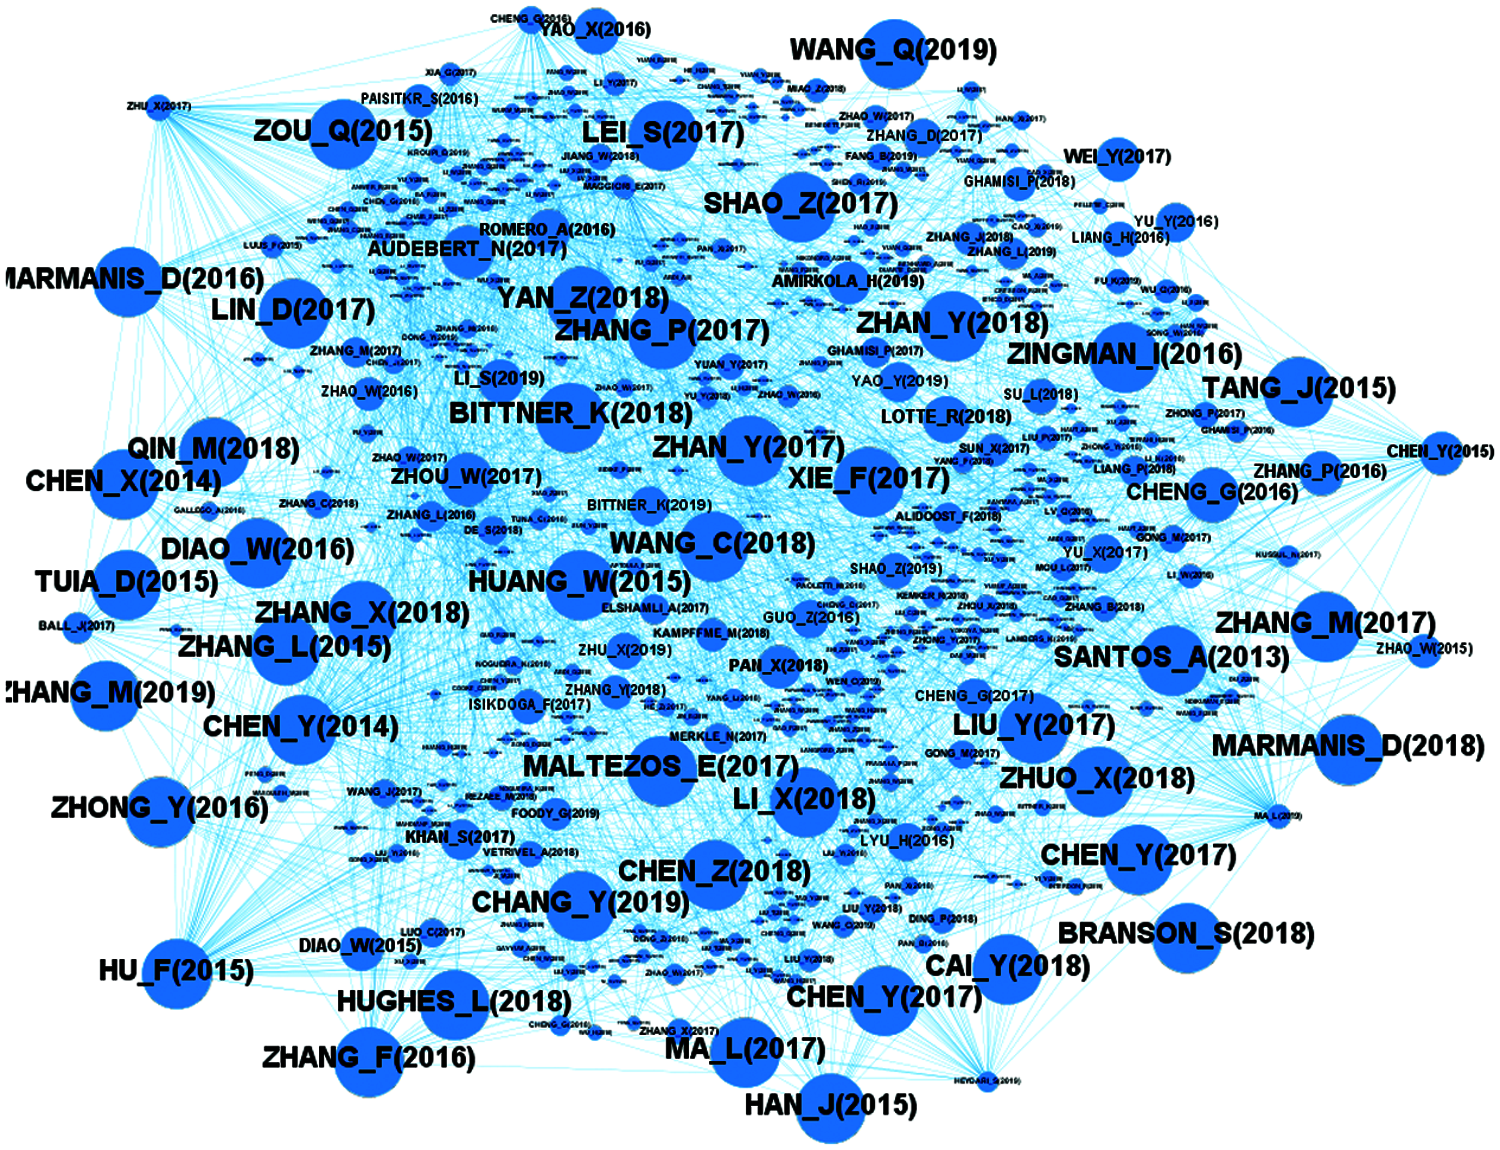
Figure 6: Distribution of closeness centrality
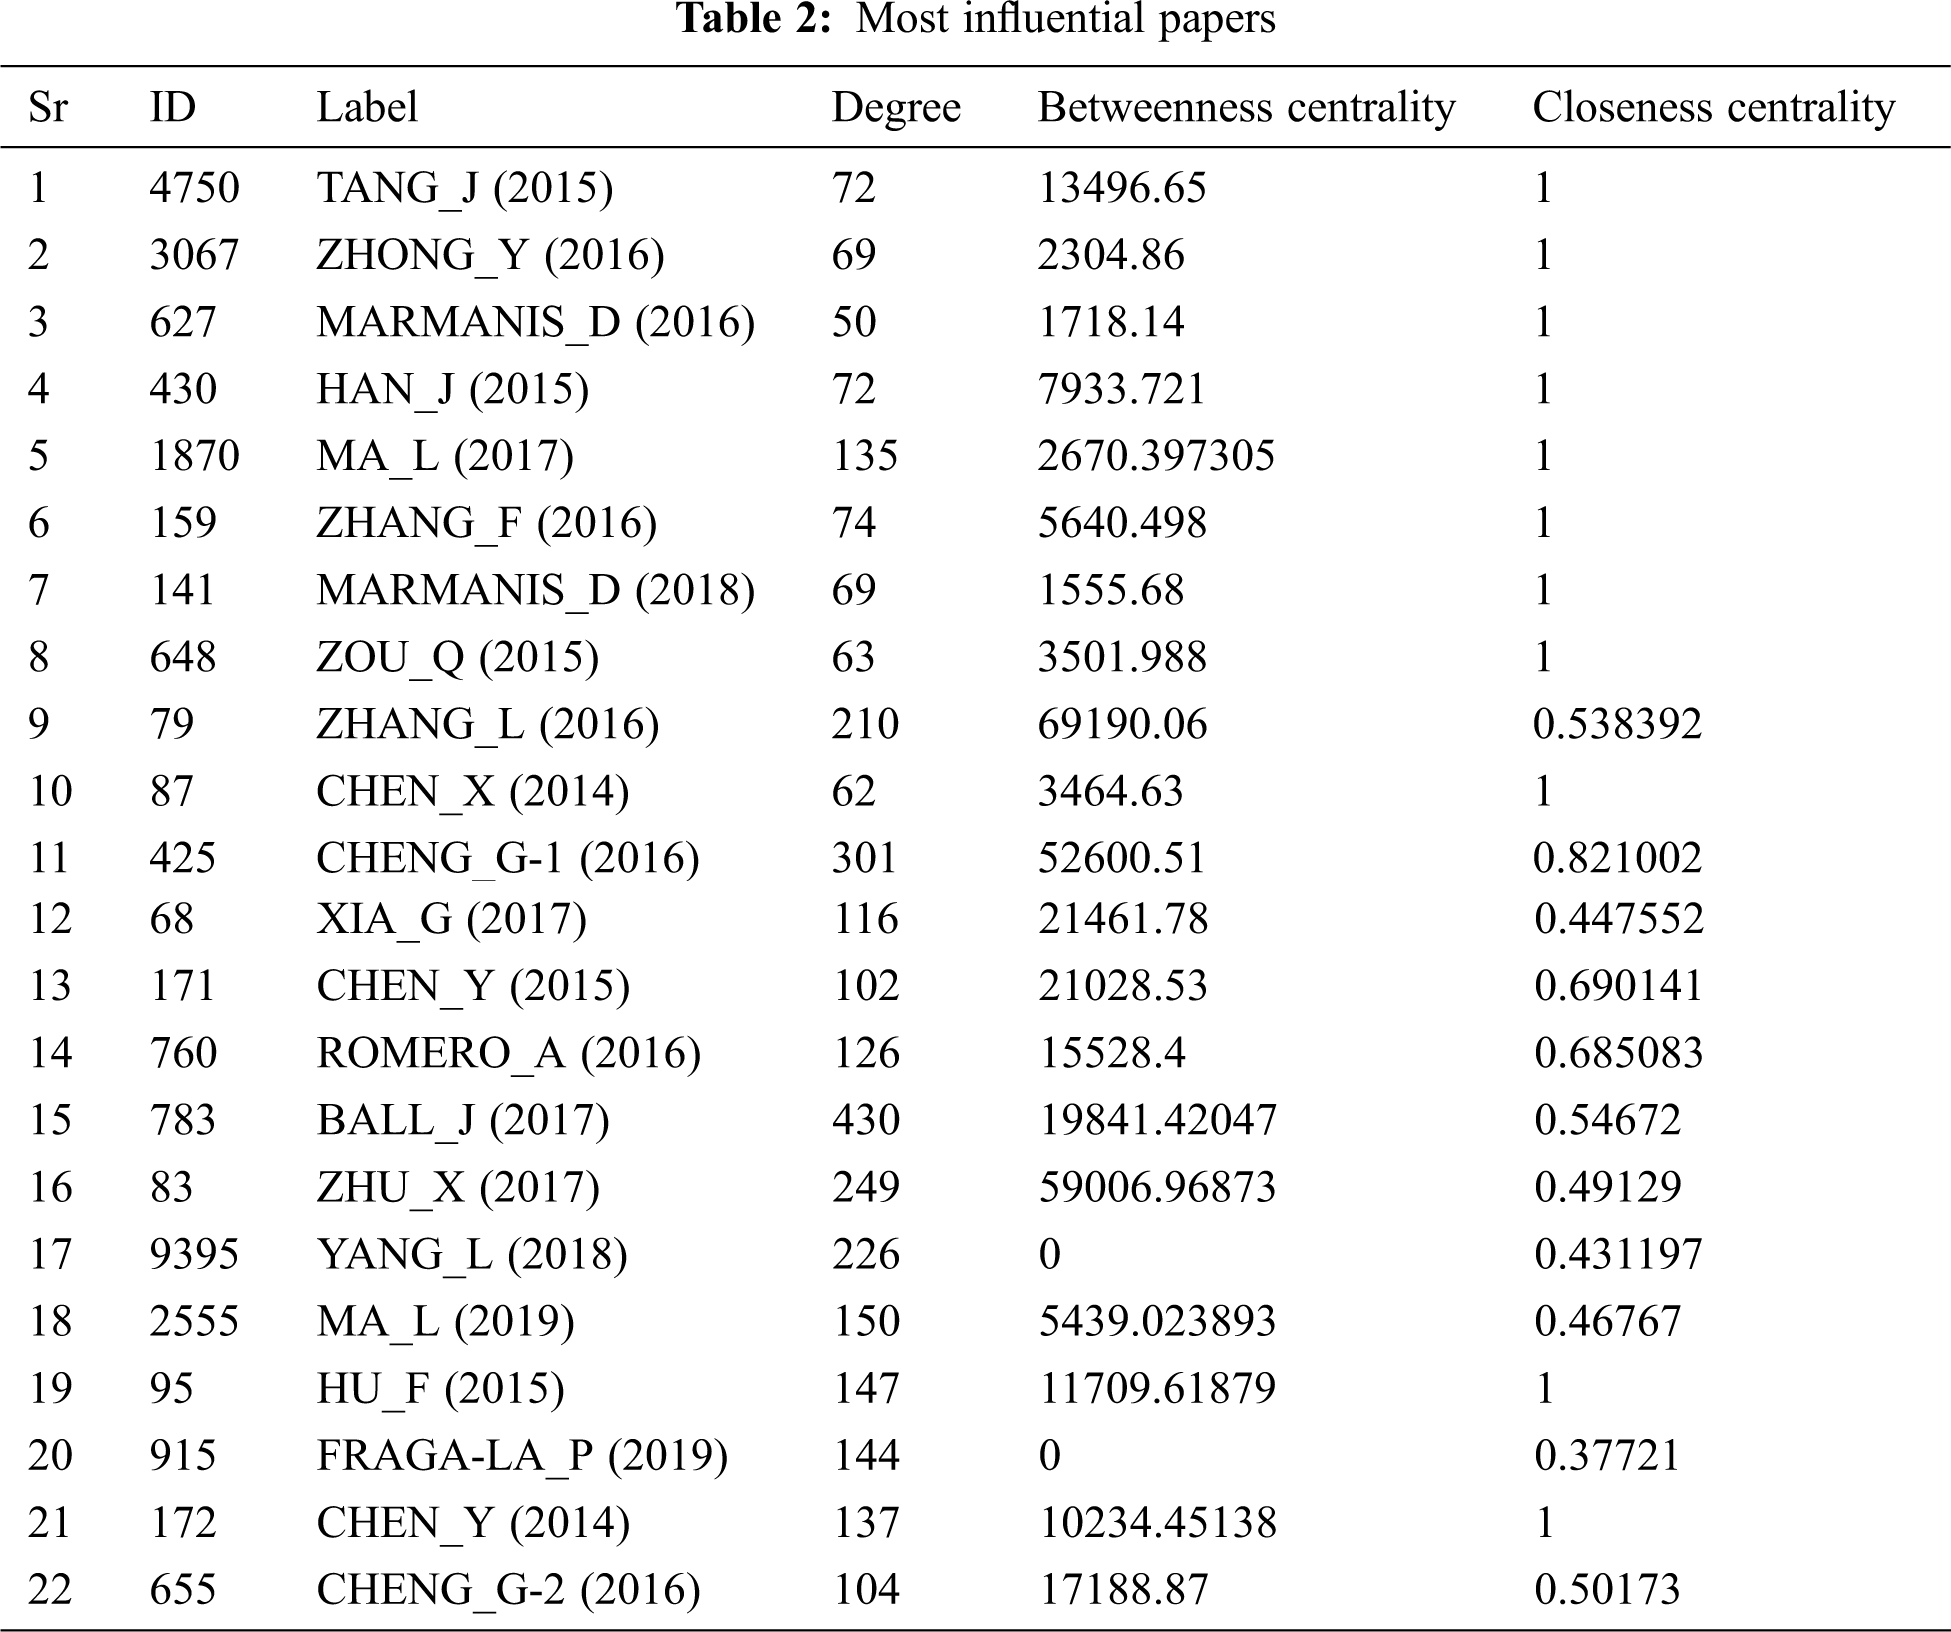
4.4 Identification of Influential Papers
We selected 22 papers as important papers from the collection of important papers. These papers are top papers based on features, Degree centrality, Betweenness centrality, and Closeness centrality. We concluded that these papers have contributed the most in this domain. These are given in the Tab. 2.
MPA revealed that there are 10 of the most important papers with sufficient contributions in this domain. These articles were published between 2014 and 2019. As shown in Fig. 7, the main path is highlighted by the first author, the year of publication, and the arrow points to each paper cited. After studying these 10 papers in-depth, we conclude that Chen_X (2014) and Chen _Y (2014) are papers that originated in this domain. From 2014 to 2017, “image classification and object detection” was the main domain. Later, the analysis discovered the fact that “urbanization and housing impacts” dominated the main research. According to the main path, Chen_X focuses on using Convolutional Neural Networks (CNN) for object detection in satellite images. The author invented a new method called hybrid CNN. This paper became a milestone in the field of object detection. Chen_Y focuses on the classification of hyperspectral data with the help of stacked auto-encoders. It plays a key role in hyperspectral data analysis. Zhao_W focuses on hyperspectral data analysis with the help of multi-scale CNN model for feature extraction and comparison. Zhang_L presented a literature review and evaluated all the methods and techniques used in Remote Sensing up to then. Li_W proposed a deep pixel pair method based on CNN to improve its function to better classify hyperspectral images. Santara_A introduces a band-adaptive spectral spatial feature learning neural network for hyperspectral image classification. It consists of an end-to-end network that extracts image features. Zhu_X reviewed existing knowledge and adjusted it in an evolutionary way. Finally, Ma_L reviewed all the literature from the beginning to the present.
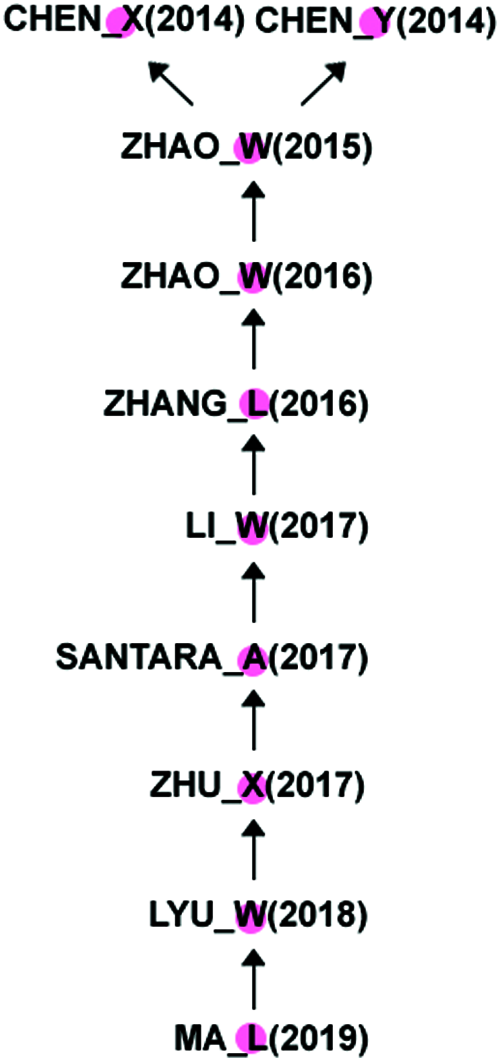
Figure 7: Main path from important papers
4.6 Comparison with Existing Methods
Generally speaking, researchers calculate the main path from all citations in the research, while we only derive the main path from important papers. According to the traditional method, the main path is generated from 12243 citations in Fig. 8 which returned 60 nodes. After eliminating the extra nodes for clustering Santos_A (2013), we got 9 nodes. By comparing our method with traditional methods, we found that six papers in the two main approaches are the same, while four papers are different, accounting for 40% of the total. Close monitoring found that certain selected features that make the paper important are much better in our main approach than existing documents. Tab. 3 provides the attributes of papers.
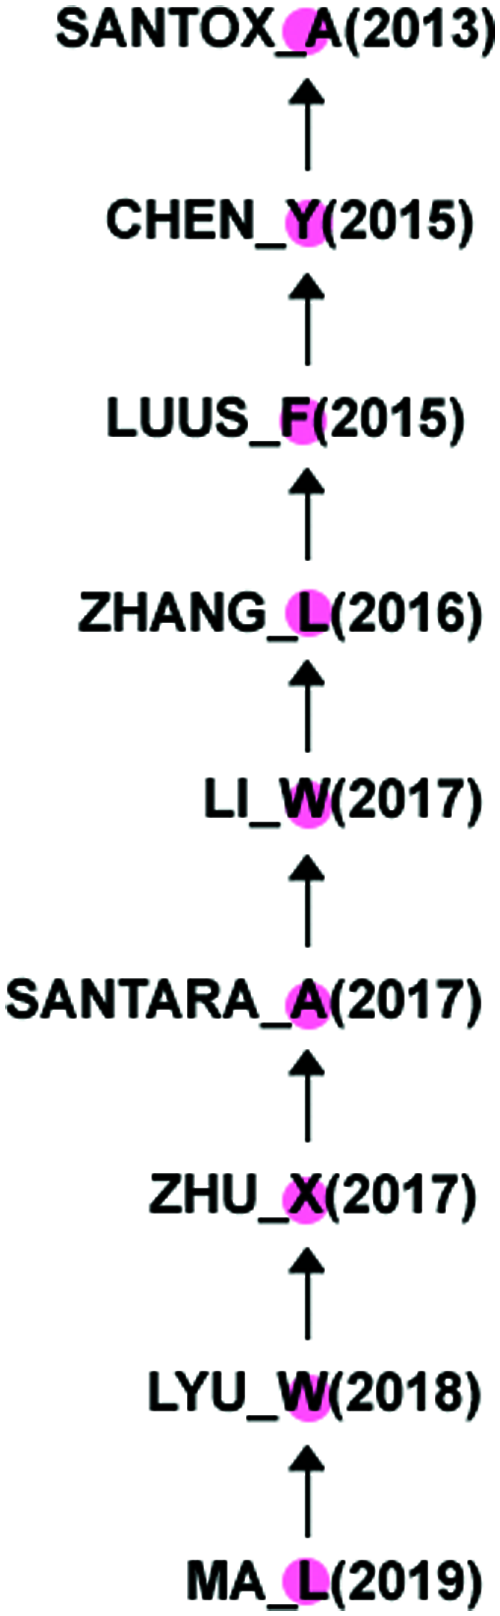
Figure 8: Main path from complete data set
In the Tab. 3. Degree, Betweenness and Closeness centrality score is mentioned. For better understanding, we added in-degree (the number of citations of a record).
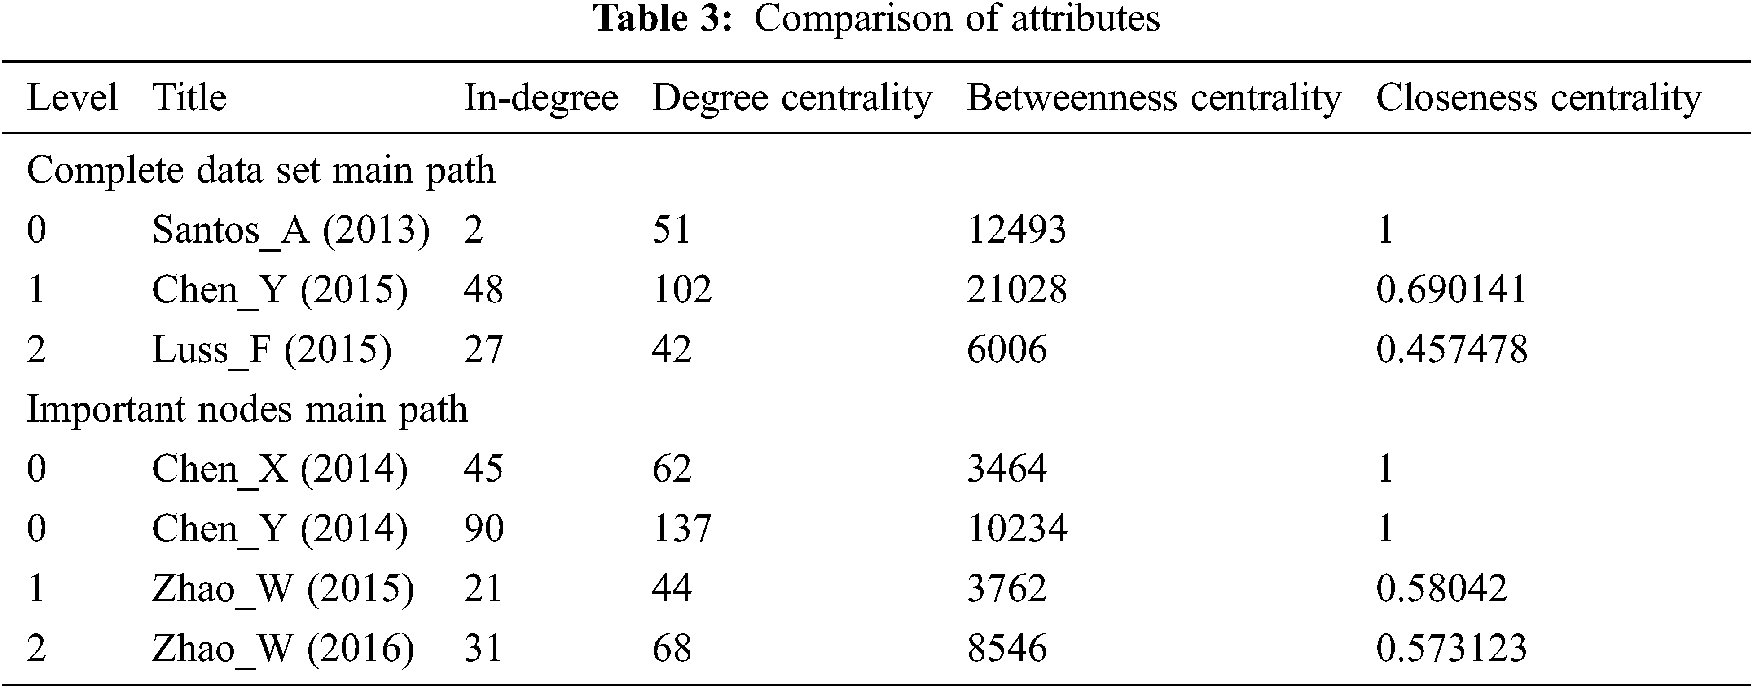
At level zero, Chen_X focuses on object detection, and ranks third in the table based on in-degree, with a score of 45. The score of 3464 Betweenness is the lowest, indicating that it is less central, and Closeness score of 1 means that it has a large proportion of knowledge dissemination, high degree and Closeness that makes it considerable. Based on hyperspectral analysis, Chen_Y has the highest degree of 90 in the table, Closeness of 1 and the third Betweenness position of 10234, which proves that it is the most important and influential node in the table, and has the highest number of citations, exceeding the average central position. Santos_A 2013 is a starting paper in the main path of “Complete data set” with in-degree of 2, because the starting papers in this field have been cited the most, which means that Santos_A should not be considered for analysis.
At level 1, Chen_Y 2015 focuses on hyperspectral analysis, with in-degree of 48, ranking third in the table. The Betweenness of 21028 indicates that it is more central node than other nodes in the table, and the Closeness score of 0.690141 indicates that we know that it is in the second place after the score of 1, which indicates that it plays a major role in knowledge dissemination. On the other hand, Zhao_W also focuses on hyperspectral analysis, with in-degree of 21, Betweenness centrality of 3762 and Closeness centrality of 0.58042, indicating that it is not much important as Chen_Y 2015, but Chen_Y 2015 is not directly related to Chen_Y 2014. The reason why it is not included in our main path.
Zhao_W 2016 is based on spatial features and hyperspectral analysis on level 2, with 31 in-degree, 8564 Betweenness centrality and 0.573123 Closeness centrality, indicating that all scores are at a medium level. At the same time, the lowest temperature of Luss_F 2015 is 27 in-degree, the Betweenness is 6006, and Closeness centrality is 0.457478. Therefore, compared with Luus_F, Zhao_W 2016 has higher citations, more central positions and wide spread of knowledge.
In this paper, we implemented MPA in the Remote Sensing sub-domain under the DL domain. We also applied machine learning technique K-Means to automatically cluster important and unimportant papers. For the first time, we have simultaneously used three centrality attributes to shortlist important papers, namely Degree, Betweenness and Closeness. As our results show, Chen_Y 2015 is also an important paper, although it is not part of our main path, the reason behind it is that it has no direct connection with our papers, because this is the beginning of the domain that’s why citing Chen_Y (2014) and Chen_Y was impossible. So we should treat it as part of the main path. Therefore, the new main path should include Chen_Y (2015). In the future, a tool that takes the input as a WOS text file should be built, and after all the analysis is performed, two types of clusters should be returned, namely important and unimportant clusters. Then, main path can be drawn using Pajek tool based on important papers.
Funding Statement: The authors received no specific funding for this study.
Conflicts of Interest: The authors declare that they have no conflicts of interest to report regarding the present study.
1. N. P. Hummon and P. Dereian, “Connectivity in a citation network: The development of DNA theory,” Social networks, vol. 11, no. 1, pp. 39–63, 1989. [Google Scholar]
2. V. Batagelj, “Efficient algorithms for citation network analysis,” arXiv preprint cs/0309023, pp. 1–27, 2003. [Google Scholar]
3. J. S. Liu and L. Y. Lu, “An integrated approach for main path analysis: Development of the hirsch index as an example,” Journal of the American Society for Information Science and Technology, vol. 63, no. 3, pp. 528–542, 2012. [Google Scholar]
4. L. C. Freeman, “Centrality in social networks conceptual clarification,” Social Networks, vol. 1, no. 3, pp. 215–239, 1978. [Google Scholar]
5. M. A. Beauchamp, “An improved index of centrality,” Behavioral Science, vol. 10, no. 2, pp. 161–163, 1965. [Google Scholar]
6. V. Batagelj and A. Mrvar, “Pajek-program for large network analysis,” Connections, vol. 21, no. 2, pp. 47–57, 1998. [Google Scholar]
7. N. J. Van Eck and L. Waltman, “Software survey: Vosviewer, a computer program for bibliometric mapping,” Scientometrics, vol. 84, no. 2, pp. 523–538, 2009. [Google Scholar]
8. S. Raghuram, P. Tuertscher and R. Garud, “Research note- mapping the field of virtual work: A cocitation analysis,” Information Systems Research, vol. 21, no. 4, pp. 983–999, 2010. [Google Scholar]
9. N. Wang, H. Liang, Y. Jia, S. Ge, Y. Xue et al., “Cloud computing research in the is discipline: A citation/co-citation analysis,” Decision Support Systems, vol. 86, pp. 35–47, 2016. [Google Scholar]
10. J. Schmidhuber, “Deep learning in neural networks: An overview,” Neural networks, vol. 61, no. 3, pp. 85–117, 2015. [Google Scholar]
11. G. Litjens, T. Kooi, B. E. Bejnordi, A. A. A. Setio, F. Ciompi et al., “A survey on deep learning in medical image analysis,” Medical image analysis, vol. 42, no. 13, pp. 60–88, 2017. [Google Scholar]
12. Y. Chen, Z. Lin, X. Zhao and G. Wang and Yanfeng Gu, “Deep learning-based classification of hyperspectral data,” IEEE Journal of Selected Topics in Applied Earth Observations and Remote Sensing, vol. 7, no. 6, pp. 2094–2107, 2014. [Google Scholar]
13. Y. Chen, X. Zhao and X. Jia, “Spectral- spatial classification of hyperspectral data based on deep belief network,” IEEE Journal of Selected Topics in Applied Earth Observations and Remote Sensing, vol. 8, no. 6, pp. 2381–2392, 2015. [Google Scholar]
14. G. Cheng, P. Zhou and J. Han, “Learning rotation-invariant convolutional neural networks for object detection in VHR optical remote sensing images,” IEEE Transactions on Geoscience and Remote Sensing, vol. 54, no. 12, pp. 7405–7415, 2016. [Google Scholar]
15. S. E. Jozdani, B. A. Johnson and D. Chen, “Comparing deep neural networks, ensemble classifiers, and support vector machine algorithms for object-based urban land use/land cover classification,” Remote Sensing, vol. 11, no. 14, pp. 1713, 2019. [Google Scholar]
16. N. Kussul, M. Lavreniuk, S. Skakun and A. Shelestov, “Deep learning classification of land cover and crop types using remote sensing data,” IEEE Geoscience and Remote Sensing Letters, vol. 14, no. 5, pp. 778–782, 2017. [Google Scholar]
17. D. Marmanis, M. Datcu, T. Esch and U. Stilla, “Deep learning earth observation classification using imagenet pretrained networks,” IEEE Geoscience and Remote Sensing Letters, vol. 13, no. 1, pp. 105–109, 2015. [Google Scholar]
18. A. Sharma, X. Liu, X. Yang and D. Shi, “A patch-based convolutional neural network for remote sensing image classification,” Neural Networks, vol. 95, no. 9, pp. 19–28, 2017. [Google Scholar]
19. A. Vetrivel, M. Gerke, N. Kerle, F. Nex and G. Vosselman, “Disaster damage detection through synergistic use of deep learning and 3D point cloud features derived from very high resolution oblique aerial images, and multiple-kernel-learning,” ISPRS Journal of Photogrammetry and Remote Sensing, vol. 140, no. 11, pp. 45–59, 2018. [Google Scholar]
20. X. Yu, X. Wu, C. Luo and P. Ren, “Deep learning in remote sensing scene classification: A data augmentation enhanced convolutional neural network framework,” GIScience & Remote Sensing, vol. 54, no. 5, pp. 741–758, 2017. [Google Scholar]
21. Q. Zou, L. Ni, T. Zhang and Q. Wang, “Deep learning based feature selection for remote sensing scene classification,” IEEE Geoscience and Remote Sensing Letters, vol. 12, no. 11, pp. 2321–2325, 2015. [Google Scholar]
22. J. S. Liu, L. Y. Lu and M. H. Ho, “A few notes on main path analysis,” Scientometrics, vol. 119, no. 1, pp. 379–391, 2019. [Google Scholar]
23. M. M. Kessler, “An experimental study of bibliographic coupling between technical papers, Massachusetts Inst. of Tech Lexington Lincoln Lab, Report, 1962. [Google Scholar]
24. D. J. Price, “Networks of scientific papers,” Science, vol. 149, no. 3683, pp. 510–515, 1965. [Google Scholar]
25. E. Garfield, “Citation analysis as a tool in journal evaluation,” Science, vol. 178, no. 4060, pp. 471–479, 1972. [Google Scholar]
26. F. Narin, “Patent bibliometrics,” Scientometrics, vol. 30, no. 1, pp. 147–155, 1994. [Google Scholar]
27. H. Small, “Co-citation in the scientific literature: A new measure of the relationship between two documents,” Journal of the American Society for information Science, vol. 24, no. 4, pp. 265–269, 1973. [Google Scholar]
28. H. D. White and B. C. Griffith, “Author cocitation: A literature measure of intellectual structure,” Journal of the American Society for information Science, vol. 32, no. 3, pp. 163–171, 1981. [Google Scholar]
29. K. W. McCain, “Mapping authors in intellectual space: A technical overview,” Journal of the American society for information science, vol. 41, no. 6, pp. 433–443, 1990. [Google Scholar]
30. E. Garfield, “Is citation analysis a legitimate evaluation tool?” Scientometrics, vol. 1, no. 4, pp. 359–375, 1979. [Google Scholar]
31. H. Small, “Visualizing science by citation mapping,” Journal of the American society for Information Science, vol. 50, no. 9, pp. 799–813, 1999. [Google Scholar]
32. J. Bollen, M. A. Rodriquez and H. V. Sompel, “Journal status,” Scientometrics, vol. 69, no. 3, pp. 669–687, 2006. [Google Scholar]
33. J. S. Liu, H. Chen, M. H. Ho and Y. Li, “Citations with different levels of relevancy: tracing the main paths of legal opinions,” Journal of the Association for Information Science and Technology, vol. 65, no. 12, pp. 2479–2488, 2014. [Google Scholar]
34. D. Yu and T. Pan, “Tracing knowledge diffusion of TOPSIS: A historical perspective from citation network,” Expert Systems with Applications, vol. 168, no. 2, pp. 114238, 2021. [Google Scholar]
35. S. Kim, S. Yoon, N. Raghavan, N. T. Le and H. Park, “Developmental trajectories in blockchain technology using patent-based knowledge network analysis,” IEEE Access, vol. 9, pp. 44704–44717, 2021. [Google Scholar]
36. D. Yu and T. Pan, “Identifying technological development trajectories in blockchain domain: A patent citation network analysis,” Technology Analysis & Strategic Management, pp. 1–14, 2021. [Google Scholar]
37. D. Yu and T. Pan, “Tracing the main path of interdisciplinary research considering citation preference: A case from blockchain domain,” Journal of Informetrics, vol. 15, no. 2, pp. 101136, 2021. [Google Scholar]
38. M. Bastian, S. Heymann and M. Jacomy, “Gephi: An open source software for exploring and manipulating networks,” in Proc. ICWSM, San Jose, California, USA, pp. 361–362, 2009. [Google Scholar]
39. C. Colicchia, A. Creazza and F. Strozzi, “Citation network analysis for supporting continuous improvement in higher education,” Studies in Higher Education, vol. 43, no. 9, pp. 1637–1653, 2018. [Google Scholar]
40. S. Xu, L. Hao, X. An, H. Pang and T. Li, “Review on emerging research topics with key-route main path analysis,” Scientometrics, vol. 122, no. 1, pp. 607–624, 2020. [Google Scholar]
41. L. C. Freeman, D. Roeder and R. R. Mulholland, “Centrality in social networks: II. experimental results,” Social Networks, vol. 2, no. 2, pp. 119–141, 1979. [Google Scholar]
42. K. Okamoto, W. Chen and X. Li, “Ranking of closeness centrality for large-scale social networks,” in Proc. FAW, Changsha, China, pp. 186–195, 2008. [Google Scholar]
43. E. Abrahamson and L. Rosenkopf, “Social network effects on the extent of innovation diffusion: A computer simulation,” Organization Science, vol. 8, no. 3, pp. 289–309, 1997. [Google Scholar]
 | This work is licensed under a Creative Commons Attribution 4.0 International License, which permits unrestricted use, distribution, and reproduction in any medium, provided the original work is properly cited. |