DOI:10.32604/iasc.2022.020849
| Intelligent Automation & Soft Computing DOI:10.32604/iasc.2022.020849 | |
| Article |
Emotion Recognition with Short-Period Physiological Signals Using Bimodal Sparse Autoencoders
1School of Electrical Engineering, Korea University, 145, Anam-ro, Seongbuk-gu, Seoul, Korea
2Department of Software, Sangmyung University, Cheonan, 31066, Korea
3Department of System Semiconductor Enginnering, Sangmyung University, Cheonan, 31066, Korea
4Department of Human Intelligence and Robot Engineering, Sangmyung University, Cheonan, 31066, Korea
*Corresponding Author: Tae-Koo Kang. Email: tkkang@smu.ac.kr
Received: 11 June 2021; Accepted: 06 September 2021
Abstract: With the advancement of human-computer interaction and artificial intelligence, emotion recognition has received significant research attention. The most commonly used technique for emotion recognition is EEG, which is directly associated with the central nervous system and contains strong emotional features. However, there are some disadvantages to using EEG signals. They require high dimensionality, diverse and complex processing procedures which make real-time computation difficult. In addition, there are problems in data acquisition and interpretation due to body movement or reduced concentration of the experimenter. In this paper, we used photoplethysmography (PPG) and electromyography (EMG) to record signals. Firstly, we segmented the emotion data into 10-pulses during preprocessing to identify emotions with short period signals. These segmented data were input to the proposed bimodal stacked sparse auto-encoder model. To enhance recognition performance, we adopted a bimodal structure to extract shared PPG and EMG representations. This approach provided more detailed arousal-valence mapping compared with the current high/low binary classification. We created a dataset of PPG and EMG signals, called the emotion dataset dividing into four classes to help understand emotion levels. We achieved high performance of 80.18% and 75.86% for arousal and valence, respectively, despite more class classification. Experimental results validated that the proposed method significantly enhanced emotion recognition performance.
Keywords: Emotion recognition; physiological signal; bimodal structure network; stacked sparse autoencoder; EDPE dataset
HCI as well as human-to-human interaction have become very important as artificial advance and has expanded to various fields, including using emotion in computers, which has recently attracted significant research attention. Considerable research has been conducted regarding human emotions in modern society, particularly the relationship with computer technology [1]. Although emotion classification research using deep learning techniques has been academically studied and published, it remains insufficient in several areas, discussed below. Therefore, emotion research is a promising area for future development. Emotions are complex psycho-physiological processes associated with external and internal activities [2,3]. Although they can be consciously recognized from facial expressions, speech, text, gestures [4], these are not reliable indicators since they can be falsified by individuals or may not be produced as a result of the implied emotion. Physiological signals are more accurate indicators because they generally cannot be consciously controlled. Therefore, emotion recognition methods based on physiological signals such as photoplethysmography (PPG), electromyography (EMG), electroencephalography (EEG), electrooculography, electro-skin response, and respiration are more objective and reliable [5–8].
The most commonly used technique for emotion recognition is EEG, which is directly associated with the central nervous system and contains strong emotional features. However, there are some disadvantages to using EEG signals.
1. EEG can (rarely) induce simple partial and (even more rarely) complex partial seizures, particularly with frontal lobe onset; and EEG signal interpretation can become difficult or impossible if body movements generate excessive artifacts. Therefore, it is important to consider relevant clinical seizure knowledge that may accompany EEG changes.
2. EEG analysis is limited by its high dimensionality, requiring diverse and difficult processing.
Hence, practical real-life meaningful EEG data collection is difficult, even if good classification can be achieved with subsequent analysis. To address these problems, we chose PPG and EMG to recognize emotion-based various physiological signals which can be easily and fast obtained and analyzed. PPG and EMG patterns contain considerable emotional information and can be incorporated into practical wearable devices [9–12]. Therefore, they can be relatively easily measured and are somewhat less complex to analyze EEG signals. To solve the problem, we proposed the bimodal Autoencoder to recognize emotions in real-time using short-term data. Therefore, this study focused on emotion recognition using deep learning models based on PPG and EMG signals.
Emotions can be affected by many factors, and each emotion has fuzzy boundaries. Therefore, it is ambiguous to quantify emotions or define them as objective criteria. Various models that define emotion have been developed, but most emotion recognition studies use Russell’s circumflex theory, which assumes emotions are distributed in a two-dimensional circular space with arousal and valence dimensions. Generally, arousal is considered as the vertical axis and valence the horizontal, with the origin (circle center) representing neutral valence and medium arousal level. Emotional states can be represented at any valence and arousal level, e.g., excited has high arousal and high valence, whereas depressed has low arousal and low valence. Emotions can manifest in various ways, and current emotion recognition systems are generally based on facial expressions, voice, gesture, text, and physiological signals.
Psychologists and engineers have attempted to analyze these data to explain and categorize emotions. Although there are strong relationships between physiological signals and human emotional states, traditional manual feature extraction suffers from fundamental limitations to describe emotion-related characteristics from physiological signals.
In contrast, deep learning can automatically derive features from raw signals, allowing automatic feature selection and bypassing feature selection computational costs [13]. Deep learning methods have been recently applied to processing physiological signals, such as EEG or voice, achieving comparable results with conventional methods [14–16]. Martinez et al. were the first to propose CNNs to establish physiological models for emotion, with many subsequent deep emotion recognition studies [17–20]. Autoencoders have recently attracted research attention for biological signal processing, particularly for signal reconstruction and feature extraction. Therefore, we propose emotion recognition using a deep learning autoencoder model.
3 Emotion Recognition with Bimodal Stacked Sparse Auto-Encoder
3.1 PPG and EMG Data Acquisition and Preprocessing
We selected PPG and EMG signals to identify emotions since both signals tend to vary with emotion. However, significant irrelevant, redundant, noisy, and/or unreliable data levels will make knowledge discovery during training difficult. Therefore, we preprocessed the collected data to be more suitable for analysis.
3.1.1 Peak Value Detection for Each Signal Type
Various physiological signal analysis methods have been investigated, including time and/or frequency domain, and geometric analyses. Time-domain analyses, segmented as average cycle rate and the difference between longest and shortest signal values, are most commonly employed [21]. However, preprocessing by average cycle rate is inefficient because we need to capture instantaneous change trends; and differences between longest and shortest signals are irrelevant because the data varies fundamentally between participants. Therefore, we segmented the captured signals into short signal periods based on the peak value, to extract maximum information within the raw signal with minimum loss.
Fig. 1 shows that PPG high peaks and EMG low peaks were distinguishable from the characteristic waveforms. However, full-length signals are difficult to correlate with specific emotions, since emotional expressions weaken or deteriorate as measurement time increases. Therefore, we segmented the signals into short signals to reflect emotion trends and eliminate signals differing from the trend. Regular periodicity signals were divided into single-pulse sections. Comparing PPG and EMG data, we set single-pulse data length = 86 sample points, where segmenting this length differed depending on the particular signal characteristics.
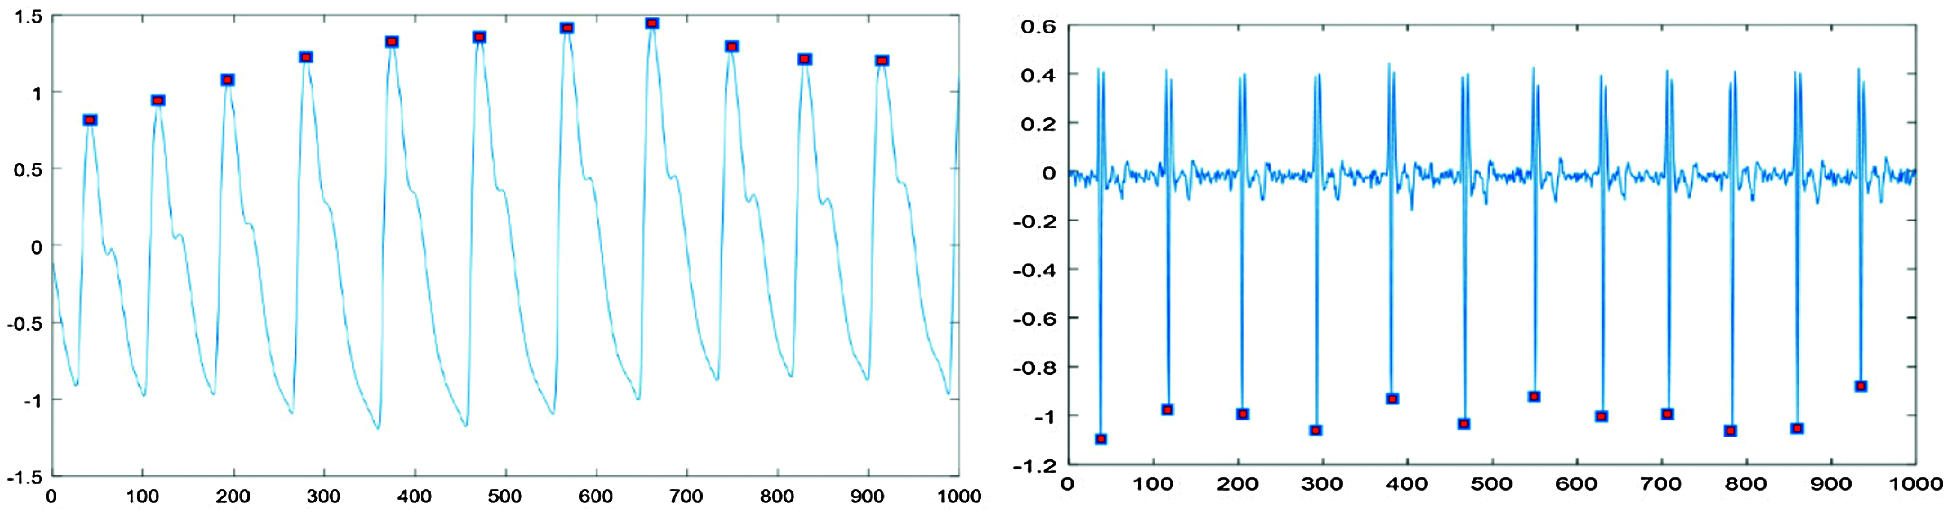
Figure 1: Peak point detection for each signal type
Fig. 2 shows typical resulting extracted signals. In Fig. 2, typical PPG signal single-pulse length 86 data points, approximately 25 data points to the left and 60 to the right of the high peak, whereas EMG signal single pulse length 86 data points, approximately 43 data points to the left and 42 to the right of the low peak point.
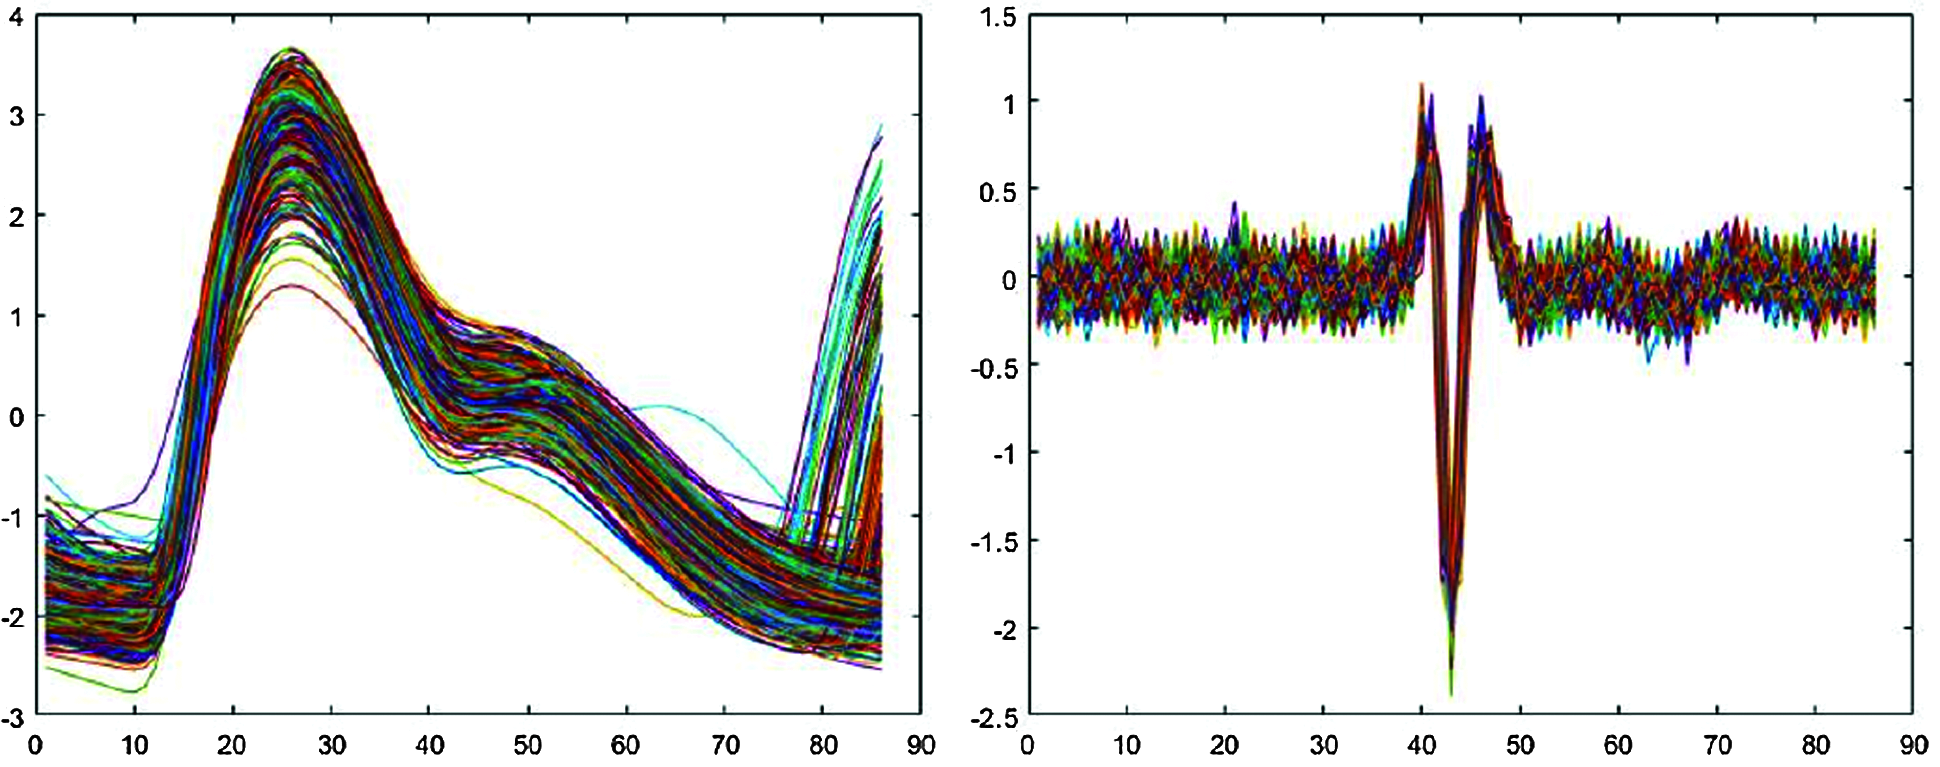
Figure 2: Signals segmented into single pulses
Therefore, we applied the segmentation criteria
where x* denotes the partial (single-pulse) signal length extracted from the entire signal, Hp and Lp are high and low peak locations respectively, CL and CR present left and right constants respectively assigned relative to the peak point.
3.1.2 Amplitude Threshold Detection for Each Signal Type
Maximum amplitude from the center of the signal differed for each person. Therefore, we needed an objective threshold to detect a peak and hence the peak value for all datasets. Fig. 3 shows the process of finding the optimal threshold for PPG single-pulse signals. The red lines on either side of the green line determine the criteria for identifying a peak. Data is lost and the signal is not properly segmented if these are set too high, and meaningless or noisy data may be included if set too low.
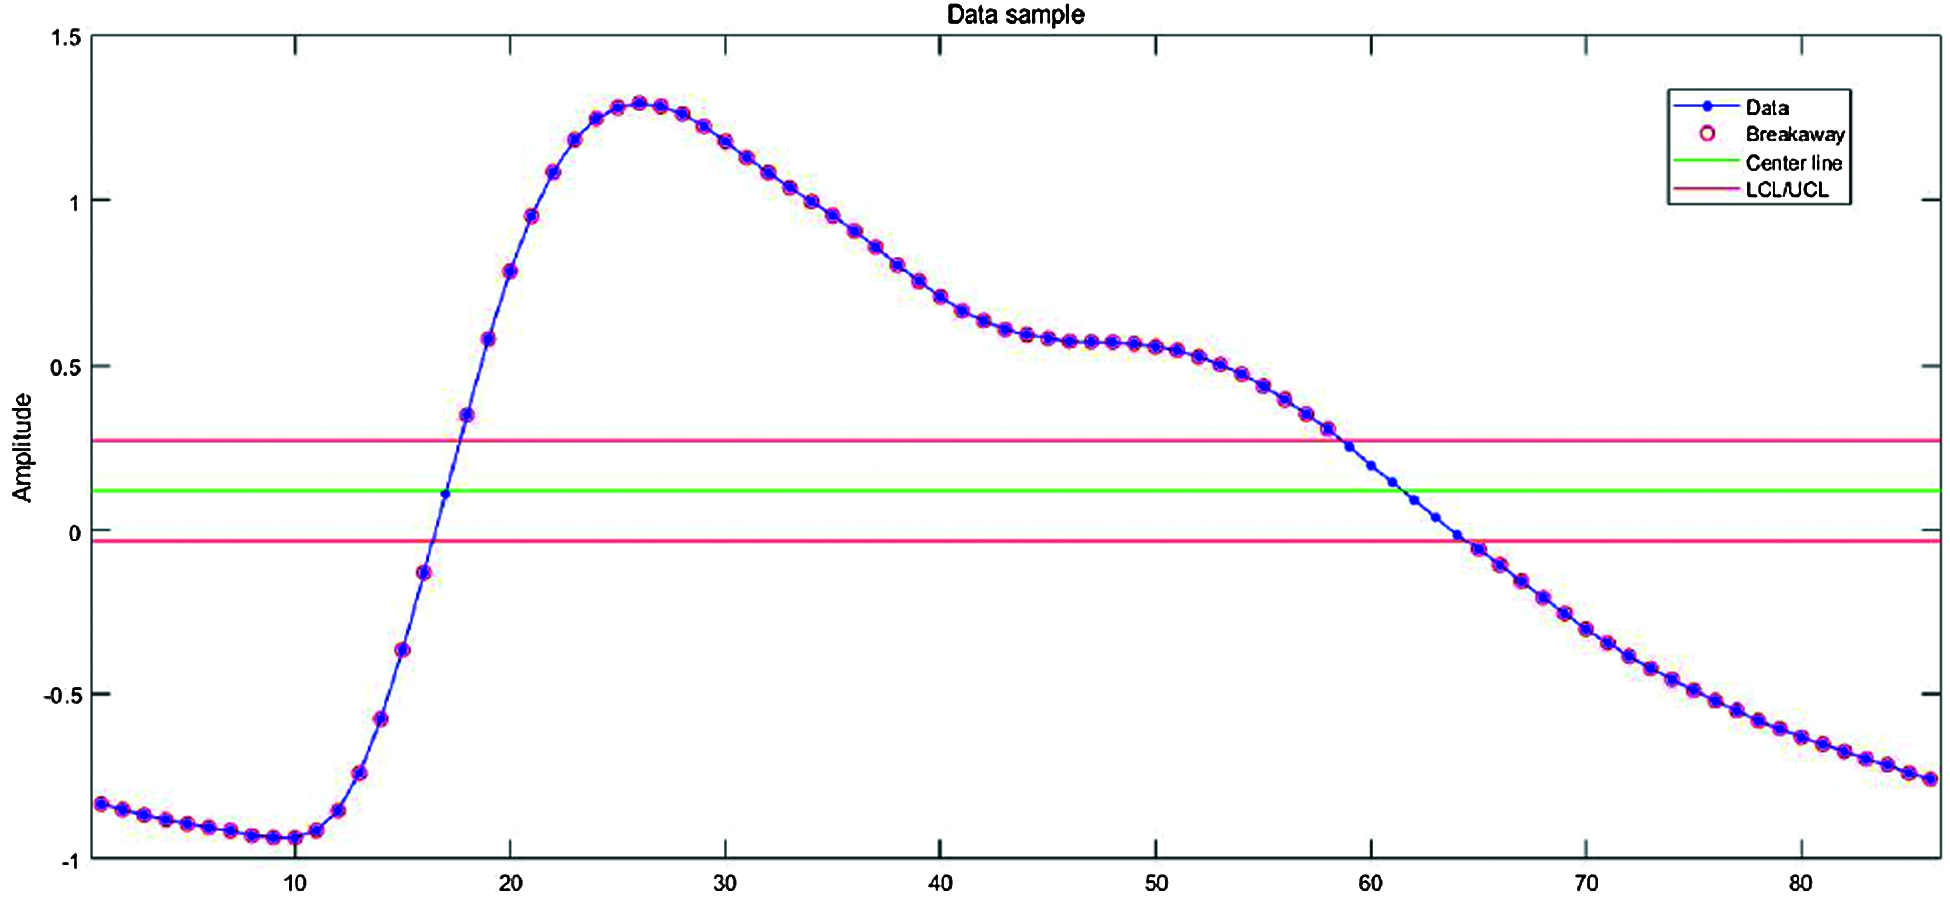
Figure 3: Optimal threshold detection
Fig. 4 shows the segmented single-pulse distribution for a typical PPG signal, and Fig. 5 shows signal outcomes for different thresholds. The upper part of each rectangle in Fig. 4 indicates the third quartile, the red horizontal line indicates the median, the bottom part indicates the first quartile, and the vertical lines indicate maximum and minimum values.
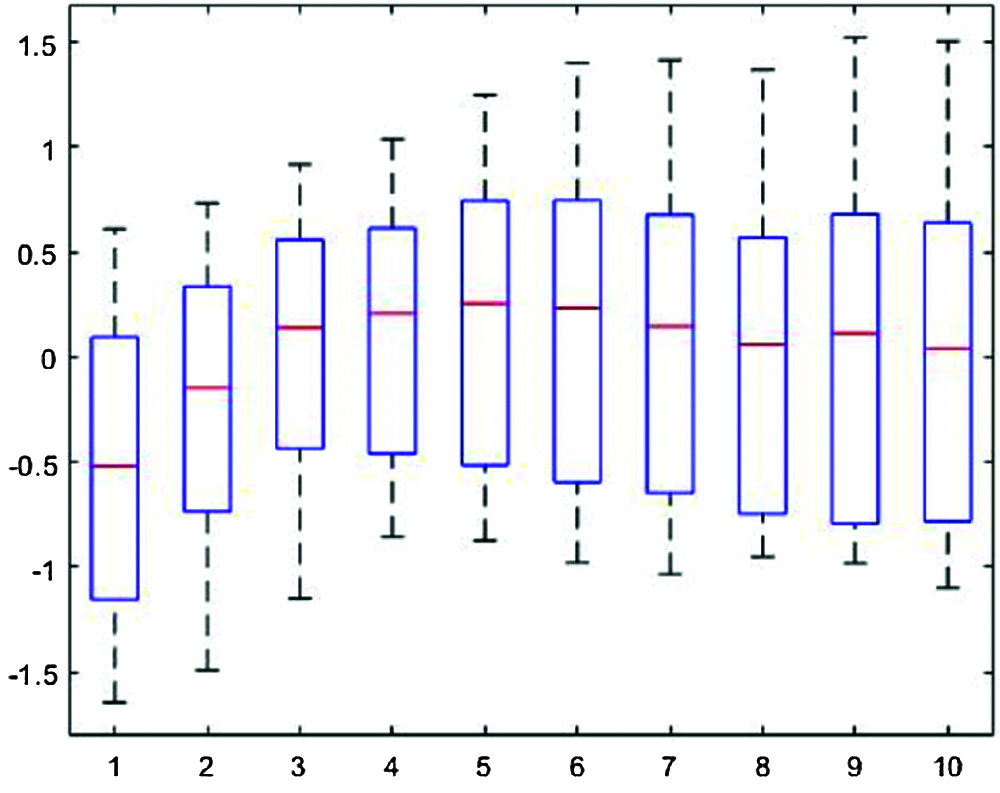
Figure 4: Segmented single-pulse distribution for a typical photoplethysmograph signal
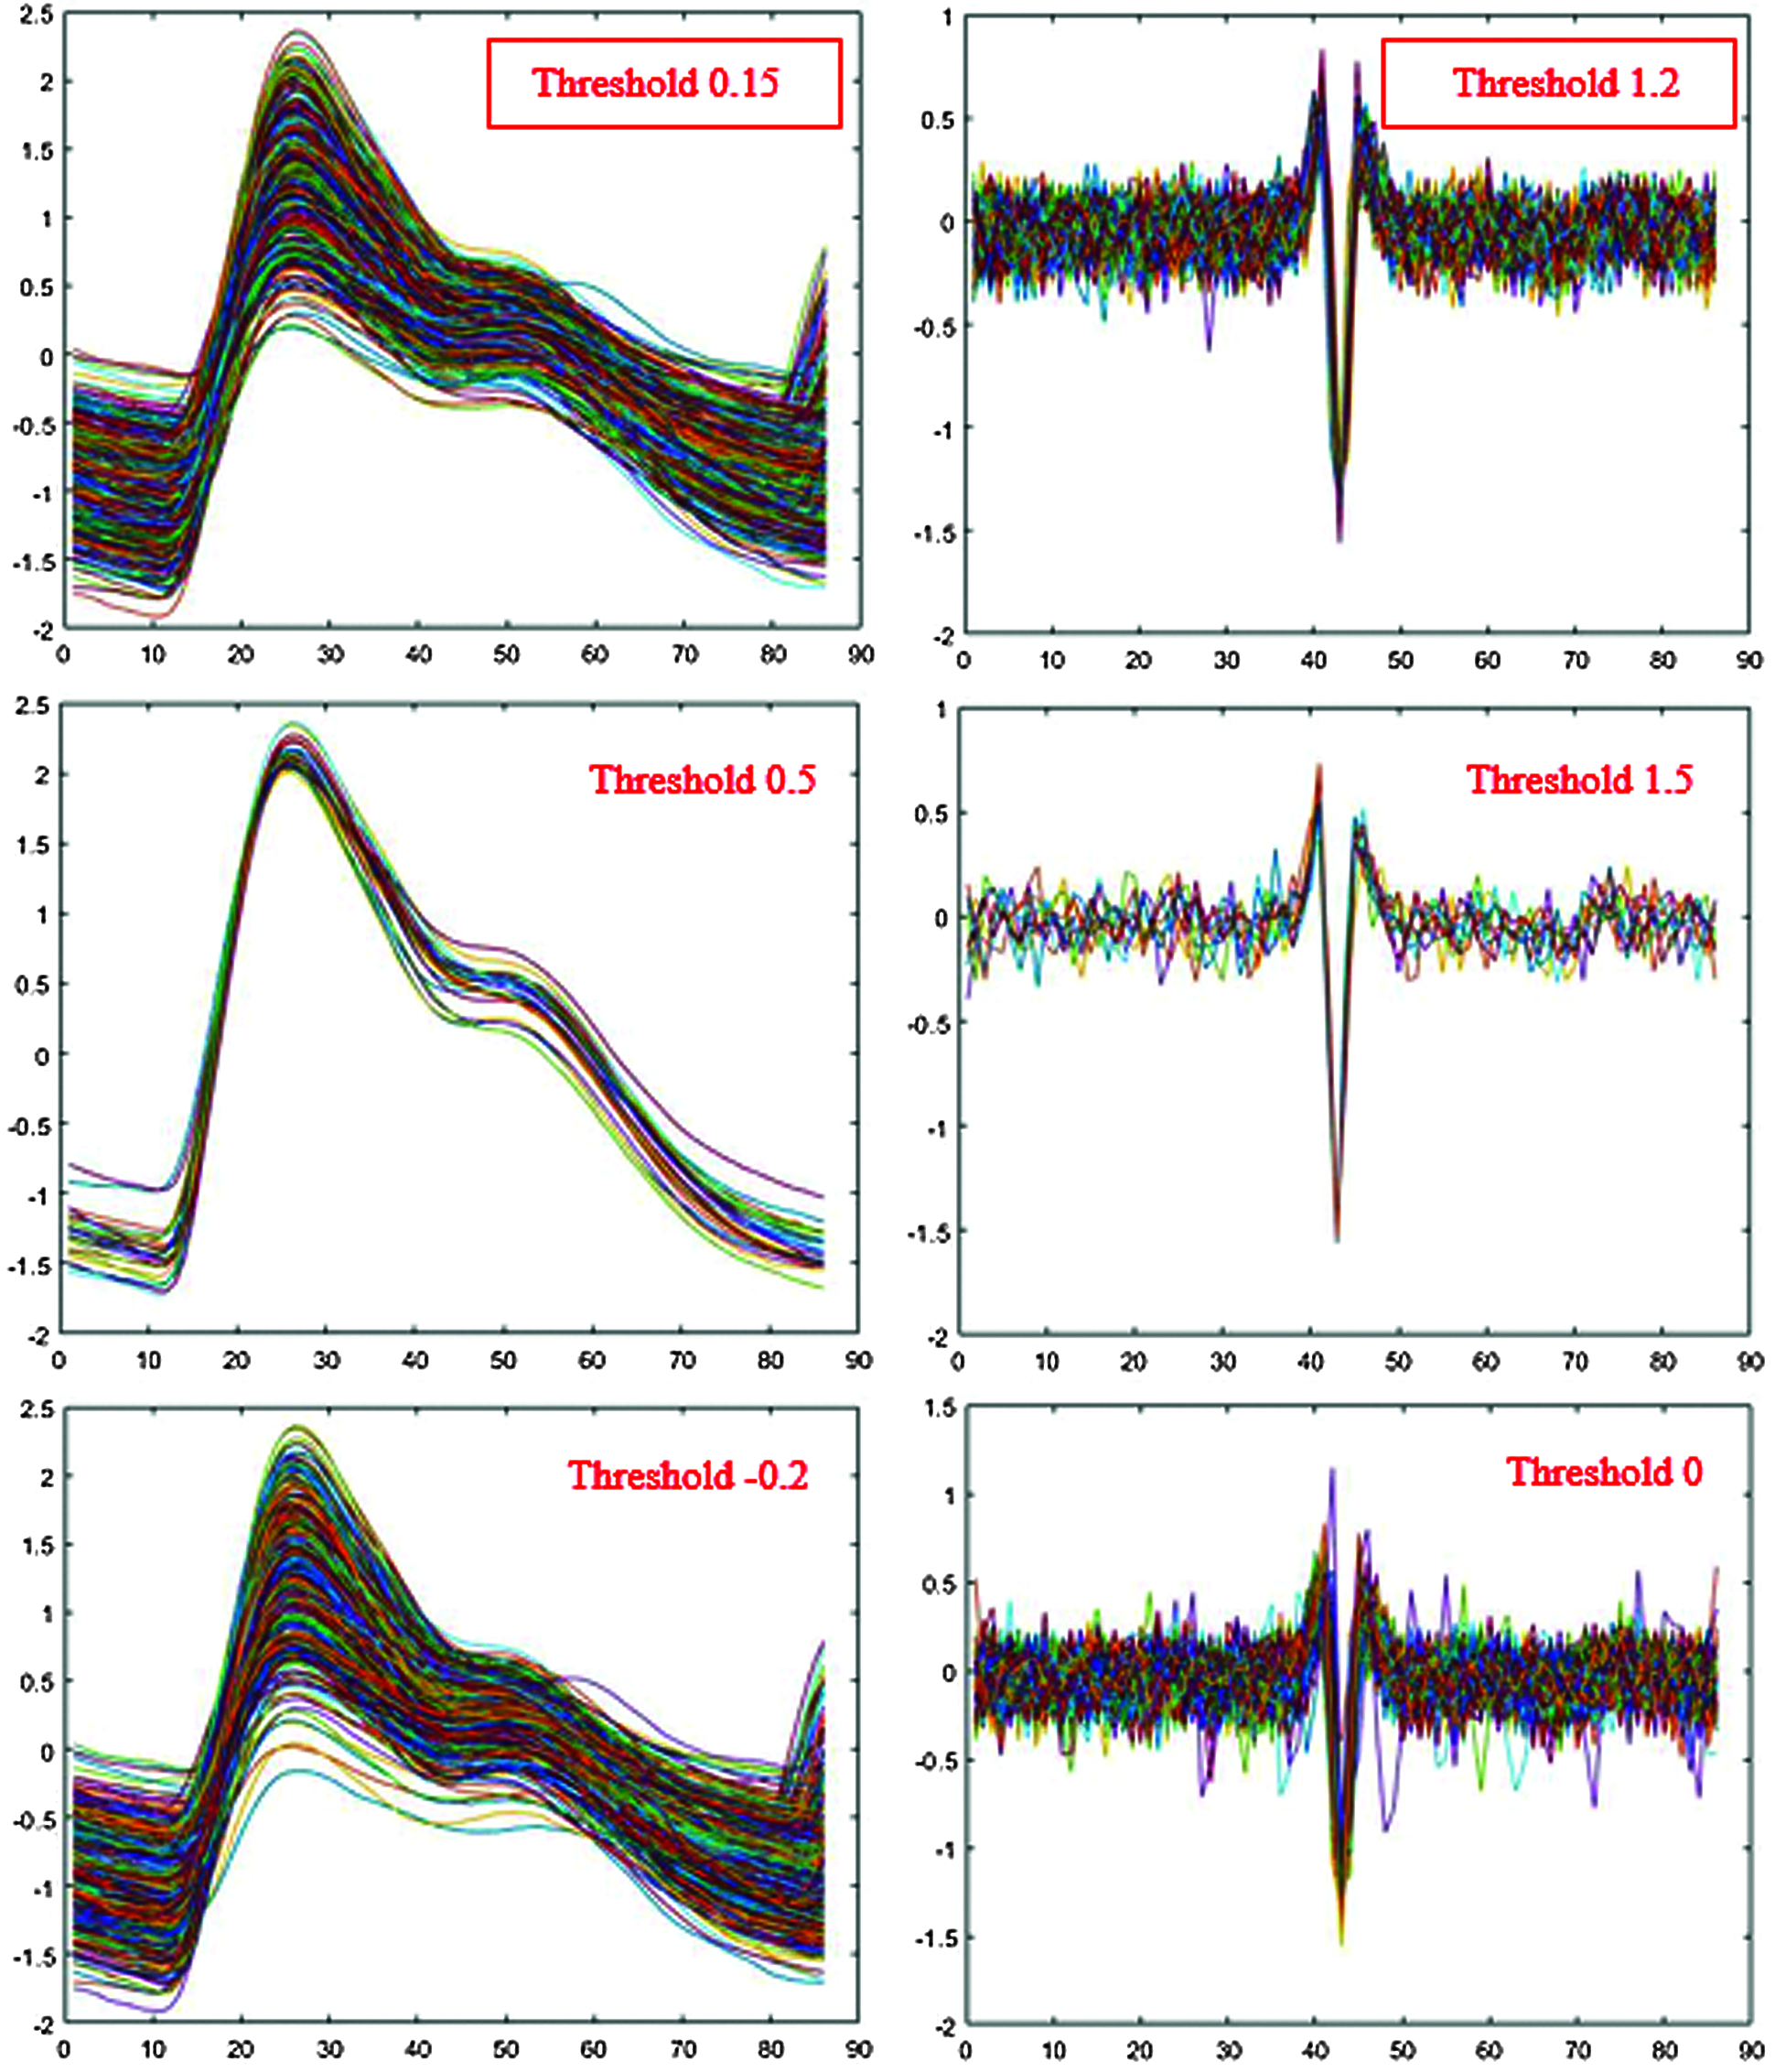
Figure 5: Single-pulse signal effects from different thresholds
Maximum information was obtained with the minimum loss for PPG threshold = 0.15 and EMG threshold = 1.2 (Fig. 5). However, we first converted EMG low peaks to positive peaks by taking absolute values and discarding values below the threshold.
3.1.3 Segmentation into Short-Period Signals
We needed to determine the appropriate deep learning model input signal length to recognize emotions. Using the entire signal was not necessarily optimal [22]. Emotions can dull and degenerate over time, and most emotion recognition studies using physiological signals selected signal lengths between 30 s to 5 min. Prior experiments determined optimal input signal length was 10 pulses. Since each single-pulse = 86, 10 pulse signals = 860 data points long, corresponding to approximately 10 s signals.
Normalization is often applied during data preprocessing for subsequent deep learning, transforming dataset numerical columns to a common scale without distorting range differences. In this case, PPG and EMG data signals were normalized to align amplitudes between the 40 participants. To preserve signal characteristics depending on emotions, we applied min-max normalization, i.e., normalization onto [0,1],
where xi is the original raw PPG and EMG signal, and
We obtained emotion information from the raw signals using normalized data to train the proposed emotion classification based on the deep learning model.
3.2 PPG and EMG Data Acquisition and Preprocessing
We used a BSSAE to identify emotions, hence the proposed model was unsupervised, in contrast to conventional CNNs or recurrent neural networks. Unsupervised feature learning deep learning models can extract features that better describe identified objects from unlabeled data. Autoencoders have attracted considerable research attention for physiological signal processing, particularly in signal reconstruction and feature extraction [23].
3.2.1 Essential Feature Extraction
Deep learning models can be divided into feature extraction and classification modules. This section describes feature extraction. We used an autoencoder for feature extraction. A major autoencoder advantage is dimensionality reduction. The proposed model identified features from the input data, reduced data dimensionality, and then switched the lower-dimensional data back to the beginning input multidimensional data. Reducing feature dimensionality also provided data compression.
We obtained PPG and EMG time series data from 40 people and used the short-period reshaped signals as inputs, as detailed above. Essential features were extracted using a stacked autoencoder with multiple hidden layers. We used additional layers to gradually reduce data dimension and find robust features, i.e., final features were obtained by progressive abstraction levels. Fig. 6 shows the process of reducing input data length.

Figure 6: Proposed bimodal structure for feature fusion
We reduced 860 data lengths from 860 to 100 dimensions using 4 hidden layers. The optimal number of hidden layers and data length were determined by the experiment. We also applied sparse autoencoder concepts to prevent overfitting and extract better features. Sparse autoencoders can solve back-propagation vanishing gradient problems through weight decay and inactive.
We constructed our loss function by penalizing hidden layer activations such that only a few nodes were encouraged to activate when the sample was fed into the network. There are two mechanisms to construct the sparsity penalty: L1 regularization and KL divergence. We decided to use L1 regularization for the sparse autoencoder,
where
is the usual mean square error, but we added a regularization term to the cost function to prevent overfitting coefficients and prevent weights from being too large during learning, and λ is a constant similar to the learning rate, and regularization is lost as λ → 0.
We used the rectified linear unit (ReLU) activation function for each hidden layer, PPG and EMG data were trained in parallel for 500 epochs, data size was set to equal, and batch size = 1000.
To enhance recognition performance, we adopted a bimodal structure to extract shared PPG and EMG representations. In contrast to conventional approaches, where concatenated feature vectors from different modalities are fed into the CNN, we trained individual CNNs for different modalities. Single modal pre-training avoids inter-modality correlations, which can provide better representation for high-level features. However, bimodal structures can extract high-level features by identifying correlations between different data [24,25]. Finally, we used unsupervised back-propagation to fine-tune autoencoder weights and biases.
Fig. 6 shows the proposed bimodal structure that trains the two sensor datasets simultaneously through separate models. Feature signals (100 data points) were extracted from input 860 datapoint raw signals using the stacked sparse autoencoder, and then each extracted feature was combined to find complementary features while sharing mutually robust representations. We then reconstructed the raw signals as closely as possible through decoding. Consequently, the proposed model could extract robust features for identifying emotions.
3.2.3 Confirmation of Reconstructed Signals
Reconstruction in signal processing usually means determining the original continuous signal from a sequence of equally-spaced samples and is one of the main autoencoder functions. We reconstructed compressed features using the BSSAE to test how closely they represented raw signals, i.e., if the reconstructed signals represented the raw signals well, we could be confident the extracted features were essential, suitable for training, and contained emotional information.
Fig. 7 shows signal reconstruction for single-pulse segmented signals. The reconstructed signal represents raw signal characteristics well. Fig. 8 shows the entire reconstructed signal, comprising 50000 data points. The signal waveform differs slightly from the single-pulse waveform because there are overlapping parts in the preprocessing process that separate based on peak values. We identified effective features through the reconstruction process and finally identified emotions in the classification module.
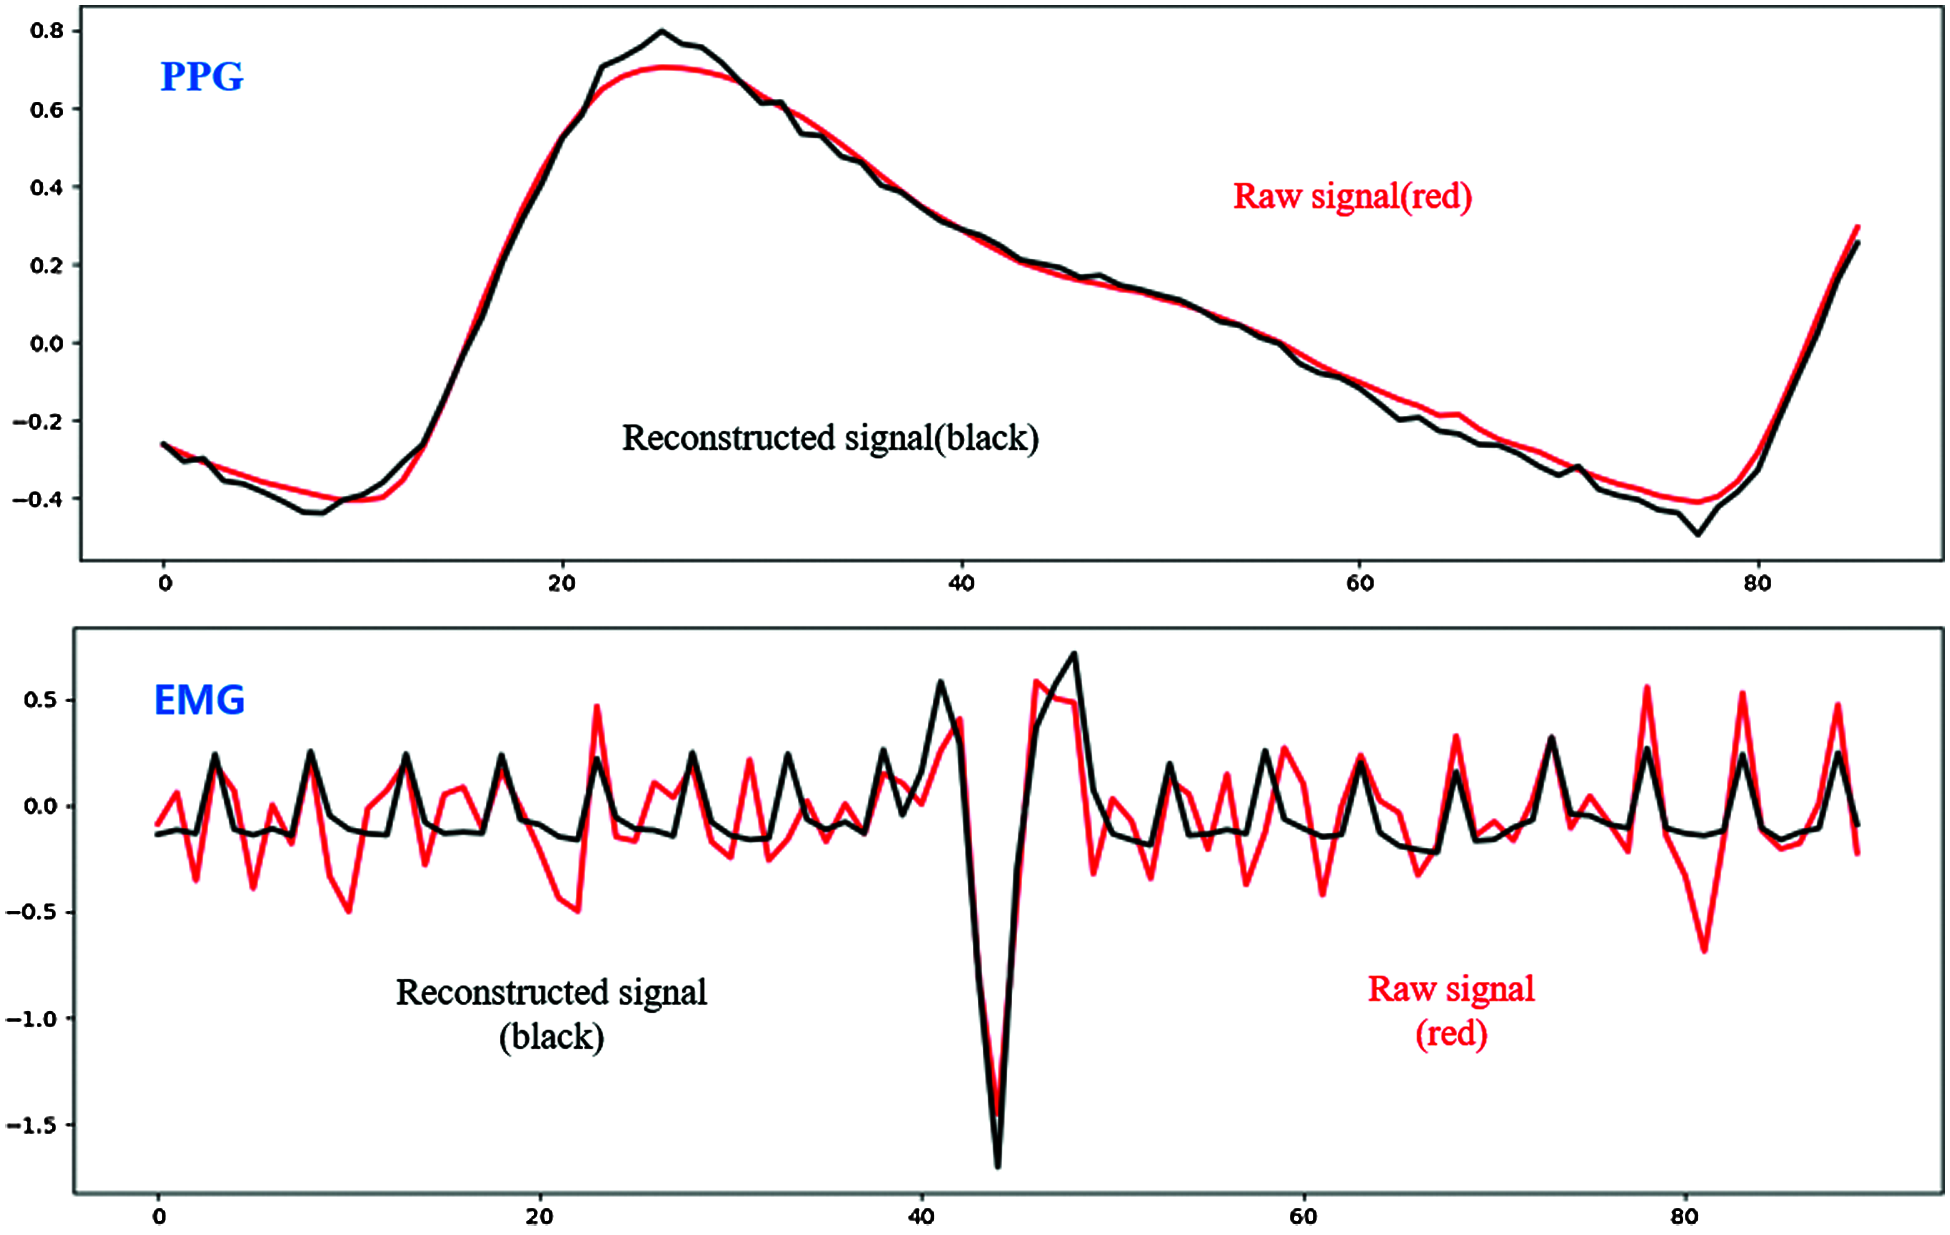
Figure 7: Reconstructed single-pulse signal

Figure 8: Reconstructed entire photoplethysmograph and electromyograph signal
3.3 Emotion Recognition Using BSSAE with Subdivided Emotion Model
We subdivided the two-dimensional emotion model for arousal-valence discussed in Section 2. Most emotion recognition studies use Russell’s model, i.e., binary classification into high and low. The criteria vary slightly from case to case, using either reference points obtained through self-assessment or commonly used reference values [26]. However, other studies showed that arousal-valence data were evenly distributed on the two-dimensional space [27,28] and arousal and valence could be divided into several stages depending on the user’s feelings. Therefore, we modified Russell’s model to classify emotions into more than just high and low.
Fig. 9 shows the proposed subdivided emotion model comprises 16 coordinate spaces. We expressed emotion level in 4 stages rather than the traditional binary classification, to reflect more complex emotional levels and difficult to define emotions in the resulting 16 spaces.

Figure 9: The proposed subdivided emotion model
We combined PPG and EMG compressed features (Section 3.2.2) as inputs for the classification module, which comprised a fully connected layer with 4 dense layers, Dense 1, 2, 3, and 4 with 50, 20, 10, and 4 nodes, respectively. The single output layer is classified into 4 arousals and 4 valence levels. Dense 1–3 used the ReLU activation function, and Dense 4 used softmax to be classified into 4 classes. We used categorical cross-entropy as the loss function for multiple classifications.
We used adaptive moment estimation (Adam) [29], a commonly used deep learning optimizer, to calculate adaptive learning rates for each parameter.
Fig. 10 shows the overall architecture for emotion recognition using BSSAE to classify arousal and valence. We set epoch = 30000 and batch size = 100. Section 4 discusses model performance.
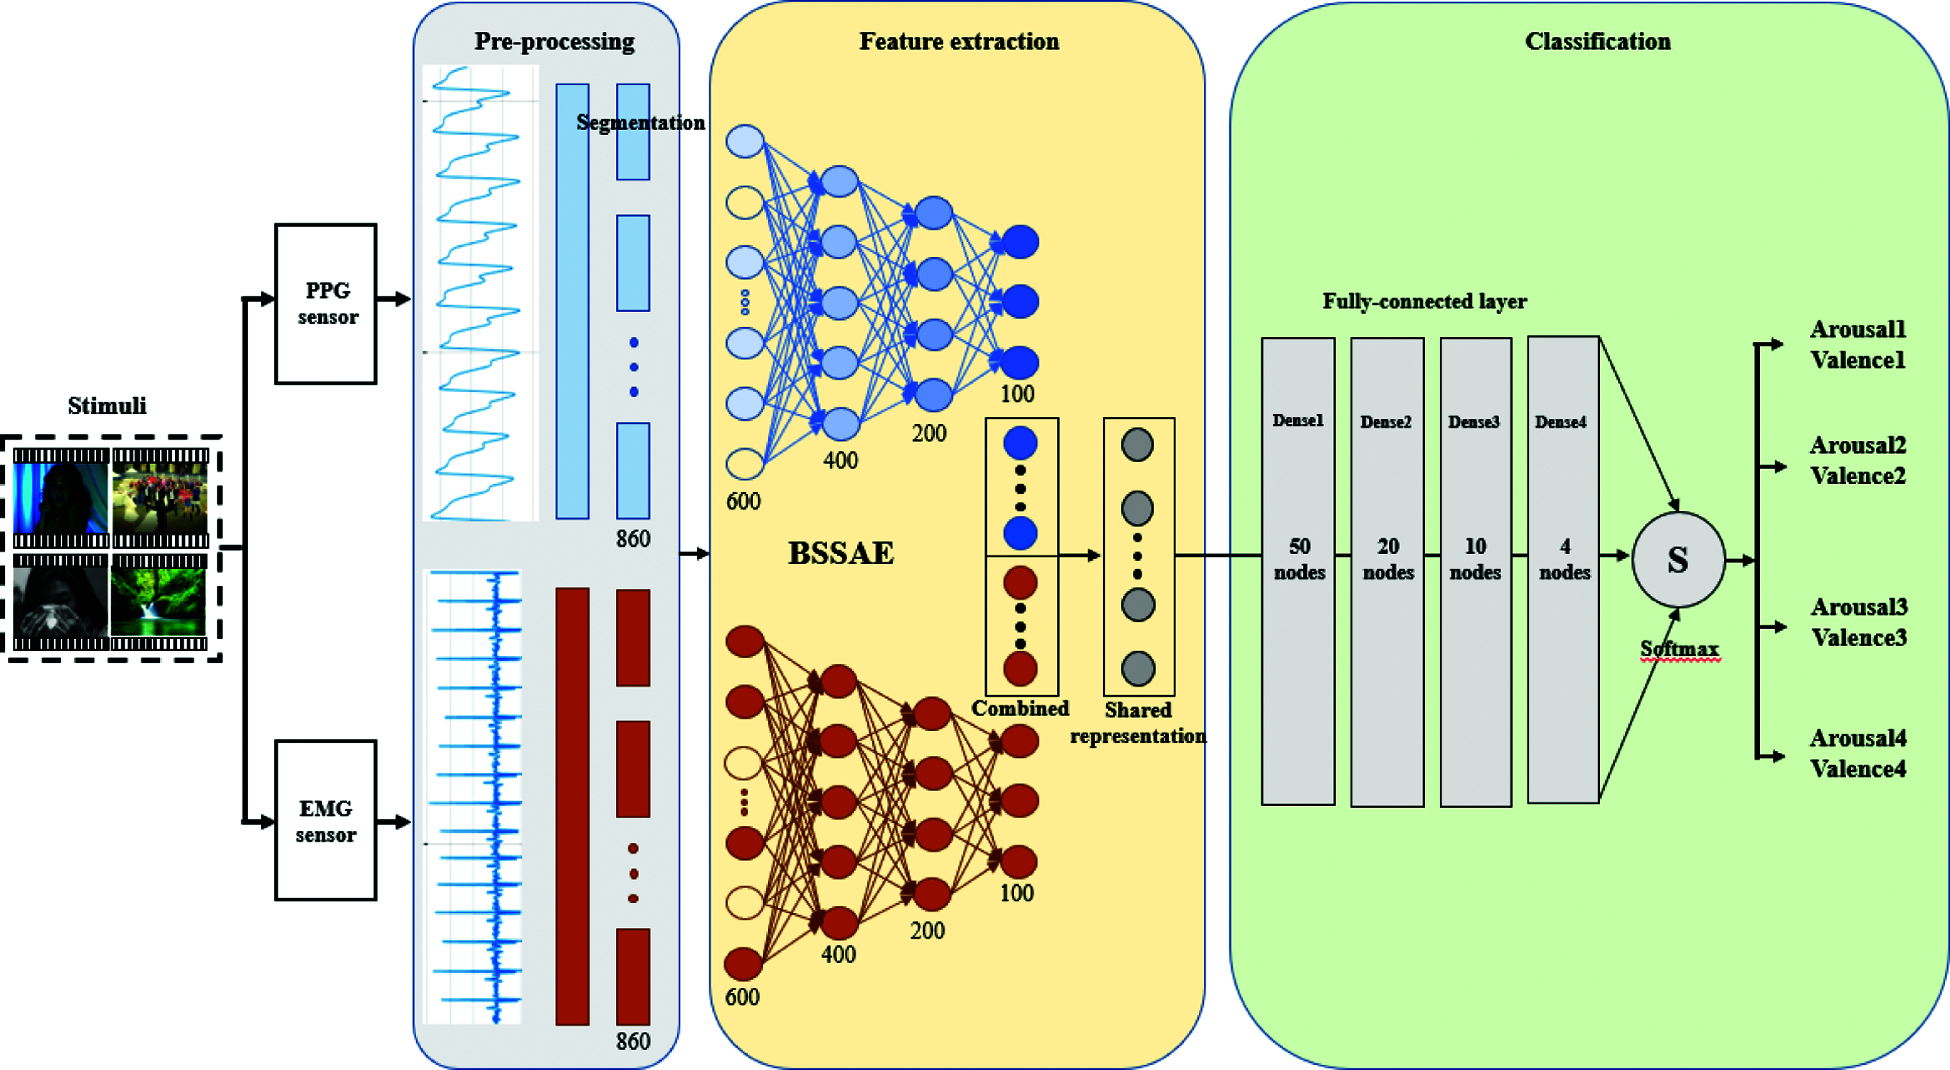
Figure 10: The overall architecture of our proposed model
4.1.1 Emotion Dataset Using PPG and EMG Signal
It is very important to determine what datasets to use for emotion research because results vary depending on data type and dataset characteristics. We needed a dataset that only included physiological signals rather than image-generated datasets. Many physiological studies use the Database for Emotion Analysis using Physiological Signals (DEAP) [30], Emotional Movie Database (EMDB) [31], and Multimodal Dataset for Decoding Affective Physiological Response (DECAF) [32]. All of these comprise data for binary classification with high-low emotional states. However, as discussed above, we extended the usual two-state Russell to recognize more detailed emotion by subdividing it into N classes rather than just high-low classification. Therefore, we created a new emotion recognition dataset using PPG and EMG signals.
First, needed to select suitable stimuli that could affect emotions. Emotions are more obvious when watching videos rather than still images or music. Therefore, we selected videos corresponding to the usual 4 quadrants from Russell’s emotion model. Our initial selection included 78 videos, from which we selected the most distinct 32 through self-assessment, regarding the self-assessment manikin (SAM) [33], which divides valence and arousal into various levels. The valence scale ranges from unhappy/sad to happy/joyful, and the arousal scale ranges from calm or bored to stimulated or excited. The experiment was conducted following the same concept.
Fig. 12 shows the self-assessment chart used by the experimenters. Column 1 in the table indicates the video number, but the experimenters do not know the video content in advance. After watching the video, experimenters checked their emotional states in the 4 arousal and valence categories (columns 2–5 and 5–9, respectively), and their overall emotional state (columns 10–15). Fig. 11 summarizes self-assessment data from the 40 participants.
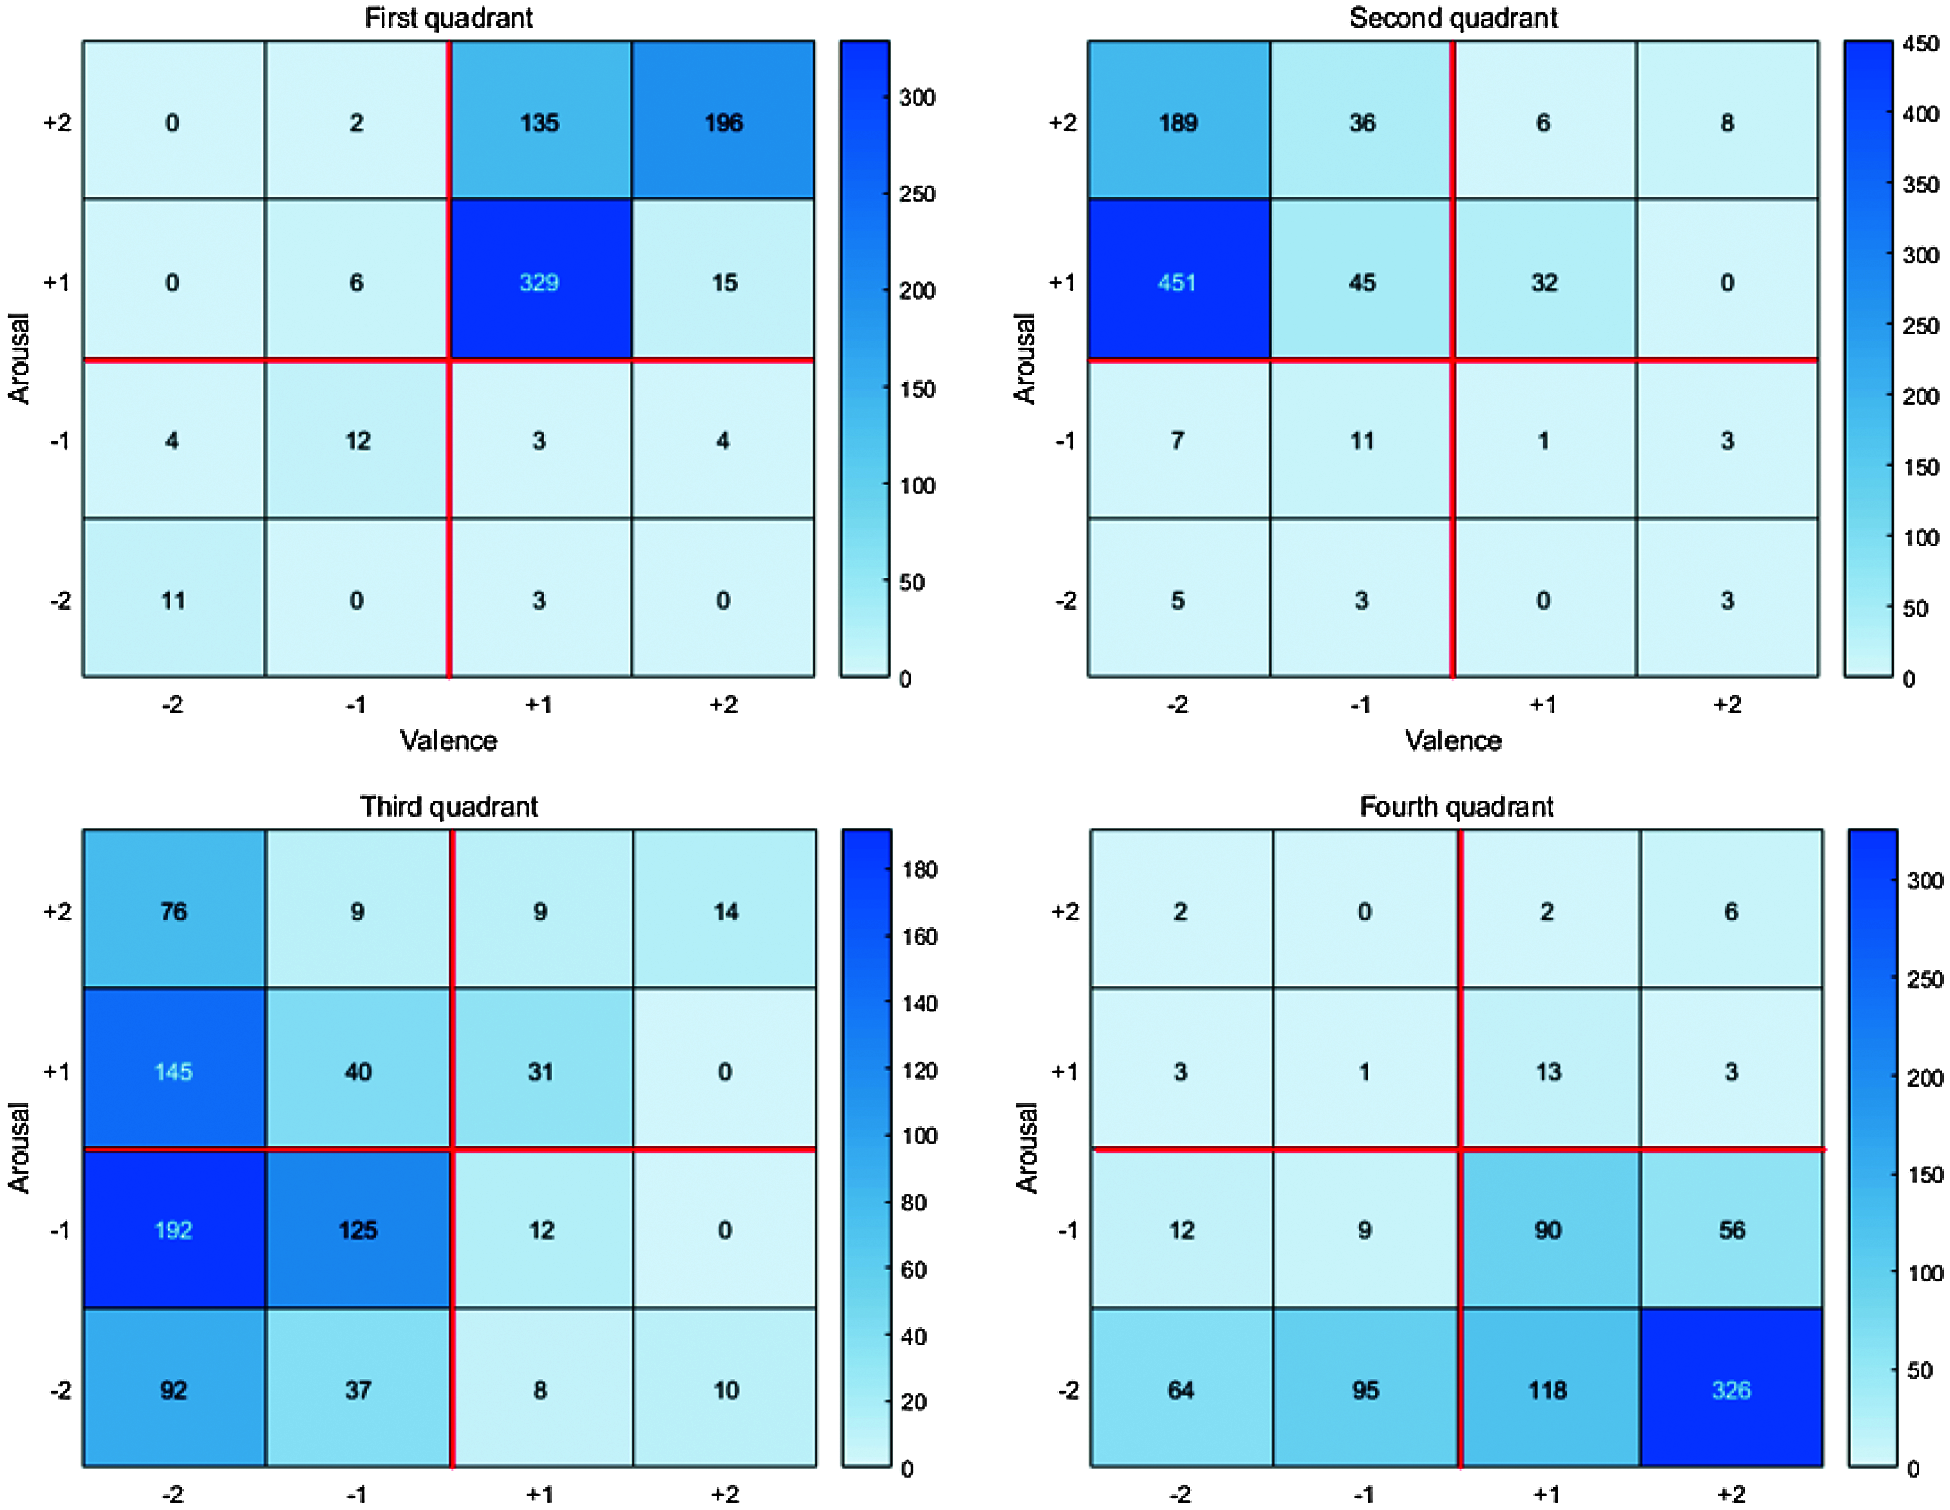
Figure 11: The heat map of the collected data
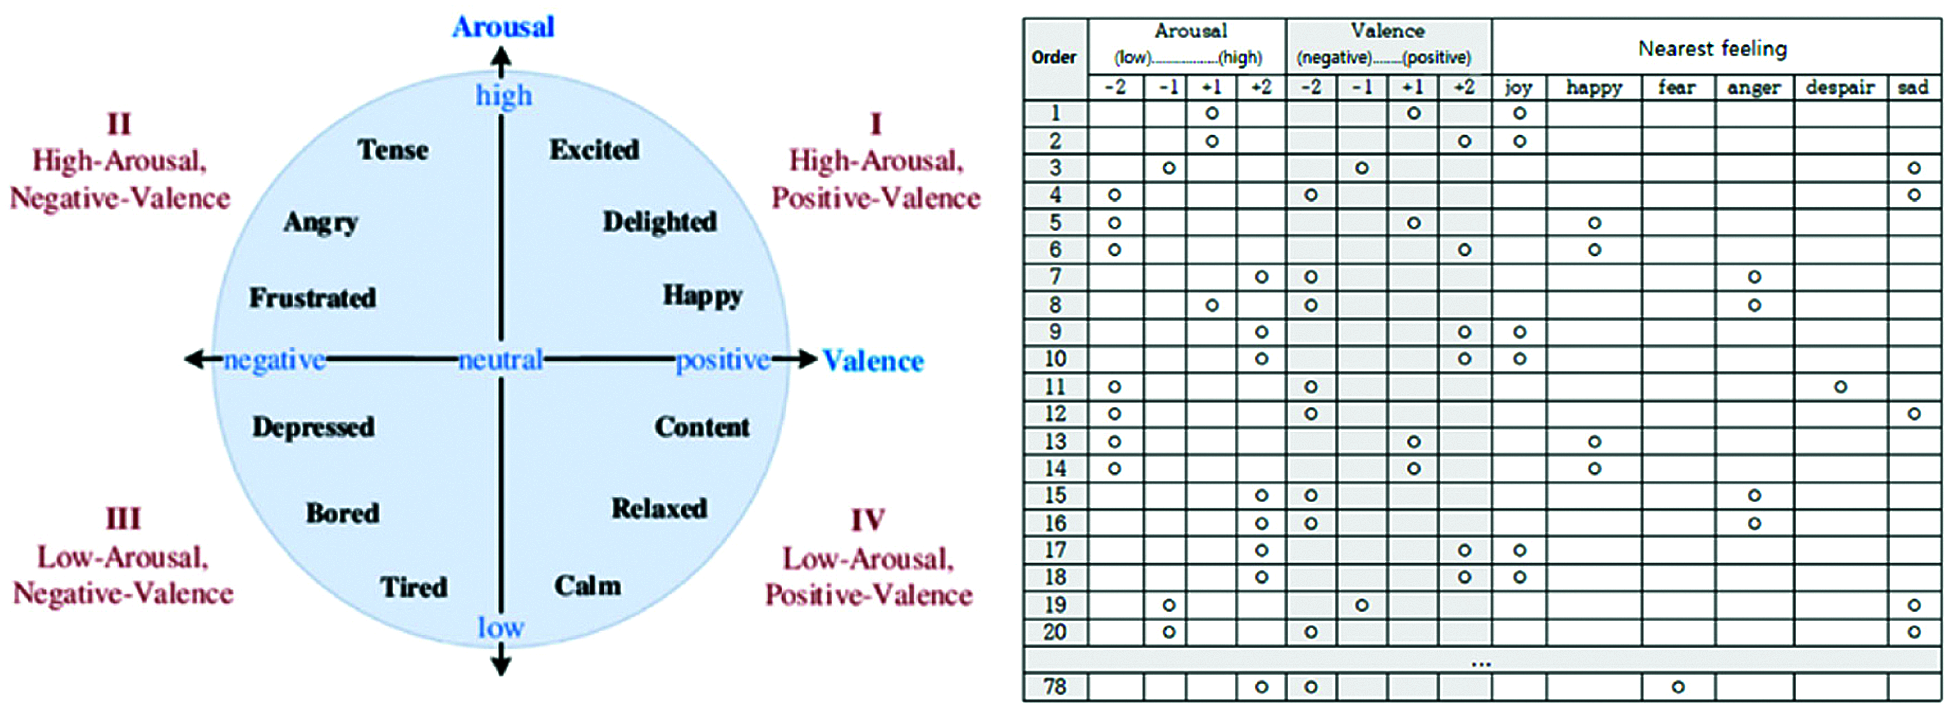
Figure 12: Our self-assessment questionnaire
The initial 78 videos comprised 18, 20, 20, and 20 within Russell’s model quadrants 1–4, respectively. The grid sum for each quadrant was the product participant’s videos in the quadrant, e.g., grid sum for quadrant 1 = 18 × 40 = 720. Hence grid sum = 720, 800, 800, 800 for quadrants 1−4, respectively. Subsequently, we selected 32 objective and reasonable videos that best matched the emotion corresponding to each quadrant and obtained PPG and EMG datasets from appropriate sensors for each, summarized in Tab. 1.
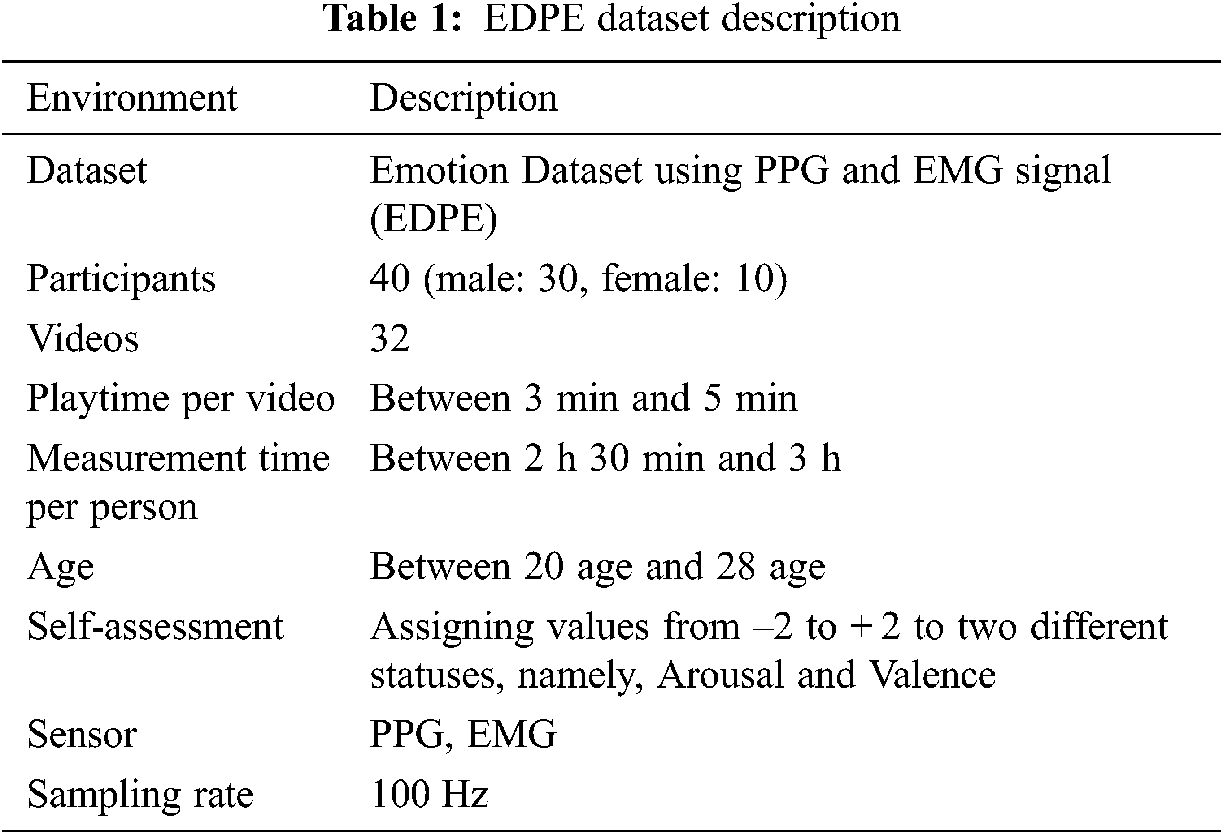
From the entire emotion dataset using photoplethysmograph and electromyography signals (EDPE), 80% of the samples were used for training and 20% for testing. Preprocessing was implemented in MATLAB and Tensorflow.
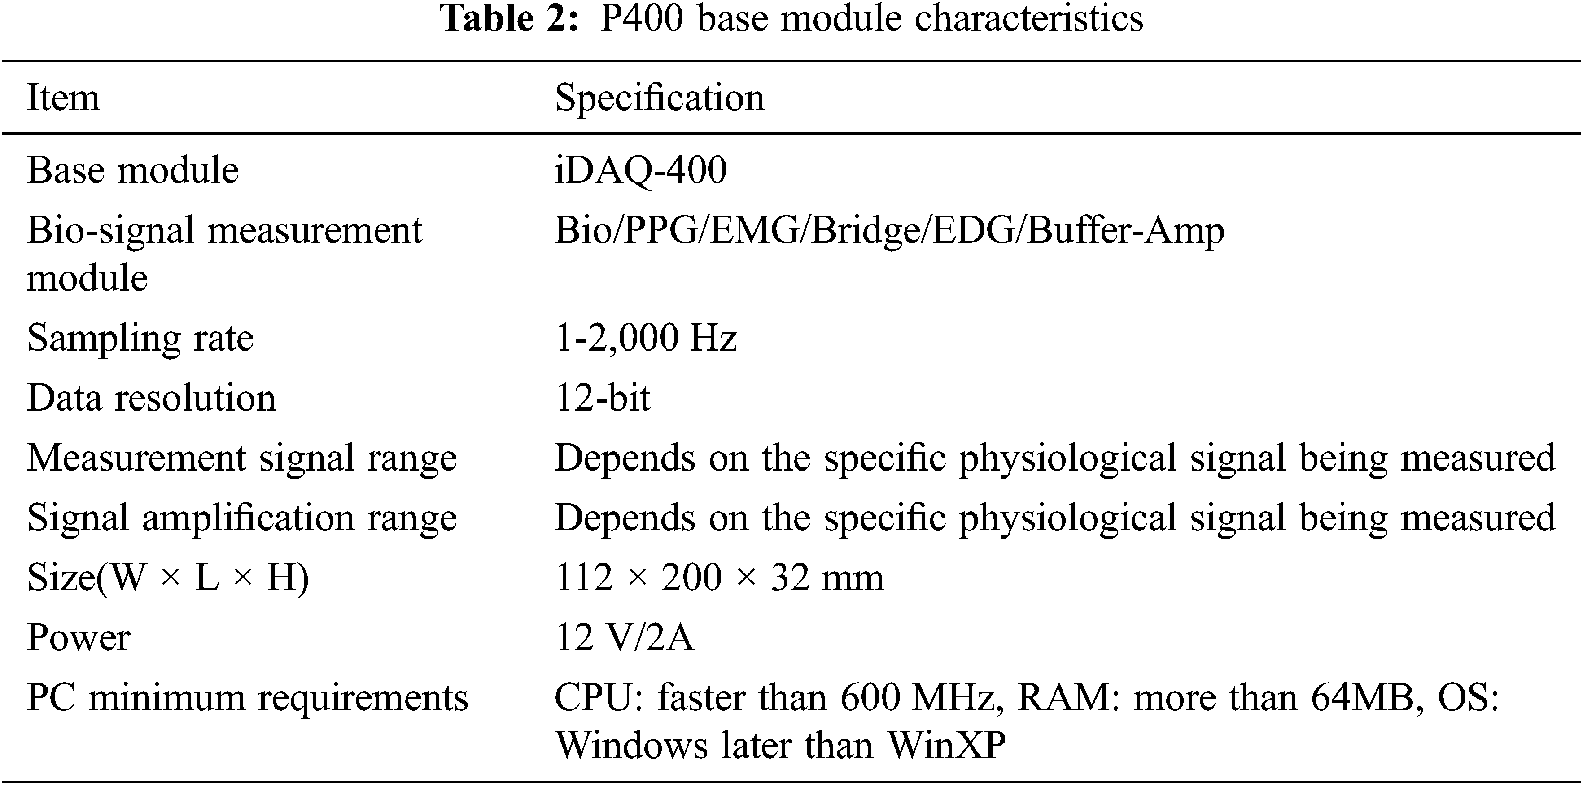
We used a physiologic recorder (P400, PhysioLab Inc.) to record PPG and EMG signals (see Tab. 2). The P400 provides up to six simultaneous measurement modules, which can be viewed in real-time and/or recorded and/or analyzed by sending them to a PC using iDAQ−400. We connected various physiological sensor outputs, including amps and the bio-Amp, to measure blood flow and physiological signals (i.e., PPG and EMG). Additional sensors could be connected to measure other biological signals as required.
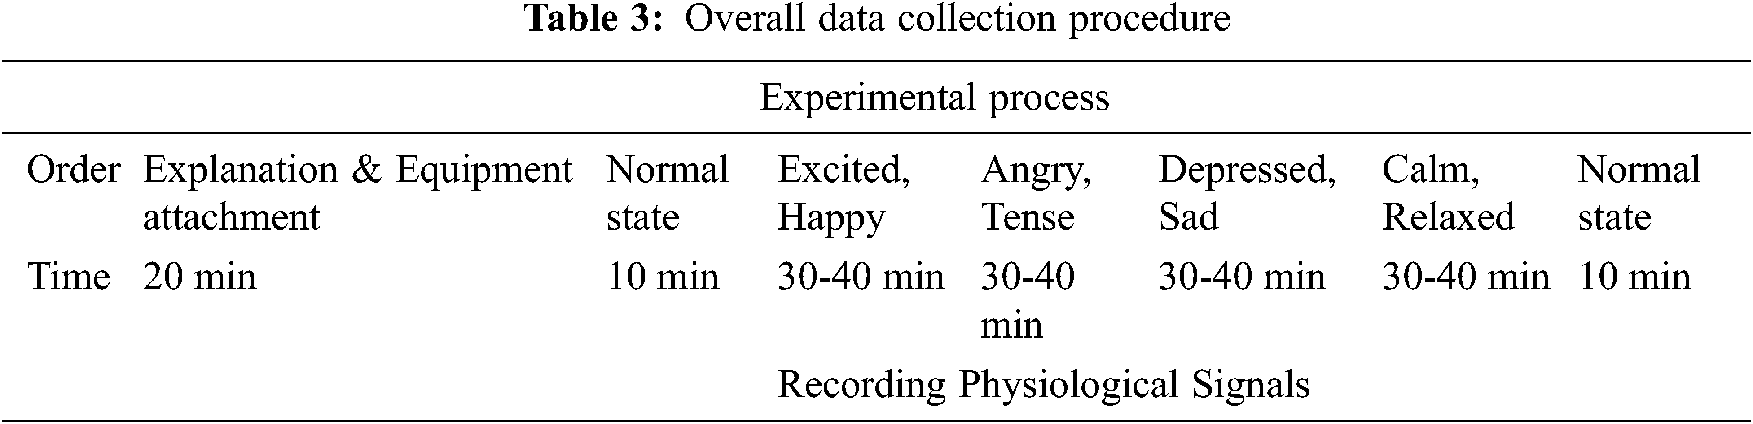
Tab. 3 shows the overall data collection procedure. The PPG device was worn on the left index finger to obtain pulse wave data from each participant. EMG data were obtained by attaching positive and negative electrodes to both trapeziuses with the ground connection attached to the inside of the arm, which had less muscle movement.
4.2.1 Classification Results According to the Proposed Model
Tab. 4 shows individual and combined modality (i.e., using PPG and EMG) performance. Bimodal deep learning can learn high-level shared representations between two modalities, whereas the proposed BSSAE structure uses explicitly shared and automatically extracted representations. Therefore, it is difficult to relate features from one modality to those from a different modality. However, regardless of feature comparisons, the proposed model achieves approximately 4% and 15% improved performance compared with PPG and EMG only approaches.
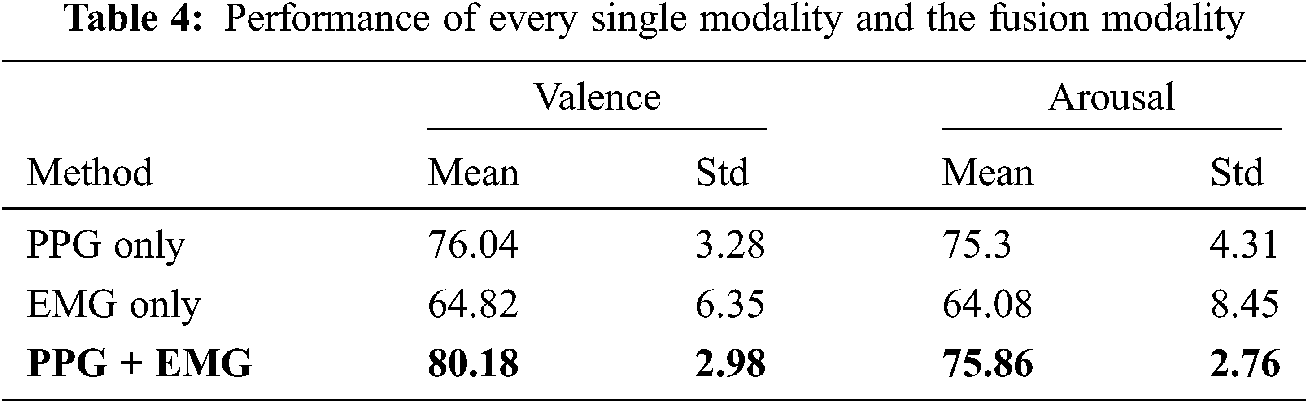
Fig. 13 shows accuracy for pulse length, i.e., the number of single-pulse signals included in the input.

Figure 13: Accuracy according to the pulse length
Accuracy was quite poor (26%) when including only 1 single-pulse signal, increasing sharply up to 10 included signals, and relatively constant beyond that. Therefore, we included 10 single-pulse signals in the input data to identify emotions with short-term data.
Fig. 14 shows valence and arousal accuracy decreased relatively monotonically as the number of participants increased, finally achieving 80.18% and 75.86% accuracy for valence and arousal, respectively.

Figure 14: Accuracy of valence and arousal according to the number of people
4.2.2 Algorithm Comparison of the State of Art Studies
Tab. 5 compares the proposed BSSAE method with current state-of-art approaches that classify emotions based on valence and arousal using physiological signals. The proposed model is more efficient than any other deep learning model, i.e., shortest recognition interval, and achieves superior or comparable accuracy.
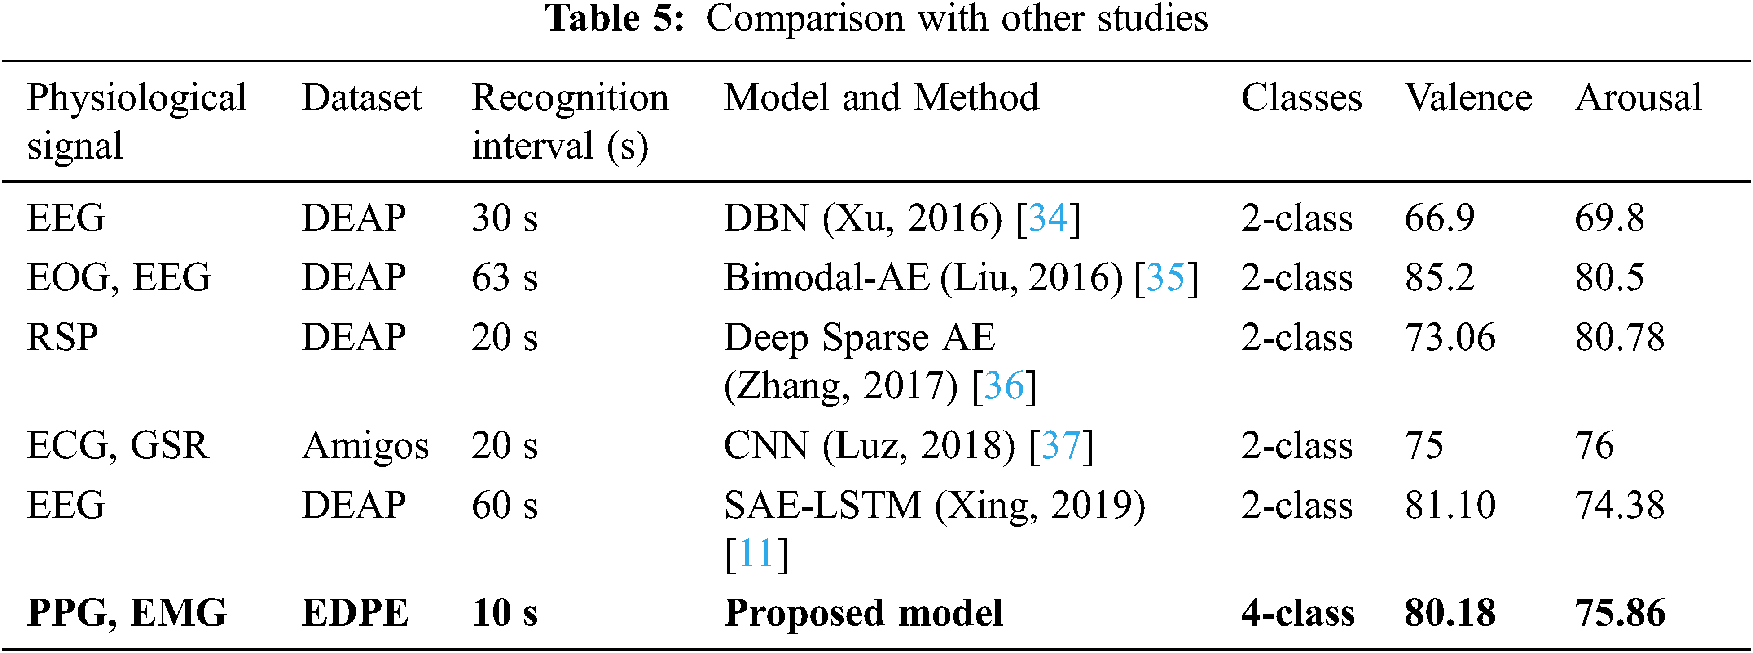
The proposed model classifies emotions into four classes, whereas all comparison approaches used two classes. Therefore, although increasing classes makes it more likely to achieve reduced accuracy is lower, we have achieved comparable or superior results with other studies. We also classify emotions with shorter data periods, which lends itself to practical research. Accordingly, the proposed model outperformed current state-of-the-art methods in terms of classification accuracy.
This paper proposed an emotion recognition model using PPG and EMG signals to recognize emotions with a short recognition period. Signal preprocessing segmented the original signal into 10 single-pulses for input to the proposed BSSAE model. The BSSAE bimodal framework extracted shared PPG and EMG signal features. We confirmed that modality fusion, i.e., combining PPG and EMG with bimodal deep learning, significantly enhanced emotion recognition accuracy compared with single modality approaches.
We plan to apply different models such as LSTM and GRU, considering that physiological signals are time-series data, which allows us to check whether previous emotions affect current emotions. Furthermore, we intend to conduct a wide range of research on user status estimation and emotion recognition.
Funding Statement: This research was supported by the National Research Foundation of Korea (NRF) funded by the Ministry of Science and ICT (NRF-2019R1A2C1089742).
Conflicts of Interest: The authors declare no conflict of interest.
1. R. Cowie, E. Douglas-Cowie, N. Tsapatsoulis, G. Votsis, S. Kollias et al., “Emotion recognition in human-computer interaction,” IEEE Signal Processing Magazine, vol. 18, no. 1, pp. 32–80, 2001. [Google Scholar]
2. T. Vogt and E. Andr, “Improving automatic emotion recognition from speech via gender differentiation,” in Proc. the Fifth Int. Conf. on Language Resources and Evaluation (LREC’06Genoa, Italy, pp. 1123–1126, 2006. [Google Scholar]
3. A. Mill, J. Allik, A. Realo and R. Valk, “Age-related differences in emotion recognition ability: A cross-sectional study,” Emotion, vol. 9, no. 5, pp. 619–630, 2009. [Google Scholar]
4. M. Ali, A. H. Mosa, F. A. Machot and K. Kyamakya, “Emotion recognition involving physiological and speech signals: a comprehensive review,” in Recent Advances in Nonlinear Dynamics and Synchronization, Switzerland: Springer Nature, pp. 287–302, 2018. [Google Scholar]
5. H. Sim, W. H. Lee and J. Y. Kim, “A study on emotion classification utilizing bio-signal (PPG, GSR, RESP),” Advanced Science and Technology Letters, vol. 87, pp. 73–77, 2015. [Google Scholar]
6. O. Alzoubi, S. K. D’Mello and R. A. Calvo, “Detecting naturalistic expressions of nonbasic affect using physiological signals,” IEEE Transactions on Affective Computing, vol. 3, no. 3, pp. 298–310, 2012. [Google Scholar]
7. J. Chen, B. Hu, P. Moore, X. Zhang and X. Ma, “Electroencephalogram-based emotion assessment system using ontology and data mining techniques,” Applied Soft Computing, vol. 30, pp. 663–674, 2015. [Google Scholar]
8. L. Shu, J. Xie, M. Yang, Z. Li, Z. Li et al., “A review of emotion recognition using physiological signals,” Sensors, vol. 18, no. 7, pp. 1–41, 2018. [Google Scholar]
9. G. Udovici, J. Derek, M. Russo and M. Sikora, “Wearable emotion recognition system based on GSR and PPG signals,” in Proc. the 2nd Int. Workshop on Multimedia for Personal Health and Health Care, pp. 53–59, 2017. [Google Scholar]
10. C. Li, C. Xu and Z. Feng, “Analysis of physiological for emotion recognition with the IRS model,” Neurocomputing, vol. 178, pp. 103–111, 2016. [Google Scholar]
11. Y. Lee, O. Kwon, H. Shin, J. Jo and Y. Lee, “Noise reduction of PPG signals using a particle filter for robust emotion recognition,” in Proc. IEEE Int. Conf. on Consumer Electronics-Berlin (ICCE-BerlinBerlin, Germany, pp. 202–205, 2011. [Google Scholar]
12. U. Lundberg, R. Kadefors, B. melin, G. Palmerud, P. Hassmen et al., “Psychophysiological stress and EMG activity of the trapezius muscle,” International Journal of Behavioral Medicine, vol. 1, no. 4, pp. 354–370, 1994. [Google Scholar]
13. G. Yoo, S. Seo, S. Hong and H. Kim, “Emotion extraction based on multi bio-signal using back-propagation neural network,” Multimedia Tools and Applications, vol. 77, pp. 4295–4937, 2018. [Google Scholar]
14. W. L. Zheng, J. Y. Zhu, Y. Peng and B. L. Lu, “EEG-Based emotion classification using deep belief networks,” in Proc. IEEE Int. Conf. on Multimedia and Expo (ICMEChengdu, China, pp. 1–6, 2014. [Google Scholar]
15. Mustaqeem and S. Kwon, “CLSTM: Deep feature-based speech emotion recognition using the hierarchical ConvLSTM network,” Mathematics, vol. 8, no. 12, pp. 1–19, 2020. [Google Scholar]
16. Mustaqeem and S. Kwon, “1D-Cnn: Speech emotion recognition system using a stacked network with dilated CNN features,” Computers, Materials & Continua, vol. 67, no.3, pp. 4039–4059, 2021. [Google Scholar]
17. T. Zhang, W. Zheng, Z. Cui, Y. Zong and Y. Li, “Spatial-temporal recurrent neural network for emotion recognition,” IEEE Transactions on Cybernetics, vol. 49, pp. 839–847, 2018. [Google Scholar]
18. W. L. Zheng and B. L. Lu, “Investigating critical frequency bands and channels for EEG-based emotion recognition with deep neural networks,” IEEE Transactions on Autonomous Mental Development, vol. 7, issue no. 3, pp. 162–175, 2015. [Google Scholar]
19. Y. J. Liu, M. Yu, G. Zhao, J. Song, Y. Ge et al., “Real-time movie-induced discrete emotion recognition from EEG signals,” IEEE Transactions on Affective Computing, vol. 9, pp. 550–562, 2017. [Google Scholar]
20. Mustaqeem and S. Kwon, “Att-net: Enhanced emotion recognition system using lightweight self-attention module,” Applied Soft Computing Journal, vol. 102, no. 4, pp. 1–11, 2021. [Google Scholar]
21. Q. Jing, H. Wang and L. Yang, “Study on fast-changing mixed-modulation recognition based on neural network algorithms,” KSII Transactions on Internet and Information Systems, vol. 14, no. 12, pp. 4664–4681, 2020. [Google Scholar]
22. J. C. Kim and K. Y. Chung, “Prediction model of user physical activity using data characteristics-based long short-term memory recurrent neural networks,” KSII Transactions on Internet & Information Systems, vol. 13, no. 4, pp. 2060–2077, 2019. [Google Scholar]
23. A. Gogna, A. Majumdar and R. Ward, “Semi-supervised stacked label consistent autoencoder for reconstruction and analysis of biomedical signals,” IEEE Transactions on Biomedical Engineering, vol. 64, no. 9, pp. 2196–2205, 2016. [Google Scholar]
24. J. Ngiam, A. Khosla, M. Kim, J. Nam, H. Lee et al., “Multimodal deep learning,” in Proc. the 28th International Conference on Machine Learning (ICML-11pp. 689–696, 2011. [Google Scholar]
25. R. Mu and X. Zeng, “Auxiliary stacked denoising autoencoder based collaborative filtering recommendation,” KSII Transactions on Internet and Information Systems, vol. 14, no. 6, pp. 2310–2332, 2020. [Google Scholar]
26. A. Saeed, S. Trajanovski, K. M. Van and J. Van-Erp, “Deep physiological arousal detection in a driving simulator using wearable sensors,” in Proc. IEEE Int. Conf. on Data Mining Workshops (ICDMWpp. 486–493, 2017. [Google Scholar]
27. W. L. Wheng, W. Liu, Y. Lu, B. Laiang and A. Cichocki, “Emotionmeter: A multimodal framework for recognizing human emotions,” IEEE Transactions on Cybernetics, vol. 49, no. 3, pp. 1110–1122, 2018. [Google Scholar]
28. M. Zhao, F. Adib and D. Katabi, “Emotion recognition using wireless signals,” in Proc. the 22nd Annual Int. Conf. on Mobile Computing and Networking, pp. 95–108, 2016. [Google Scholar]
29. D. P. Kingma and J. Ba, “Adam: a method for stochastic optimization,” arXiv preprint arXiv:1412.6980, 2014. [Google Scholar]
30. S. Koelstra, C. Muhl, M. Soleymani, J. S. Lee, A. Yazdani et al., “Deap: A database for emotion analysis; using physiological signals,” IEEE Transactions on Affective Computing, vol. 3, pp. 18–31, 2011. [Google Scholar]
31. S. Carvalho, J. Leite, S. Galdo-Avarez and O. F. Goncalves, “The emotional movie database (EMDBA self-report and psychophysiological study,” Applied Psychophysiology and Biofeedback, vol. 37, no. 4, pp. 279–294, 2012. [Google Scholar]
32. M. K. Abadi, R. Subramanian, S. M. Kia, P. Avesani, L. Patras et al., “DECAF: MEG-based multimodal database for decoding affective physiological responses,” IEEE Transactions on Affective Computing, vol. 6, pp. 209–222, 2015. [Google Scholar]
33. M. M. Bradley and P. J. Lang, “Measuring emotion: The self-assessment manikin and the semantic differential,” Journal of Behavior Therapy and Experimental Psychiatry, vol. 25, pp. 49–59, 1994. [Google Scholar]
34. H. Xu and K. N. Plataniotis, “EEG-Based affect states classification using deep belief networks,” in Proc. Digital Media Industry & Academic Forum (DMIAFpp. 148–153, 2016. [Google Scholar]
35. W. Liu, W. L. Zheng and B. L. Lu, “Emotion recognition using multimodal deep learning,” in Proc. Int. Conf. on Neural Information Processing, Kyoto, Japan, pp. 521–529, 2016. [Google Scholar]
36. Q. Zhang, X. Chen, Q. Zhan, T. Yang and S. Xia, “Respiration-based emotion recognition with deep learning,” Computers in Industry, vol. 92, pp. 84–90, 2017. [Google Scholar]
37. S. G. Luz, M. O. Mario, R. G. Gustavo, A. Enas and A. Njia, “Using deep convolutional neural network for emotion detection on a physiological signals dataset (AMIGOS),” IEEE Access, vol. 7, pp. 57–67, 2018. [Google Scholar]
 | This work is licensed under a Creative Commons Attribution 4.0 International License, which permits unrestricted use, distribution, and reproduction in any medium, provided the original work is properly cited. |