DOI:10.32604/iasc.2022.022037
| Intelligent Automation & Soft Computing DOI:10.32604/iasc.2022.022037 | |
| Article |
Classification of Parkinson Disease Based on Patient’s Voice Signal Using Machine Learning
1Riphah International University, Lahore, 54000, Pakistan
2Department of Computer Science, Taif University, Taif, KSA
3College of Technological Innovation, Zayed University, Abu Dhabi, UAE
*Corresponding Author: Sanaa Kaddoura. Email: Sanaa.kaddoura@zu.ac.ae
Received: 26 July 2021; Accepted: 13 September 2021
Abstract: Parkinson’s disease (PD) is a nervous system disorder first described as a neurological condition in 1817. It is one of the more prevalent diseases in the elderly, and Alzheimer’s is the second most common neurodegenerative illness. It impacts the patient’s movement. Symptoms start gradually with tremors, stiffness in movement, and speech and voice disorders. Researches proved that 89% of patients with Parkinson’s has speech disorder including uncertain articulation, hoarse and breathy voice and monotone pitch. The cause behind this voice change is the reduction of dopamine due to damage of neurons in the substantia nigra responsible for dopamine production. In this work, Parkinson’s disease is classified with the help of human voice signals. Six different machine learning (ML) algorithms are used in the classification: Stochastic Gradient Descent (SGD) Classifier, Extreme Gradient Boosting (XGB) Classifier, Logistic Regression Classifier, Random Forest Classifier, K-Nearest Neighbour (KNN) Classifier, and Decision Tree (DT) Classifier. This research aims to classify Parkinson’s disease using human voice signals and extract essential features to reduce the complexity of the dataset. Then, human voice signals are analyzed to check the voice intensity and spectrum for PD patients. Then, machine learning classifiers are applied to classify the PD patients based on the extracted features. The results show that SGD-Classifier has 91% accuracy, XGB-Classifier has 95% accuracy, Logistic Regression has 91% accuracy, Random Forest shows 97% accuracy, KNN shows 95% accuracy, and Decision Tree has 95% accuracy. Hence, Random Forest has the highest accuracy. The disease can be studied more by looking for more characteristics of PD patients to enhance its proper use in the medical field.
Keywords: SGD-classifier; XGB-classifier; logistic regression; random forest; KNN-classifier; parkinson disease; decision tree classifier
Substania nigra is an essential part of the brain which is considered the direct cause of Parkinson’s disease. Substania nigra releases dopamine that acts as a messenger between portions of the nervous system and the brain to coordinate the body’s actions. The amount of dopamine in the brain is lowered if these nerve cells die. This indicates that the brain region that controls movement is not working as well as it should, resulting in slow and irregular movements.
Nerve cell death is a gradual process. When roughly 80% of the nerve cells in the substantia nigra have been destroyed, the symptoms of Parkinson’s disease begin to appear. Parkinson’s disease affects the voices of men, affecting them in mating or perhaps in conversations. PD is only second to Alzheimer’s disease in neurological disorders [1]. Expansion is expected in the coming years, and appropriate testing and frameworks are needed along these lines to identify logical remedies. More studies should be done in this area since appropriate measures are essential for detecting and treating the disease [2]. The ideal characteristics of data sets are transferred as a commitment to models, and forecast results are generated. The expected exhibition of substantia nigra (see Fig. 1) is a group in the middle of the brain responsible for producing dopamine.
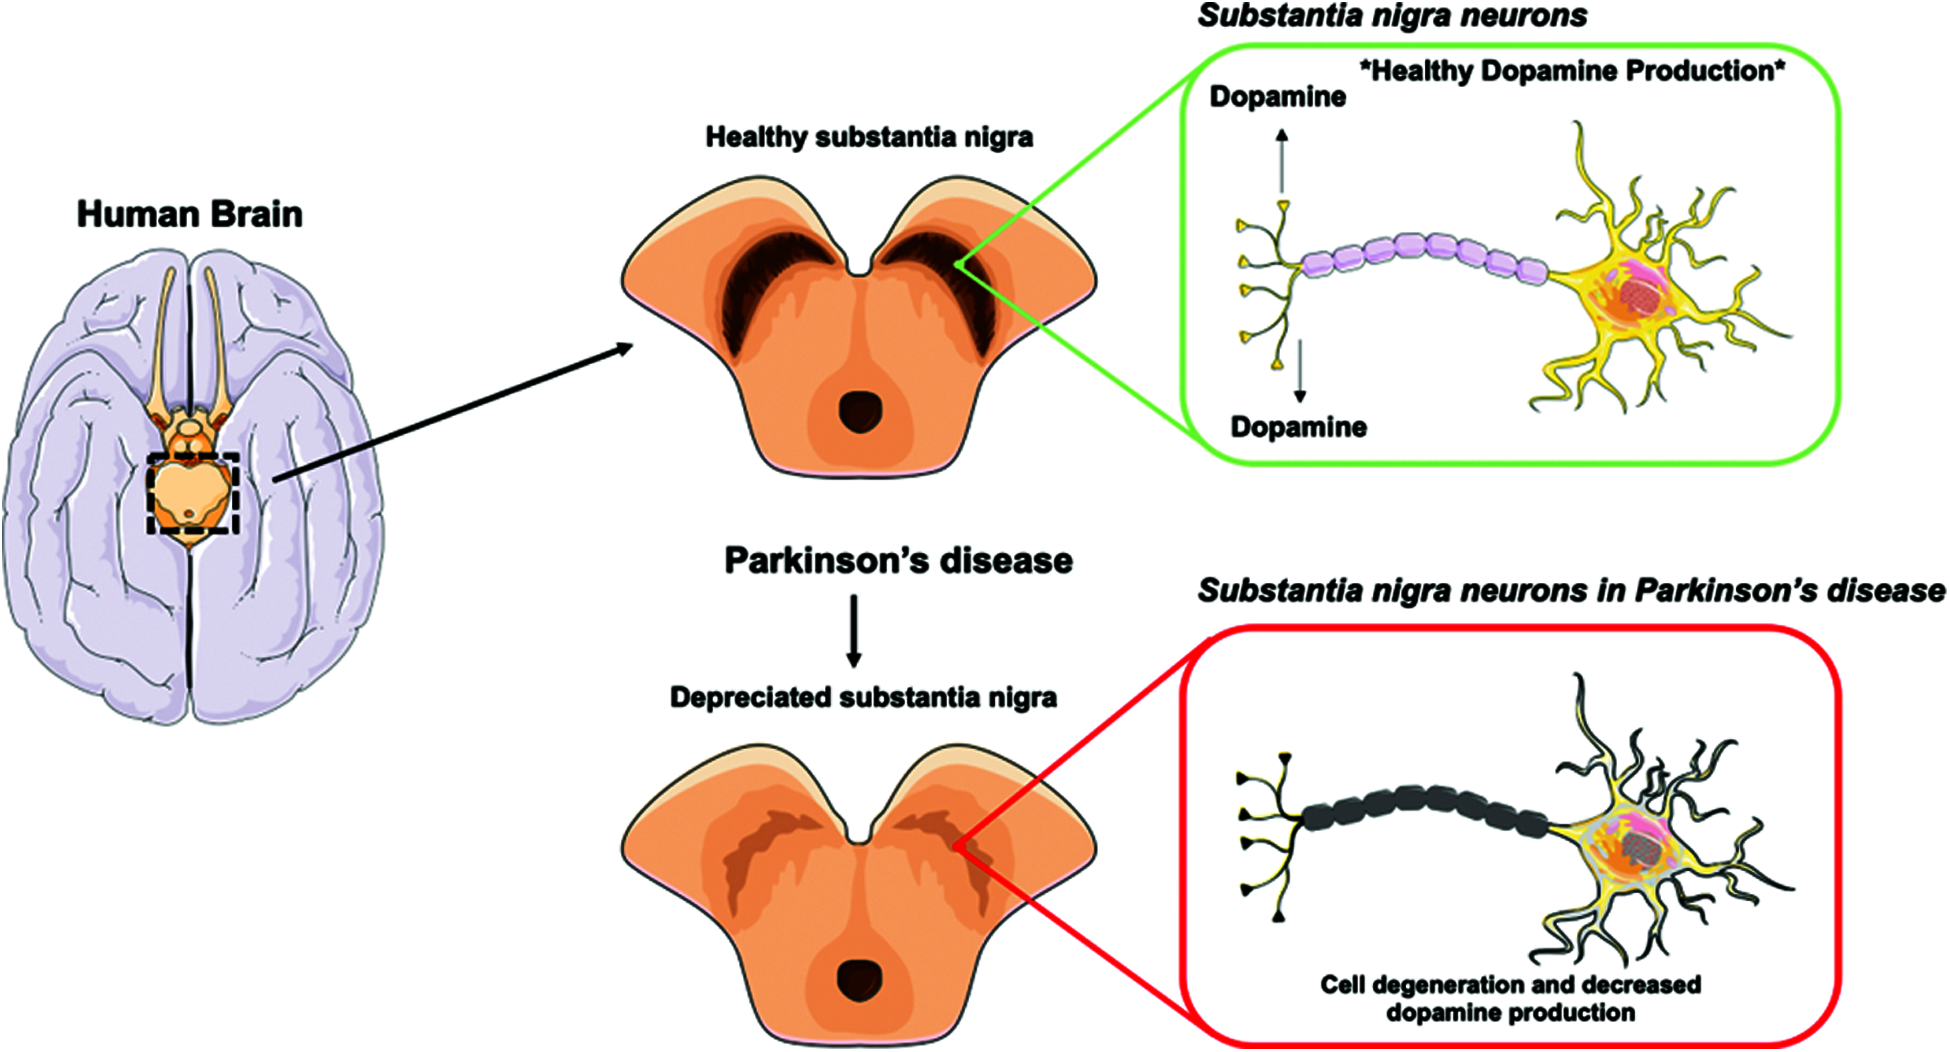
Figure 1: Substantia nigra neurons in Parkinson's disease
The six different machine learning models give better results than previous work in literature. The algorithms used in this work are:
▪ SGD-Classifier
▪ XGB-Classifier
▪ Logistic Regression Classifier
▪ Random Forest Classifier
▪ KNN-Classifier
▪ Decision Tree Classifier
Gradient Descent is the most used machine learning optimization approach. It’s a first-order optimization procedure. It means that while updating the parameters, it only takes into consideration the first derivative. The parameters are in the opposite direction of the objective function J(w) gradient with respect to the parameters on each iteration, where the gradient indicates the steepest ascent direction. The learning rate determines the amount of the step we take each iteration to reach the local minimum. As a result, we descend in the direction of the slope until we hit a local minimum [3,4]. XGBoost is part of a family of boosting algorithms that help weak learners improve their performance. Random guessing is marginally better than a slow learner. Boosting is a sequential process in which trees are grown one after the other, using information from a previously developed tree. This method slowly learns from the data in successive cycles and improves its forecast [5]. A random forest comprises a vast number of individual decision trees that work together as an ensemble.
Each tree in the random forest produces a class prediction, and the class with the most votes becomes the prediction of our model. The KNN is a non-parametric technique proposed by the Thomas cover used in assembly and relapse in the confirmation design. In both applications, the information consists of the nearest K setting forms in the component space. The yield depends on whether KNN is used for regulation or relapse. The component space is grouped by the majority of the votes, indicated by the nearest-distance-neighbor [5]. A Decision Tree is a non-parametric learning strategy used in characterization and regression. The aim is to develop a model that predicts objective variable points by introducing the essential criteria for the selection collected from the information covered [6].
2.1 Classification of Parkinson Disease
The project in [6] aims to classify PD patients by analyzing their gait results. The data used was derived from the database of Physio net Gait Analysis. The database includes data on 93 idiopathic PD patients and 73 stable control subjects. It consists of the subjects’ Vertical Ground Reaction Force as they walk for about two minutes. Each subject has 16 sensors. Eight sensors were placed on the bottom of each foot, which measures Newton’s force as a function of time. Some mathematical functions were used to improve data accuracy and decrease the necessary computing capacity. This reduced data in the range of [−1, 1] while maintaining the data singularity unchanged. The new data reduction was then used to create machine learning models using machine learning algorithms. The highest accuracy of KNN is 93.08%.
As compared to previous research, PD was established differently.MATLAB graphical user interface was used to incorporate the machine learning method in the application. Also, a new program called ParkDet 2.0 was developed. Then, to increase the accuracy of the classifier, different combinations of ML were applied using ParkDet. The goal is to enable clinician technicians to use the ParkDet software to diagnose PD patients and not force them to use advanced engineering systems such as MATLAB and automated detection methods.
Several variations of ML processes, such as PCA and factor analysis (FA), were introduced via the ParkDet software. Additionally, seven classifiers were established: Support Vector Machine (SVM), Boosting, KNN, Naive Bayes (NB), Decision Tree, Linear Discriminant Analysis (LDA), and Quadratic Discriminant Analysis (QDA) with 2–, 5– and 10-fold cross-validations and an additional blind examination. Since the classification accuracy hits 90.1%, the findings are promising [2].
2.2 Symptoms of Parkinson Disease
The neuropathological condition of PD or other types of Parkinsonism may result in Parkinson’s disease. About 90% of the cases are intermittent with no specific etiology for neuropathologic PD; a further 10% have a hereditary cause, and at least 11 separate lineages have been reported with six gene mutations. Genetic variants of PD in young-onset PD are observed. Medicines, sequelae to central nervous system inflammation, toxins, or vascular/metabolic conditions may be responsible for secondary forms of Parkinsonism [7–9]. This paper’s participants underwent baseline in-clinic assessments, including the Unified Parkinson’s Disease Rating Scale (UPDRS). They were provided smartphones with an Android operating system that contained a smartphone application to assess voice, posture, gait, finger tapping, and response time. Twenty participants performed an average of 2.7 tests per day (68.9% adherence) for the study duration (average of 34.4 days) in a home and community setting. The analyses of the five tasks differed between those with Parkinson’s disease and those without it. In discriminating participants with PD from controls, the mean sensitivity was 96.2% (standard deviation 2%), and mean specificity was 96.9% (standard deviation 1.9%).
2.3 Voice Frequencies of Parkinson Disease Affected Patients with Parkinson Disease
Some research focuses on the tonal level, i.e., the fundamental frequency (F0) variations produced by the laryngeal activity. The significant improvements in F0 phonation in subjects with sensorineural hearing loss (SNHL) and PD using power spectral analysis of F0 have been studied in [8–10]. For the two disorders, F0’s rhythm was distinct in frequency and amplitude. This research also revealed that the F0 analysis could become a valuable instrument for the two neurological disorders to be tested. By using the autocorrelation function algorithm, fundamental frequencies of voice signals were obtained. They were then transformed to a series of cents after linear interpolation and re-sampling to a 50 Hz scale [8–10]. The hypothesis states that the Parkinsonian dysprosody has often been described as a mere neuro-motor disturbance. To verify the hypothesis, both the comprehension and the production of pitch parameters in a group of Parkinsonian patients were tested. The influence of traditional anti-parkinsonian treatments, L-DOPA which is an amino acid precursor of dopamine and is the most effective and commonly used drug in the treatment of PD, was also studied to determine whether improved performance occur [11].
Deep learning is used in [12] to evaluate the patient’s voice data and divide it into “severe” or “not severe” classes. The two Unified Parkinson’s Disease Ranking Scale (UPDRS) scores are the assessment measures used in this analysis. On a scale of 0–108, the motor UPDRS tests the patient’s motor capacity, while total UPDRS offers a wider variety of scores from 0–1766. The 16 biomedical voice functions are the input dataset, and the output vector is the Motor UPDRS score. The classification accuracy achieved for train and test datasets is 83.367% and 81.6667%, respectively. Since they tested their model on the same set of UCI Parkinson’s Telemonitoring Voice Results, they contrasted their result with that of Nilashi et al. in forecasting the progression of Parkinson’s disease, and they used adaptive neuro-fuzzy interference system and support vector regression. Their work provided an average accuracy of 47.2 percent for the overall UPDRS ranking [7–12].
2.4 Causes of Parkinson Disease
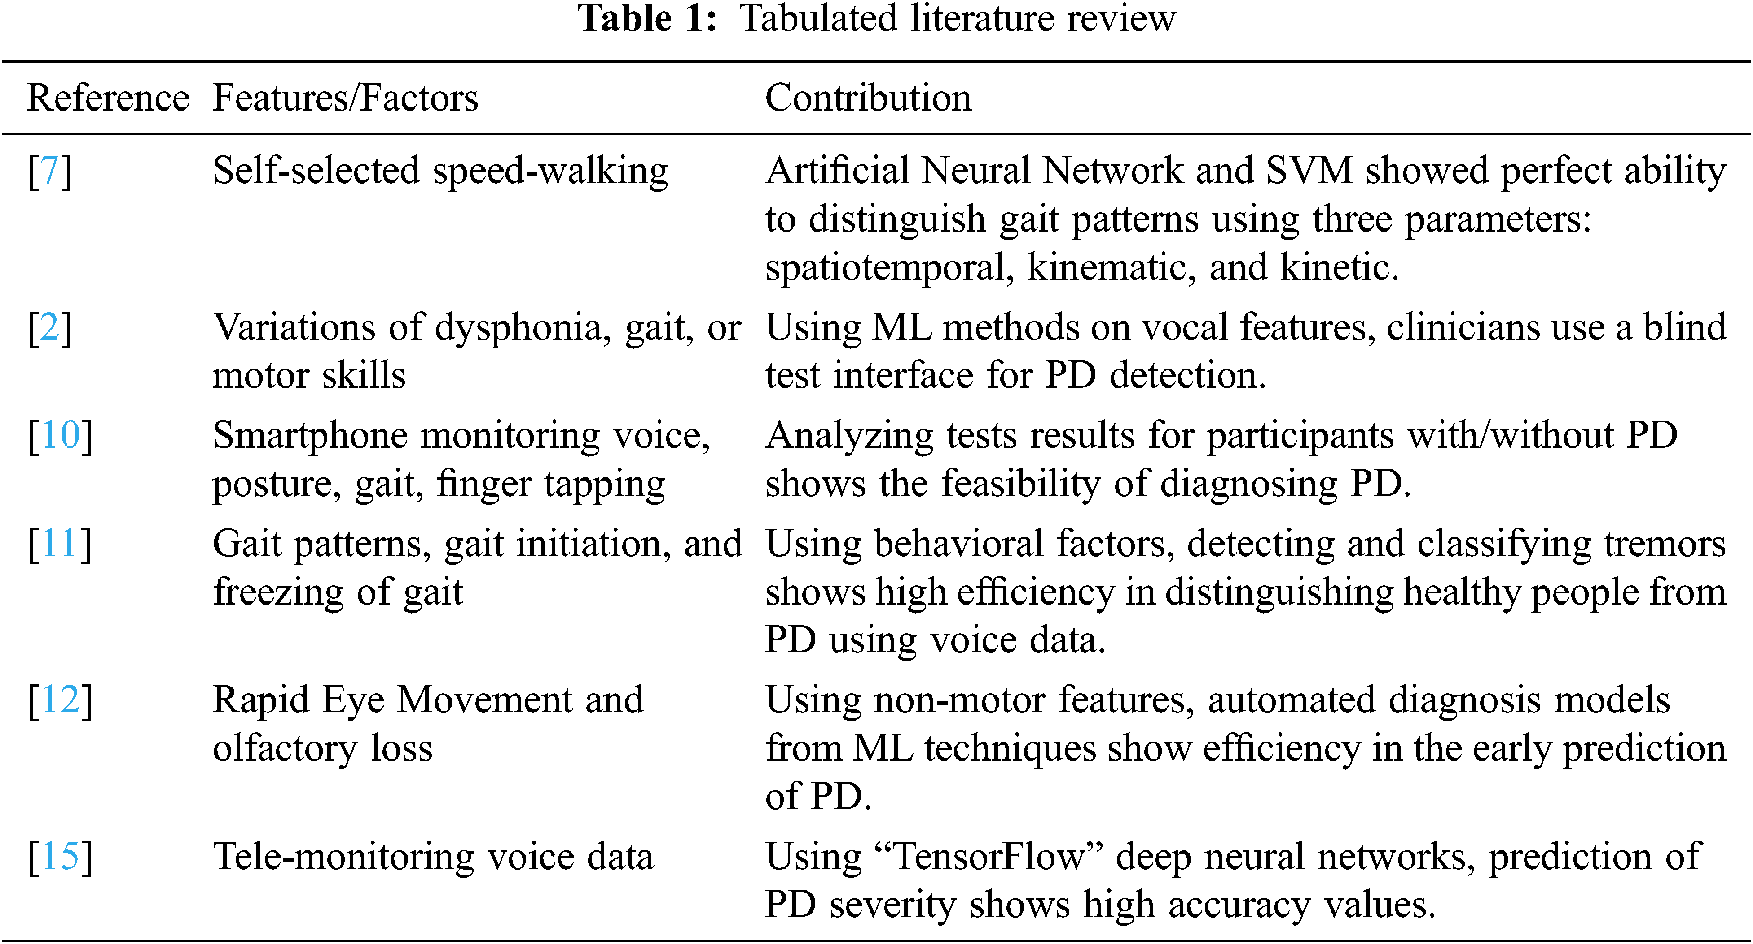
This research demonstrated that pesticides affect PD production. Priyadarshi et al. [13] conducted a meta-analysis to analyze multiple studies examining environmental risk factors to produce PD. Findings show a greater risk of PD for individuals living in rural areas using wells as their water source. However, the environmental hazards causing PD could not be identified. Indeed, as applied to rural and urban areas, the findings yielded an insignificant association between risk factors. Due to the differences between the results of different trials, improved data collection techniques tend to be required to understand better possible causes of PD [13,14]. Tab. 1 summarizes the literature review.
Previous research stated that Parkinson’s disease had been spread all over the world. Doctors use the most extensive equipment for physical diagnosis, which is a very time-consuming and non-accurate process. So, we will classify Parkinson’s disease using human voice signal frequencies and explore it in three phases, as shown in Fig. 2. Firstly, we are extracting some essential features to classify for understanding. Secondly, we apply data mining techniques to classify the healthy/affected patients based on some voice features to generate the results in graphs and tables, accuracy-score. Thirdly, we are going to make a comparison of all machine learning algorithms to find out the best accuracy result algorithm.
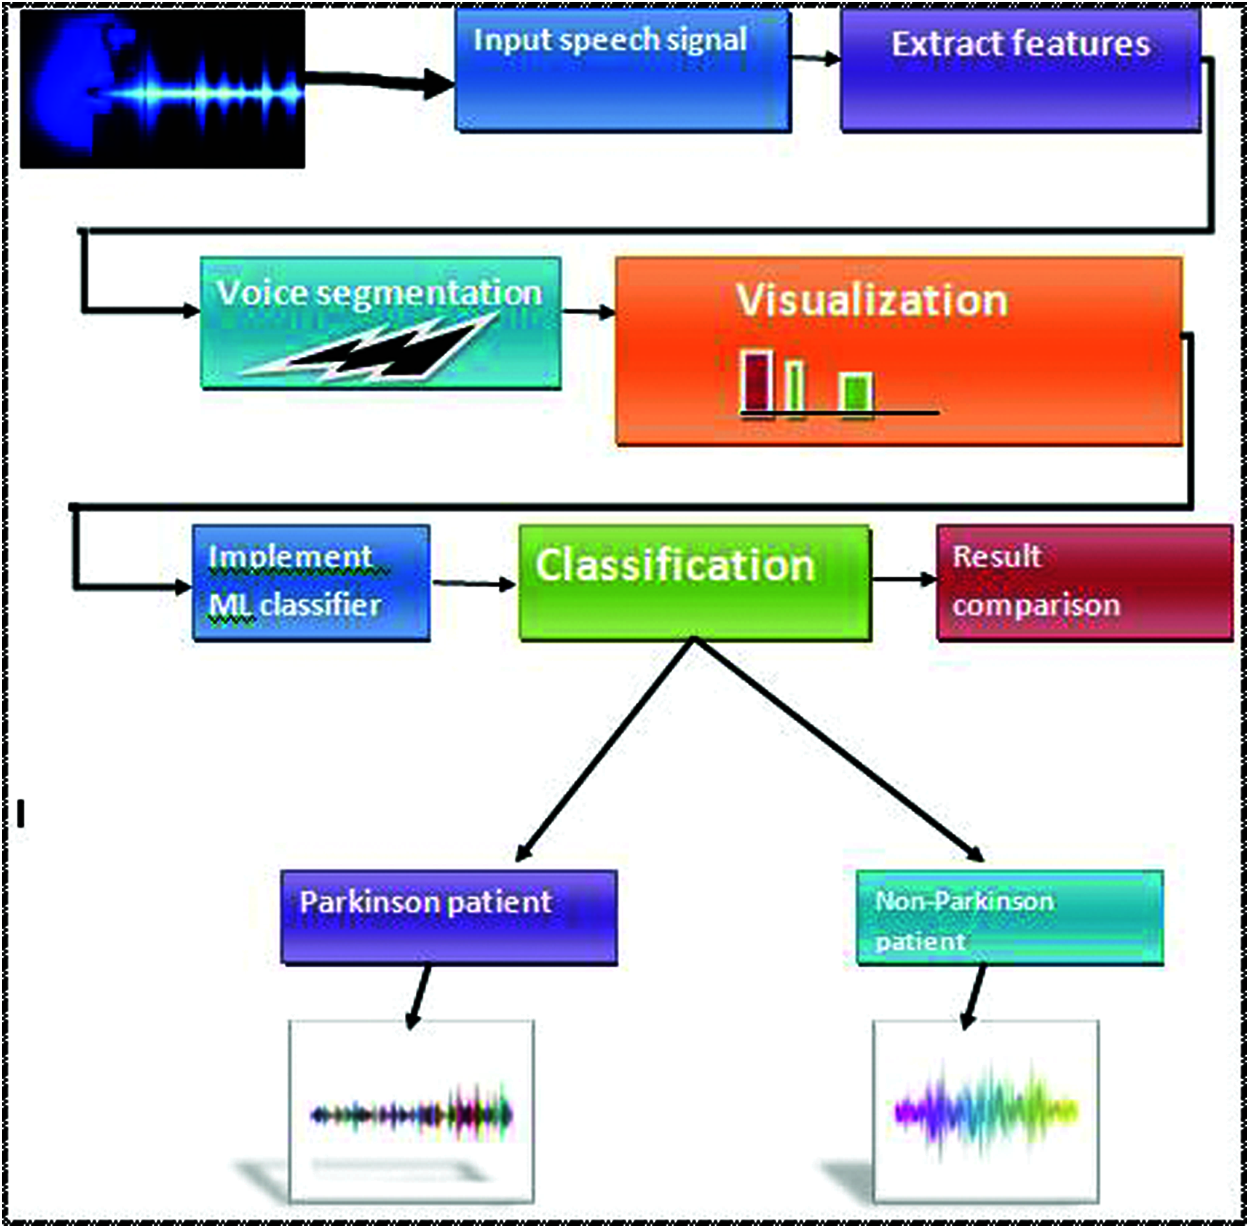
Figure 2: Proposed workflow
3.1 Place of Work and Facility
Our research is based on qualitative analysis rather than quantitative. We will use the qualitative data analysis online tool. All research will be done at the university and in our personal space.
Feature extraction increases the accuracy of learned models by extracting features from input data. This phase reduces the dimensionality of data by removing the redundant records. Of course, it enhances the classification speed. Feature extraction helps get the best feature from those big data sets by selecting and combining variables into features, thus, effectively reducing the amount of data. These features are easy to process but still able to describe the actual data set with accuracy and originality.
Feature selection is an essential approach for reducing the dimension of high-dimensional data. In recent years, many feature selection algorithms have been proposed. However, most of them only exploit information from the data space. They often neglect helpful information contained in the feature space and typically do not exploit information about the underlying geometry of the data. To overcome these problems, we introduce new unsupervised feature selection methods based on feature selection.
Statistical tests can select those features with the most robust relationship with the output variable. The scikit-learn library provides the SelectKBest class for this purpose.
In this phase, we classify the voice in segments and find out the relationship of features so used in which seven extract features for classification of the human voice. Based on these seven features, we identify the ranges of frequencies and compare them with patients’ health status.
According to the voice segments classes, we classify frequencies with visualization. Data visualization helps to analyze the measurement reports. Visualization is a method for transmitting a message by generating pictures or animations. Visualization is any technique for creating images, diagram plots, charts, and animations. In these analyses, we analyzed the human voice frequencies into the graph box plot and tabular form and compared these all frequencies one by one with patients’ health status and identified the ranges of all frequencies, and measured it with health status.
The voice signal dataset [15] display some rows and columns of data in Fig. 3, showing head (5) of the dataset, which displayed all attributes of the data and values in float. This dataset comprises a range of biomedical tone of voice estimations from 31 individuals, of which 23 have PD. Every section in the table is a specific voice measure, and each line compares to one of the voice chronicles from these people (“name” segment). The “status” segment is set to 0 for non-patient and 1 for PD [16].
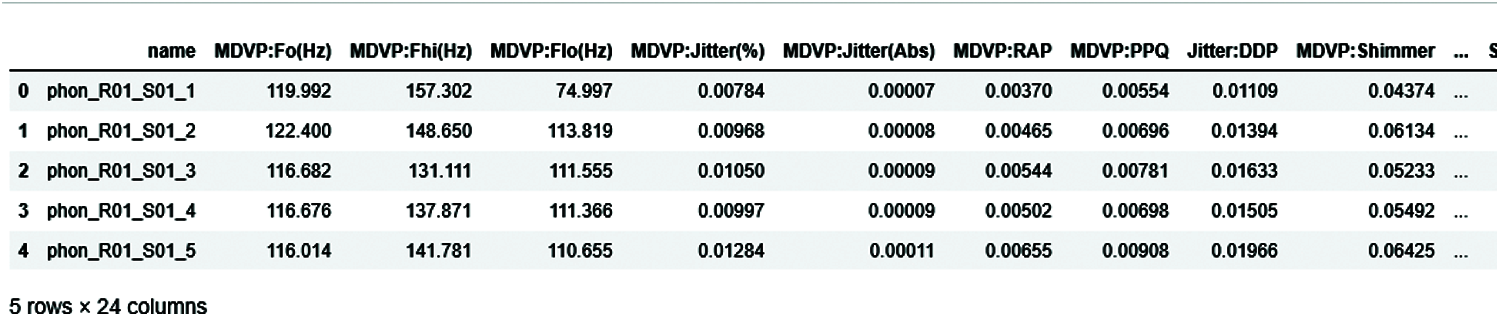
Figure 3: Head of 5 elements of the dataset
4.2 Average Local Fundemental Frequencies (fo)
In this condition, most people with Parkinson’s disease will change vocabulary, voice, and swallowing. The exact effects of Parkinson’s disease that appear in the human body’s muscles, tremor, stiffness, slow motion, and slow speech, can occur in the muscles used to speak and swallow. In the medical treatment of reading the human voice with a machine those machines, read in different frequencies in which one of the most critical frequencies of fundamental vocal frequencies.
Fig. 4 shows the fundamental vocal frequencies (Fo) of the human voice. The ranges of frequencies 100–250 define the human voice. This range increases when the person is affected with PD. Fig. 5 shows the maximum vocal fundamental frequency (Fhi(Hz)). The ranges are higher than the frequencies shown in Fig. 4 because these frequencies measure the vocal voice length. Fig. 6 shows the minimum vocal fundamental frequency (Flo). It visualizes the ranges of frequencies signal of human voices.
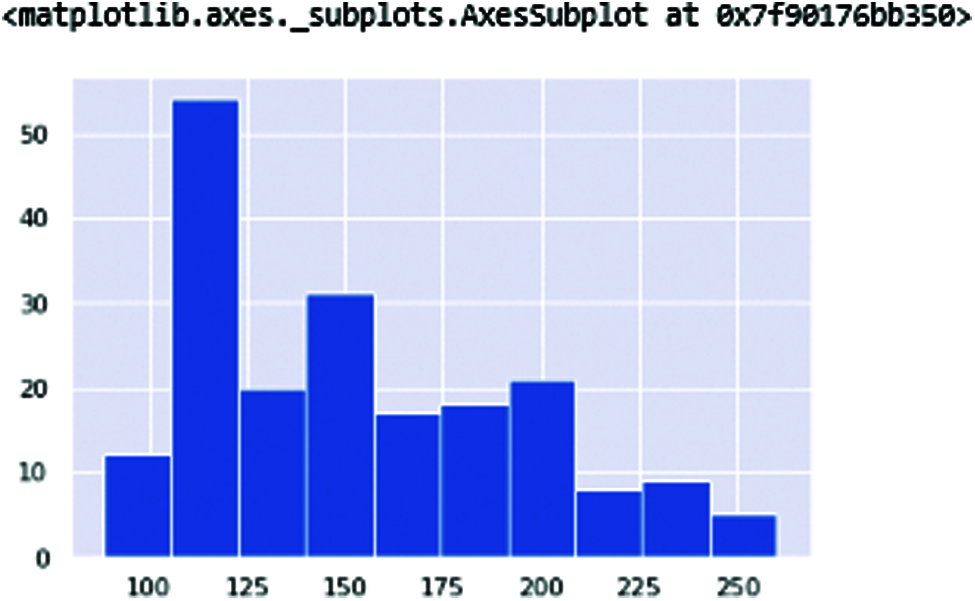
Figure 4: MDVP: Fo(Hz) Average Vocal fundamental frequencies of the human voice
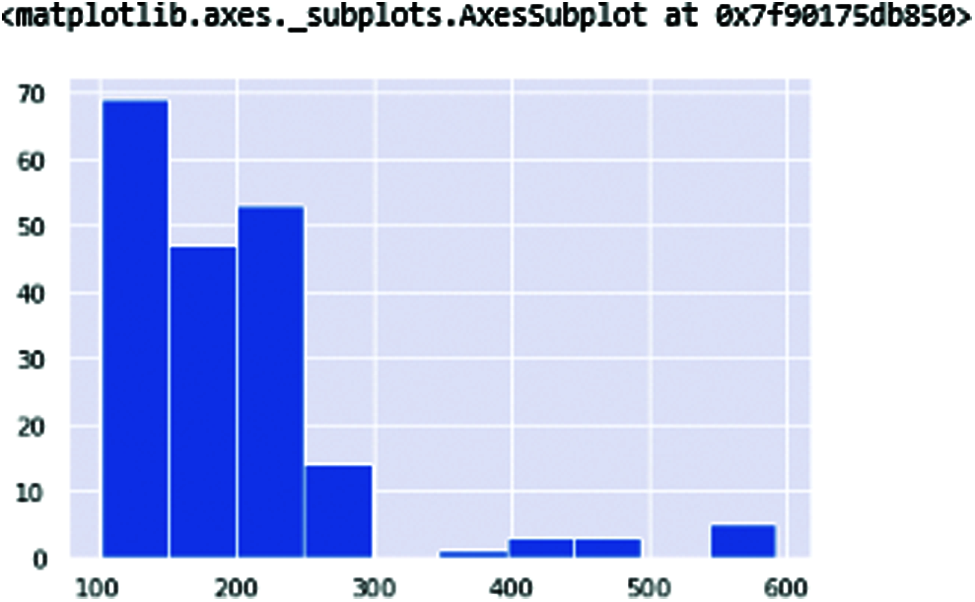
Figure 5: MDVP: Fhi(Hz) in these vocal frequencies
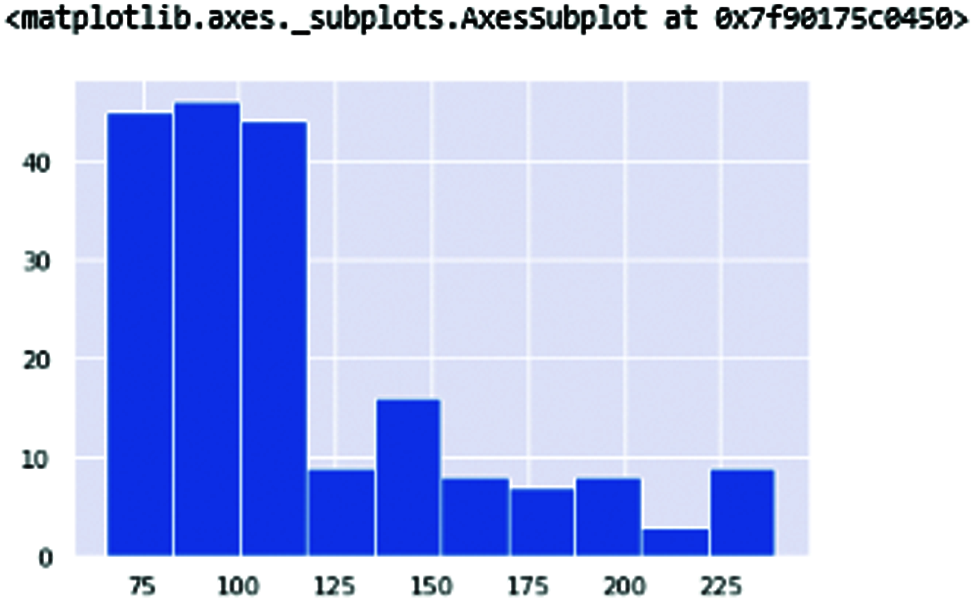
Figure 6: MDVP: Flo(Hz) the minimum vocal fundamentalfrequency of vocal frequencies
The fundamental vocal frequencies are classified to check the patient health status and interpret the frequency. Fig. 7 shows the results of all vocal frequencies. Patient health status in 0 represents a non-Parkinson, whereas 1 is the Parkinson’s patient. The vocal frequencies of non-patient is 0.006, which is considered low compared to the affected patient which highest vocal frequencies range is 0.0010.
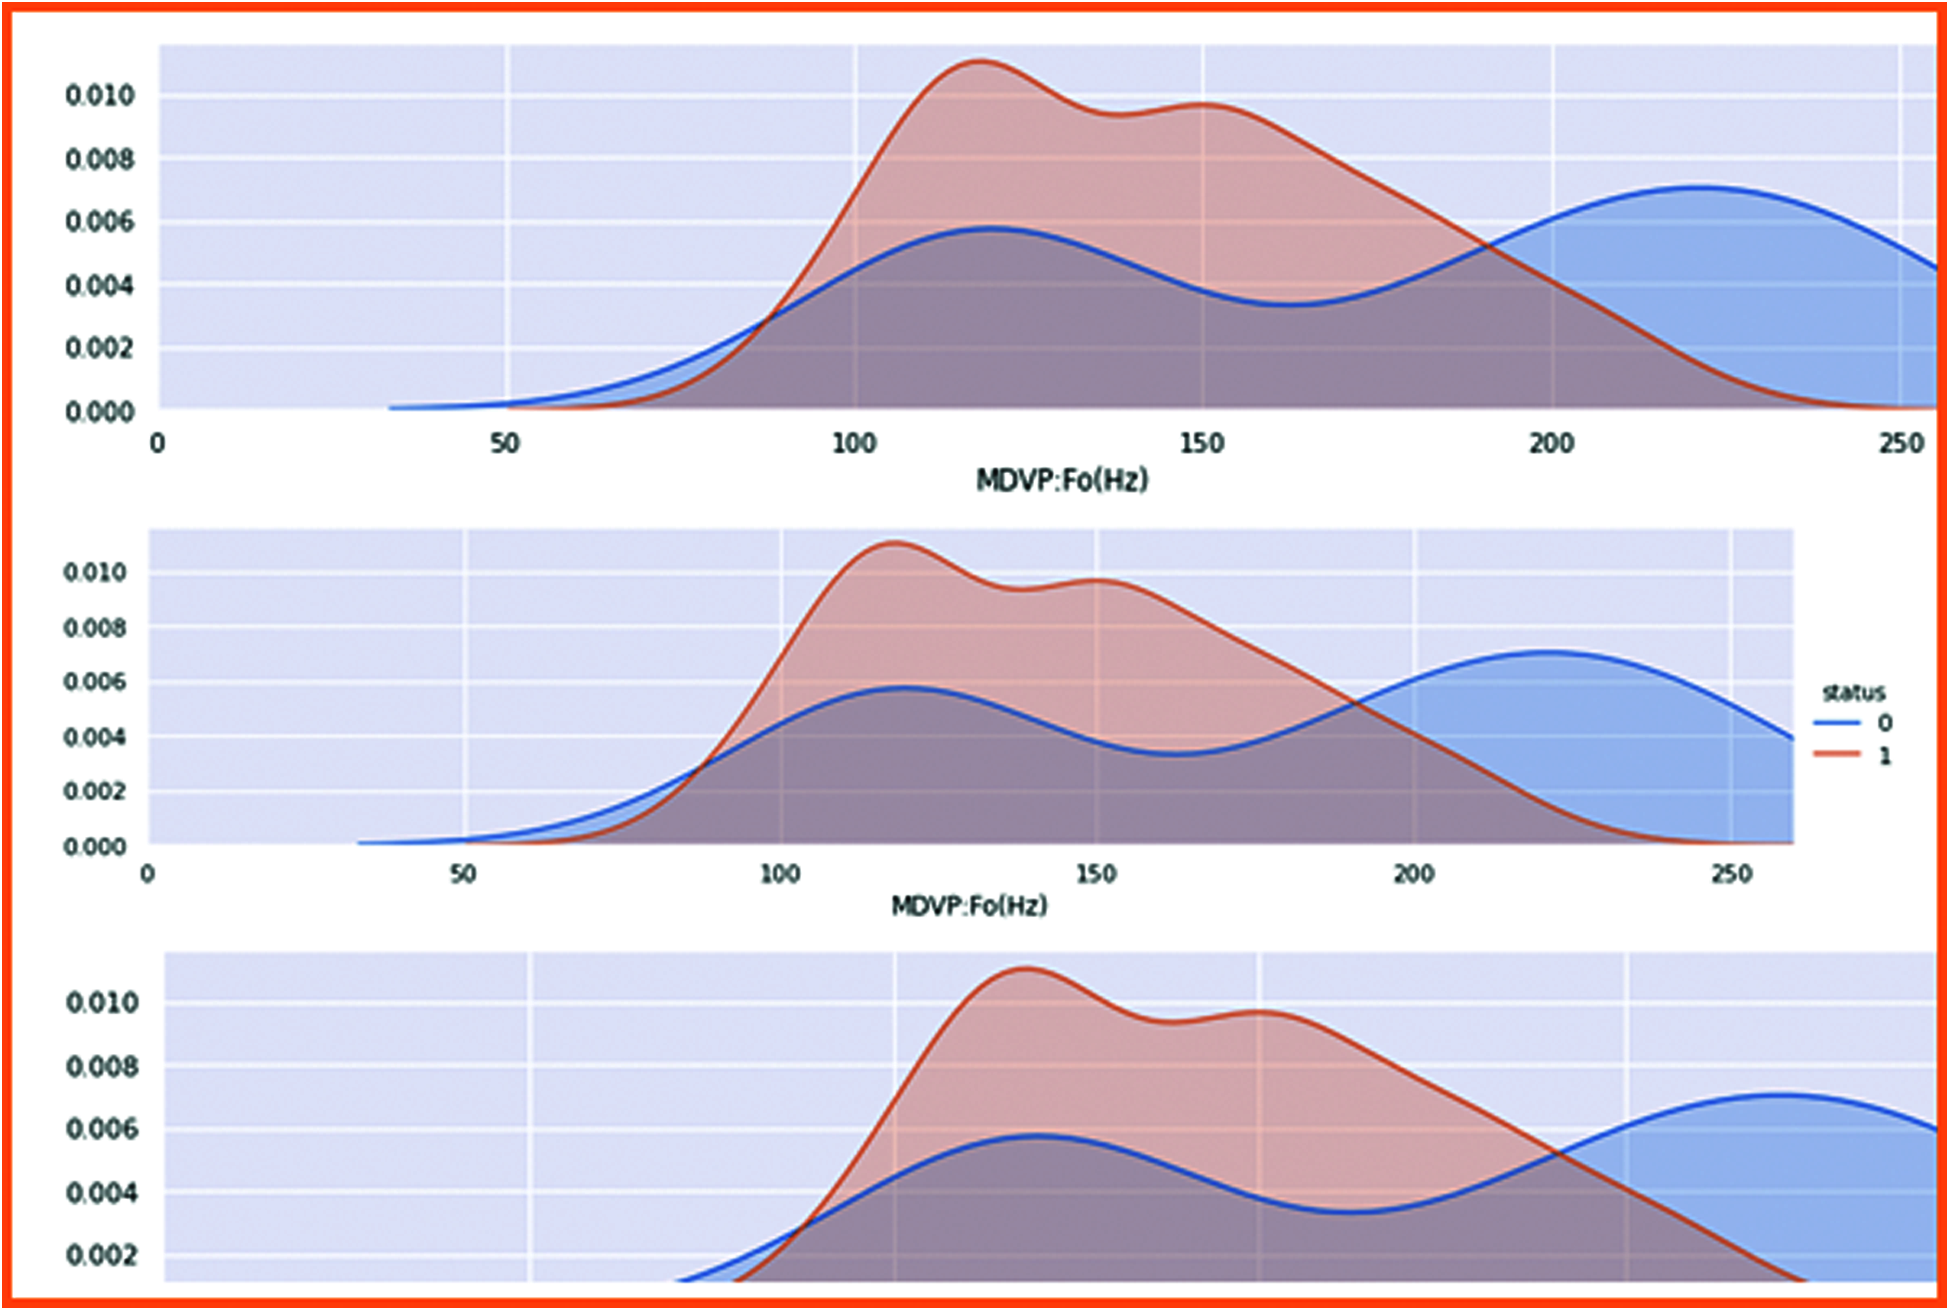
Figure 7: Results of all focal frequencies
4.3 Harmonic Parameter Frequencies
In these frequencies in which harmonic-noise ratio and harmonic noise ratio of two types of frequencies are available Kinematic changes in PD gait are well documented; however, there is less comprehension of upper body dynamics. The rhythm of trunk accelerations is measured by harmonic ratios (HRs) and can be studied in longitudinal, anterior-posterior, and mediolateral planes, providing an indicator of global walking stability (lower HR indicates poorer stability) (see Figs. 8 and 9).
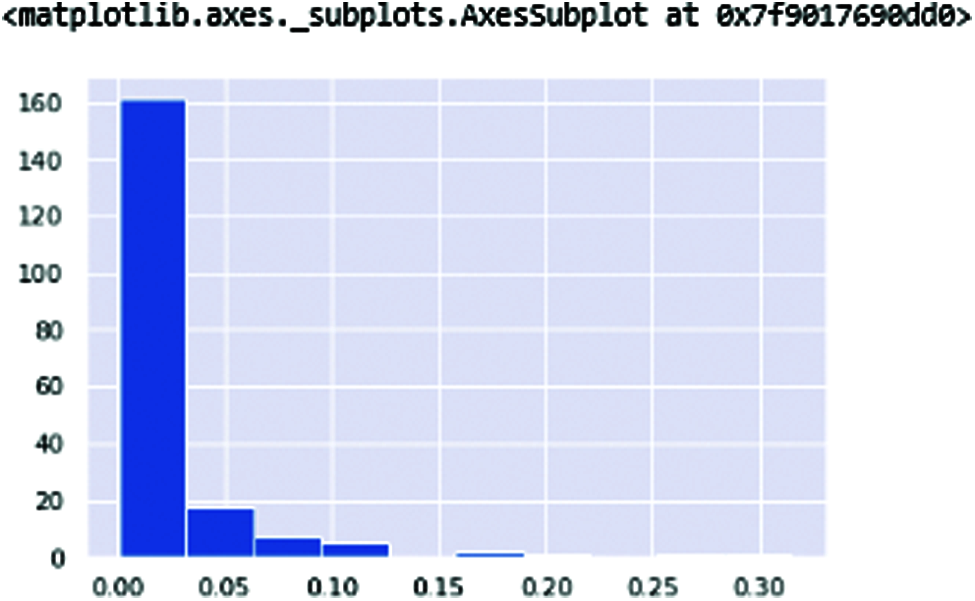
Figure 8: NHR—NHR (Noise Harmonic ratio)
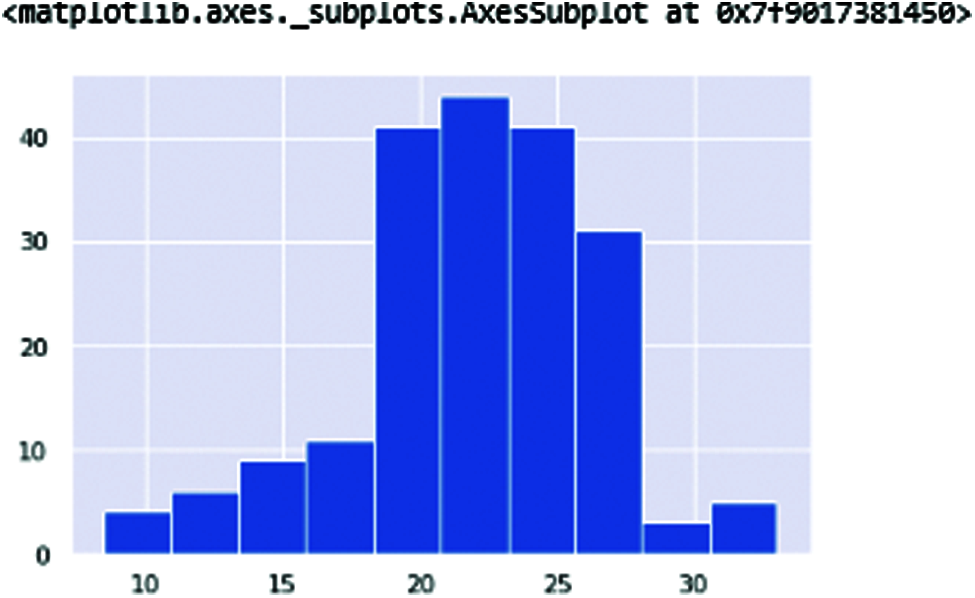
Figure 9: HNR—The HNR (Harmonic-noise ratio)
Now here is the comparison of the harmonic parameter ratio of the human voice. The affected patients and non-affected patients are classified with these two frequencies of ratio. Fig. 10 displays these frequencies ratio. The blue color is healthy person whereas orange color is for patients.
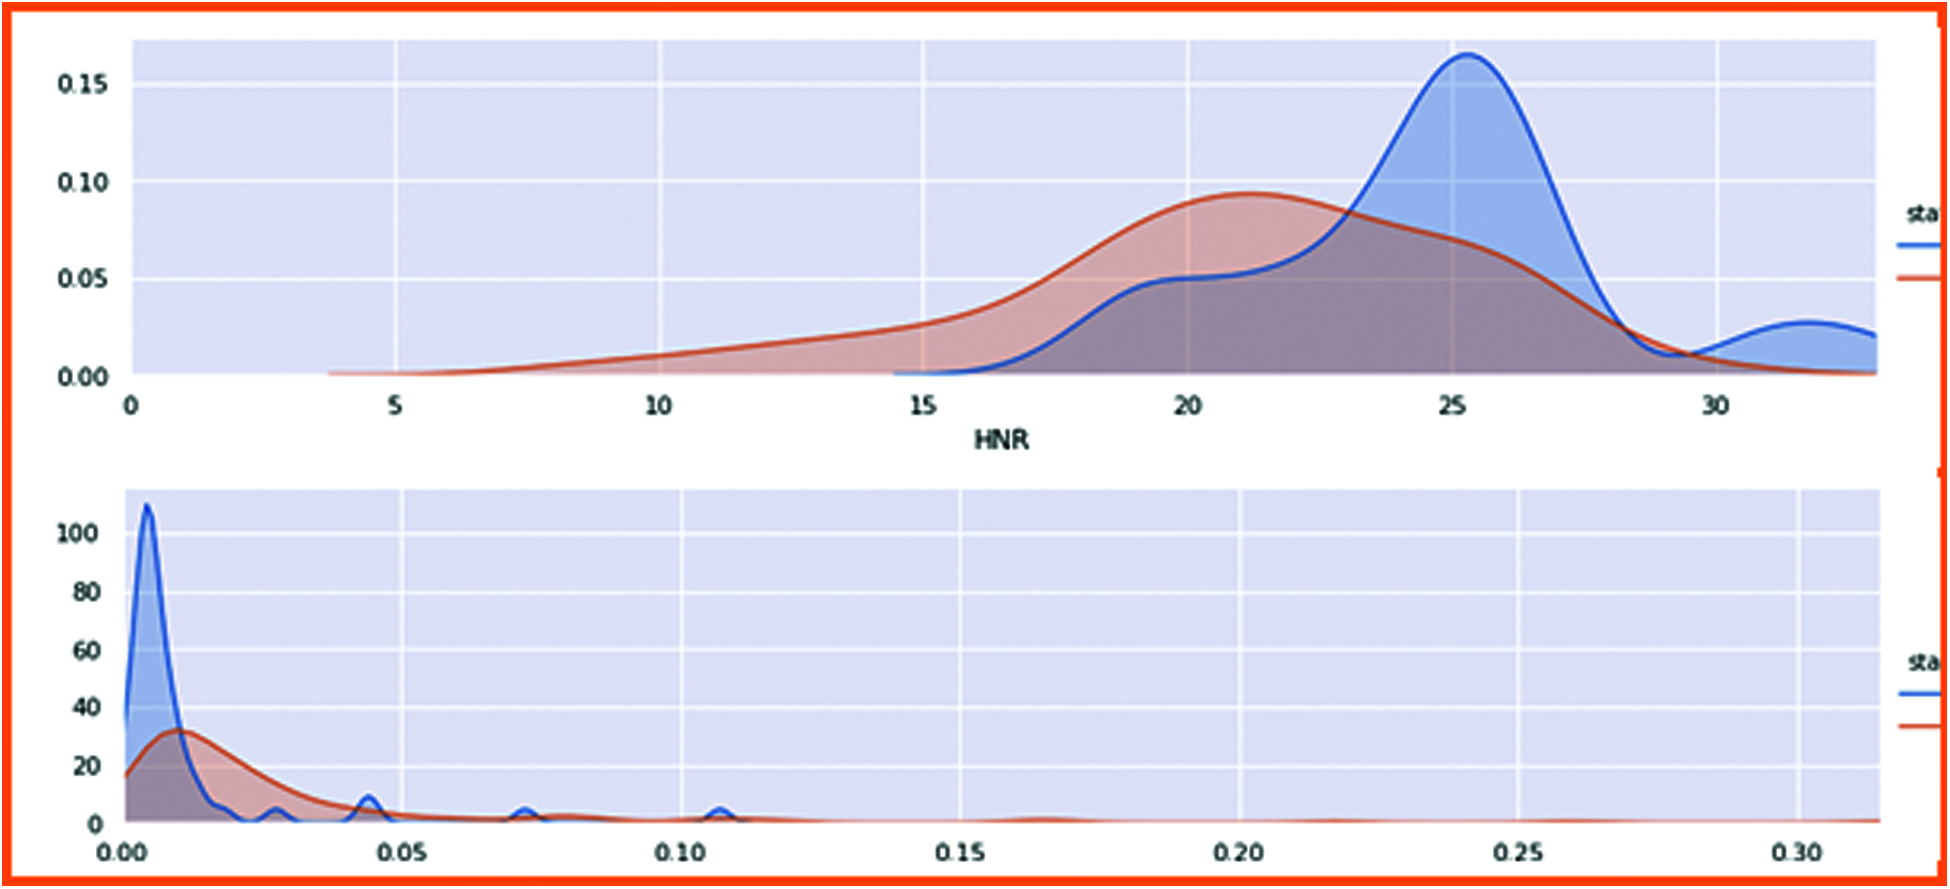
Figure 10: Harmonic parameter ratio with patient health status
The Harmonic ratio of PD was compared with the patient health status, clearly showing 0 is non-patient, and 1 is positively affected with Parkinson’s person. Hence, in the first figure, the Harmonic noise ratio of the non-affected person is high because the non-Parkinson person can quickly speak, and the noise ratio is high, so there is no gap in this voice. In non-patient, the harmonic ratio is low because its speaking ratio is low, creating gaps in the voice. Thus, the ratio goes down in the second figure.
4.4 Non-linear Dynamic Complexity Measure
DFA (Detrended fluctuation analysis) (shown in Fig. 11) and PPE (pitch period of entropy) (shown in Fig. 12) show the Parkinson’s effect on the human voice. The frequencies are break down because of the slow speaking flow of the human and sibling in the voice when speaking.
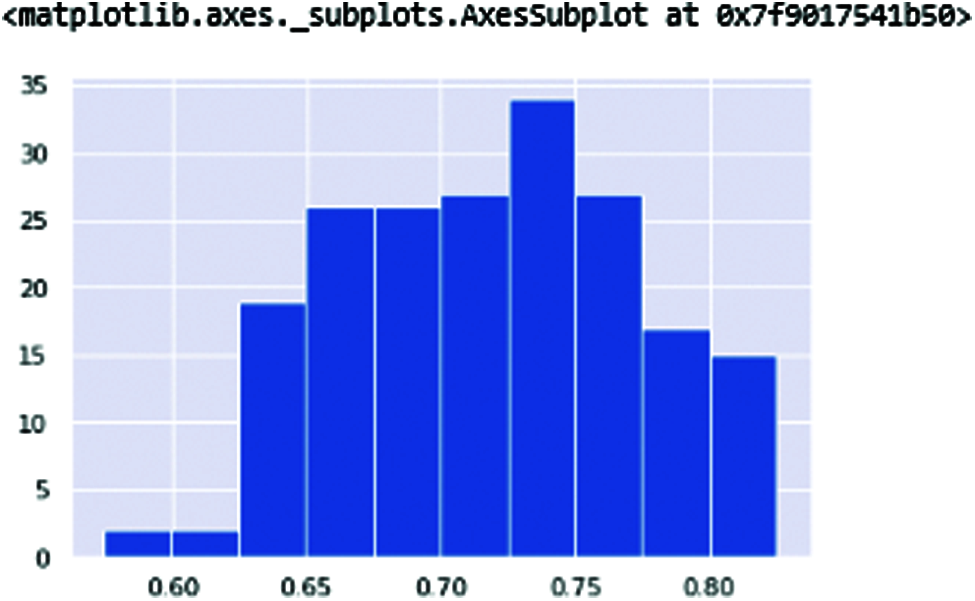
Figure 11: DFA
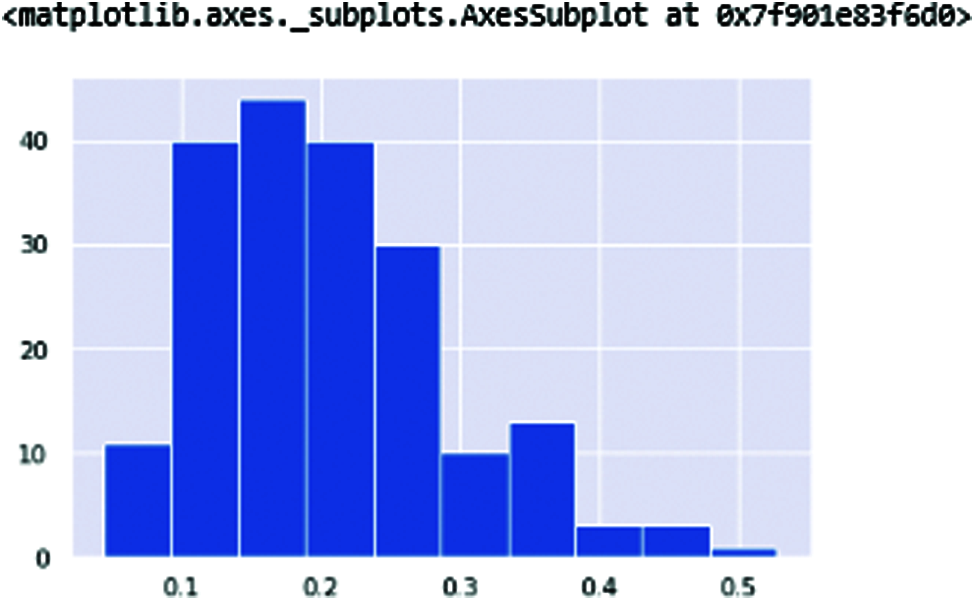
Figure 12: PPE
Fig. 13 shows the results representing the human voice signal. The first chart is DFA in which 0 is non-affected patients. The voice is higher than the affected patient of Parkinson’s disease.
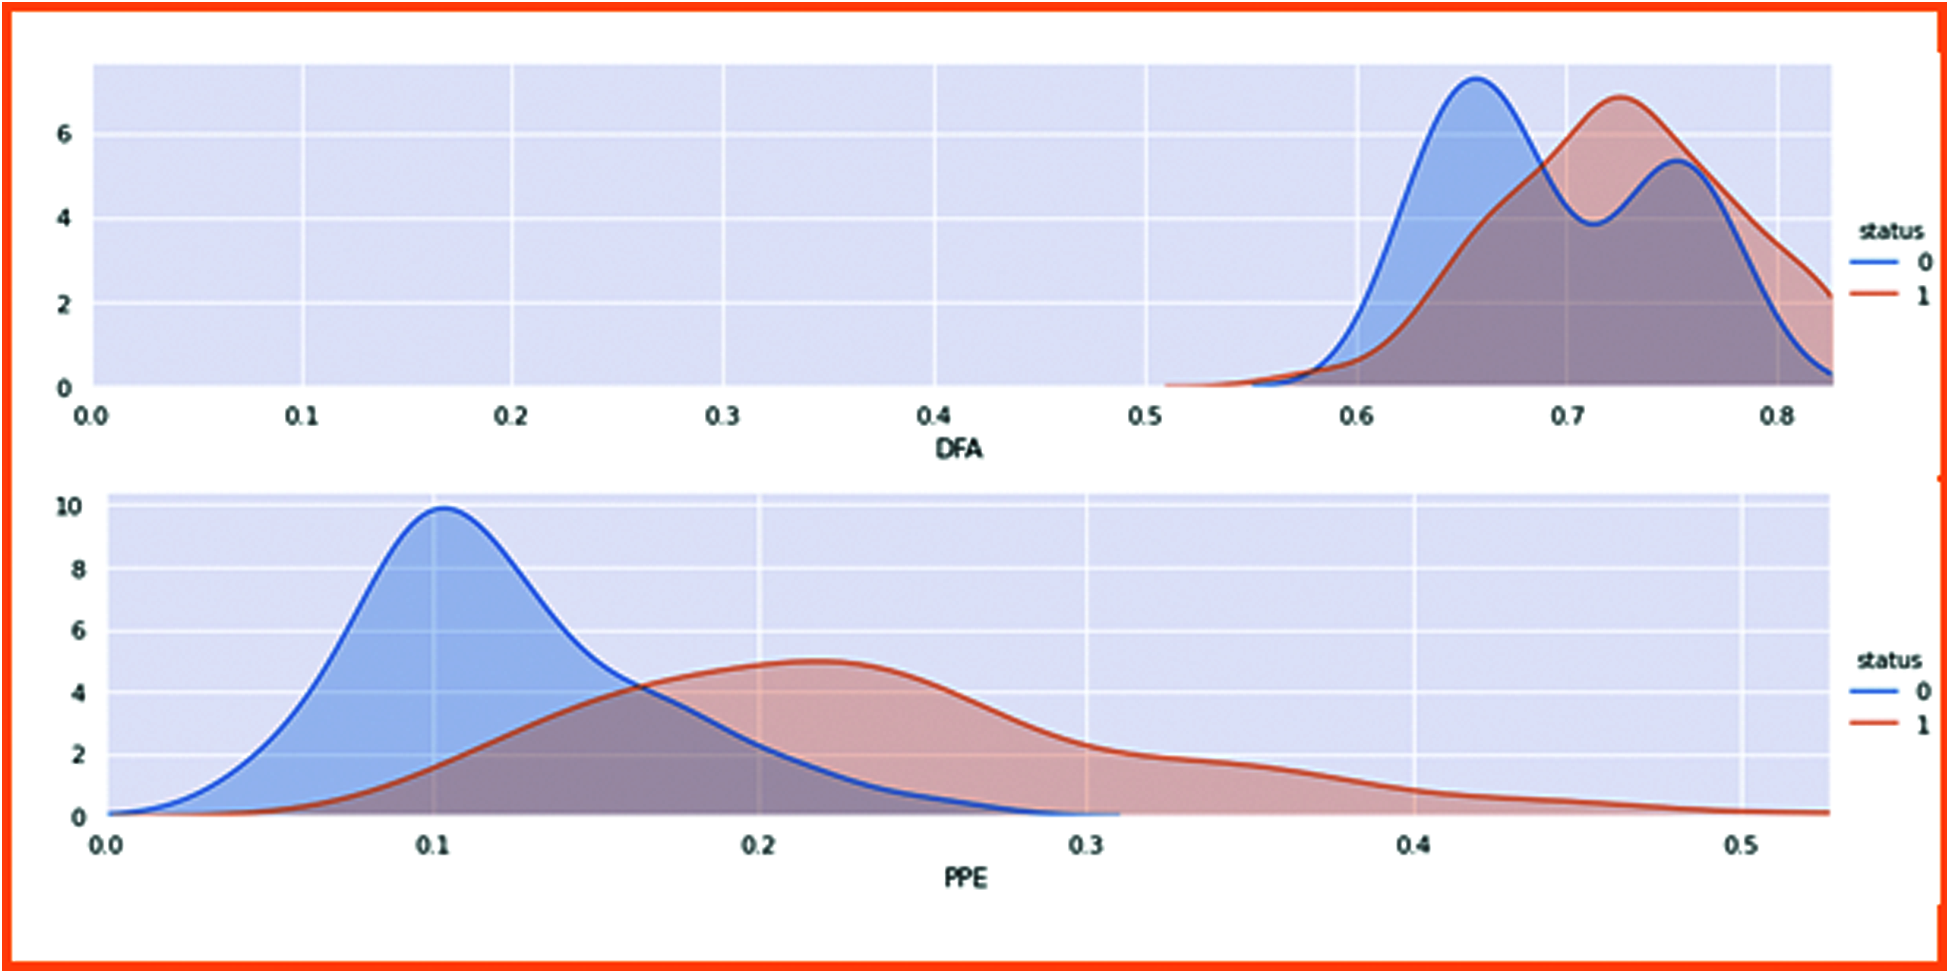
Figure 13: Classified the non-linear dynamical complexity measure with patient health
4.5 Classification of PD with ML Classifier
In this process, we are going to classify Parkinson’s disease with a machine learning classifier. First, we set the target of patient health status and count how many patients are available in this report. After checking the patient’s health status, we visualize the results graphically. The dataset was split into 80% for the training phase whereas 20% for the testing phase. In Fig. 14, 0 represents the healthy people who are 48 in the dataset, whereas 1 represents the patients who are 147 in the dataset.
▪ Number of Parkinson people in the dataset 147 (75.39%)
▪ Number of Healthy people in the dataset 48 (24.61%)
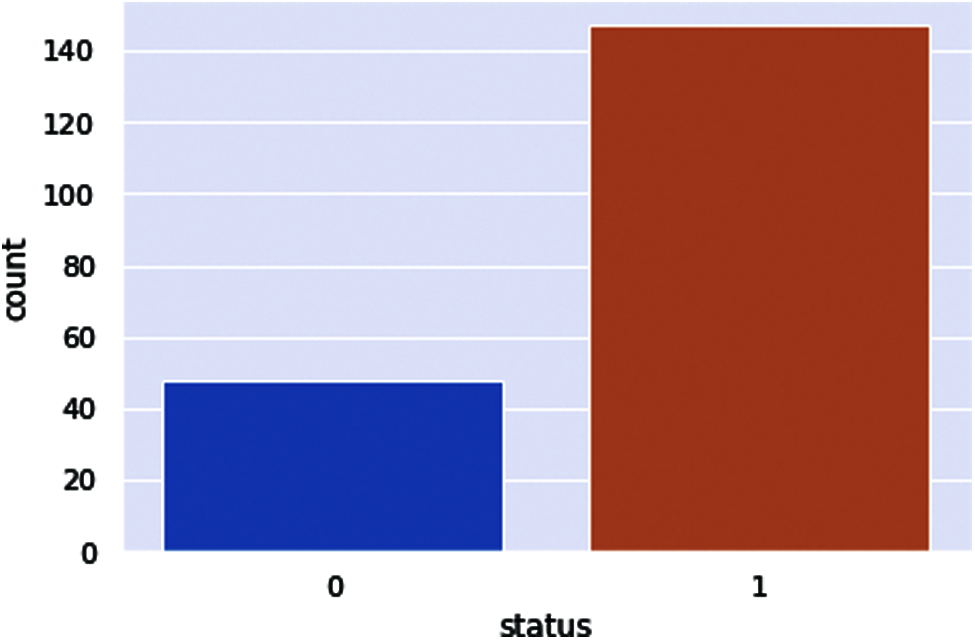
Figure 14: PD patient health status
The machine learning classifiers were implemented. First, we set the target variable, which is a Parkinson’s patient health status. After setting up the target, we transform the dataset columns extracted from the dataset to take as input. After setting up the input variables of the dataset, we standardize the dataset columns and transform the dataset with Min and Max Scalar to use in our codes.
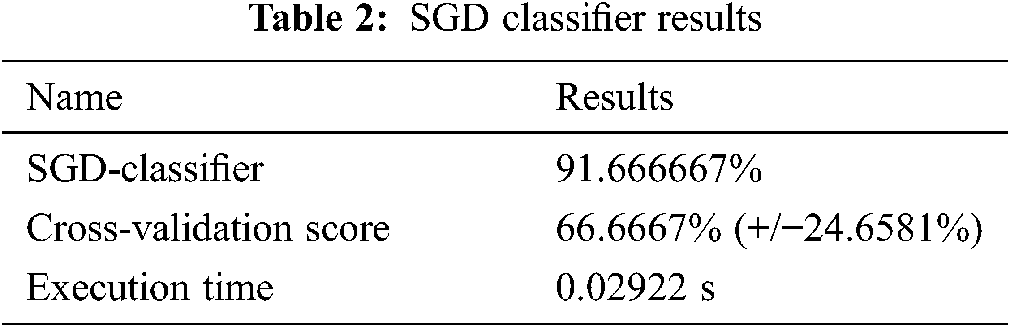
The Scikit-learn algorithm provides the SGD-Classifier module for the implementation of the SGD classification. The results are shown in Tab. 2.
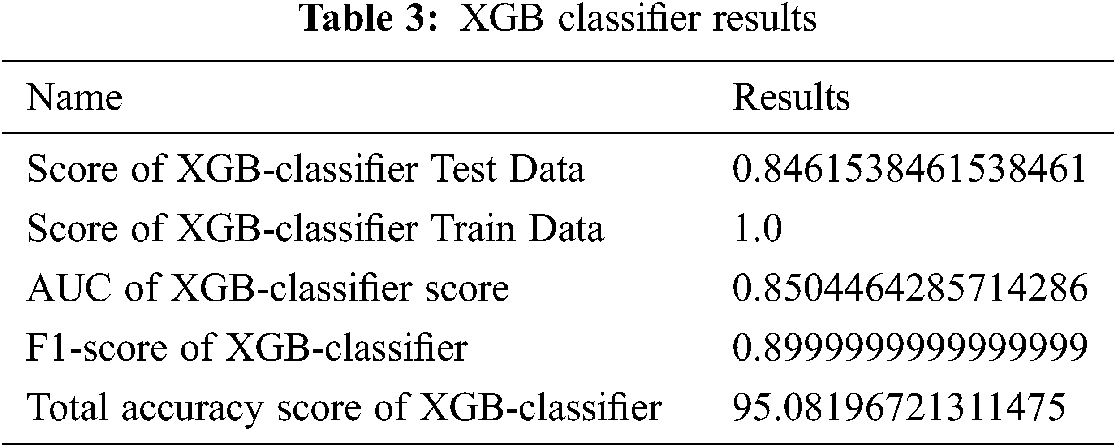
XGB-classifier prediction results are shown in Fig. 15.
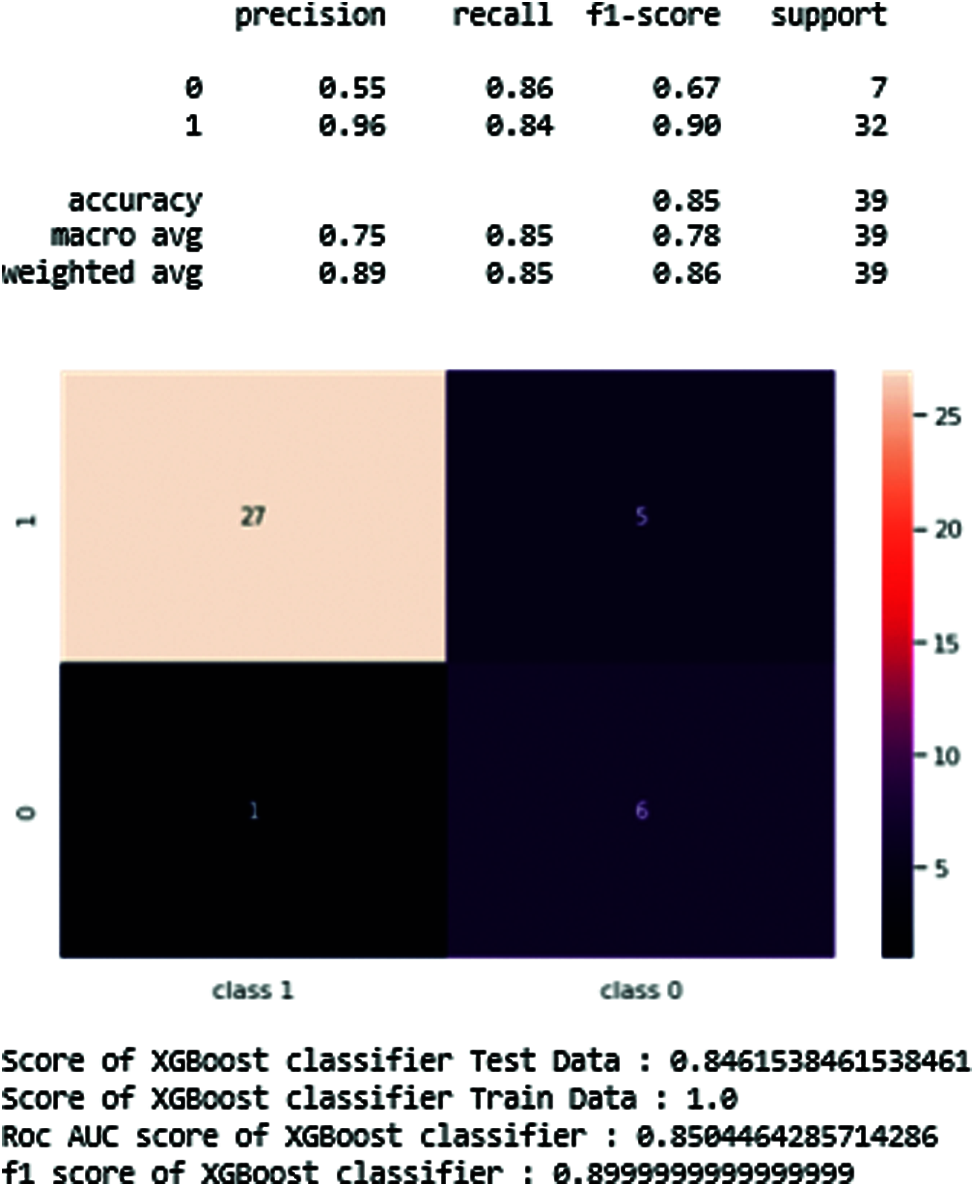
Figure 15: XGB-Classifier results in prediction tables
Fig. 15 and Tab. 3 show the best results of the XGB-classifier producing the precision, recall, F1-score, support, accuracy score. The results show that the testing score is 0.84 and the train score is 1.0.
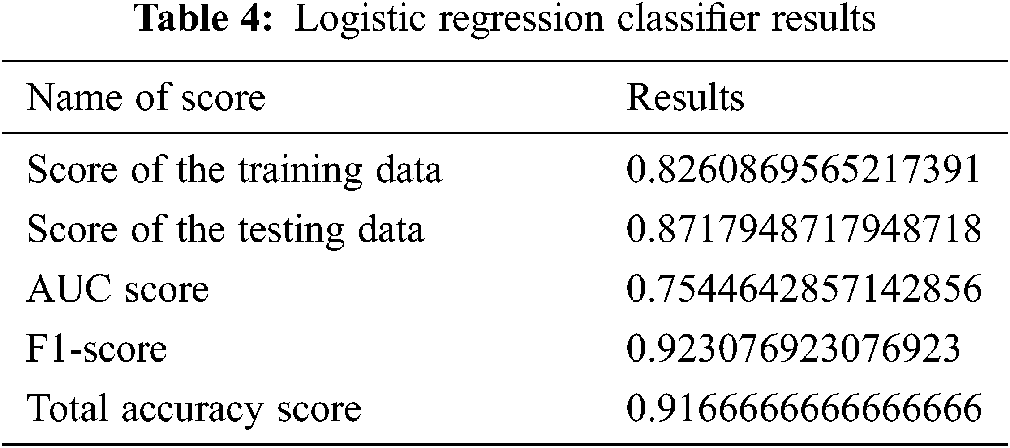
4.6.3 Logistic Regression Classifier
Fig. 16 and Tab. 4 show the results of the logistic regression classifier.
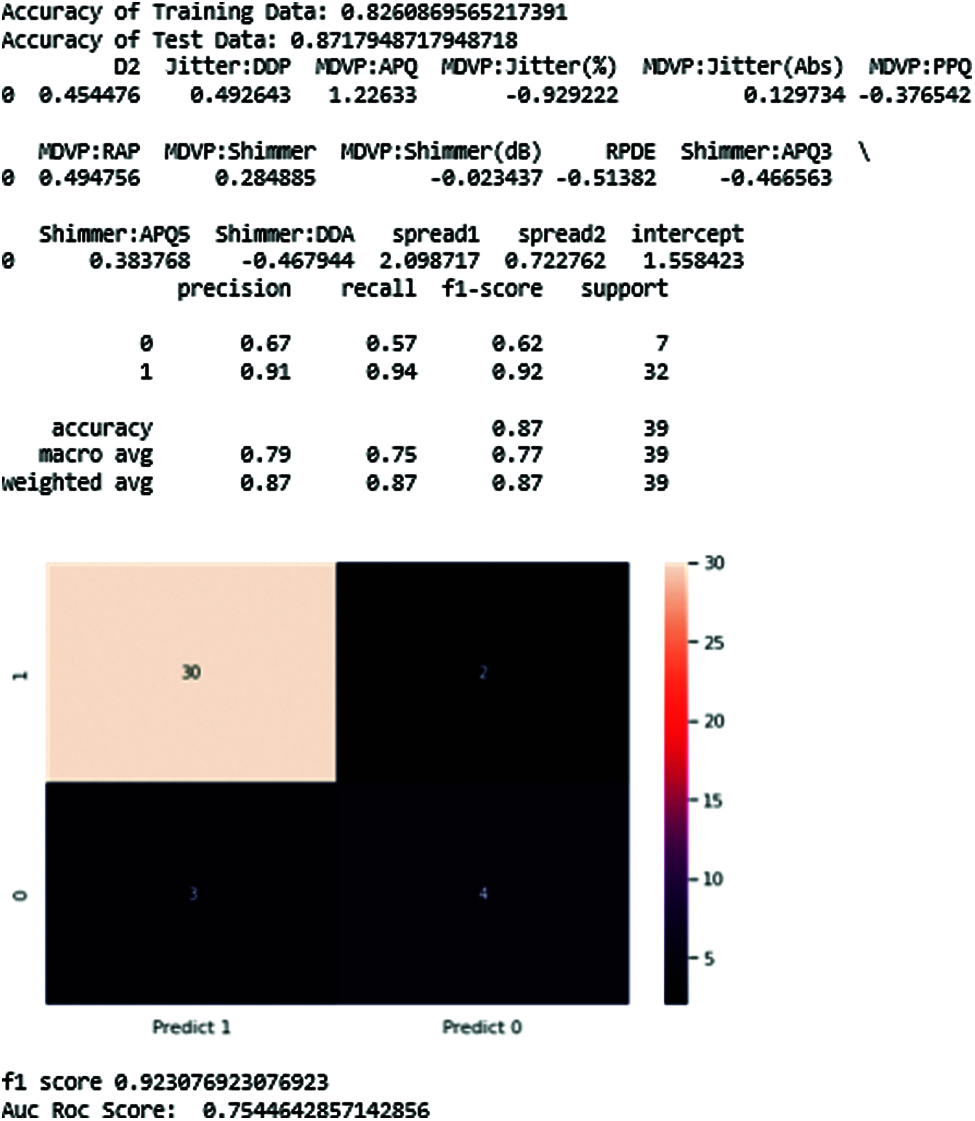
Figure 16: Logistic regression-classifier results
4.6.4 Random Forest Classifier
The results of Random forest are shown below (see Fig. 17).
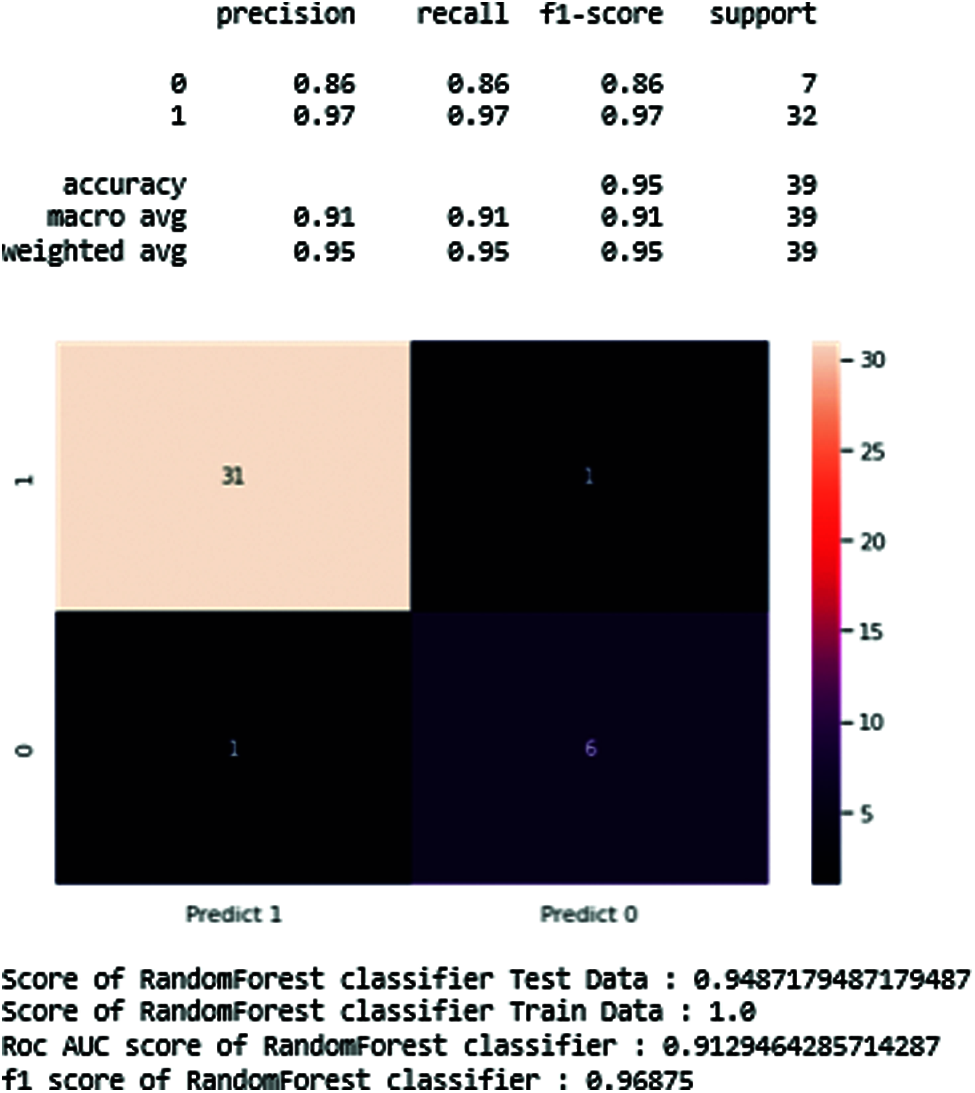
Figure 17: Resulting diagram of random forest classifier
Tab. 5 shows the maximum precision score those get and recall, support in the middle of the predicted classes of the Parkinson disease which produces the training data score is 0.94 and testing score is 1.0, AUC score of 0.91, and F1-score is 0.96. In the end, we generate the total accuracy score of the classifier, as shown in Tab. 5.
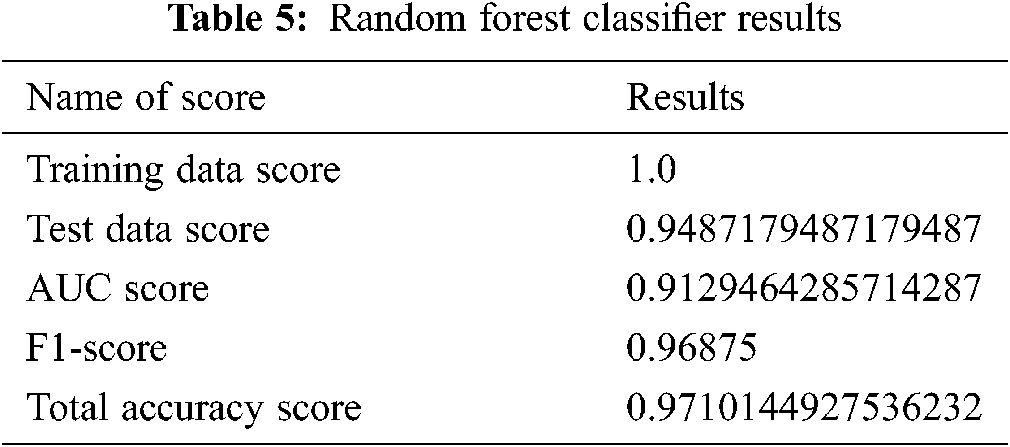
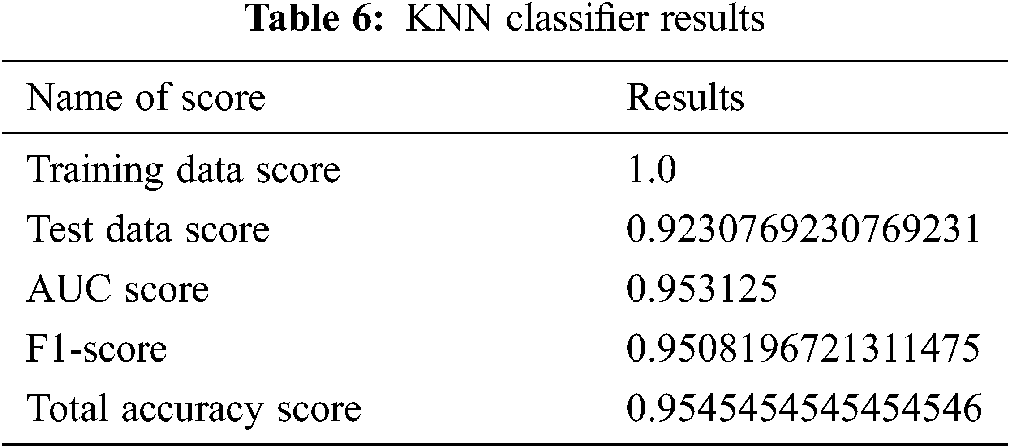
Fig. 18 shows the line chart of the KNN classifier. This classifier reaches the range of 95%.
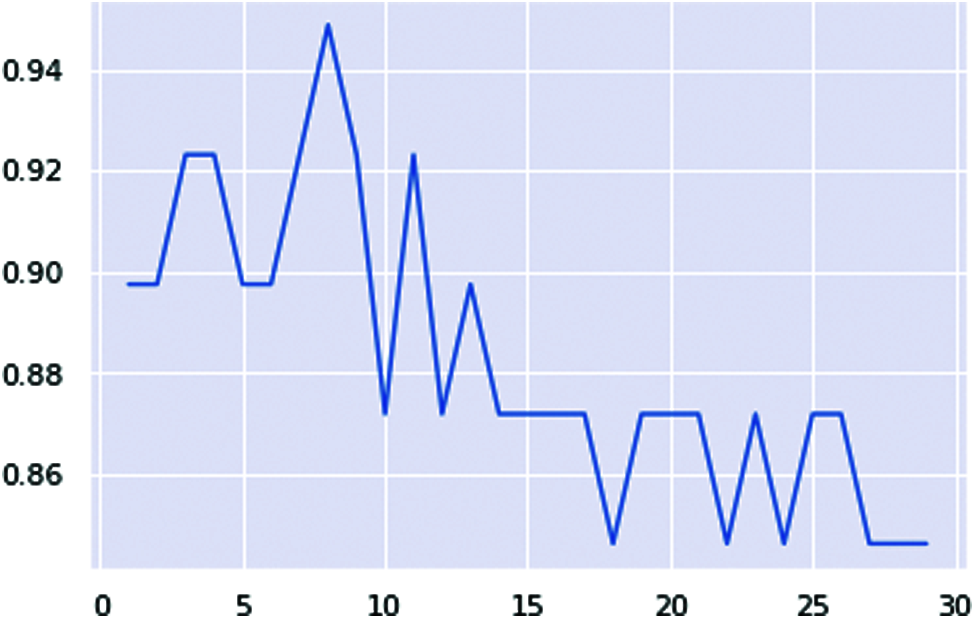
Figure 18: KNN classifier ranges lines chart
Fig. 19 shows the confusion matrix of the KNN classifier, which generates the precision, recall, and shows the best accuracy score of the test data.
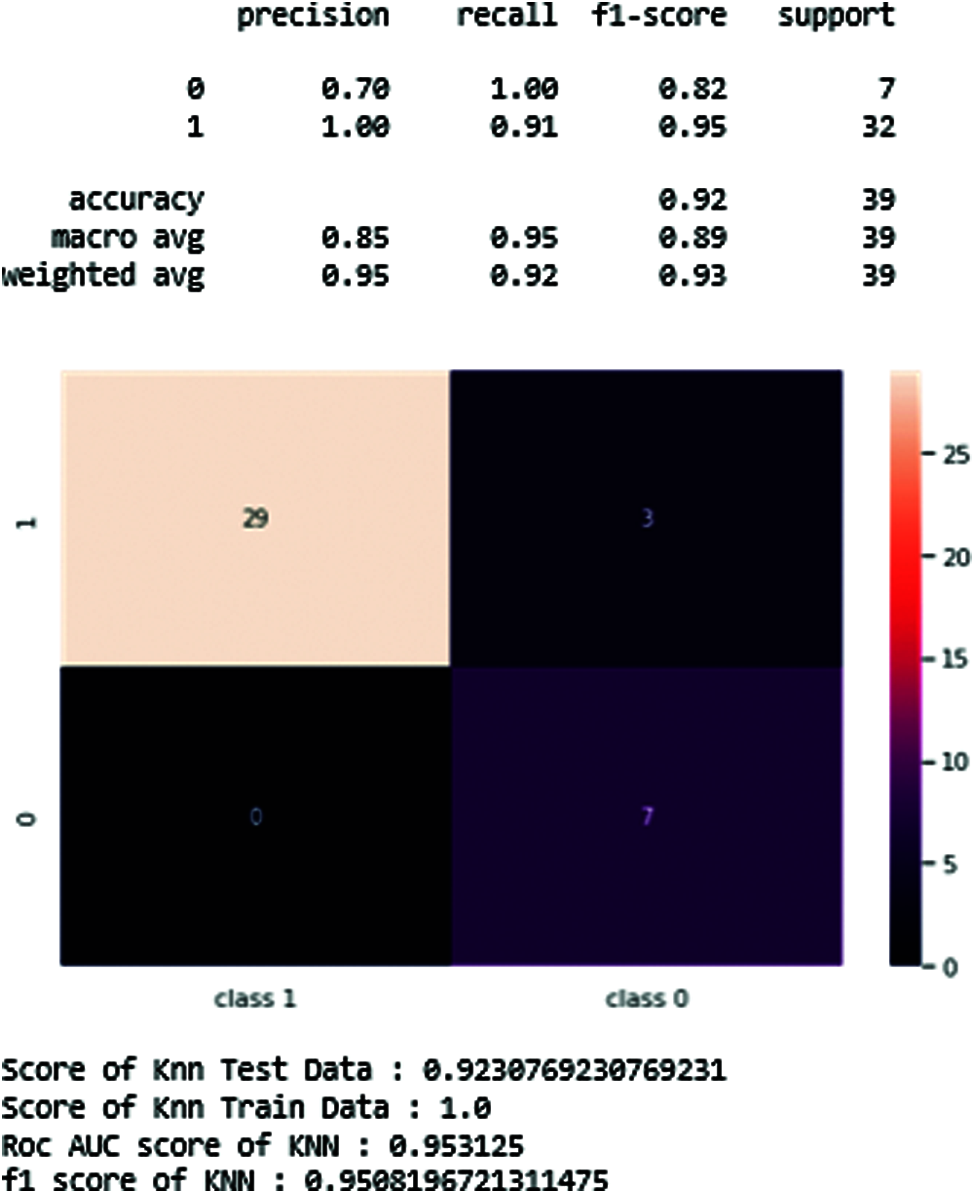
Figure 19: KNN-classifier of resulting figure and scores
The resulting scores are also arranged in Tab. 6.
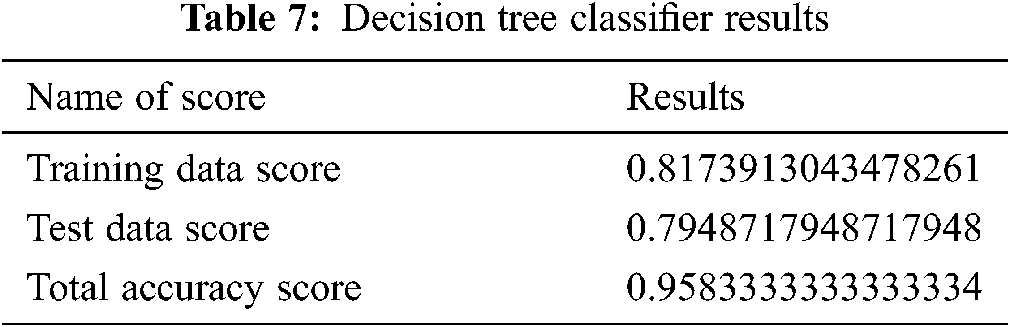
4.6.6 Decision Tree Classifier
In this classifier, we generate the decision tree classifier’s training and testing score to reduce the feature of the dataset. The results are shown in Tab. 7.
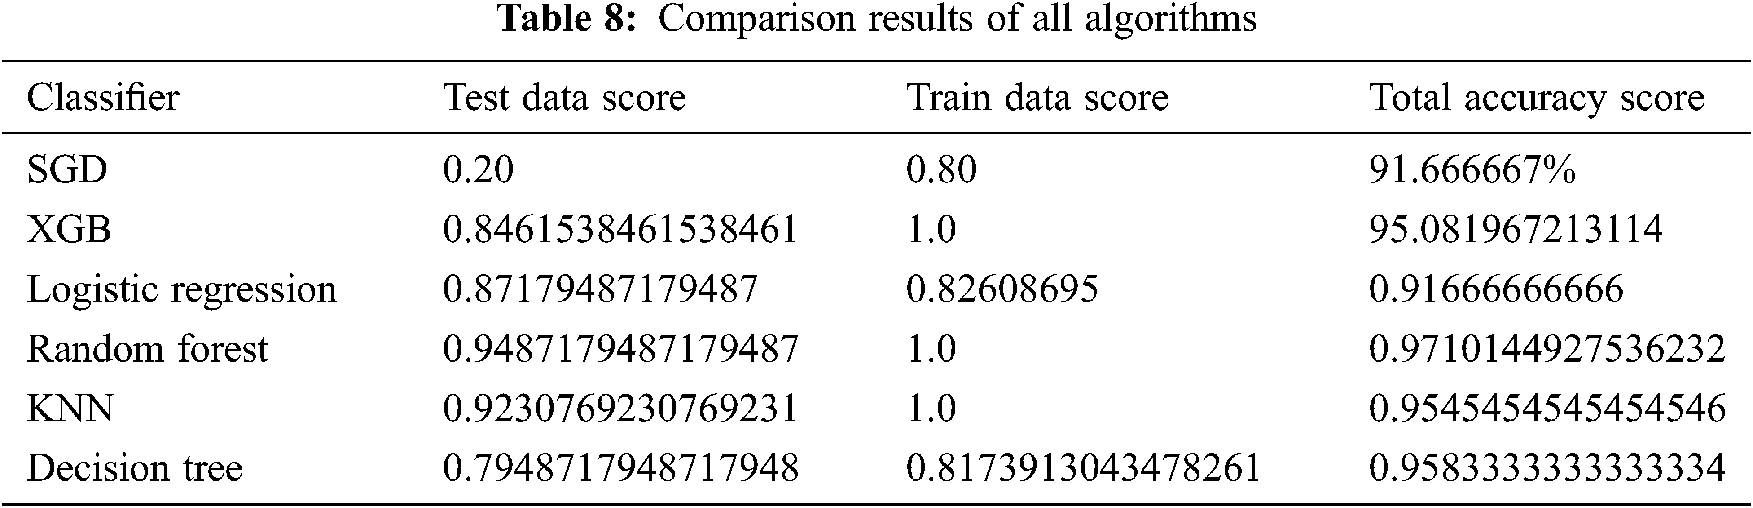
4.7 Comparison of the ML Classifiers
The comparison results between the different algorithms studied in this paper are shown in Tab. 8. Moreover, Fig. 20 clearly shows all classifiers of the result graphically. The results show that random forest outperforms other classifiers with a 97% accuracy score.
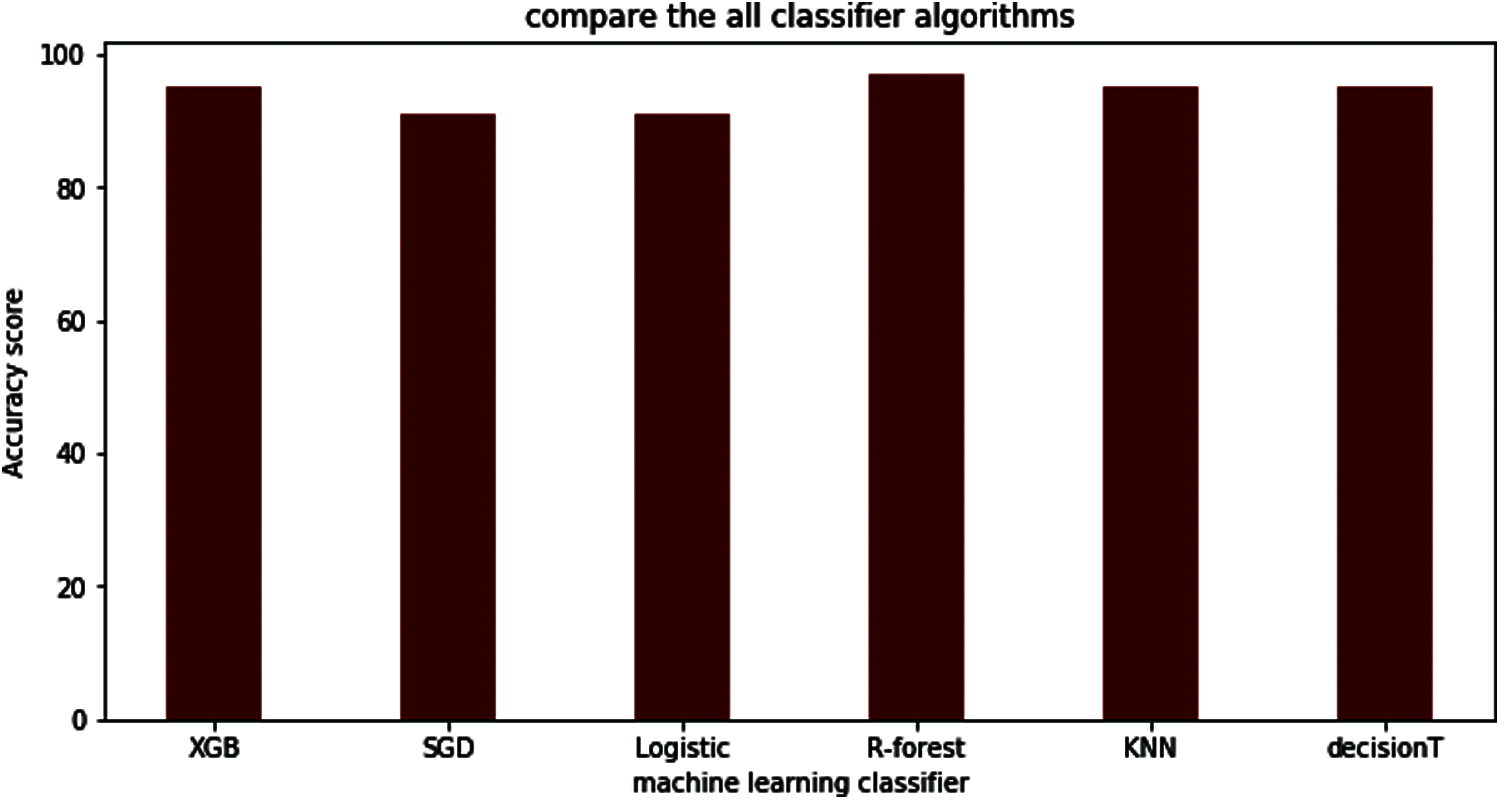
Figure 20: Comparison between all the machine learning classifiers
Parkinson’s disease diagnosis is challenging to manage daily. Thus, an effective screening process will be helpful, especially for cases that do not require a visit to a clinic. Symptoms like vocal characteristics, voice recording, speech, and slow movement are valuable and non-invasive diagnostic tools. This paper used machine learning algorithms to diagnose the disease through the patient’s voice patient. This is a practical step to check before meeting with a clinician. A dataset of voices was used as an input to several machine learning models. The results show that the random forest classifier performs with high accuracy. In future work, more datasets of PD patients can be used in order to measure the accuracy of the random forest if the new data was added.
Funding Statement: This work was supported by Taif University Researchers Supporting Project (TURSP) under number (TURSP-2020/73, Taif University, Taif, Saudi Arabia, and by the Data Science Research Program, Riphah International University, Lahore, Pakistan.
Conflicts of Interest: The authors declare that they have no conflict of interest to report regarding the present study.
1. Y. Mittra and V. Rustagi, “Classification of subjects with parkinson’s disease using gait data analysis,” in Proc. ICACE, Greater Noida, India, pp. 84–89, 2018. [Google Scholar]
2. H. Ozkan, “A comparison of classification methods for telediagnosis of Parkinson’s disease,” Entropy, vol. 18, no. 4, pp. 115, 2016. [Google Scholar]
3. E. Rastegari, S. Azizian and H. Ali, “Machine learning and similarity network approaches to support automatic classification of Parkinson’s diseases using accelerometer-based gait analysis,” in Proc. HICSS, Honolulu, Hawaii, USA, pp. 4231–4242, 2019. [Google Scholar]
4. D. Weintraub, C. L. Comella and S. Horn, “Parkinson’s disease--Part 1: Pathophysiology, symptoms, burden, diagnosis, and assessment,” the American Journal of Management Care, vol. 14, no. 2, Suppl, pp. S40–S48, 2008. [Google Scholar]
5. C. Salvatore, I. Castiglioni, F. Gallivanone, A. Augimeri, M. Lopez et al., “Machine learning on brain MRI data for differential diagnosis of Parkinson’s disease and progressive supranuclear palsy,” Journal of Neuroscience Methods, vol. 222, no. 1, pp. 230–237, 2014. [Google Scholar]
6. N. Tahir and H. Manap, “Parkinson disease gait classification based on machine learning approach,” Journal of Applied Sciences, vol. 12, no. 2, pp. 180–185, 2012. [Google Scholar]
7. D. Weintraub, C. L. Comella and S. Horn, “Parkinson’s disease--Part 1: Pathophysiology, symptoms, burden, diagnosis, and assessment,” The American Journal of Management Care, vol. 14, no. 2, Suppl, pp. S40–S48, 2008. [Google Scholar]
8. S. Rewar, “A systematic review on Parkinson’s disease (PD),” Indian Journal of Research in Pharmacy and Biotechnology, vol. 3, no. 2, pp. 176, 2015. [Google Scholar]
9. S. Arora, V. Venkataraman, A. Zhan, S. Donohue, K. M. Biglan et al., “Detecting and monitoring the symptoms of Parkinson’s disease using smartphones: A pilot study,” Parkinsonism and Related Disorders, vol. 21, no. 6, pp. 650–653, 2015. [Google Scholar]
10. D. Miljkovic, D. Aleksovski, V. Podpečan, N. Lavrač, B. Malle et al., “Machine learning and data mining methods for managing Parkinson’s disease,” in Machine Learning for Health Informatics, Springer, Cham, Switzerland, pp. 209–222, 2016. [Google Scholar]
11. K. N. R. Challa, V. S. Pagolu, G. Panda and B. Majhi, “An improved approach for prediction of Parkinson’s disease using machine learning techniques,” in Proc. SCOPES, Paralakhemundi, India, pp. 1446–1451, 2016. [Google Scholar]
12. G. S. Lee and S. H. Lin, “Changes of rhythm of vocal fundamental frequency in sensorineural hearing loss and in Parkinson’s disease,” Chinese Journal of Physiology, vol. 52, no. 6, pp. 446–450, 2009. [Google Scholar]
13. B. Lagrue, P. Mignard, F. Viallet and R. Gantcheva, “Voice and Parkinson disease: A study of pitch, tonal range and fundamental frequency variations,” in Proc. ICPhS, San Francisco, USA, pp. 1811–1814, 1999. [Google Scholar]
14. S. Grover, S. Bhartia, A. Yadav and K. R. Seeja, “Predicting severity of Parkinson’s disease using deep learning,” Procedia Computer Science, vol. 132, no. 1, pp. 1788–1794, 2018. [Google Scholar]
15. M. A. Little, P. E. McSharry, S. J. Roberts, D. A. E. Costello and I. M. Moroz, “Exploiting nonlinear recurrence and fractal scaling properties for voice disorder detection,” BioMedical Engineering OnLine, vol. 6, no. 23, pp. 1–19, 2007. [Google Scholar]
16. D. Joshi, A. Khajuria and P. Joshi, “An automatic non-invasive method for Parkinson’s disease classification,” Computer Methods and Programs in Biomedicine, vol. 145, no. 1, pp. 135–145, 2017. [Google Scholar]
 | This work is licensed under a Creative Commons Attribution 4.0 International License, which permits unrestricted use, distribution, and reproduction in any medium, provided the original work is properly cited. |